Article

Intrinsic Mode-Based Network Approach to Examining Multiscale Characteristics of Sea Surface Temperature Variability

1
Kyungpook Institute of Oceanography, Kyungpook National University, Daegu 41566, Republic of Korea
2
School of Earth System Sciences, Kyungpook National University, Daegu 41566, Republic of Korea
*
Author to whom correspondence should be addressed.
Appl. Sci. 2024, 14(5), 1752; https://doi.org/10.3390/app14051752
Submission received: 15 January 2024 / Revised: 19 February 2024 / Accepted: 19 February 2024 / Published: 21 February 2024

Abstract

:
Variability of sea surface temperature (SST), characterized by various spatiotemporal scales, is a proxy of climate change. A network analysis combined with empirical mode decomposition is newly presented for examining scale-dependent spatial patterns of SST variability. Our approach is applied to SST anomaly variability in the East/Japan Sea (EJS), consisting of satellite-derived daily datasets of 0.25° × 0.25° resolution from 1981 to 2023. Through the spatial distribution of instantaneous energy in intrinsic modes and features of intrinsic-mode networks, scale-dependent spatiotemporal features are found. The season-specific spatial pattern of energy density is observed only for weekly to semiannual modes, while a persistent high-energy distribution in the tongue-shaped region from East Korea Bay (EKB) to the Sub-Polar Front (SPF) is observed only for annual-to-decadal modes. The seasonality is apparent in the time evolution of energy only for weekly-to-annual modes, with a peak in summer and an increasing trend since the 2010s. Hubs of intrinsic-mode networks are observed in the whole southern area (some northern part) of EJS during the summer (winter), only for monthly to semiannual modes. Regional communities are observed only for weekly to seasonal modes, while there is an inter-basin community with annual-to-biennial modes, incorporating two pathways of East Sea Intermediate Water (ESIW).

1. Introduction

The climate system relies significantly on oceans due to their tremendous heat-storage capacity, compared to the atmosphere. The thermal inertia of oceans is actively transferred to the atmosphere through turbulent and radiative energy exchange at the sea surface [1]. Sea surface temperature (SST), as a singular oceanic parameter, serves as a proxy for these energy fluxes and plays a key role in the regulation of climate and its variability [1]. SSTs are influenced by intricate combinations of atmospheric and oceanic processes, incorporating various dominant factors such as winds and air temperature in the atmosphere as well as thermal advection by surface currents and vertical mixing in the ocean. These factors, either solely or in an interlaced manner, affect SST variability.
The East/Japan Sea (EJS) is a semi-enclosed marginal sea, well known as a miniature ocean (Figure 1). According to previous studies [2,3,4,5], the timescale of SST variability in the EJS ranges from annual to multidecadal scales. For interannual-to-decadal timescales, local air–sea interactions and East Asian monsoon variability have been suggested as key factors in generating the long-term SST variations [4,6]. Hirose and Ostrovskii [7] reported the oscillations of atmospheric, oceanographic, and hydro-chemical features on quasi-biennial scales, and an El Niño-Southern Oscillation (ENSO) with a time scale of 3~7 years has been confirmed in various studies [3,8,9,10]. There have also been longer temporal scale features ranging from decadal [11] to inter-decadal timescales [3,4,12]. There have been reports on oscillatory features of SST variability in the EJS with smaller time scales, such as, intra-annual through interannual time scales [2,13], and semi-annual through annual time scales [2]. Further, some oscillations, nearly equal to and shorter than half a year, were also reported [14].
The wide-range scales observed in EJS SST variability are mainly due to many forcing factors, which have different spatiotemporal scales and include the monsoon, extratropical air–sea interactions, transportation variability of the TWC, and remote forcing [16]. As for the seasonal variability, there were several studies supporting the critical role of atmospheric forcing relating to the surface wind [17,18,19,20]. Especially, a northwesterly wind starting from the orographic gap located on the north of Vladivostok cools the SST in the ESIW formation site and the northern region of SPF in every late autumn and early winter, greatly contributing to the ESIW formation during the wintertime [21,22,23,24,25]. However, the long-term variability is greatly influenced by the Siberian High (SH), Aleutian Low (AL), North Pacific High, East Asian jet, and East Asian monsoon [3,4,13,26]. That is, different forcing parameters are playing in SST variations, depending on their timescales. Also, there are influences of climate forcing parameters with longer timescales, namely the Arctic Oscillation (AO), North Atlantic Oscillation (NAO), West Pacific (WP) pattern, and ENSO (ENSO) [27,28,29,30]. The volume transport of TWC has a great influence in the southern part of the EJS [15,31].
As mentioned above, although any relationship between a wide range of spatiotemporal scales residing in the SST variability and its related forces has been revealed in a specific time and space domain by many previous studies, there was nearly no approach based on defining spatiotemporal scales from oscillatory modes intrinsic in a singular SST time series; if any [32], the nonstationary and nonlinear features of the SST variability were not nearly considered. Sometimes, a purely data-driven approach can give insight into understanding the causal relationship between local SST anomaly variability and any exogenous forcing.
In this study, we examine the spatiotemporal characteristics of SST variability in terms of intrinsic modes residing on individual SST anomaly (SSTA) time series, which can give rise to instantaneous frequency and amplitude values at every moment. To this end, we use empirical mode decomposition (EMD) [33] in order to extract intrinsic mode functions (IMFs) from a singular SSTA signal. First, based on IMFs, we examine the temporal evolution of the (amplitude) energy density of an IMF characterized by a specific varying frequency and investigate the spatial pattern of energy distribution for a specific time duration. Second, cross-correlation-based spatial patterns along with weak spatial causality are examined using complex network approaches. Basically, since a temporal scale tends to be proportional to its spatial scale, a network is constructed based on the ensemble of the same mode IMFs for revealing their spatial extent based on a specific timescale. In addition, any lag time feature between a pair of oscillatory time series with almost equal frequency, as the same mode IMFs usually do, is incorporated into the determination of the threshold value, from which a link between a pair of the same mode IMFs is determined. Thus, in terms of network metrics such as connectivity and community [34], the structure of spatial correlation and causality is examined.
This article is organized as follows. In the materials and methods section, a brief description of data and a detailed description of methodology are presented. In the analysis result section, the aforementioned results are described in detail. Lastly, in the discussion section, we evaluate our results in comparison with previous studies and present the direction of further research, especially on causality.

2. Materials and Methods

2.1. Data

The SST data used in this study were obtained from the National Oceanic and Atmospheric Administration’s (NOAA’s) Optimum Interpolation SST (OISST) version 2.1 software [35,36], with a horizontal resolution of 1/4° and a temporal resolution of day. By correcting satellite SST biases via additional measurements, such as SSTs from the Argo float and buoy, and the adoption of revised correction methods, such as the ship-buoy SST correction algorithm and the conversion-method of the sea-ice concentration, the quality of this dataset has been significantly improved since 1 January 2016 [35,36]. Missing values in this long-term climate data from NOAA 1/4° daily OISST are filled via interpolation for a spatially complete map of SST, and SSTAs represent departures from normal or average conditions and are computed via the daily OISST minus a 30 year duration climatological mean.
In this study, we only use the limited database of a global gridded dataset, confined to the EJS and covering the duration from 1 September 1981 to 4 April 2023. The total number of gridded datasets is 1768, covering the whole EJS. In the following analysis, we use only the SSTA database because our goal is to examine the spatiotemporal characteristics of fluctuating behaviors of SST variability.

2.2. Empirical Mode Decomposition (EMD)

EMD is an adaptive time-series analysis tool specifically for the examination of nonstationary and nonlinear time series via the decomposition of a singular nonstationary time series into a series of IMFs and a residue (trend) function through sifting processes [33,37]. The IMFs are components of a time series that involve only one mode of oscillation at any given time and can give rise to a meaningful instantaneous frequency everywhere.
In the EMD algorithm, two factors are very important: defining an IMF and establishing a suitable stoppage criterion in the sifting iterations [33,38]. First, an IMF should be determined via the following two requirements for defining a meaningful instantaneous frequency from the original signal: (1) an IMF should have zero or one difference between the numbers of zero-crossings and the numbers of local extrema, and (2) an IMF must have symmetric envelops defined by local maxima and minima, respectively, which yield a zero mean. In that case, an IMF can be transformed into an analytic function via the Hilbert transform and give rise to a single assigned instantaneous frequency at a time [33]. Second, a stoppage criterion is needed for obtaining physically meaningful IMFs because there is an inevitable conflict between the IMF definition and the EMD algorithm based on spline fitting. That is, if we adhere to the strict definition of the IMF [33], we ultimately obtain the IMFs, which are physically meaningless [38]. Thus, an appropriate stoppage criterion is needed for the sifting process. There are various stoppage criteria, and the corresponding IMFs have distinct characteristics depending on the adopted stoppage criterion. In this study, we adopted the Cauchy-type criterion among all available stoppage criteria [33,38]. In the following, we present a brief procedure for EMD implementation.
A basic sifting process for EMD is summarized as follows [38]:
  • All the local extrema are identified for a given time series, x t .
  • By interpolating all the local maxima and minima with cubic spline curves, respectively, we obtain the upper, u t , and lower, l t , envelops.
  • An average envelop is obtained from the upper and lower envelops via m t = u t + l t / 2 .
  • A proto-IMF is obtained via the following differences, h t = x t m t .
  • By checking if the proto-IMF satisfies two requirements, the definition of IMF and the stoppage criterion, the proto-IMF is determined to be an IMF.
  • If the proto-IMF does not satisfy these requirements, steps 1 through 5 on h t are repeated until they are satisfied.
  • When the requirements are satisfied, the proto-IMF, h t , is assigned as an IMF component, c t .
  • For the next IMF, we repeat steps 1 through 7 on the residue, r t = x t c t .
  • All the iterations end when the final residue contains no more than one extremum.
Here, the adopted Cauchy-type stoppage criterion is given as follows [38]:
S D = h k 1 t h k t 2 h k 1 2 t
where SD denotes a local standard deviation of the two consecutive sifting results and h k denotes the proto-IMF at k-th iteration of the sifting process. Finally, we obtain a set of IMFs, c i t , and a residue, r n t , satisfying the following relation:
r n t = x t i = 1 n c i t
where the i denotes a mode number and the residue, r n t , represents the trend of the time series, x t . Due to the nature of the sifting process, an IMF has a gradually decreasing frequency as its mode number increases. In this study, by adopting the SD = 0.001 as a stoppage criterion, we obtained 10 IMFs from each SSTA time series.

2.3. Hilbert Spectrum

After the Hilbert transform is performed on each IMF component, the given time series, x t , is expressed as follows [33]:
x t = j = 1 n a j t   e x p i ω j t d t
where n denotes the mode number, and a j t and ω j t denote the instantaneous amplitude and frequency of j-mode IMF, respectively. Since the amplitude, a j t , can be interpreted as the Hilbert spectrum, H ω , t , we can define the marginal spectrum, h ω , as the following formula [33],
h ω = 0 T H ω , t d t
In addition, the instantaneous energy density level [33], IE, is defined as
I E t = ω H 2 ω , t d ω
Using the IE of each SSTA signal, we examine the energy fluctuation over time, as well as the spatial distribution pattern of all SSTA signals in the EJS at a specific time.
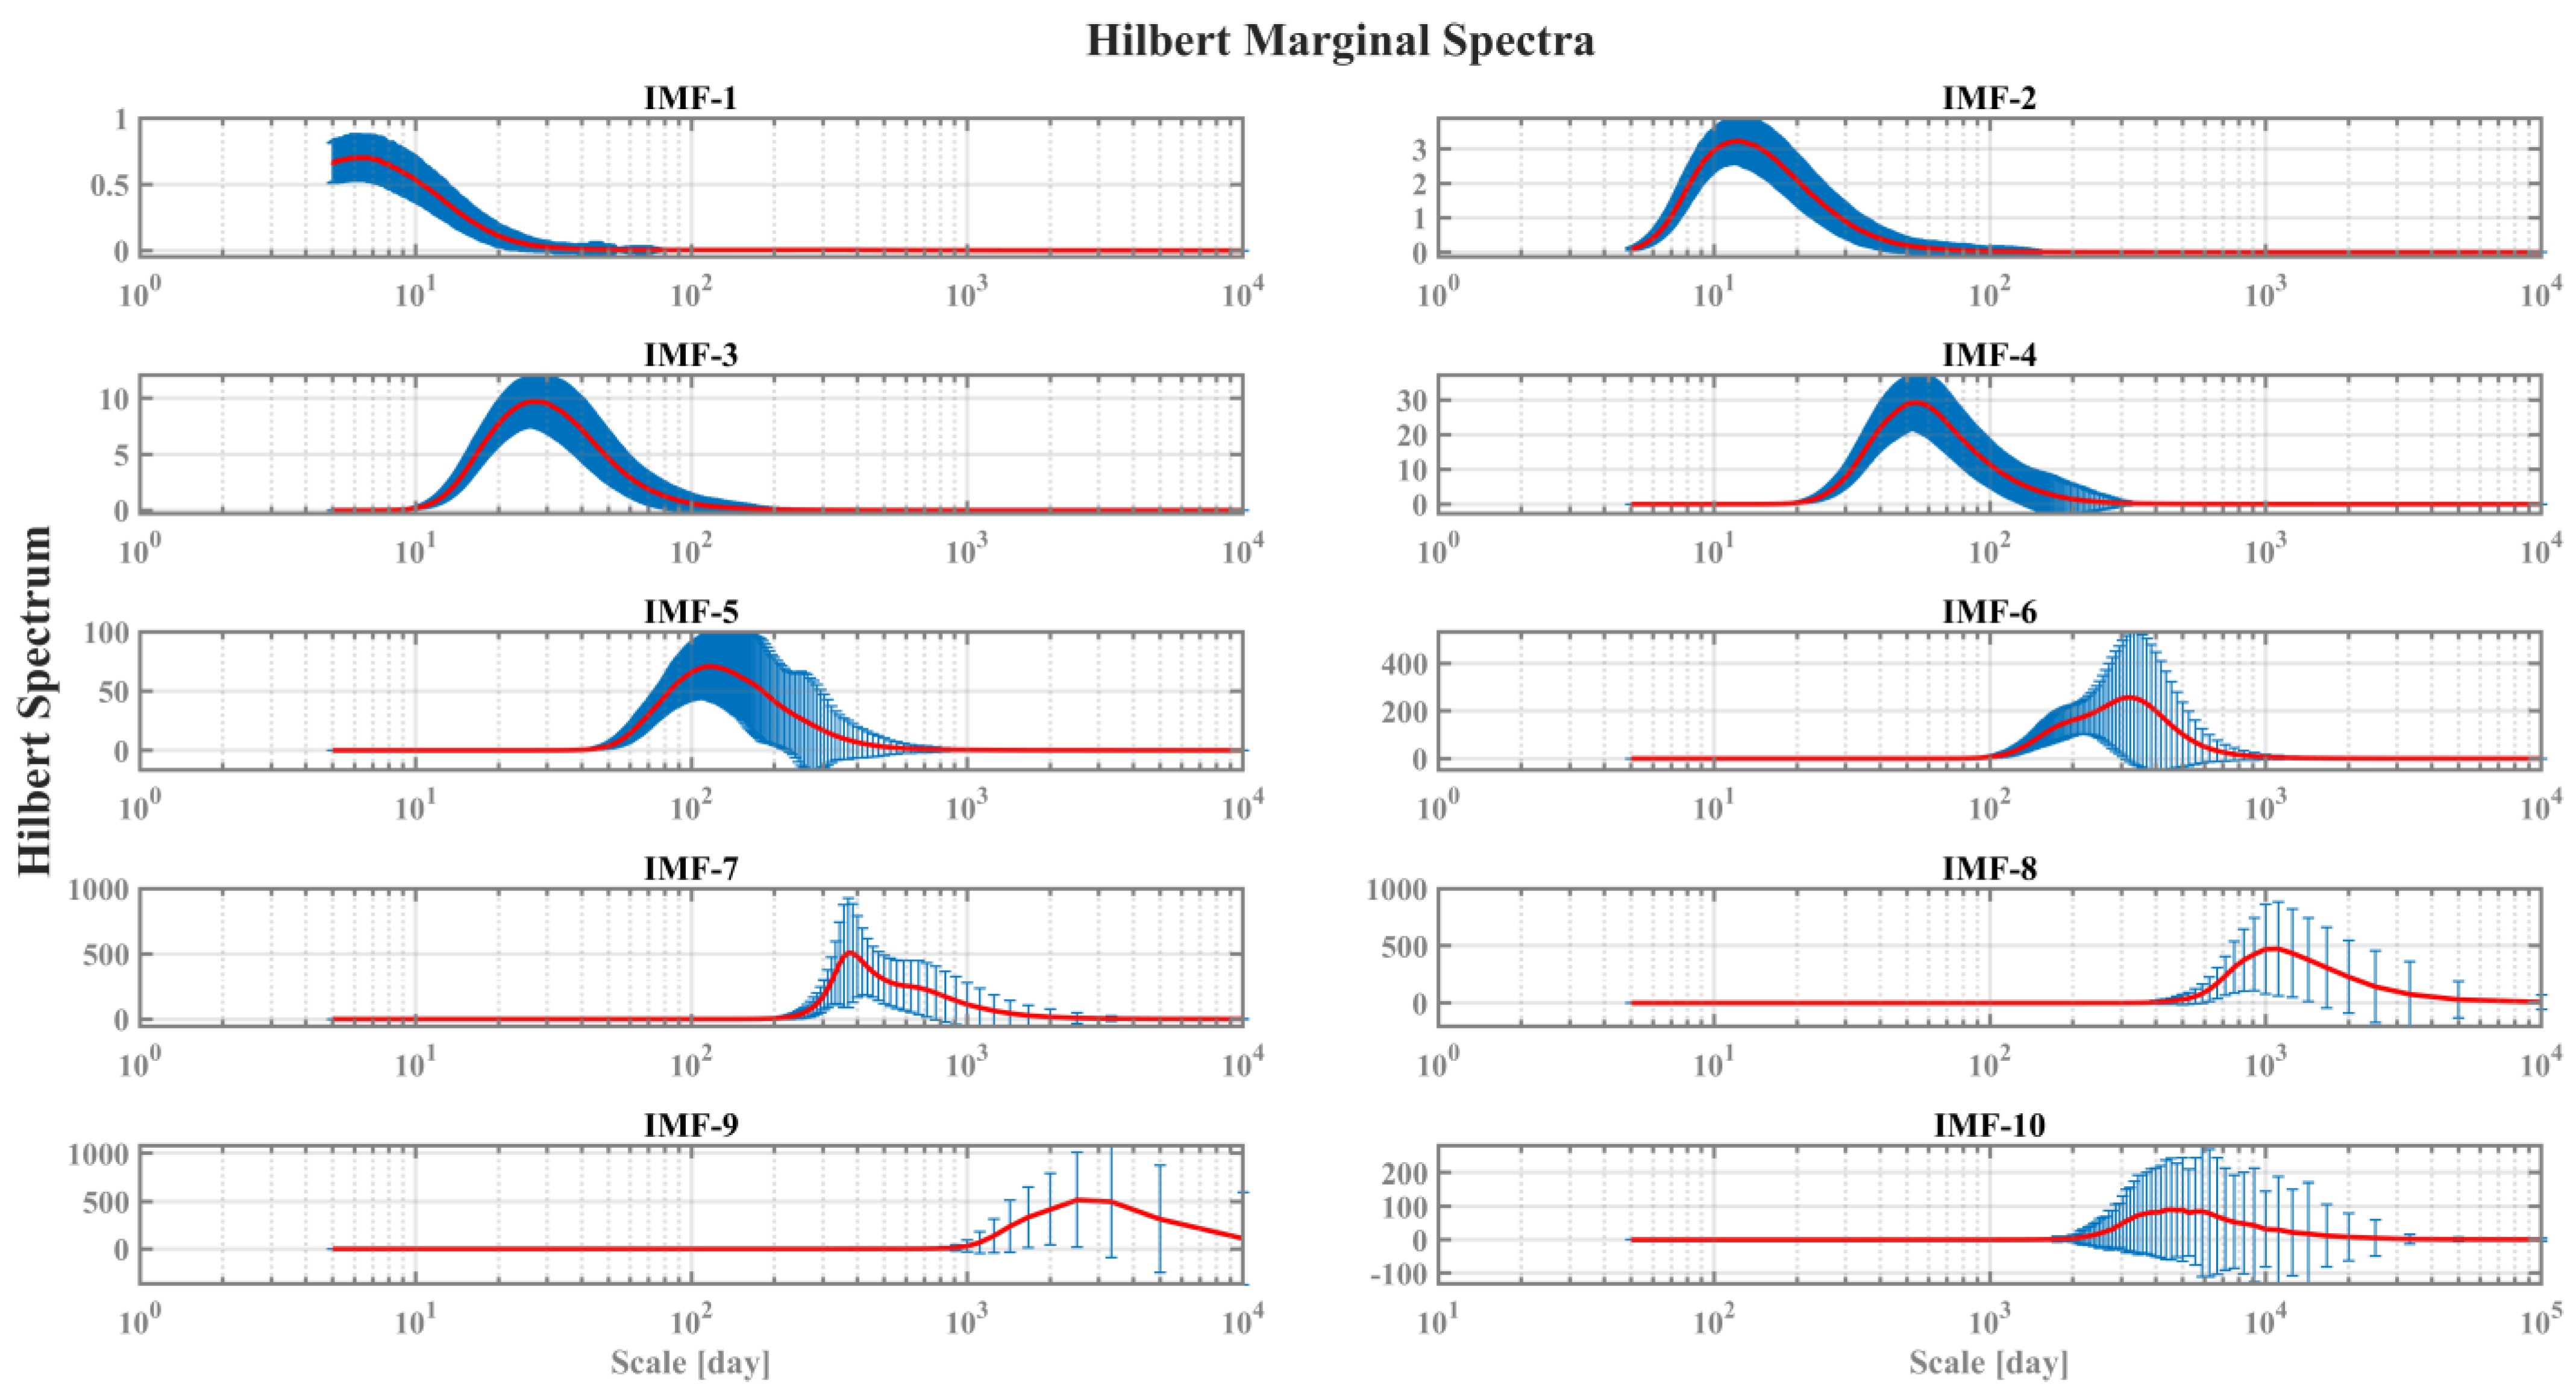
Figure 2 shows the marginal spectrum, h ω , of IMFs for all SSTA databases. First, we can see that a dominant timescale increases as the mode number increases. For low-mode IMFs (1 through 4), the marginal spectrum value is low and a clear peaked period is observed, while higher mode IMFs have a high spectrum value and a wide-width period. Two modes of IMF-6 and IMF-7 have a nearly same peaked timescale, corresponding to an annual period, with different skewed directions. The former is skewed toward a shorter scale, while the other is skewed toward a longer scale, indicating any intra- and inter-wave frequency modulations [33].
Compared to orthogonal modes via the Fourier transform, IMFs usually have intra- and inter-wave frequency modulations, as well as amplitude modulations. Thus, it is not plausible that any IMF preserves its peak frequency over the whole duration. However, in this study, the peaked timescale is used as a representative scale for its corresponding IMF, along with considering the frequency modulation effect.
The peaked scales of all IMFs corresponding to a singular SSTA series are summarized in Table 1, where the empirically observed scales of the SSTA variability in previous studies are also included for comparison. As mentioned in the Introduction section, the smaller scales correspond to local wind forcing and synoptic atmospheric scales [17,18,19,20], while the longer scales are mainly attributed to advection timescales as well as various climate factors [3,4,11,12]. In the following analysis, the characteristics of spatial pattern and temporal evolution of SSTA variability are examined in terms of IMF-based IE and networks for weekly to decadal timescales.

2.4. Complex Network Methodology

2.4.1. Network Construction

In order to examine the correlation-based topological structure of SSTA variability in the EJS, we apply the complex network methodology to ensemble sets of the same mode IMFs of SSTA. For network construction, we use the Pearson correlation coefficient (PCC) as a criterion for determining the connectivity of a pair of same-mode IMFs. In this case, determining the threshold value of PCC is a very important step. Generally, the PCC of a pair of oscillatory signals shows a sinusoidal pattern with respect to lag time. Thus, if two spatially remote SSTA variabilities show a similar oscillation pattern due to their nearly the same timescale, there can be a lag time due to the physical distance between both locations. By considering this characteristic appearing in cross-correlation behavior between two oscillating time series, we determine the threshold value of PCC in order to ensure that it contains lag time information. In this study, for IMF-1 through IMF-8 with smaller timescales than an interannual scale (~1000 days), the critical value is set to be 0.5 (approximately 1/6 of the corresponding timescale), while for IMF-9 and IMF-10 with longer timescales than 2500 days, the critical value is 0.8 (nearly 1/10 of the corresponding timescale).
For an ensemble of mode–k IMFs, c i k , the PCC matrix C i j k is computed as follows:
C i j k = t = 1 T c i k t c i k ¯   c j k t c j k ¯ t = 1 T c i k t c i k ¯   2 t = 1 T c j k t c j k ¯ 2
where c i k ¯ and c j k ¯ denote the time average PCC values of i and j nodes, respectively. Next, the diagonal components of C i j k are set to zero in order to remove self-loops in a network. And, by applying the threshold value to all triangular components of C i j k , we finally obtain the adjacency matrix, { A i j }, representing a scale-dependent network.

2.4.2. Network Metrics

The IMF network constructed from an ensemble of same-mode IMFs with a specific peaked timescale is first used to examine the spatial pattern of scale-dependent cross-correlations of SSTA variability among regularly distributed lattice points (nodes in the network topology) in the EJS and, second, is utilized for delimiting the spatial influencing extent of any dominant forcing corresponding to the respective IMF. The spatial distribution of degrees (connectivity) of nodes is used for the former goal, and the second goal is achieved via the modularity-based community structure [34,39,40].
A degree, defined as the number of edges (or links) attached to a single node, is obtained from an undirected adjacency matrix { A i j } via the following formula:
k i = j = 1 N A i j ,   k = 1 N i = 1 N k i
where k i denotes the number of links attached to a node i, with k denoting the mean degree of the network. Since a mean degree usually provides information on the global connectivity of a network, we use the degree of individual nodes instead of the mean degree for examining the spatial pattern of connectivity of a network. In addition, in order to explore the connectivity structure of the network, we use the network metric of assortativity [41], referring to the nodes’ tendency in a network for nodes with similar degrees to connect together. Generally, networks are classified as assortative, disassortative, and neutral; assortative networks tend to make a cluster of hubs (nodes with a high degree), while disassortative networks have a dispersed structure of hubs, if any hubs.
In this study, we used the link-based assortativity coefficient, r , quantifying the level of assortativity in a network [41]; it ranges from −1 to 1. For a network consisting of N nodes linked by M edges with a degree probability of p k , the assortativity coefficient r is defined as follows:
r = 1 σ q 2 j k j k e j k q j q k
where e j k denotes the joint probability for the two nodes of a randomly chosen edge having j + 1 degrees and k + 1 degrees, respectively [41,42], and q k , defined as q k = k + 1 p k + 1 j j p j , denotes the normalized probability for one end of the randomly chosen link having k + 1 degrees, along with the variance σ q 2 = k k 2 q k k k q k 2 . And its interpretation is as follows:
  • r > 0 indicates an assortative network, characterized by a big clustered structure, robustness by multiple hubs, and stability in the network’s structure [41].
  • r < 0 indicates a disassortative network, characterized by a negative correlation between adjacent two nodes.
  • r 0 implies that there is no correlation between two nodes of a network.
It should be noted that all IMF networks in this study are assortative.
Lastly, identifying communities in a modulated geophysical network is crucial for understanding the region-specific topological structure; it can reveal the spatial extent of any forcing affecting the variability of a node’s property, like SSTA variability. A community is a group consisting of nodes that have dense connections with nodes inside the group but relatively fewer connections with nodes outside the group. Among a lot of widely used algorithms, we use the Louvain algorithm based on modularity optimization [40]. Modularity is a metric for evaluating the quality of community structures in a given network via the difference between the actual number of edges within communities and the number of edges that would be expected by chance in cases of being randomly connected while preserving the nodes’ degrees [39], and its definition is as follows:
Q = 1 2 m i j A i j k i k j 2 m δ c i , c j
where m is the total number of edges in the network, with k i and k j being the degrees of nodes i and j , c i and c j being the community assignments of nodes i and j , and δ c i , c j being the Kronecker delta function. A high modularity value indicates that a network has a strong community structure.

3. Analysis Results

3.1. Spatial Pattern of Instantaneous Energy Level (IE) of IMFs

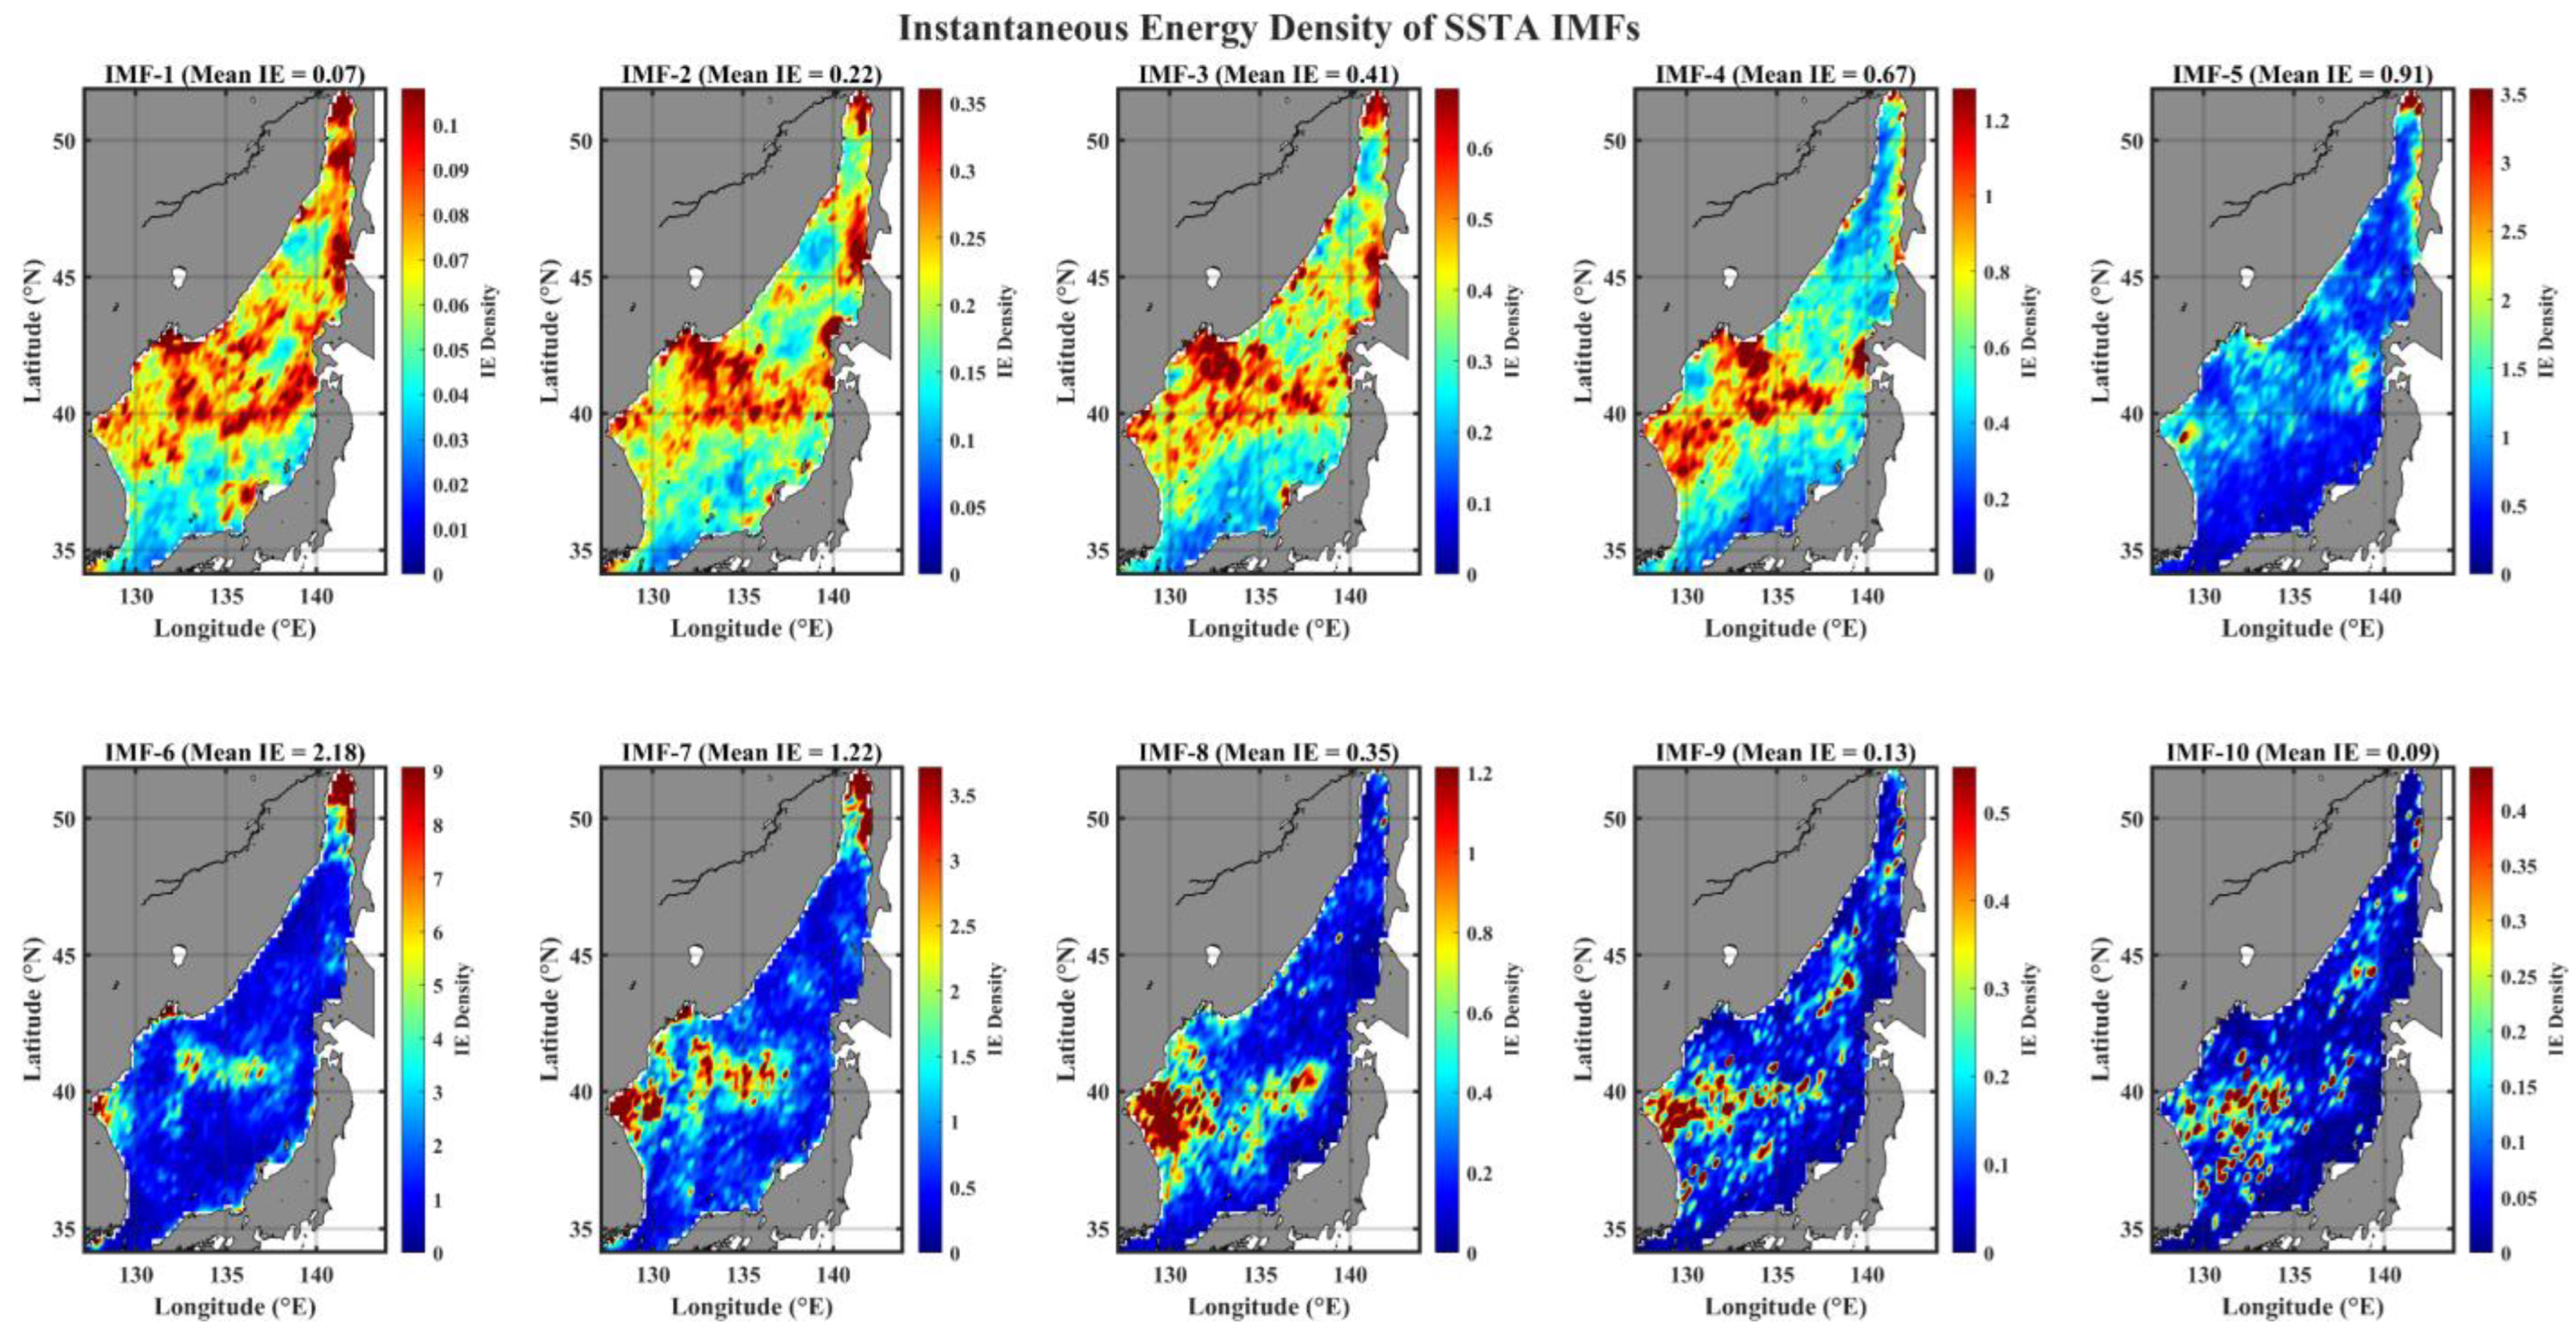
We first examine the spatial distribution pattern of IE with respect to the respective IMF. As shown in Figure 3, the IE spatial patterns of all-mode IMFs for full duration (from September 1981 to April 2023) show distinctly scale-dependent features; for the low-mode IMFs (1 through 4), the region with relatively high energy density extends from the central part toward the northern part of the EJS, while the energy of IMFs with high mode (6 through 9) is mainly focused on a varying tongue-shaped region (from the EKB toward the SPF). The tongue-shape region located at mid-latitude (~40° N) is consistent with the region, which is characterized by a large standard deviation of SSTA [43] and exhibits a distinct seasonality of marine heatwave intensity [44]. The largest interannual SST variability observed in the EKB [13], which could be associated with the surface wind variability during winter time, is also confirmed by the IE spatial pattern of IMF-8 (Figure 3).
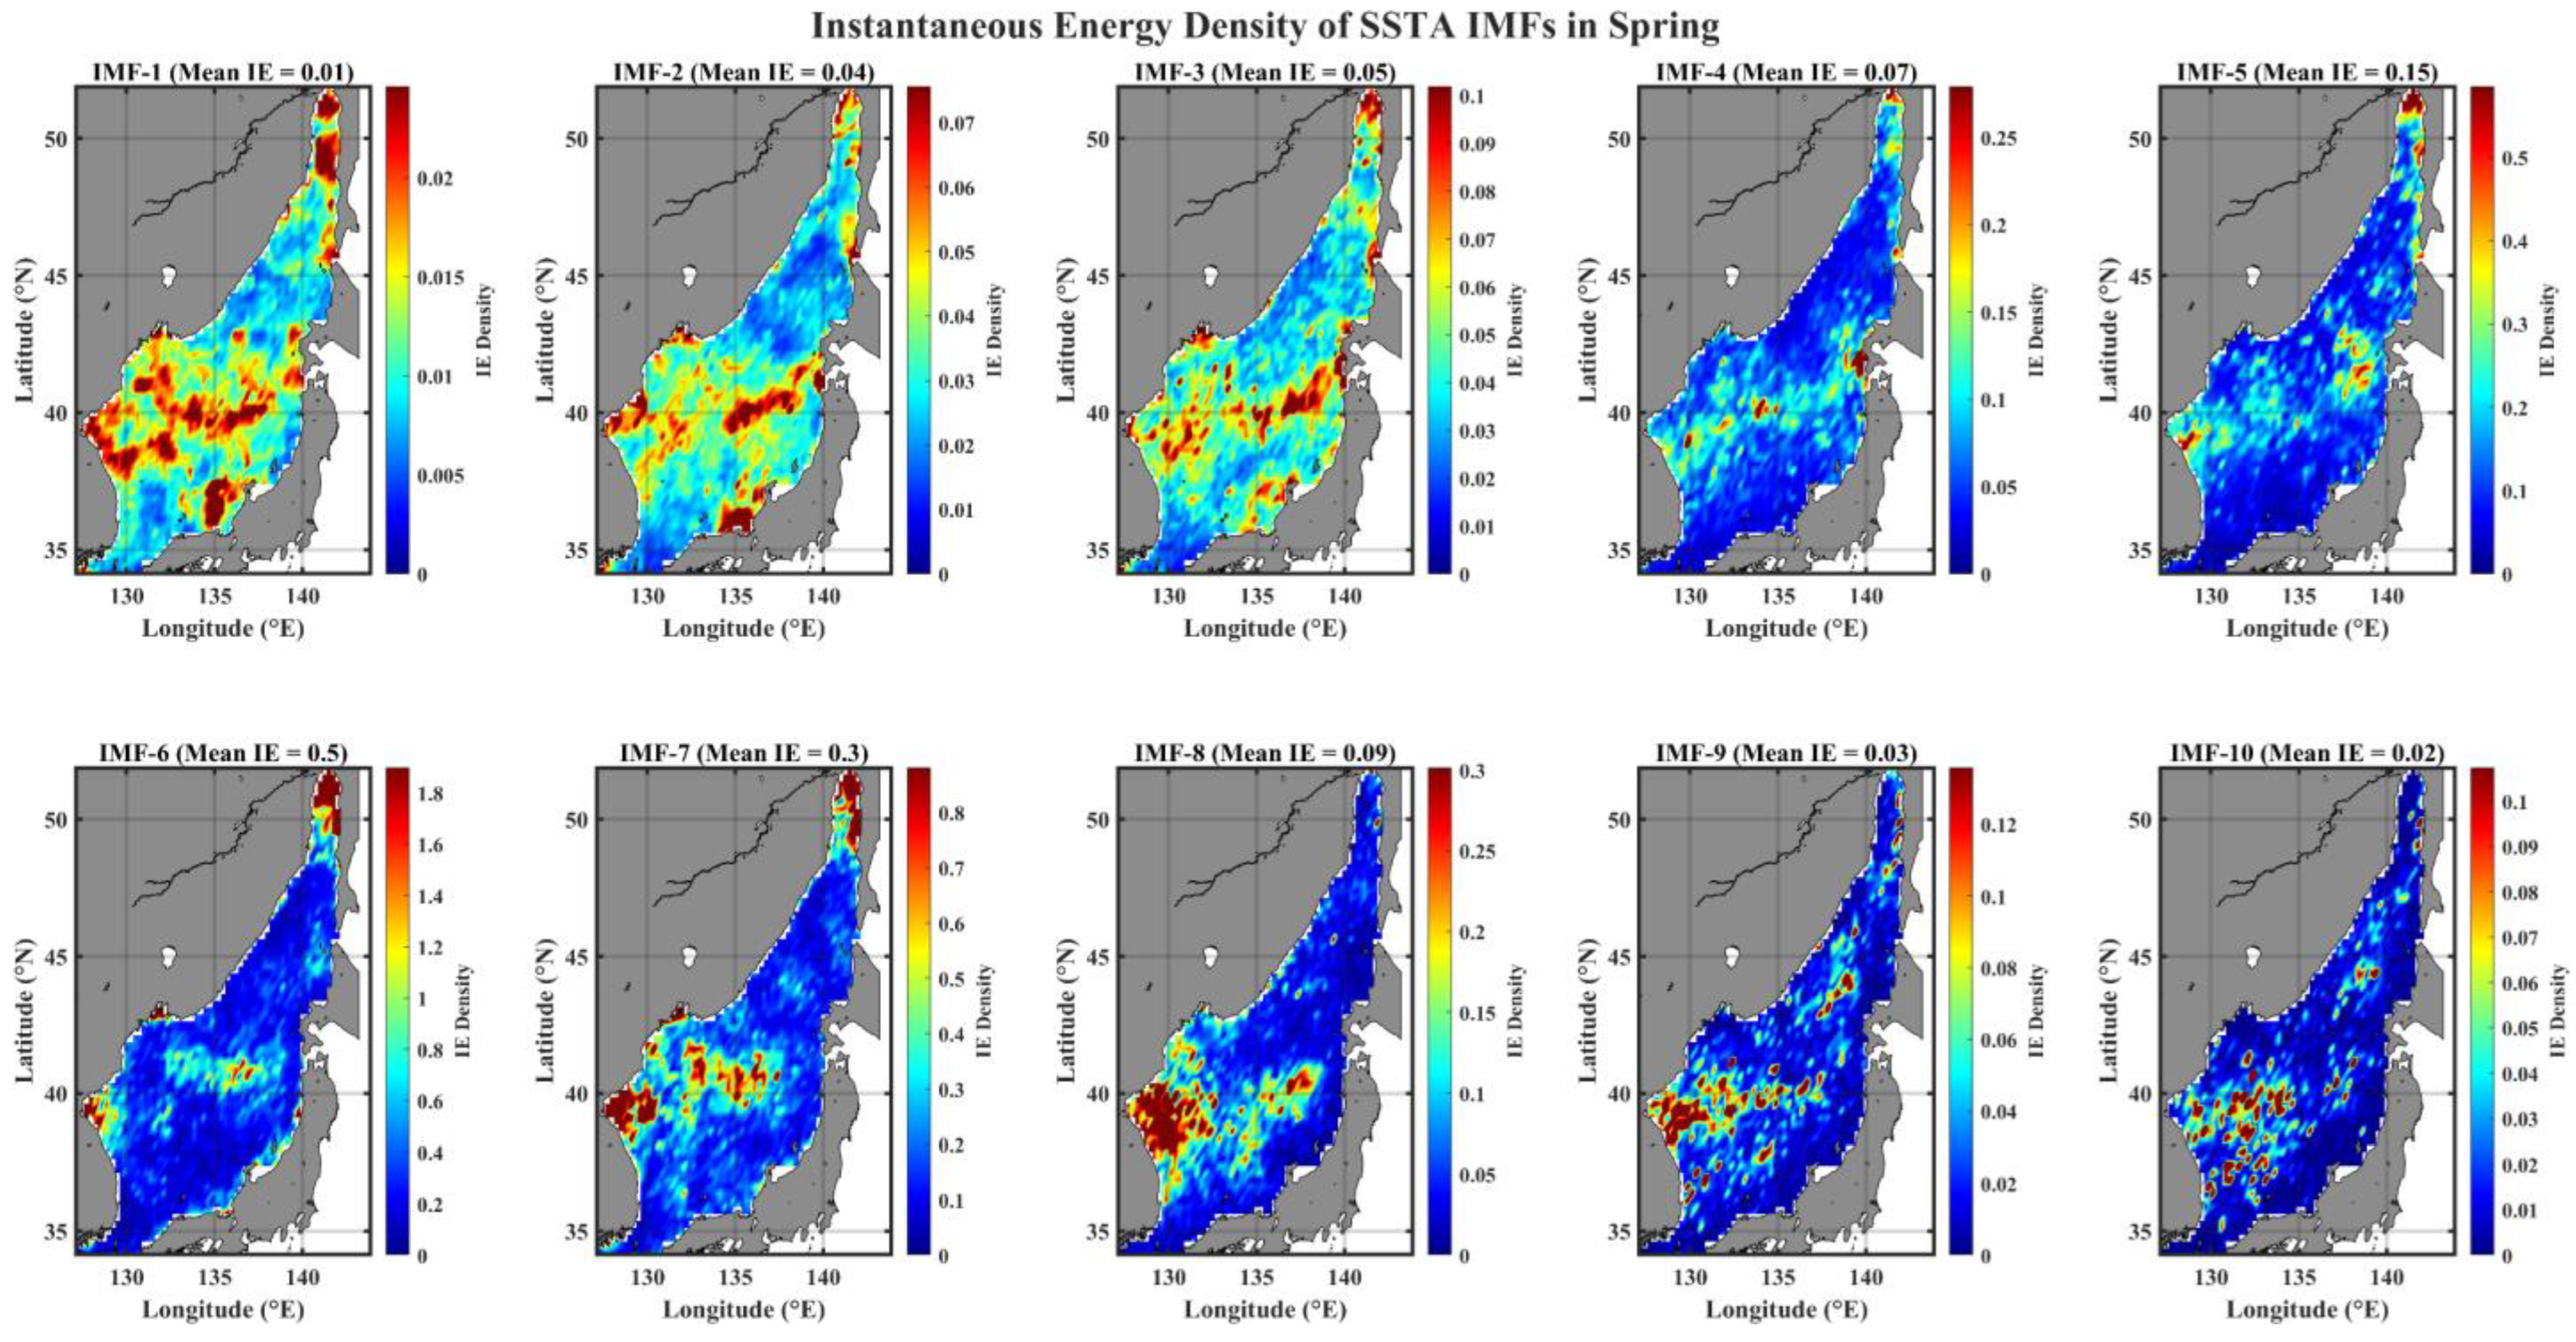
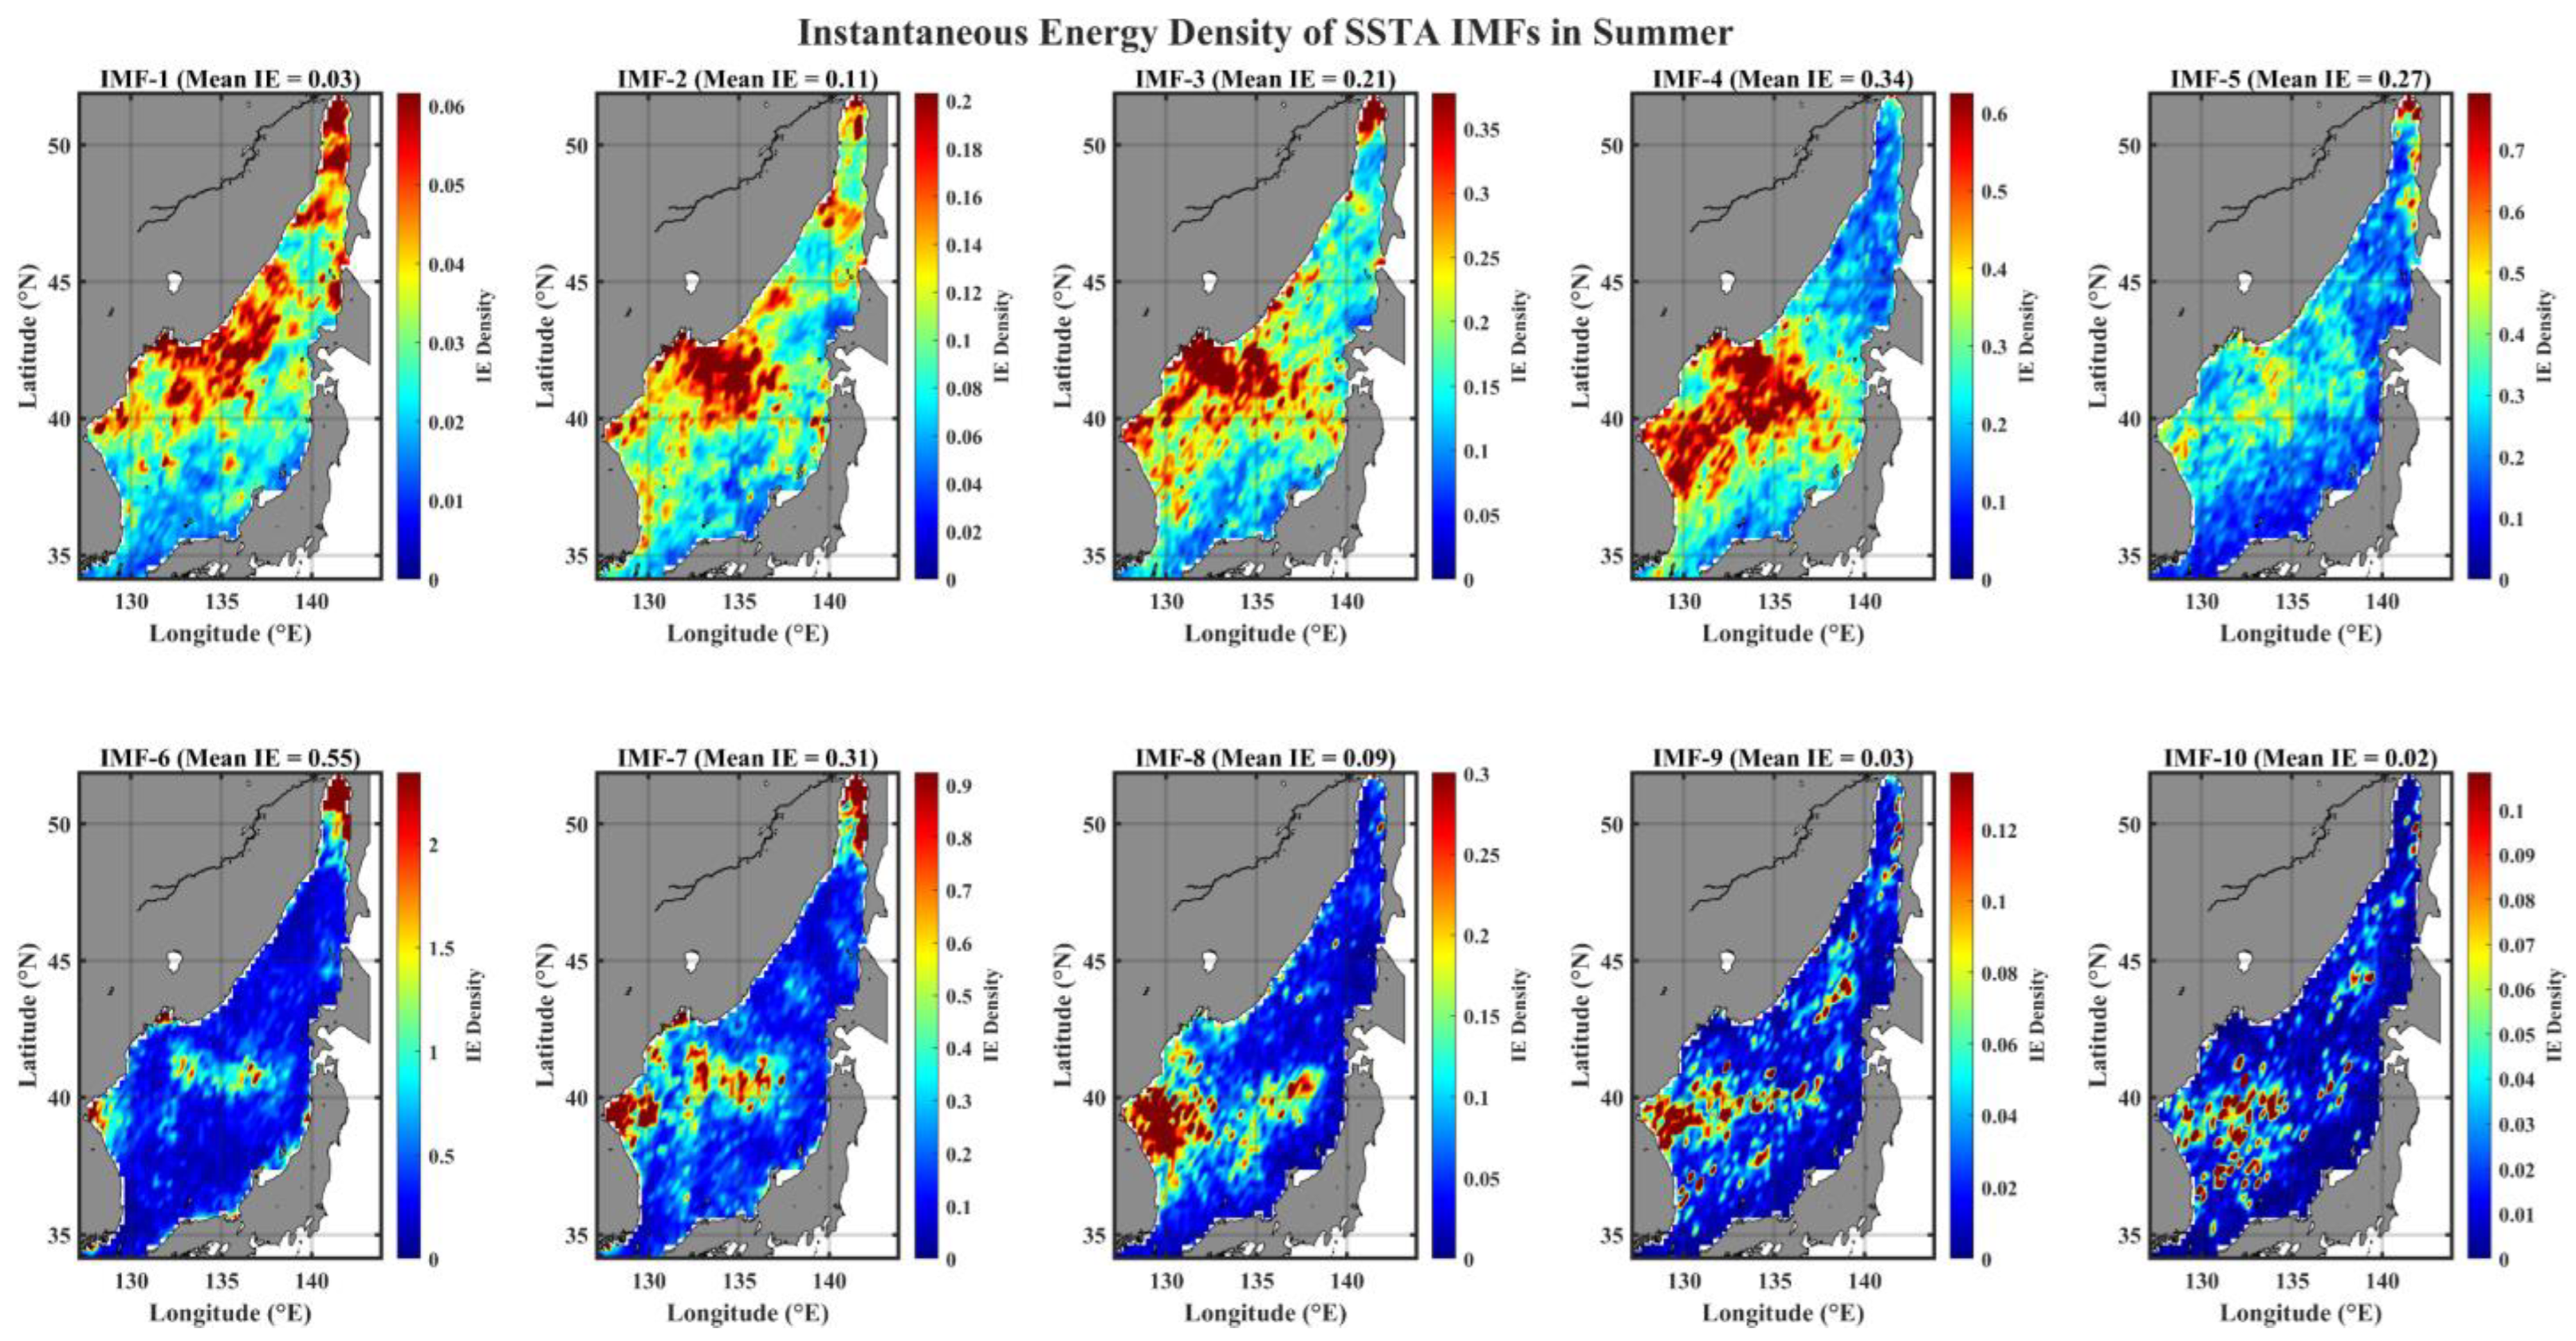
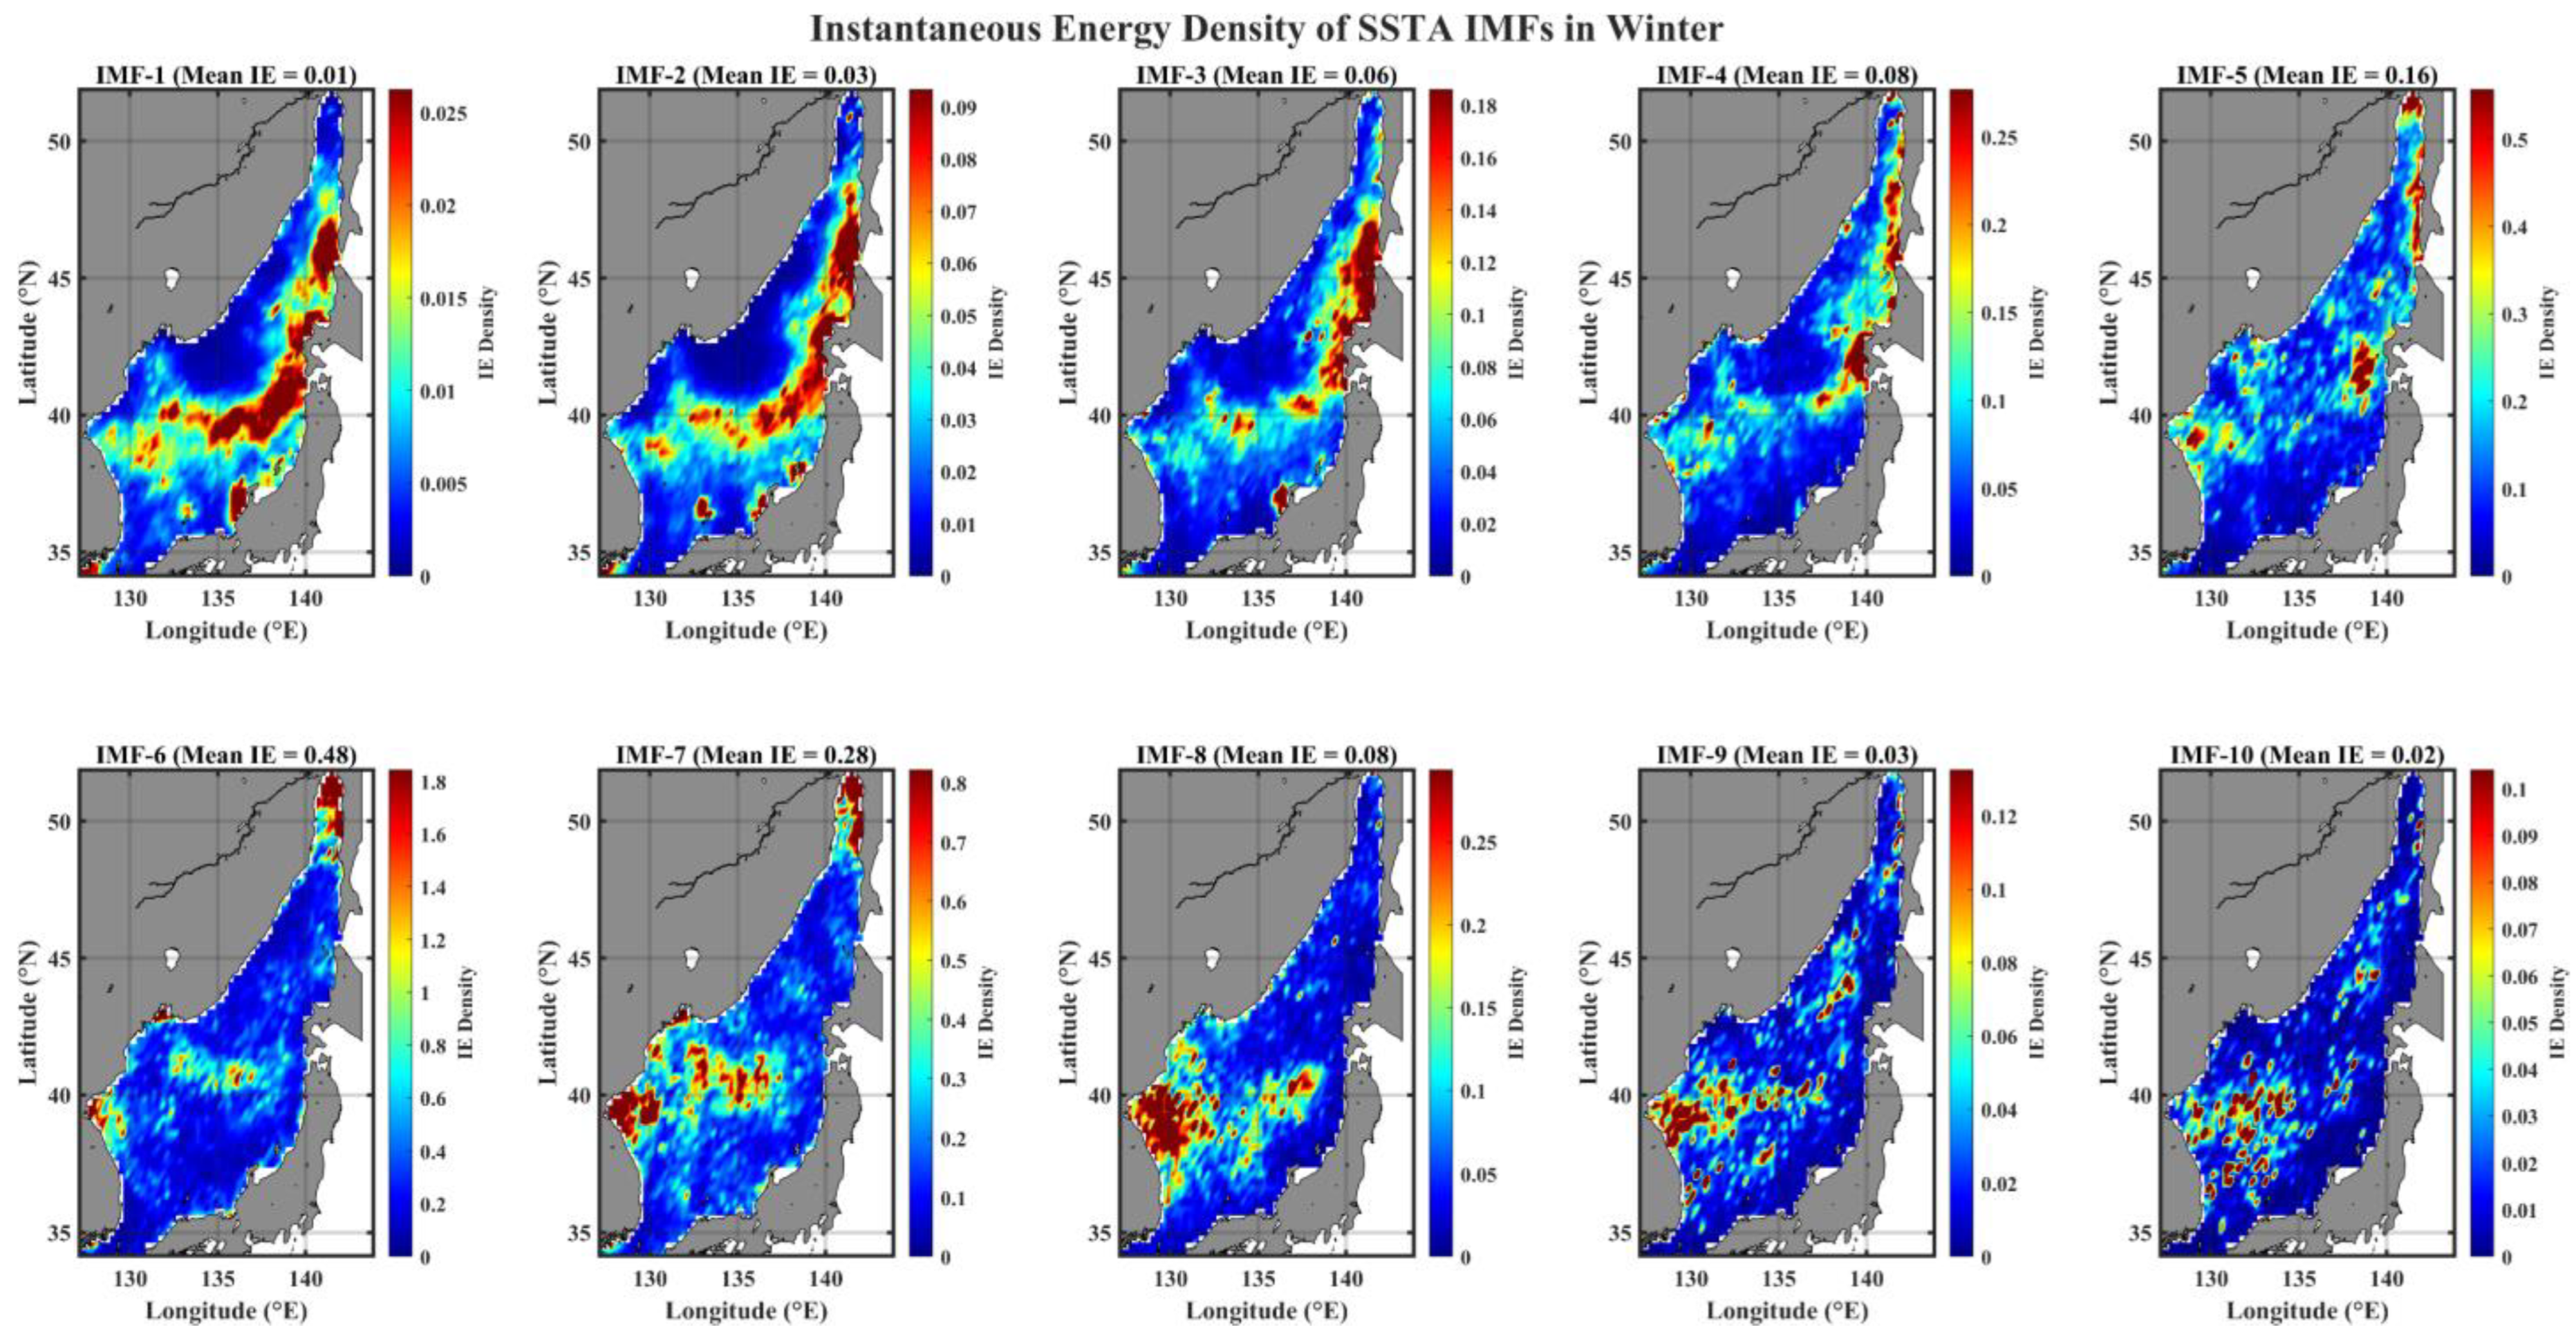
Next, we examine the seasonality of the IE spatial patterns of all IMFs in Figure 4, Figure 5, Figure 6 and Figure 7. A most noticeable difference is the pattern between summer and winter for low-mode IMFs (IMF-1 through IMF-4) with timescales shorter than a seasonal scale (~60 days); those modes, in summer seasons, show a basin-wide IE spatial pattern from the southern EJS extending towards the central EJS (Figure 5), along with the highest IE level at the northwestern part of the EJS, including the ESIW formation site, while in winter seasons, the same modes make an elongated belt-shape from the western end of the SPF extending towards the west coast of northern Japan (Figure 7). This distinct IE spatial pattern by low-mode IMFs (IMF-1 through IMF-4) in winter seasons could be closely related to the Arctic Oscillation (AO) forcing because significant SSTA variability was observed in the negative AO phase along the Japan coast [43]. Although these small-scaled modes contribute a small portion of energy to the SSTA variability, most seasonality-related features could be associated with these small-scaled modes or any related forcing.
Furthermore, a dipole structure between the south of Vladivostok and the EKB during winter, as seen in the IE spatial pattern of IMF-4 in Figure 7, is consistent with the climatological surface wind stress curl pattern during JFM [43]; the temporal scale of this wind stress curl could be about 60 days.
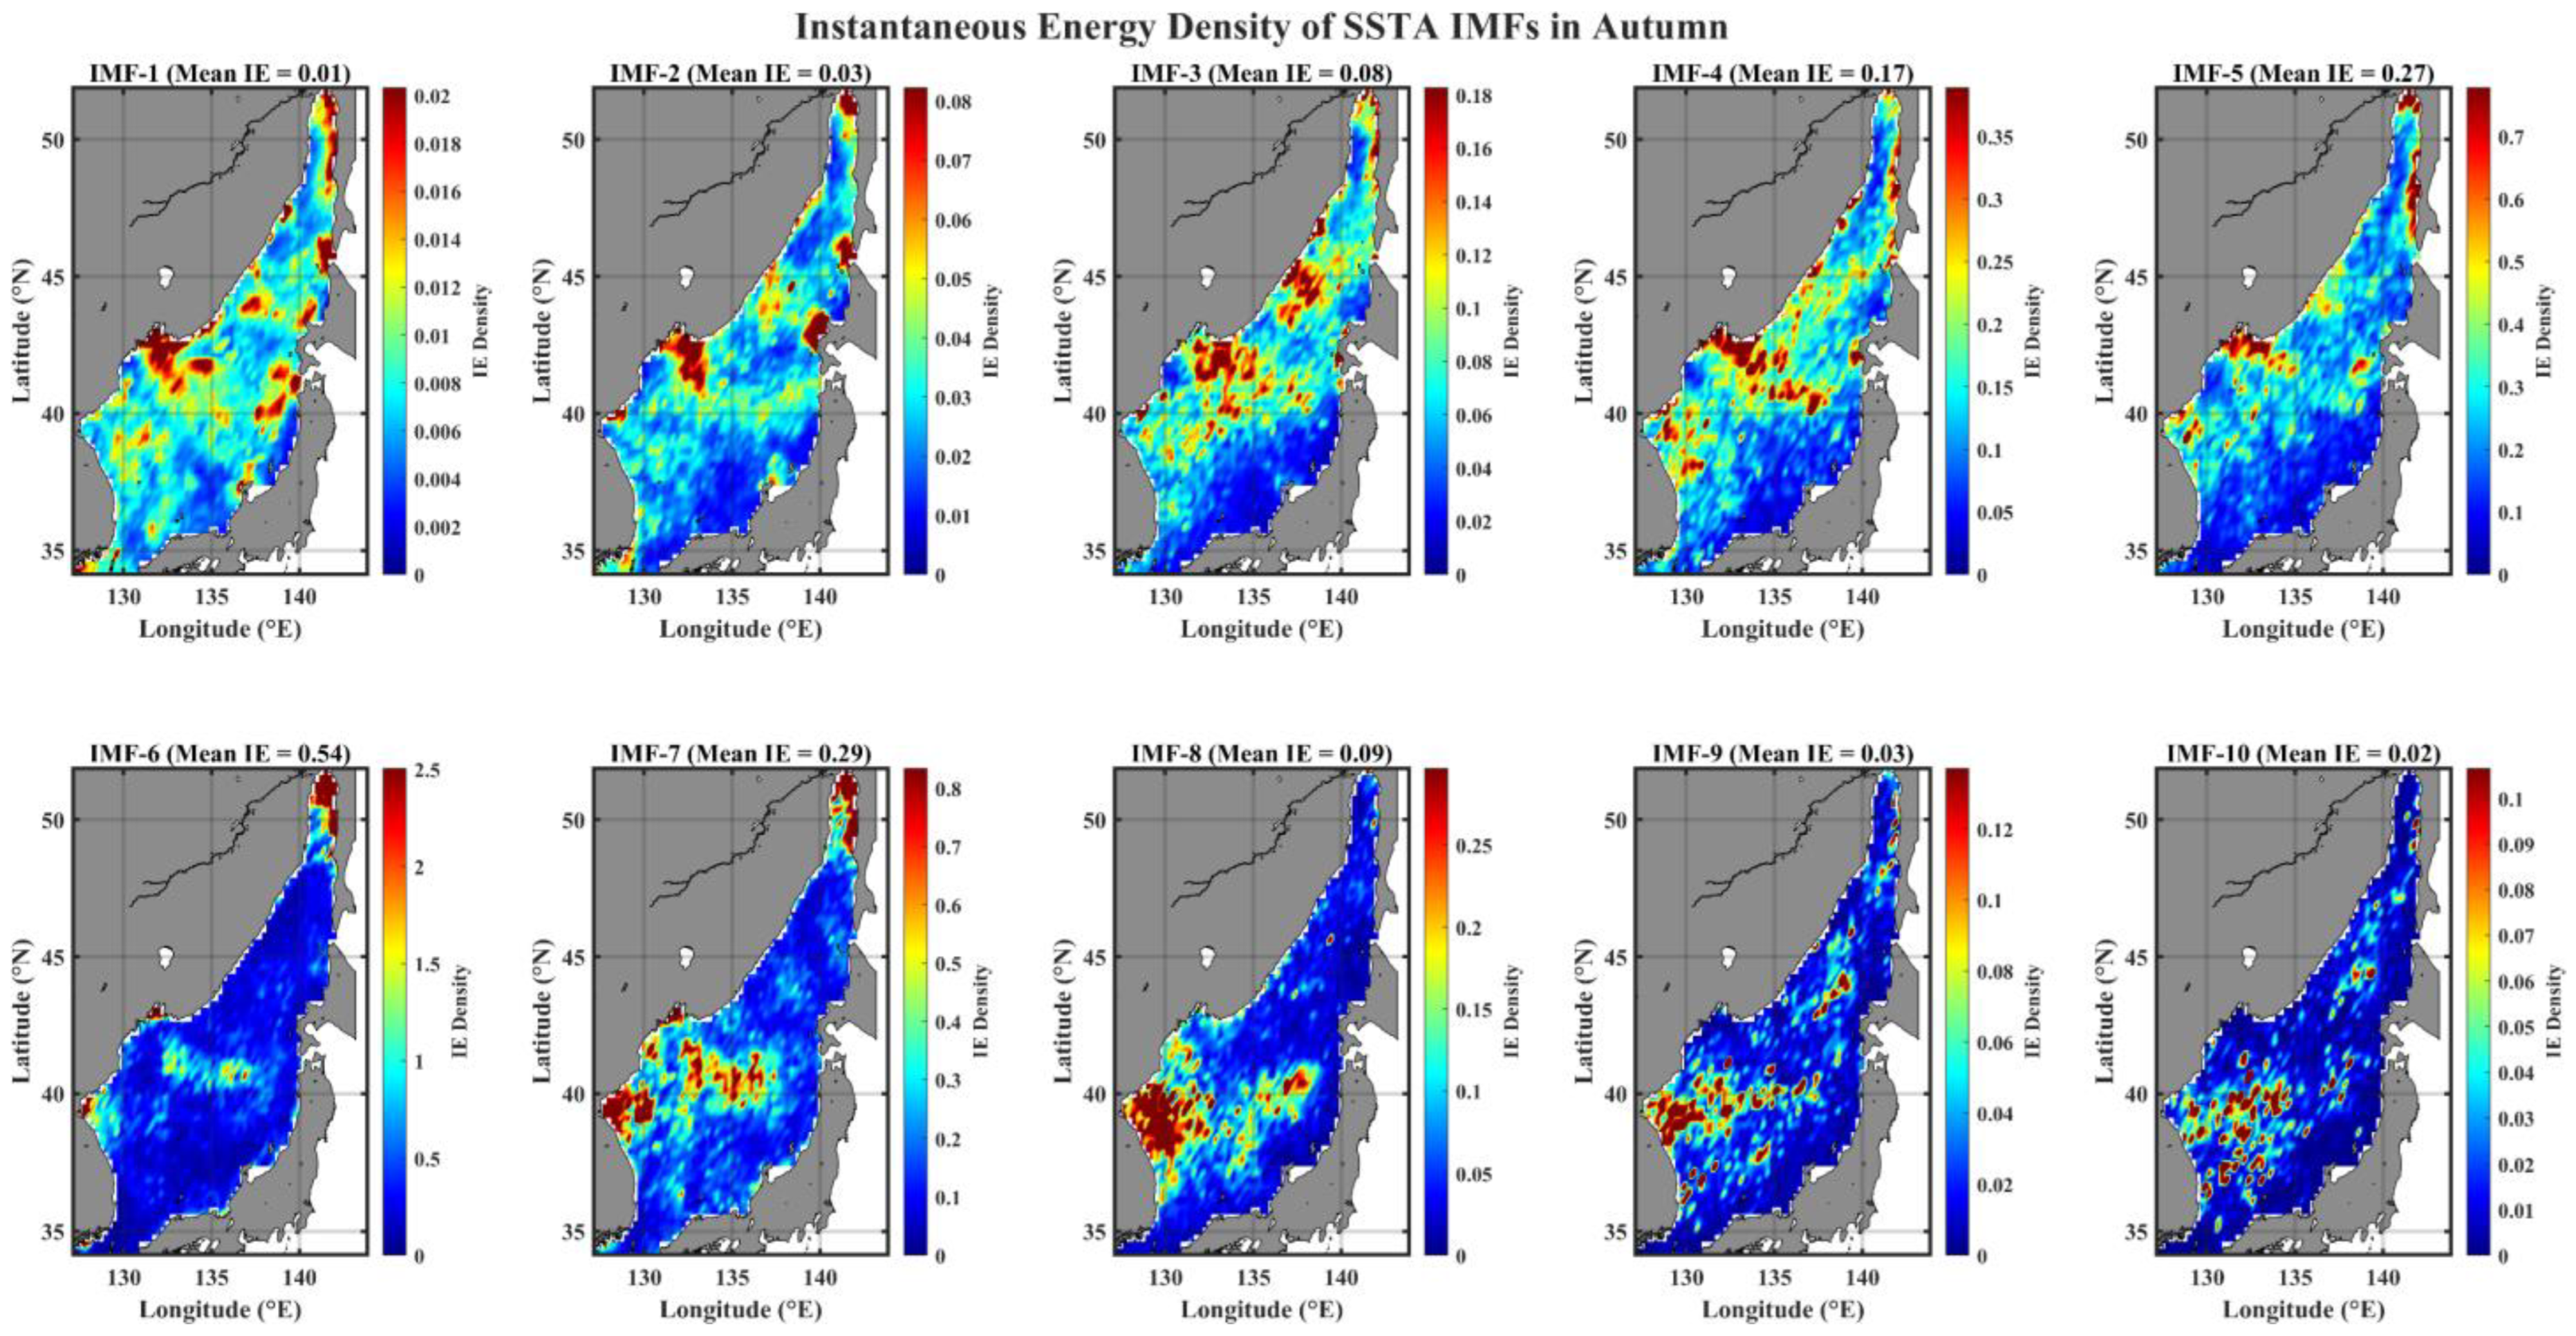
Similar to the IE spatial patterns of high-mode IMFs, as shown in Figure 3, the IE patterns of IMF-6 through IMF-10 are nearly persistent, irrespective of seasons (Figure 4, Figure 5, Figure 6 and Figure 7). The tongue-shape region from the EKB extending towards the SPF has been reported to be greatly affected by the surface current circulations; in the EKB, a cyclonic eddy is often formed and induces anomalous downwelling (upwelling) during a positive (negative) AO phase [43,45], and the EKWC affected by the AO is a significant factor in the SSTA variations [46,47]. Note that the EKWC strength index has a decadal timescale [43]. Thus, the modes with interannual-to-decadal timescales could be mainly related to advective forcing.

3.2. Temporal Evolution of the Instantaneous Energy Level (IE) of IMFs

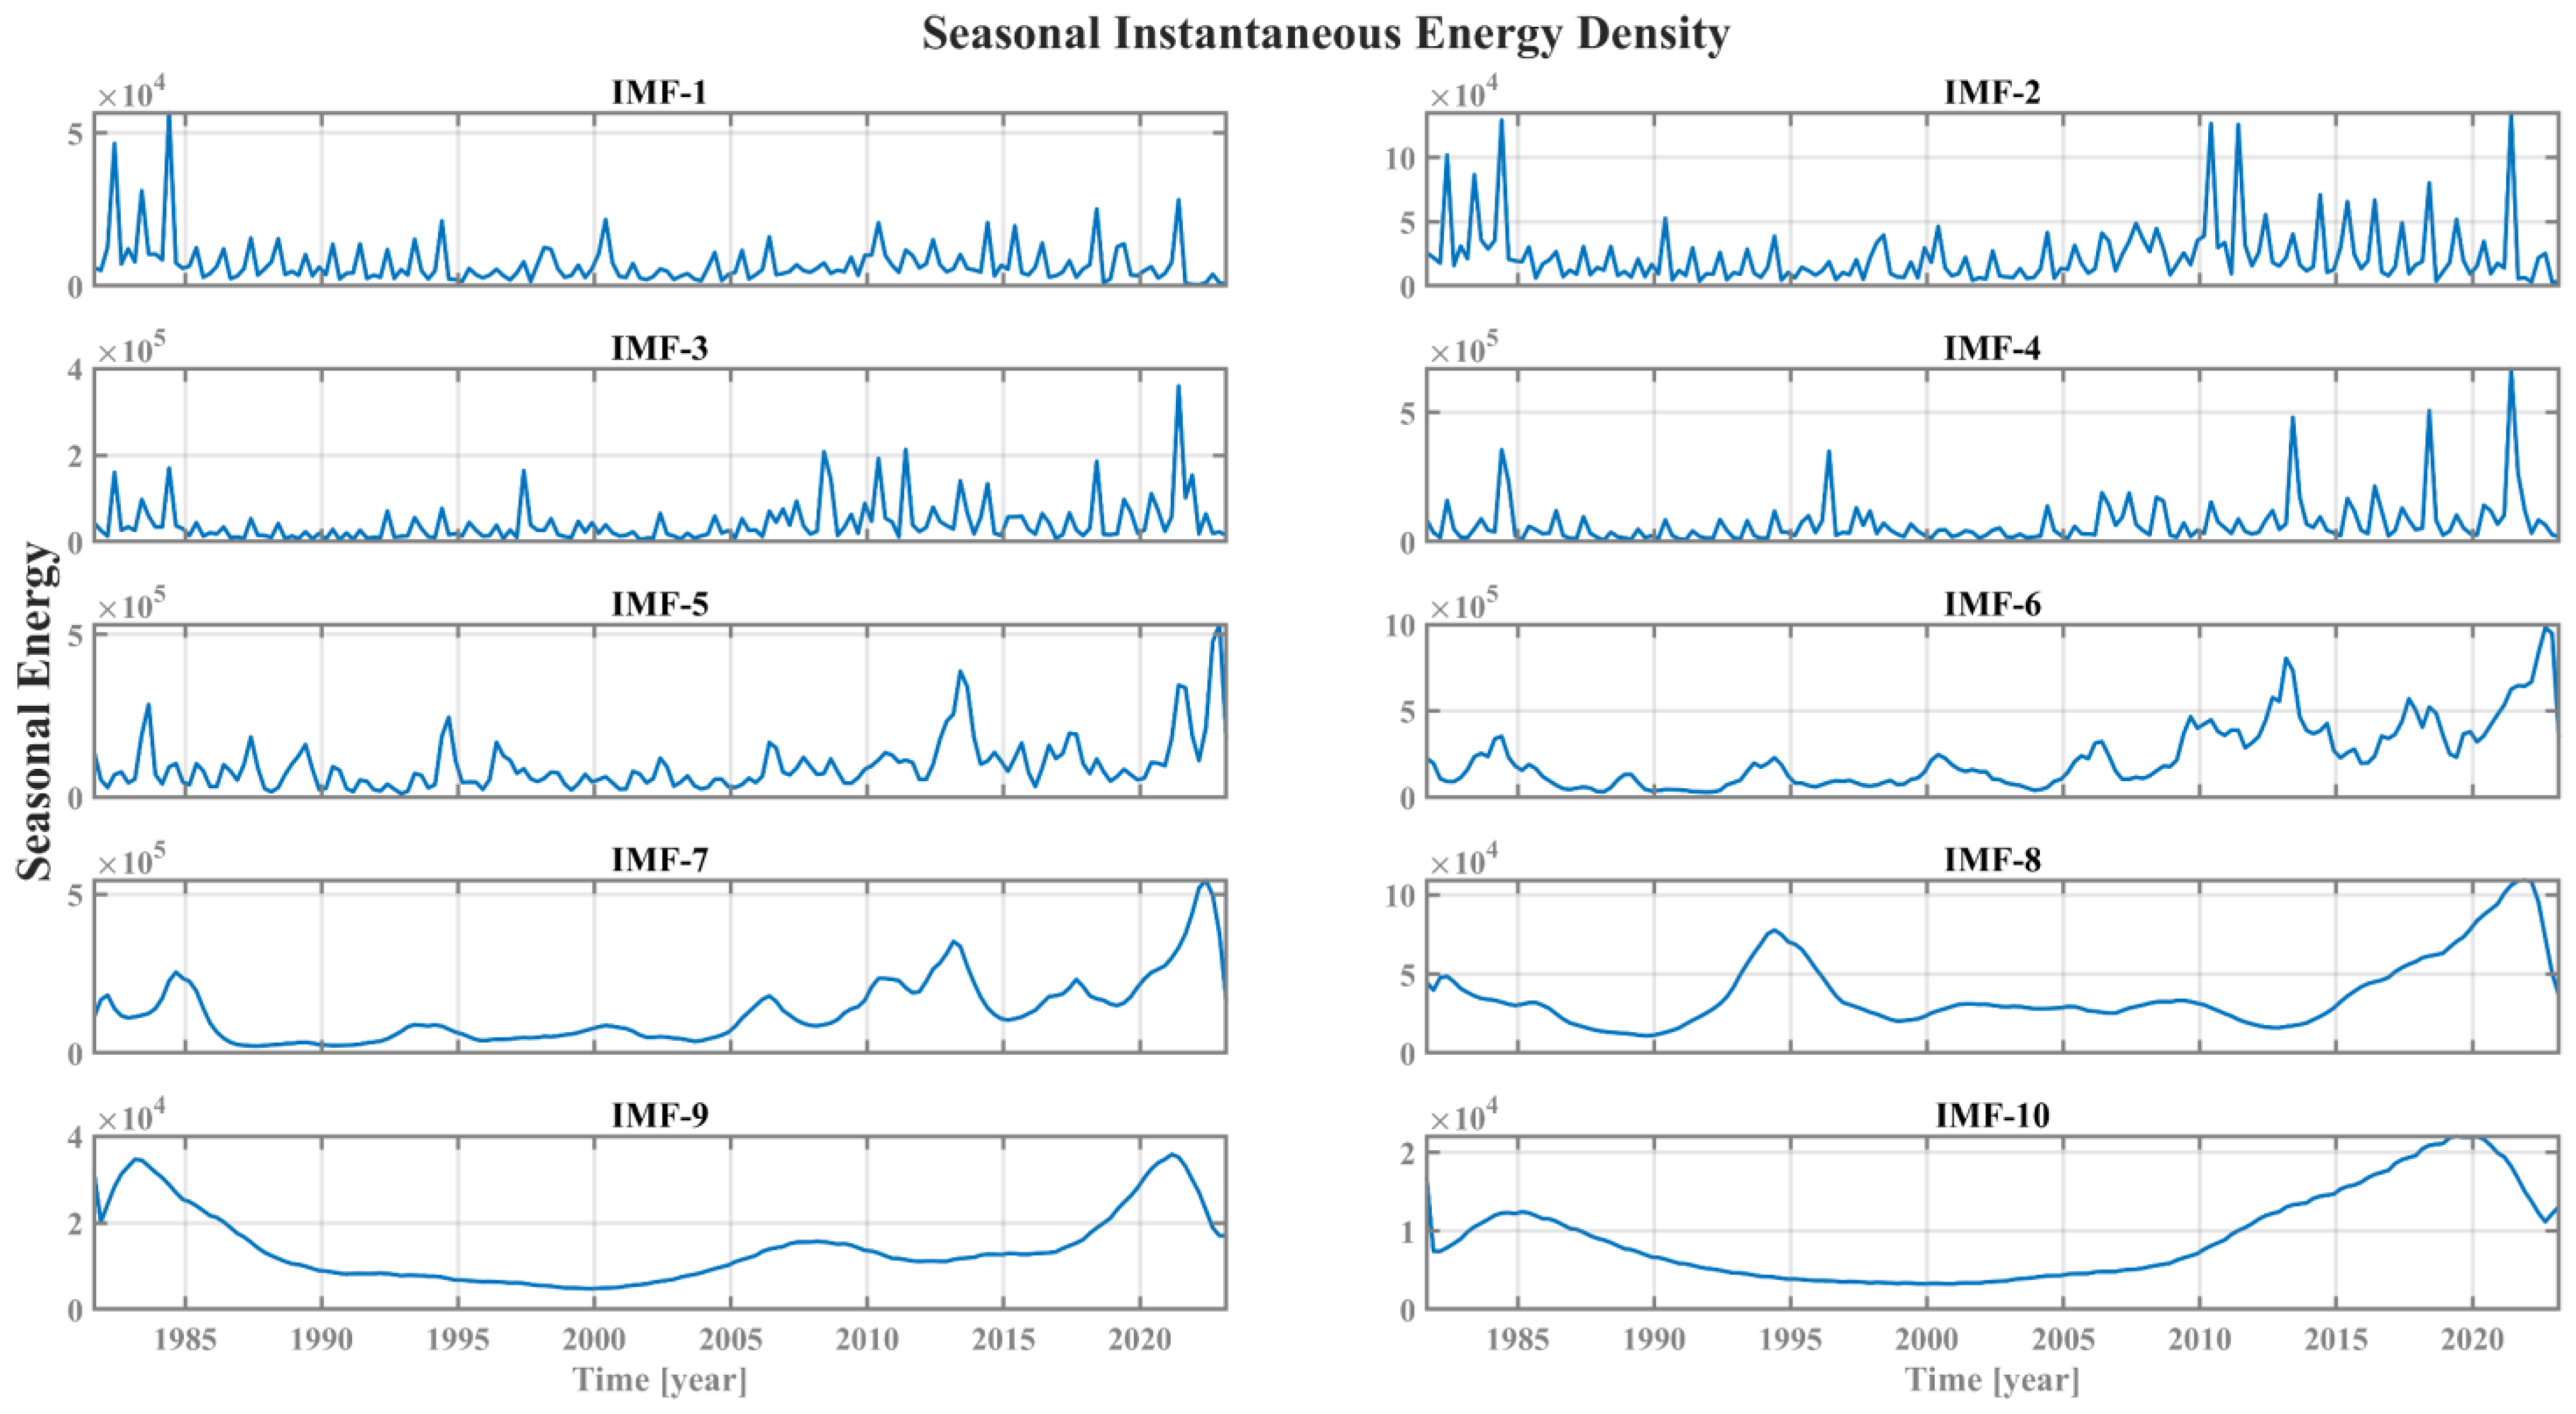
The temporal evolution of IE with respect to the respective IMF is presented in Figure 8. As already confirmed from Figure 4, Figure 5, Figure 6 and Figure 7, the seasonality in the IE variations is clearly observed only for low-mode IMFs (IMF-1 through IMF-4); note that the time with a local peaked IE level corresponds to every summer. Overall, from 2010 onwards, the IE level continues to increase after a long-lasting duration of low IE levels, except for the initial short-term peaks. This could be mainly due to a long-term warming trend [43].
A noticeable intra-wave and inter-wave frequency modulation seems to emerge for higher mode IMFs (IMF-5 through IMF-10), and for the two modes of IMF-5 and IMF-6, the peak-to-peak timescale tends to get shorter from 2005 onwards. Since the timescale of these two modes is nearly one year, any forcing with an annual timescale could be related to this behavior. The so-called EJS SST index, computed by performing the area-weighted average on SST over the western half of the EJS (33–43° N, 128–136° E) [48], has shown a statistically significant peak at the annual timescale. That is, there could be a decadal change in SSTA variability in the western part of the EJS, including the EKB.

3.3. Spatial Pattern of Degree Distribution of IMF Networks
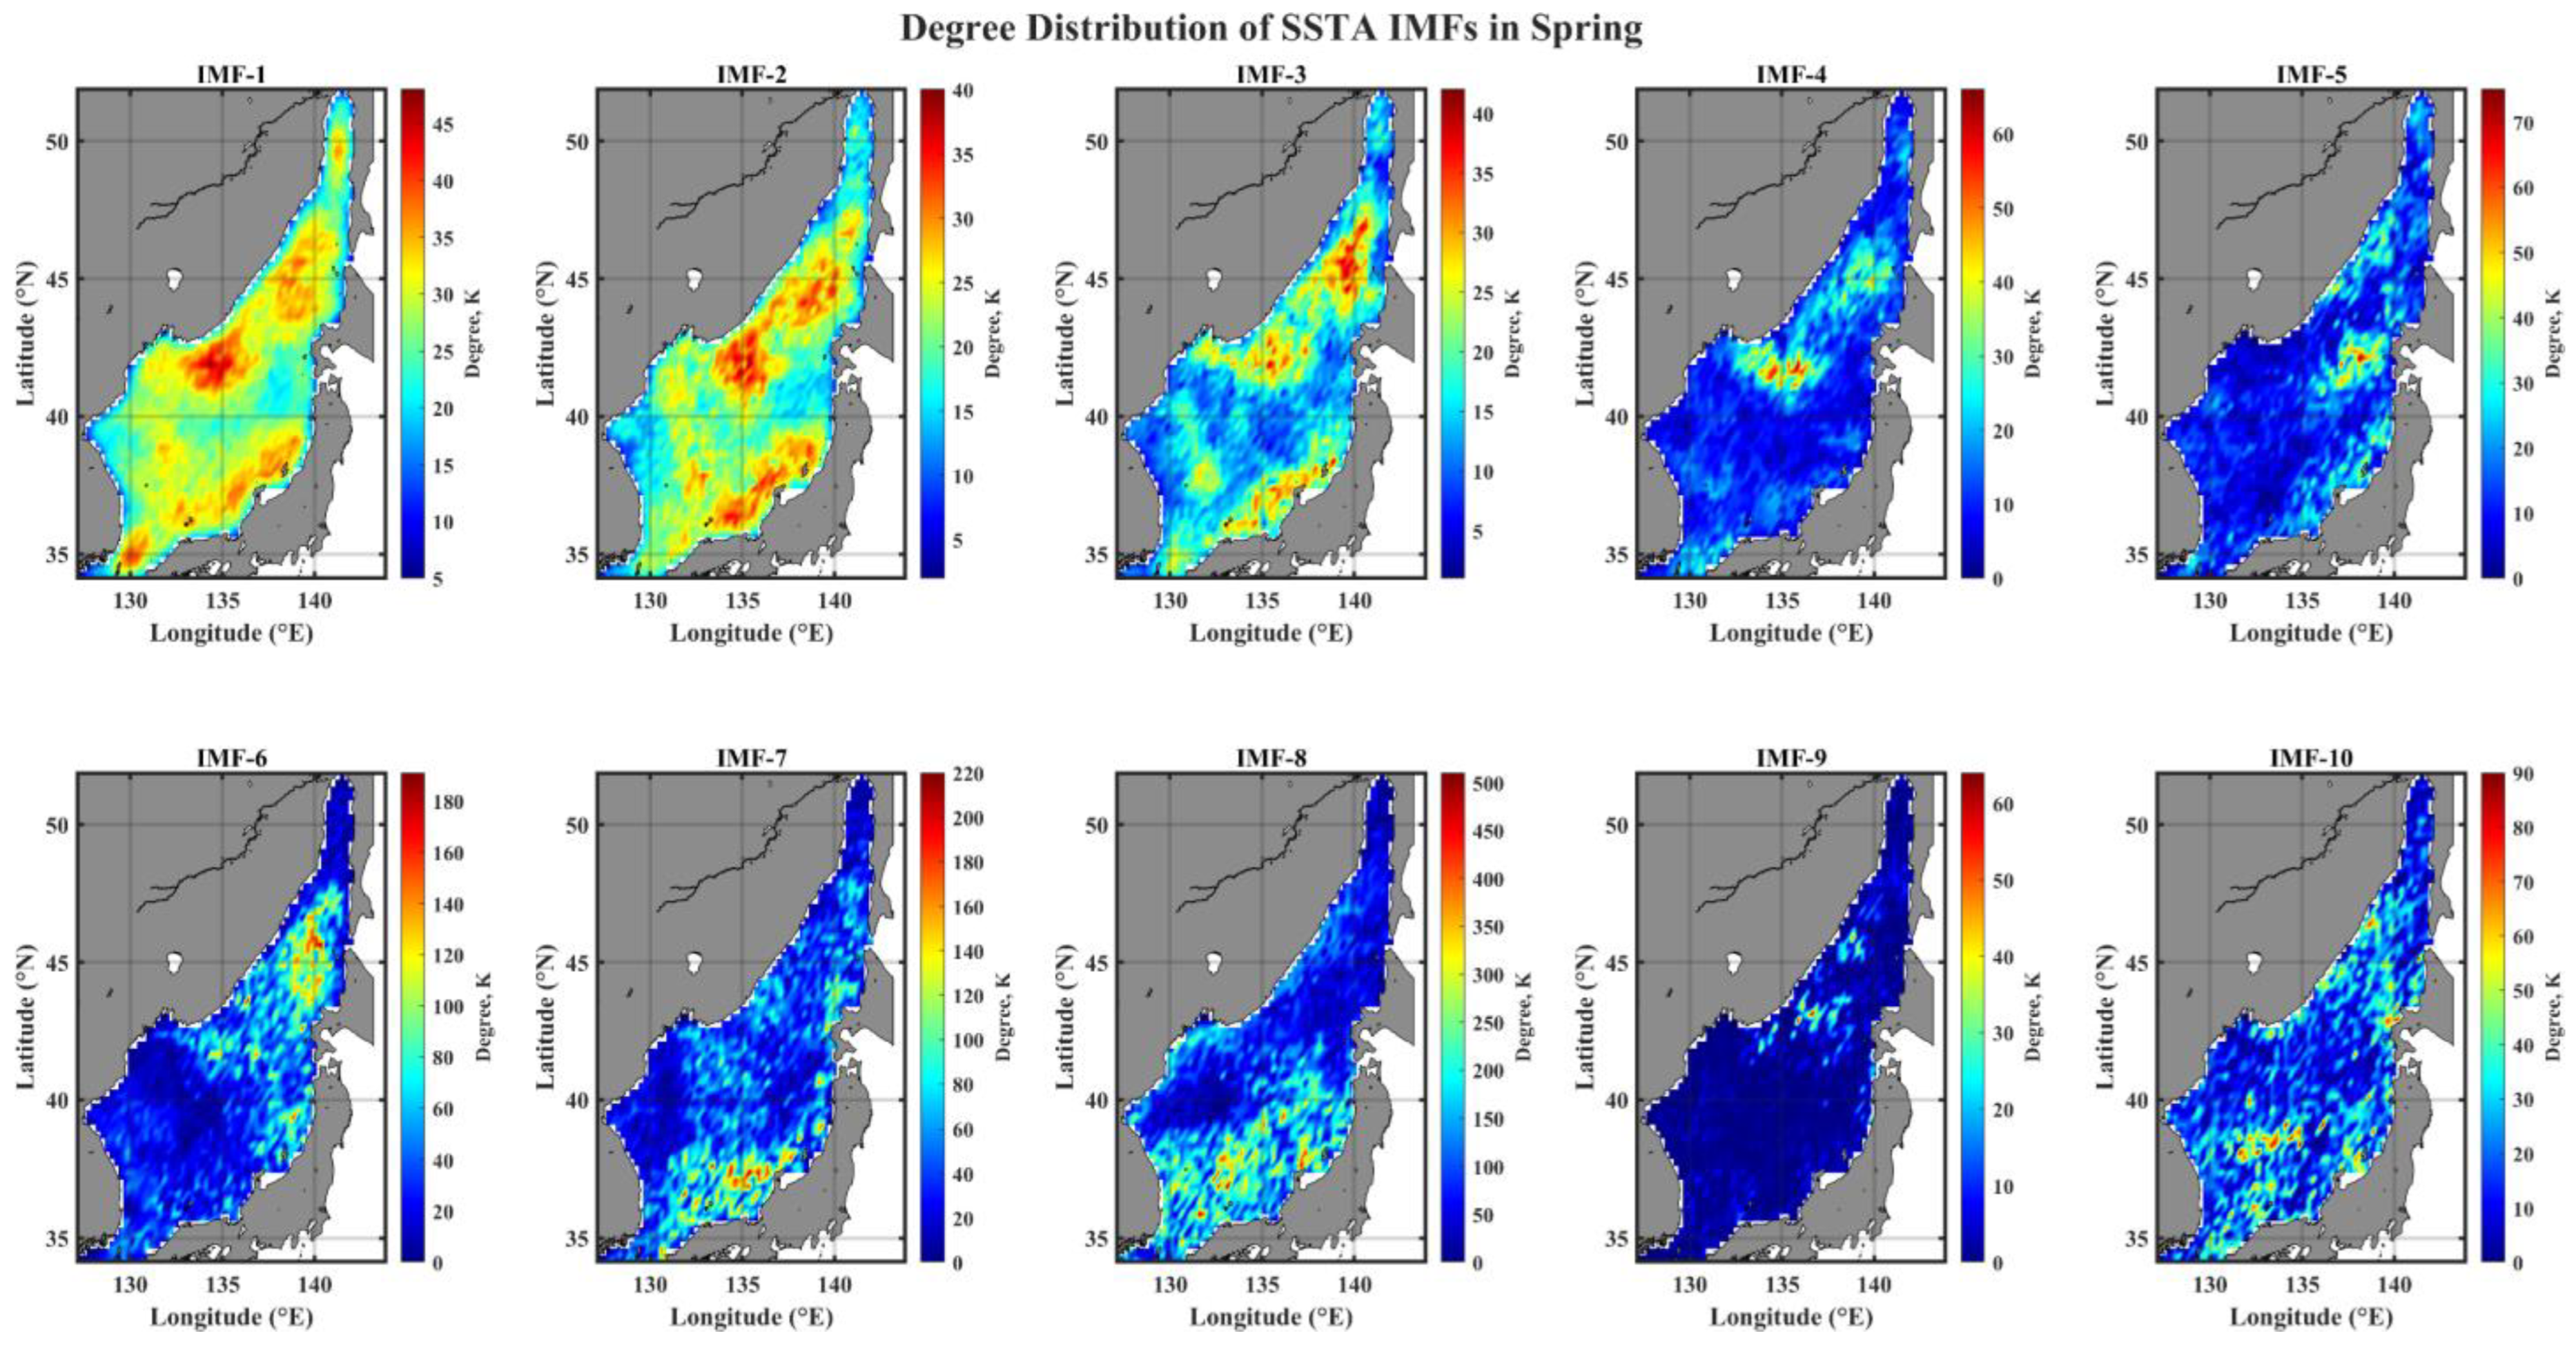
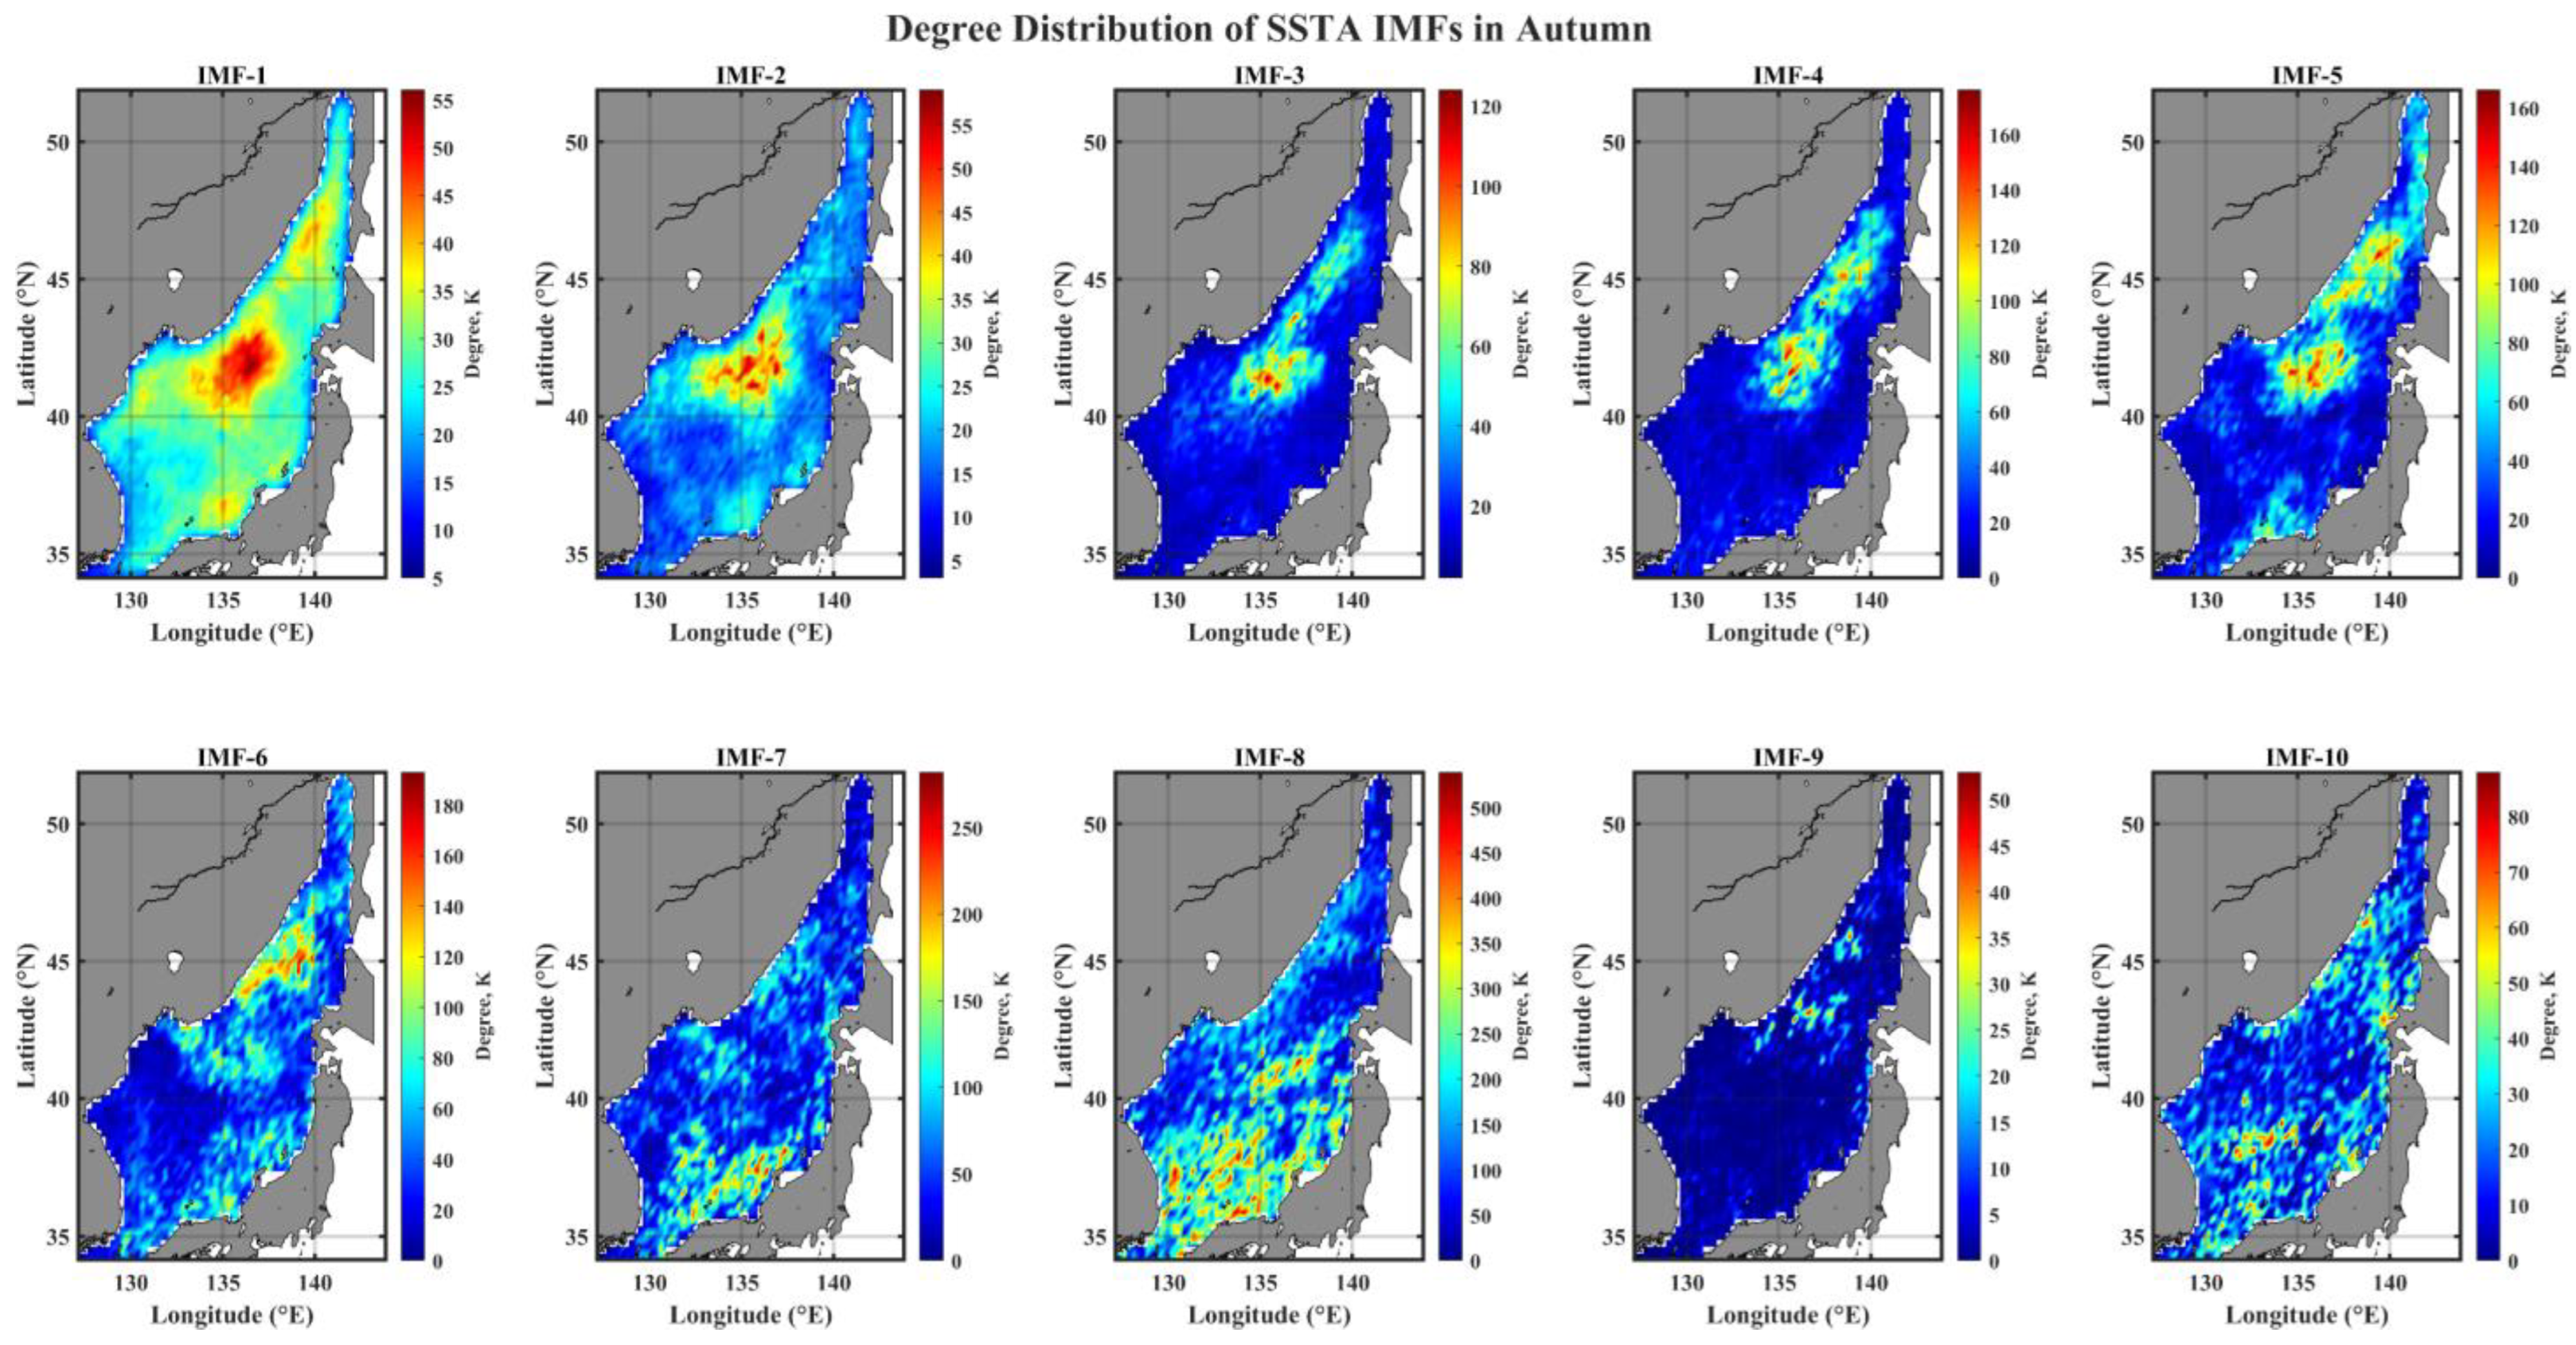
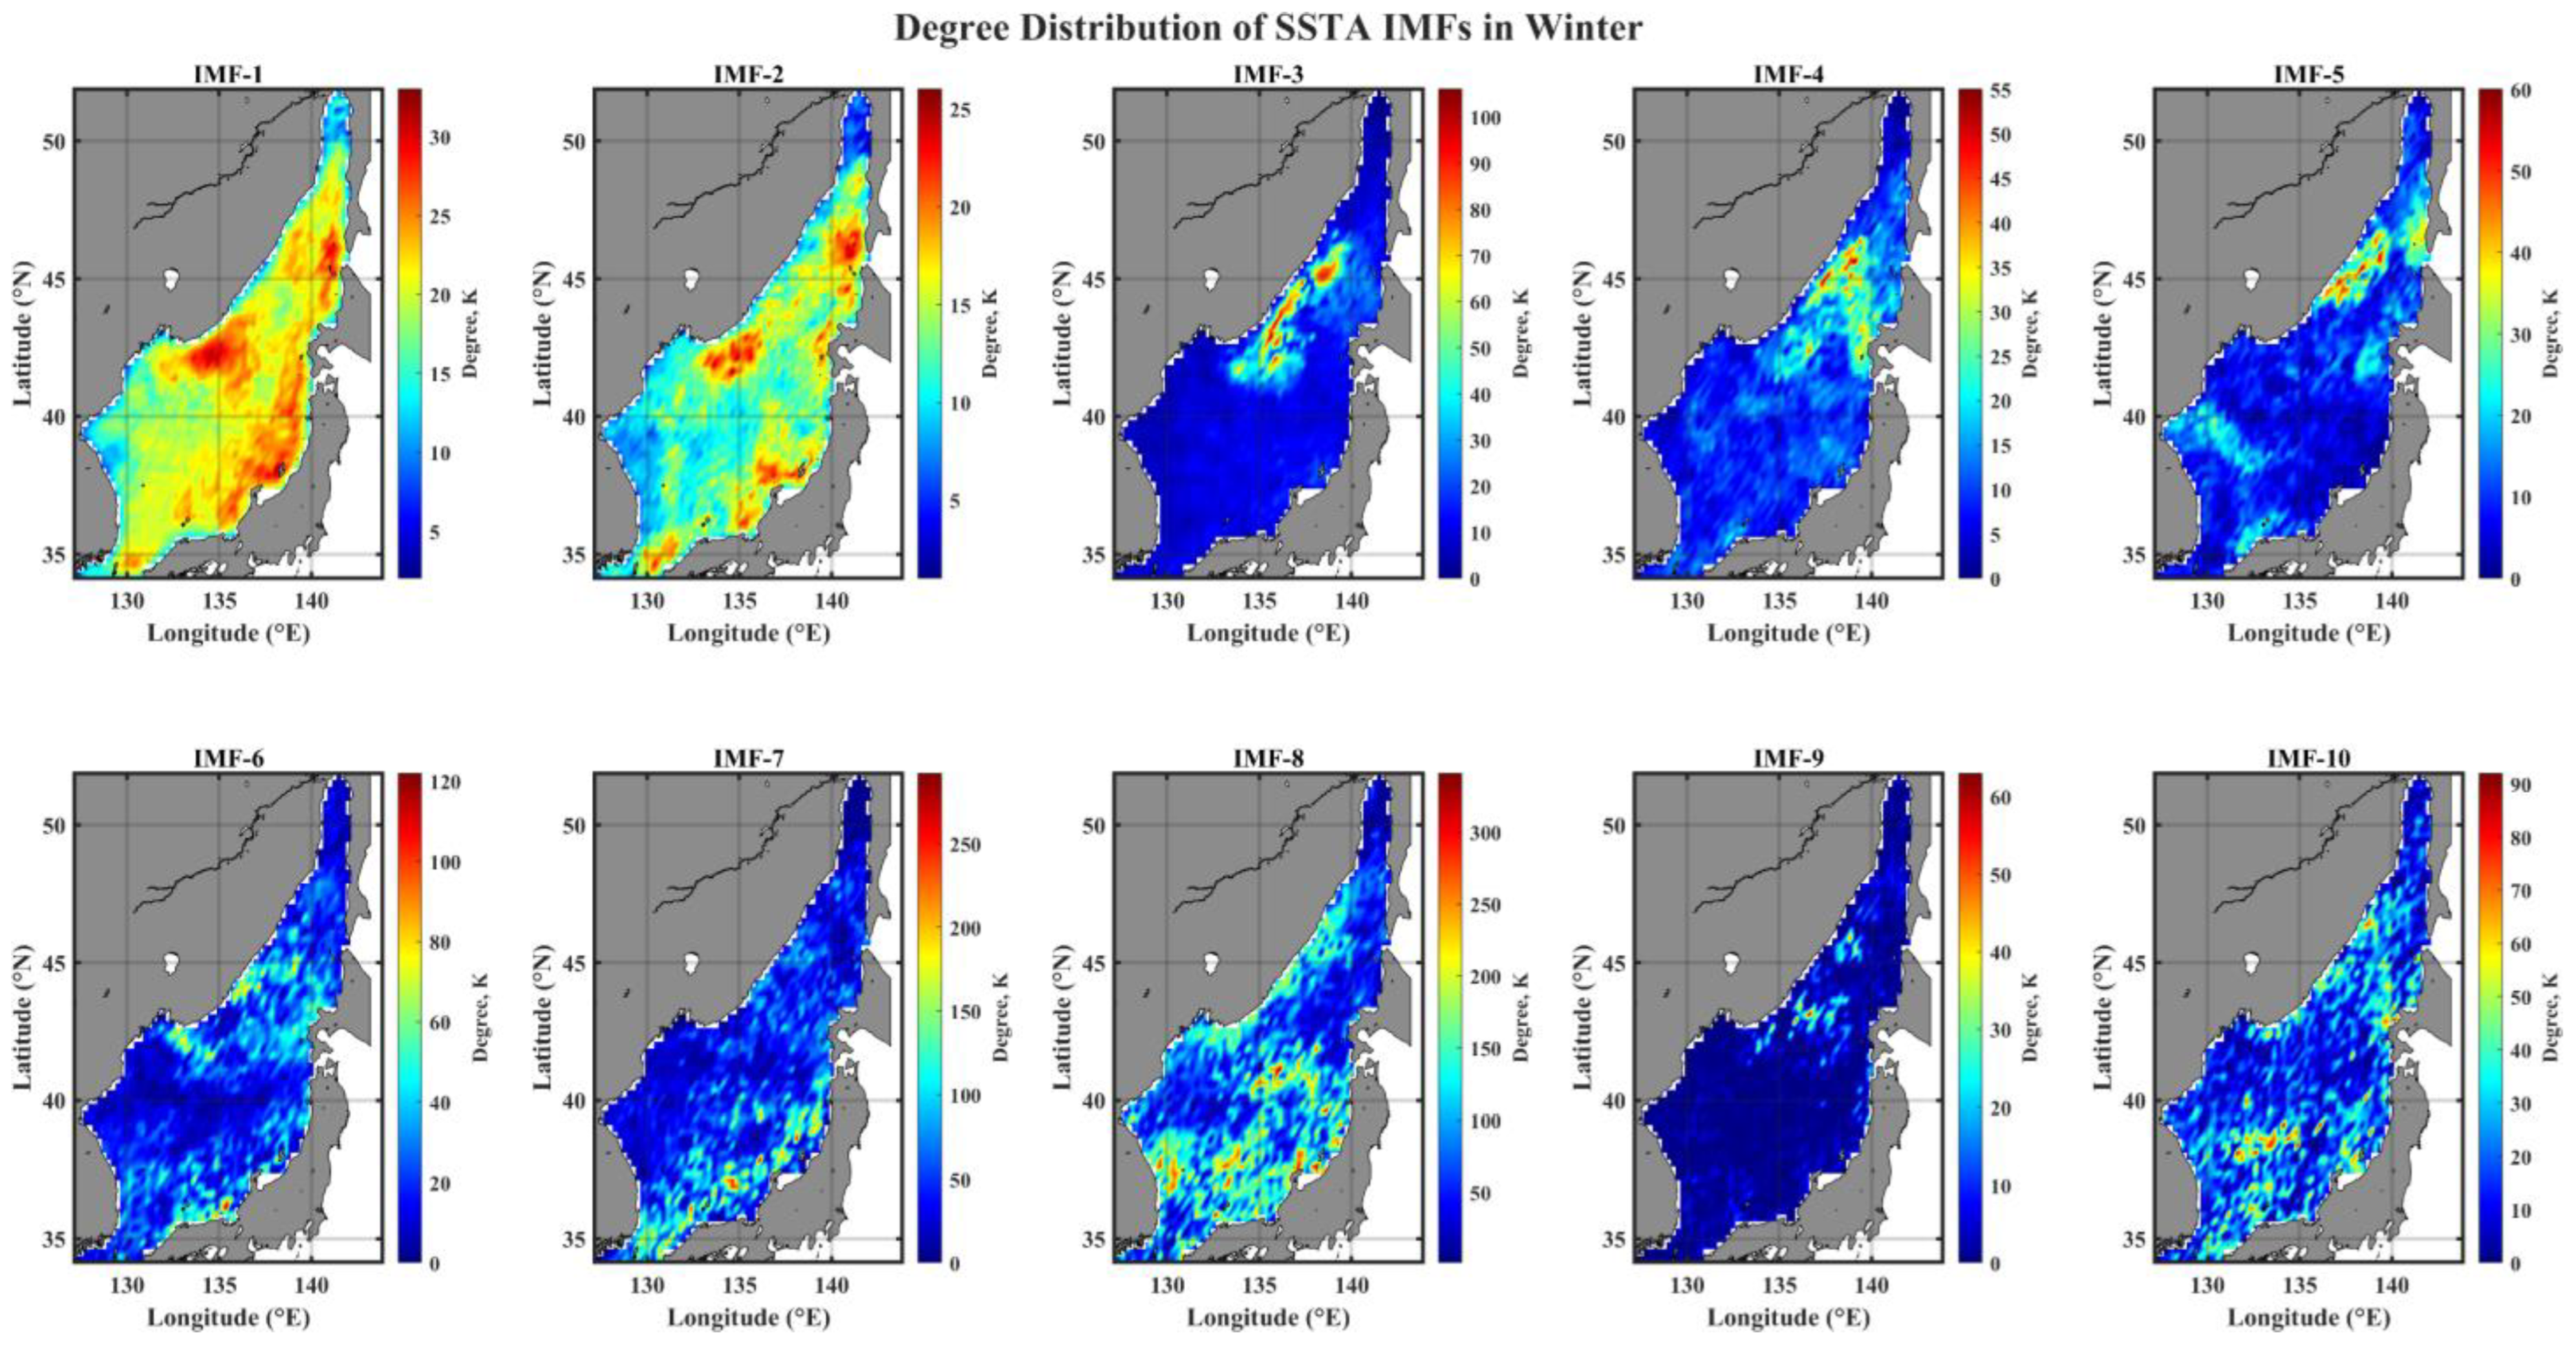
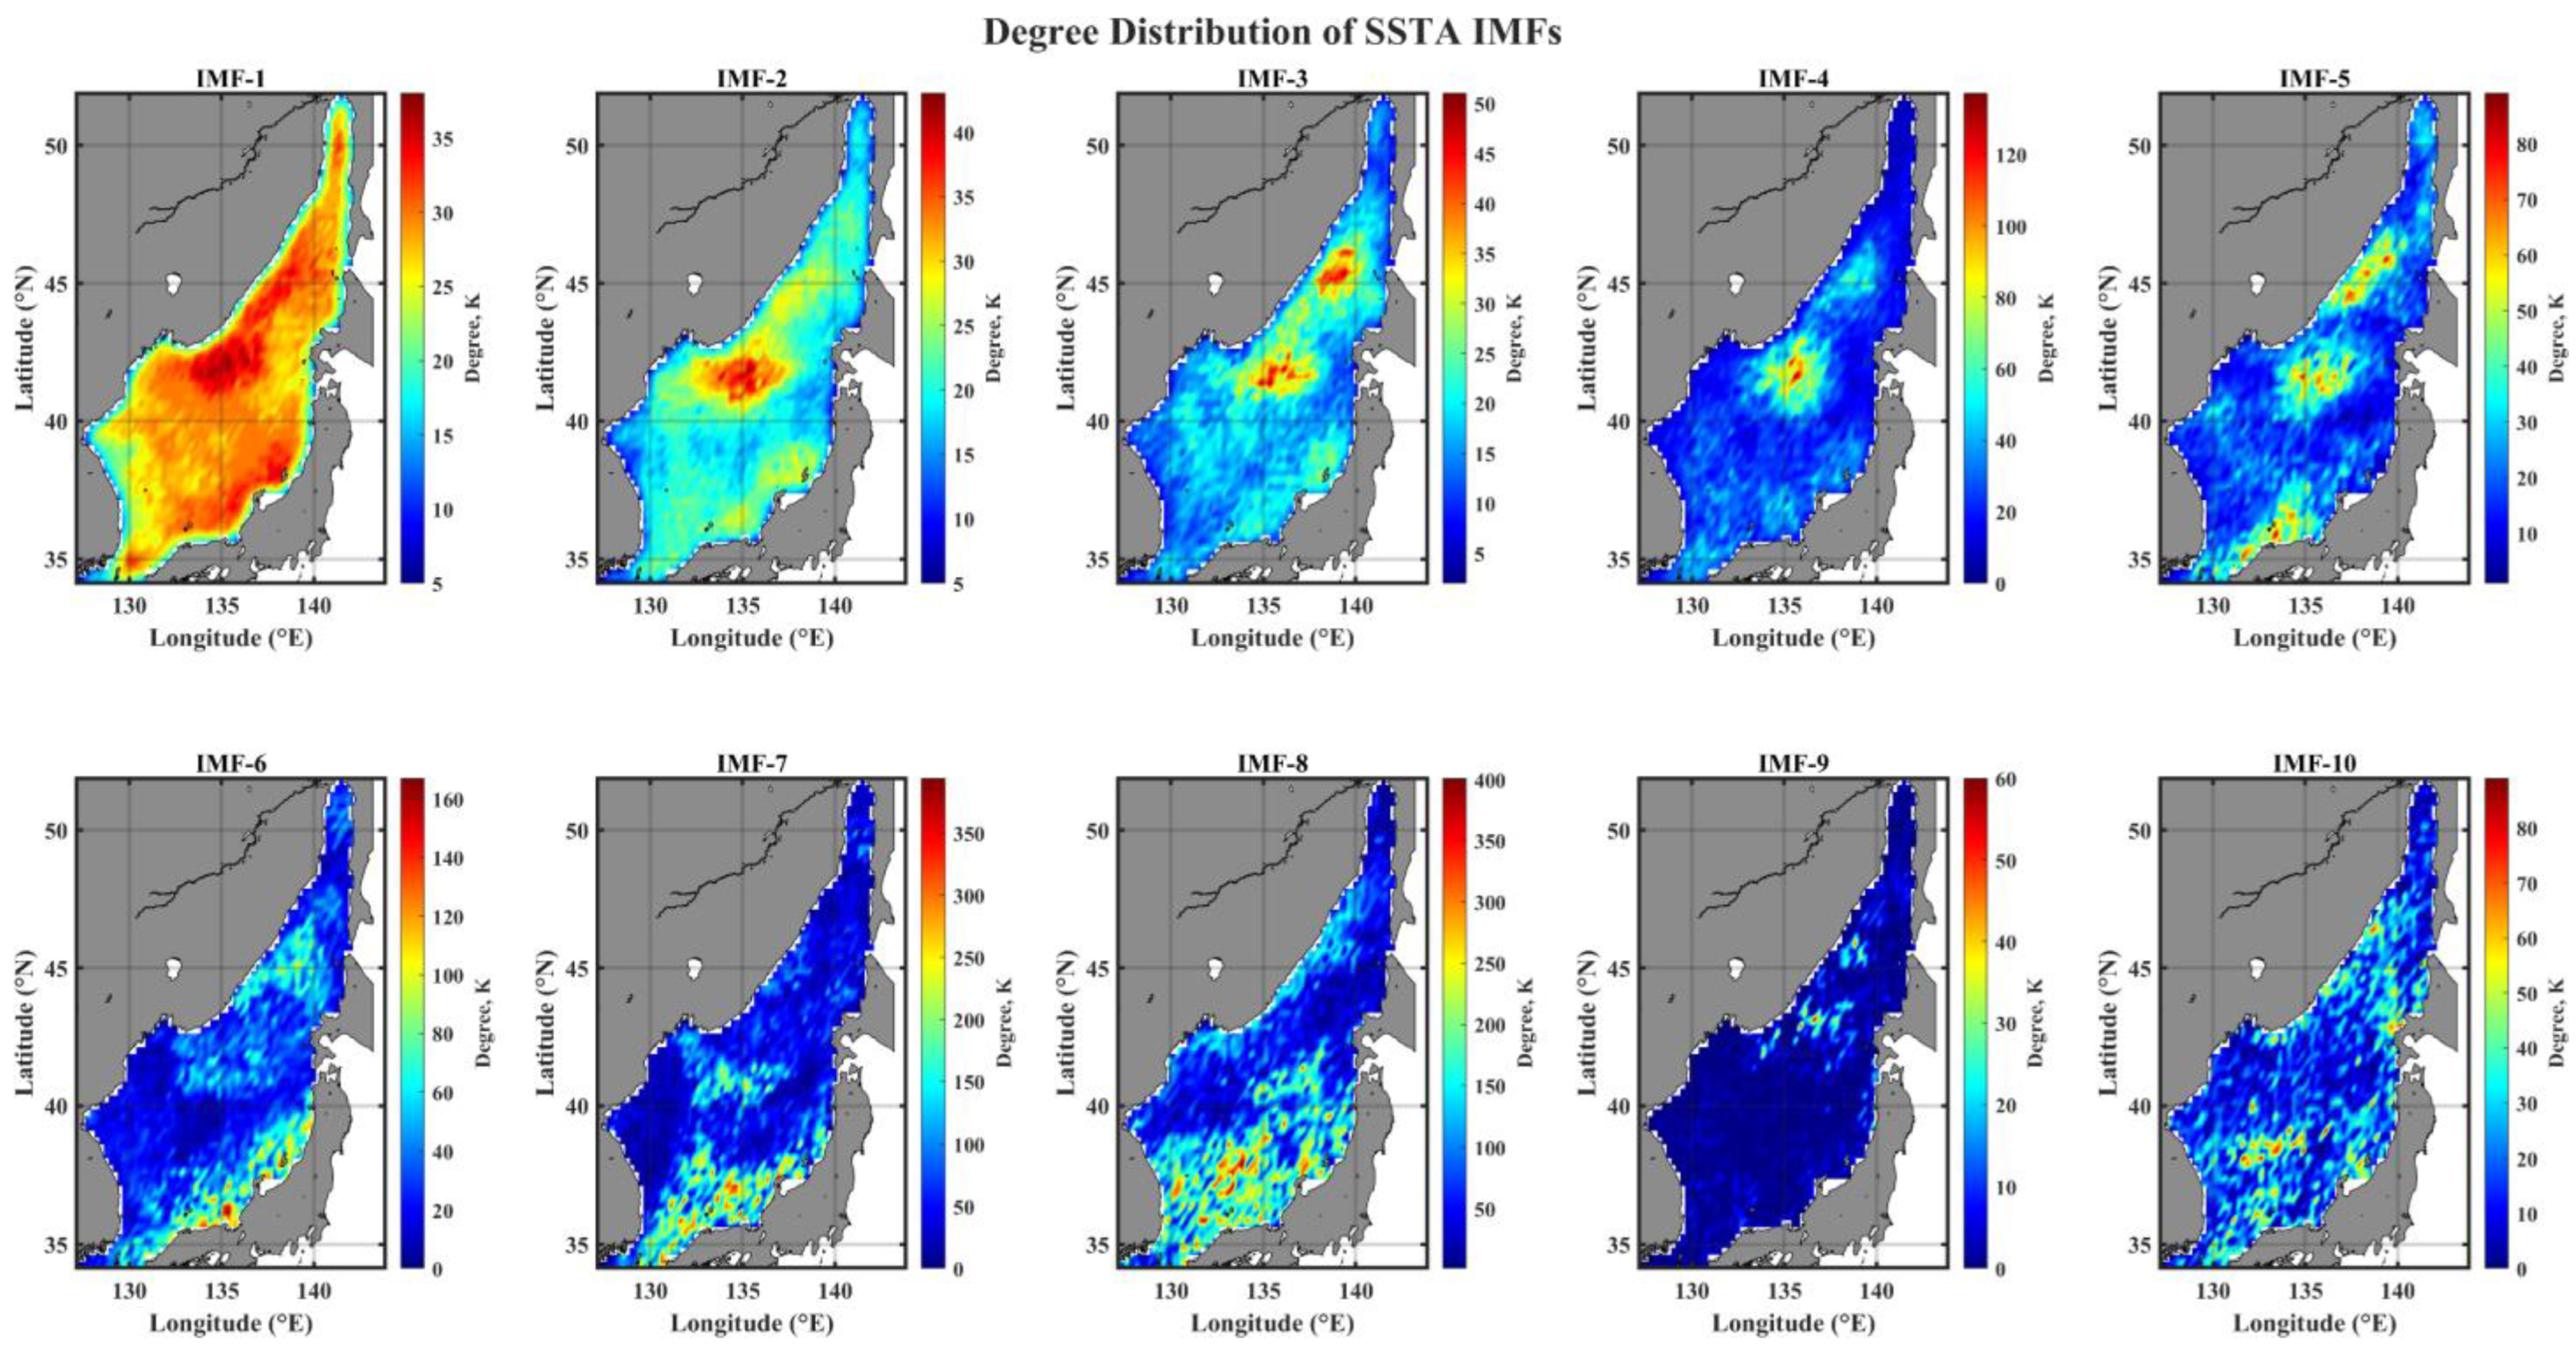
From degree (connectivity) spatial patterns of IMF networks (Figure 9, Figure 10, Figure 11, Figure 12 and Figure 13), we first detect the hub-region where densely connected nodes form a cluster. As shown in Figure 9, the low-mode IMF networks (IMF-2 through IMF-5) have a hub-spot in the northern part of the EJS, near the ESIW formation site. However, in the high-mode IMF networks (IMF-6 through IMF-8), the hub-spots suddenly appear in the southern area of the EJS near the coastal area of Japan and extend from the Japan coast towards the interior with increasing mode numbers. Since the level of PCC indicates the degree of synchrony of a pair of oscillatory signals like in this study, any atmospheric forcing with a shorter timescale seems to be dominant in the northern part of the EJS, while any advective forcing with a longer timescale seems to play a significant role in the southern EJS; note that most flowing-in waters enter through the KTS.
The seasonality in the topology of IMF networks is clearly observed for the monthly to semiannual time scales (IMF-3 through IMF-5 in Figure 11 and Figure 13) in the summer and winter seasons, as confirmed in the IE spatial patterns. The difference is the way of partitioning the EJS; in the IE distribution, the EJS is divided into the north-western and north-eastern parts (Figure 5 and Figure 7), while in a degree distribution, the EJS is divided into the north and south parts (Figure 11 and Figure 13). This different space-dividing behavior is fundamentally attributed to the magnitude and the spatial range of any forcing, respectively. The IE level is directly connected to the magnitude of forcing, while the level of degree or connectivity (based on the level of PCC values) is deeply related to the fluctuating behavior (relating to phase difference or lag time).
A noticeable thing is that there is a clear contrast between the spatial extents of PCC among nodes in the north and south of the EJS. There could be a substantial effect of a persistent gyre on the correlation structure in the northern EJS (Figure 1). It should be noted that the persistent hub-spot observed in low-mode IMFs (IMF-2 through IMF-5 in Figure 9) resides in the interior of the gyre.
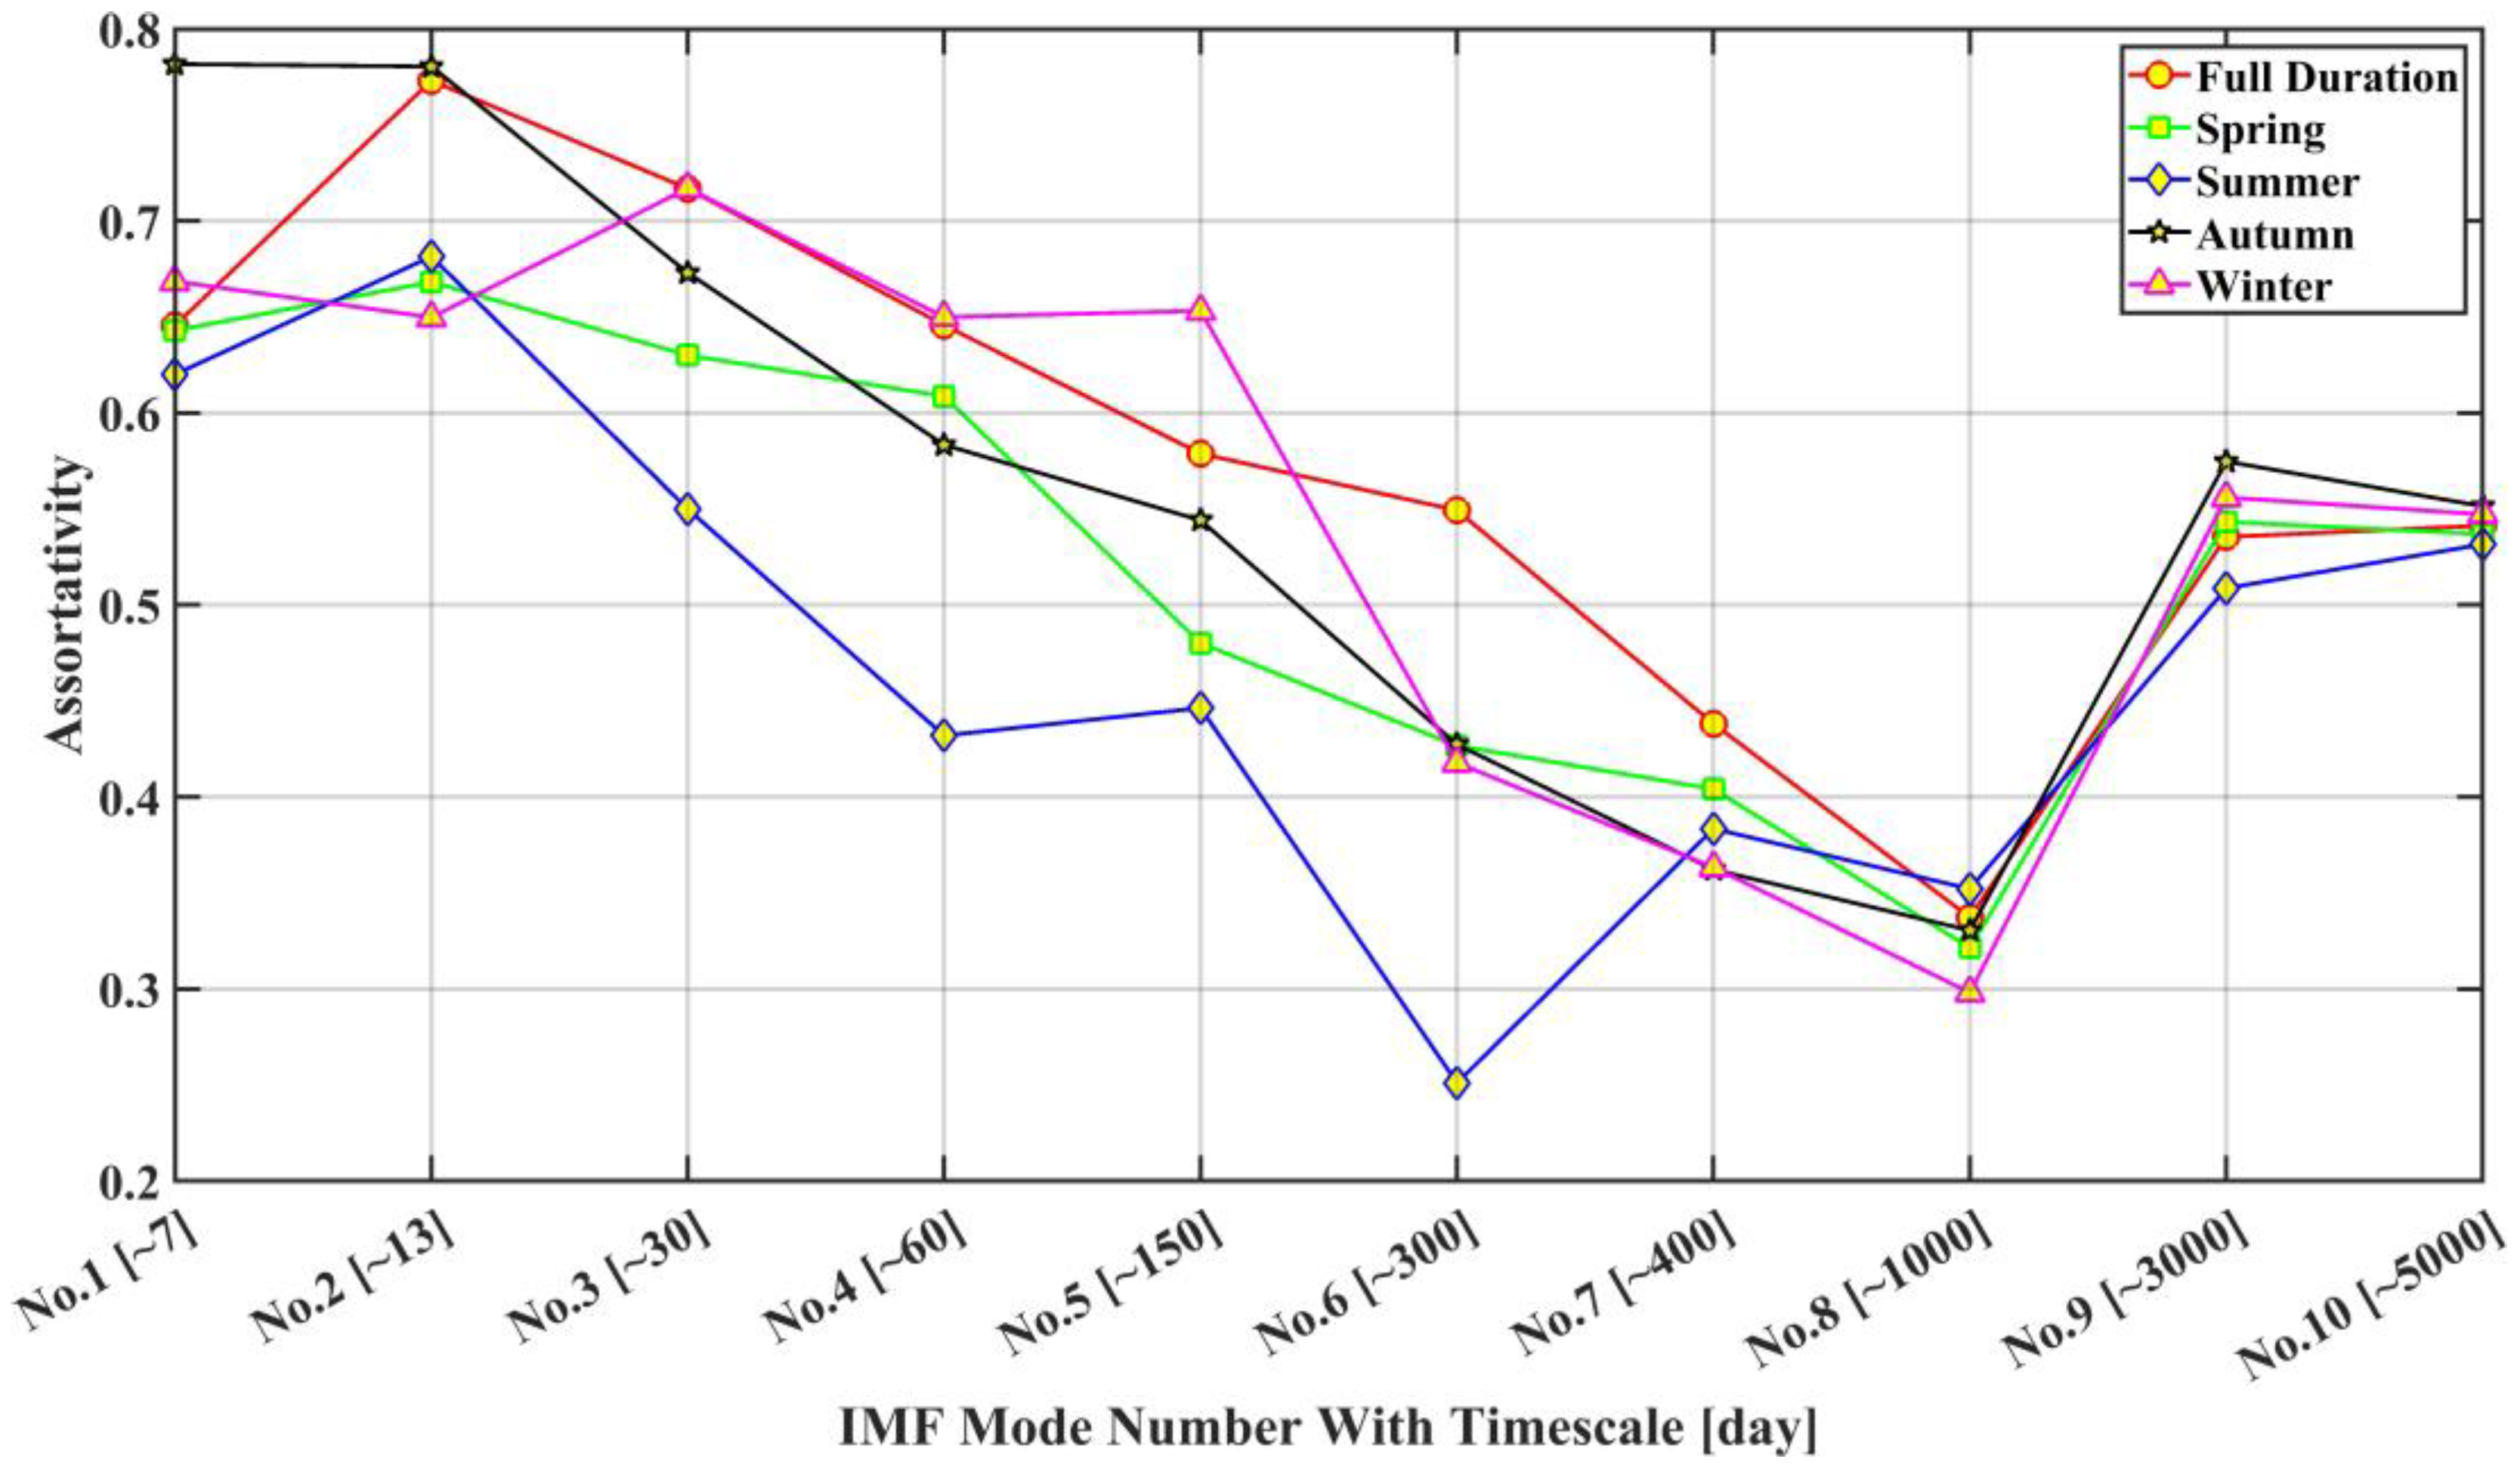
In addition, the connectivity structure of all IMF networks is explored via assortativity. As shown in Figure 14, all networks are assortative, that is, hubs tend to make a greater cluster; this behavior is seen in Figure 9, Figure 10, Figure 11, Figure 12 and Figure 13. Figure 14 shows the varying level of assortativity of all IMF networks with respect to mode number; irrespective of seasons, there appears to be a similar behavior of a high value for low-mode IMF networks and a low value for high-mode ones, except for IMF-9 and IMF-10. This persistently positive assortativity in all IMF networks (Figure 14) gives some clues on the spatiotemporal extents of any forcing; forcing with smaller timescales tends to have a narrow spatial coverage, while forcing with larger timescales has a wide spatial coverage. This behavioral feature could be specific to the network based on geophysical signals with oscillatory components, compared to other networks [41].
Figure 10. The same as Figure 9, except for spring (MAM).
Applsci 14 01752 g010
Figure 11. The same as Figure 9, except for summer (JJA).
Applsci 14 01752 g011
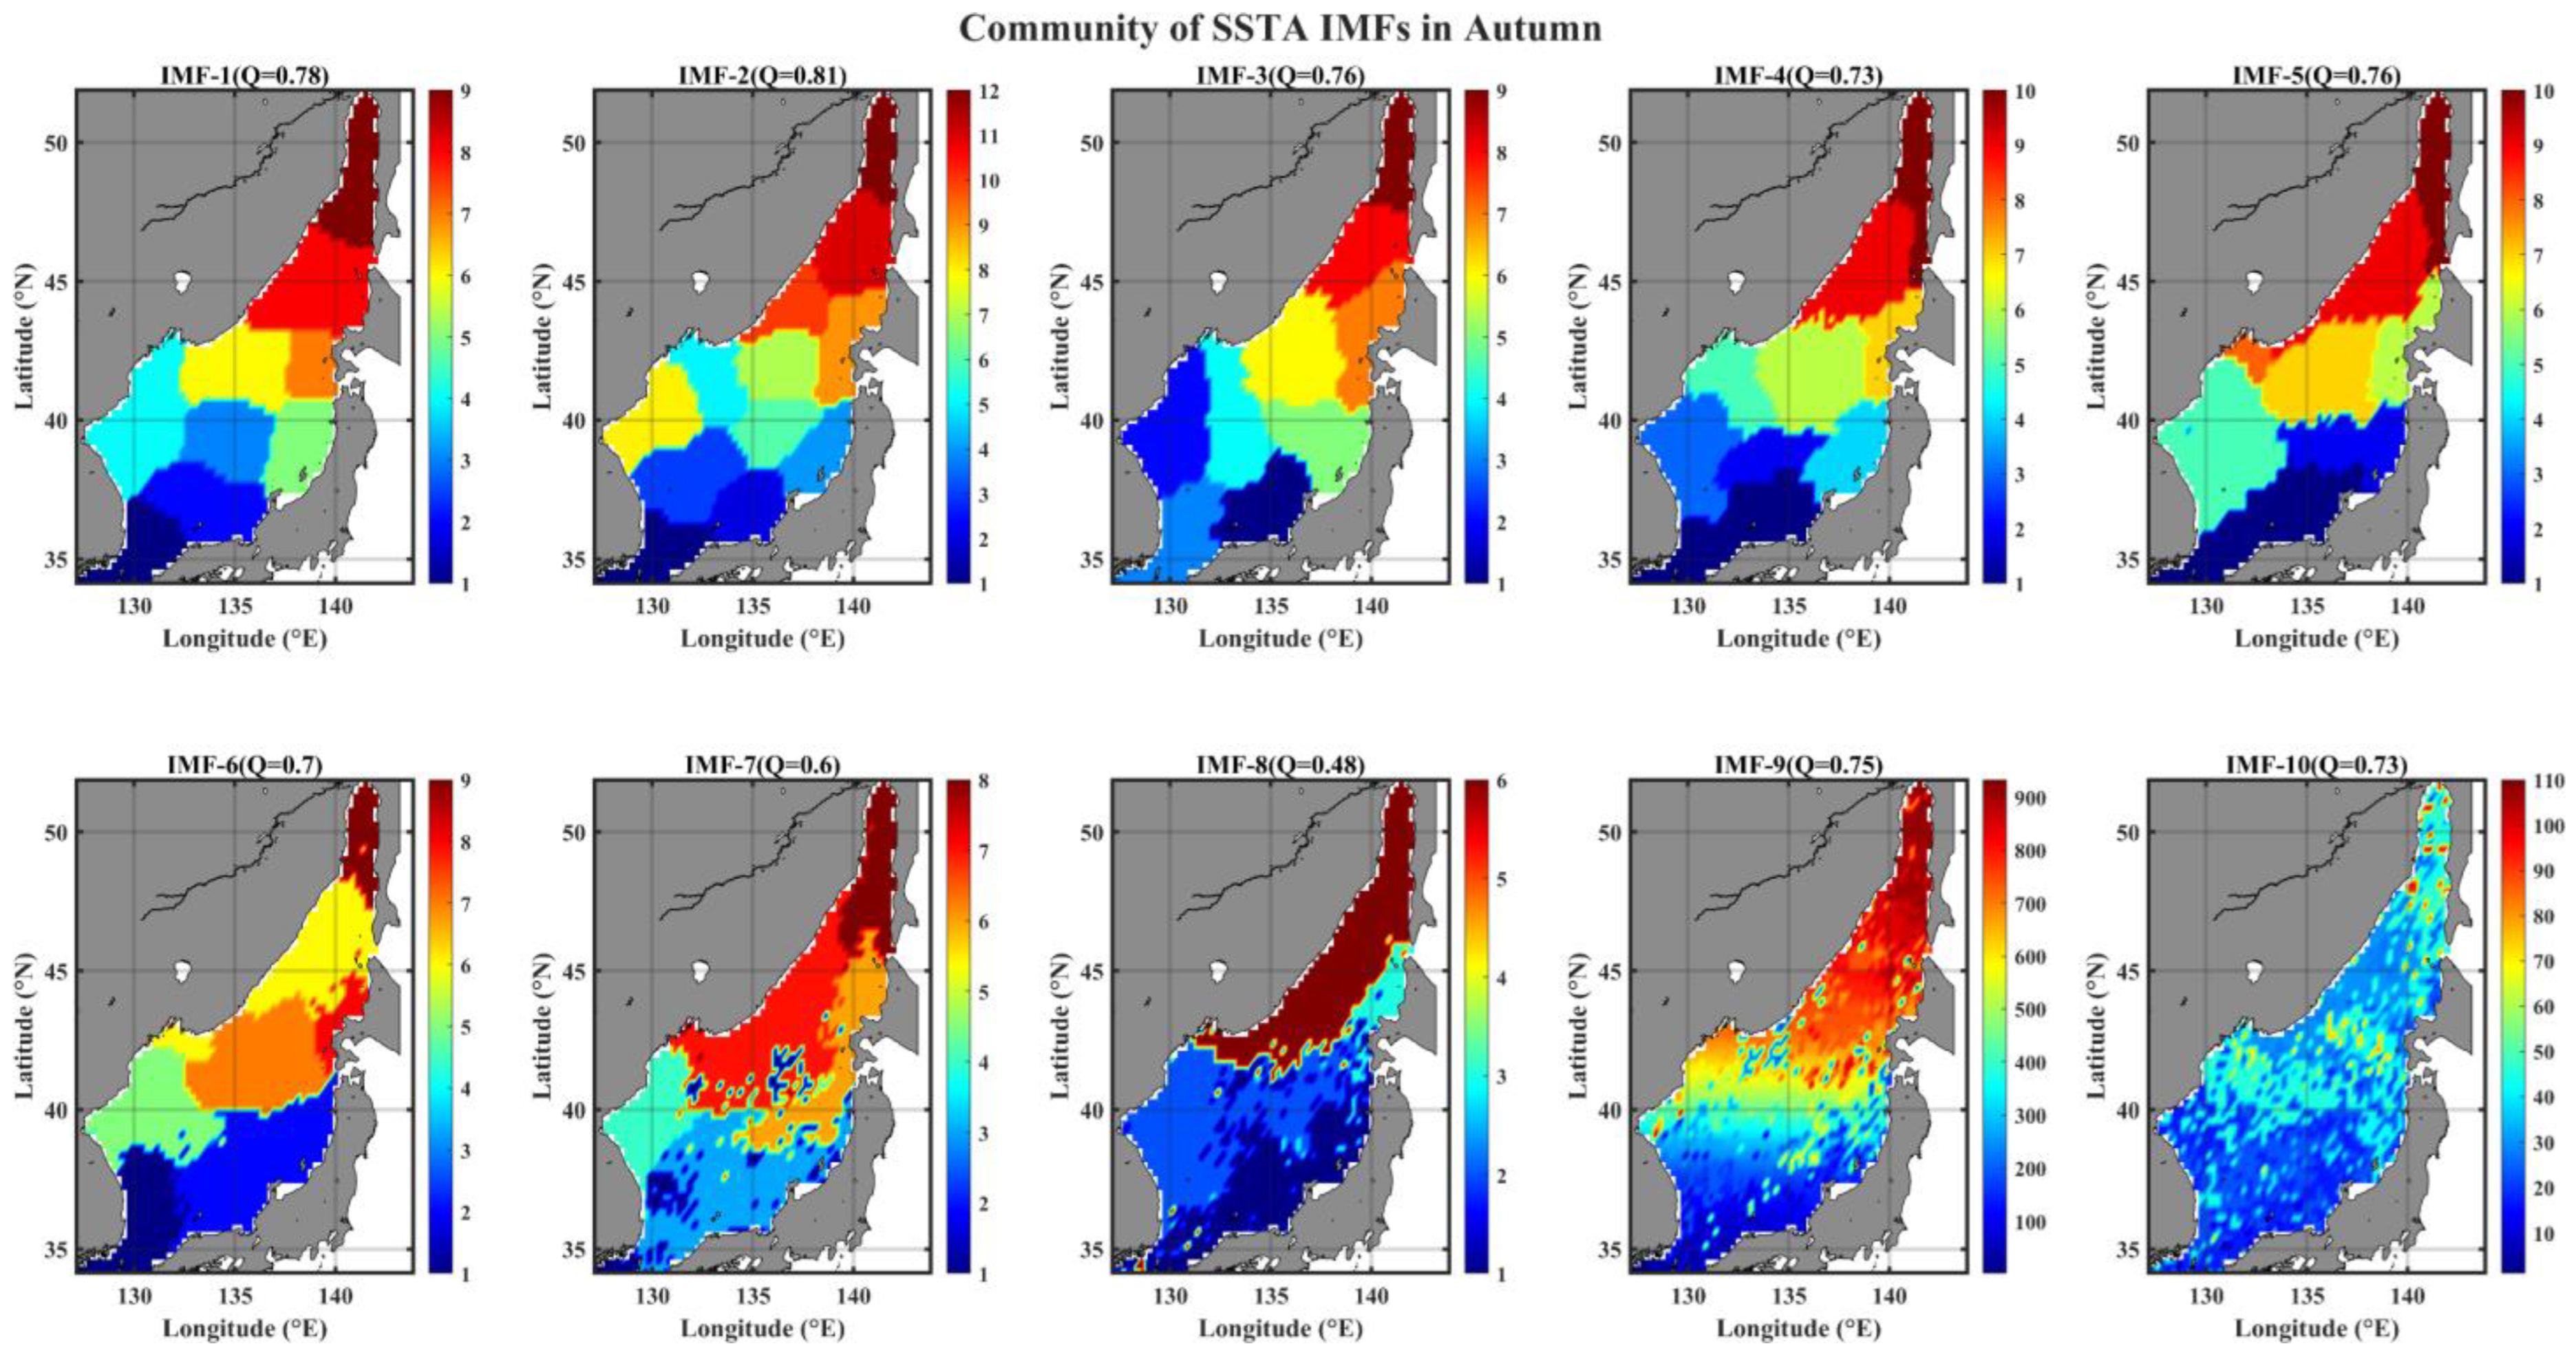
Figure 12. The same as Figure 9, except for autumn (SON).
Applsci 14 01752 g012
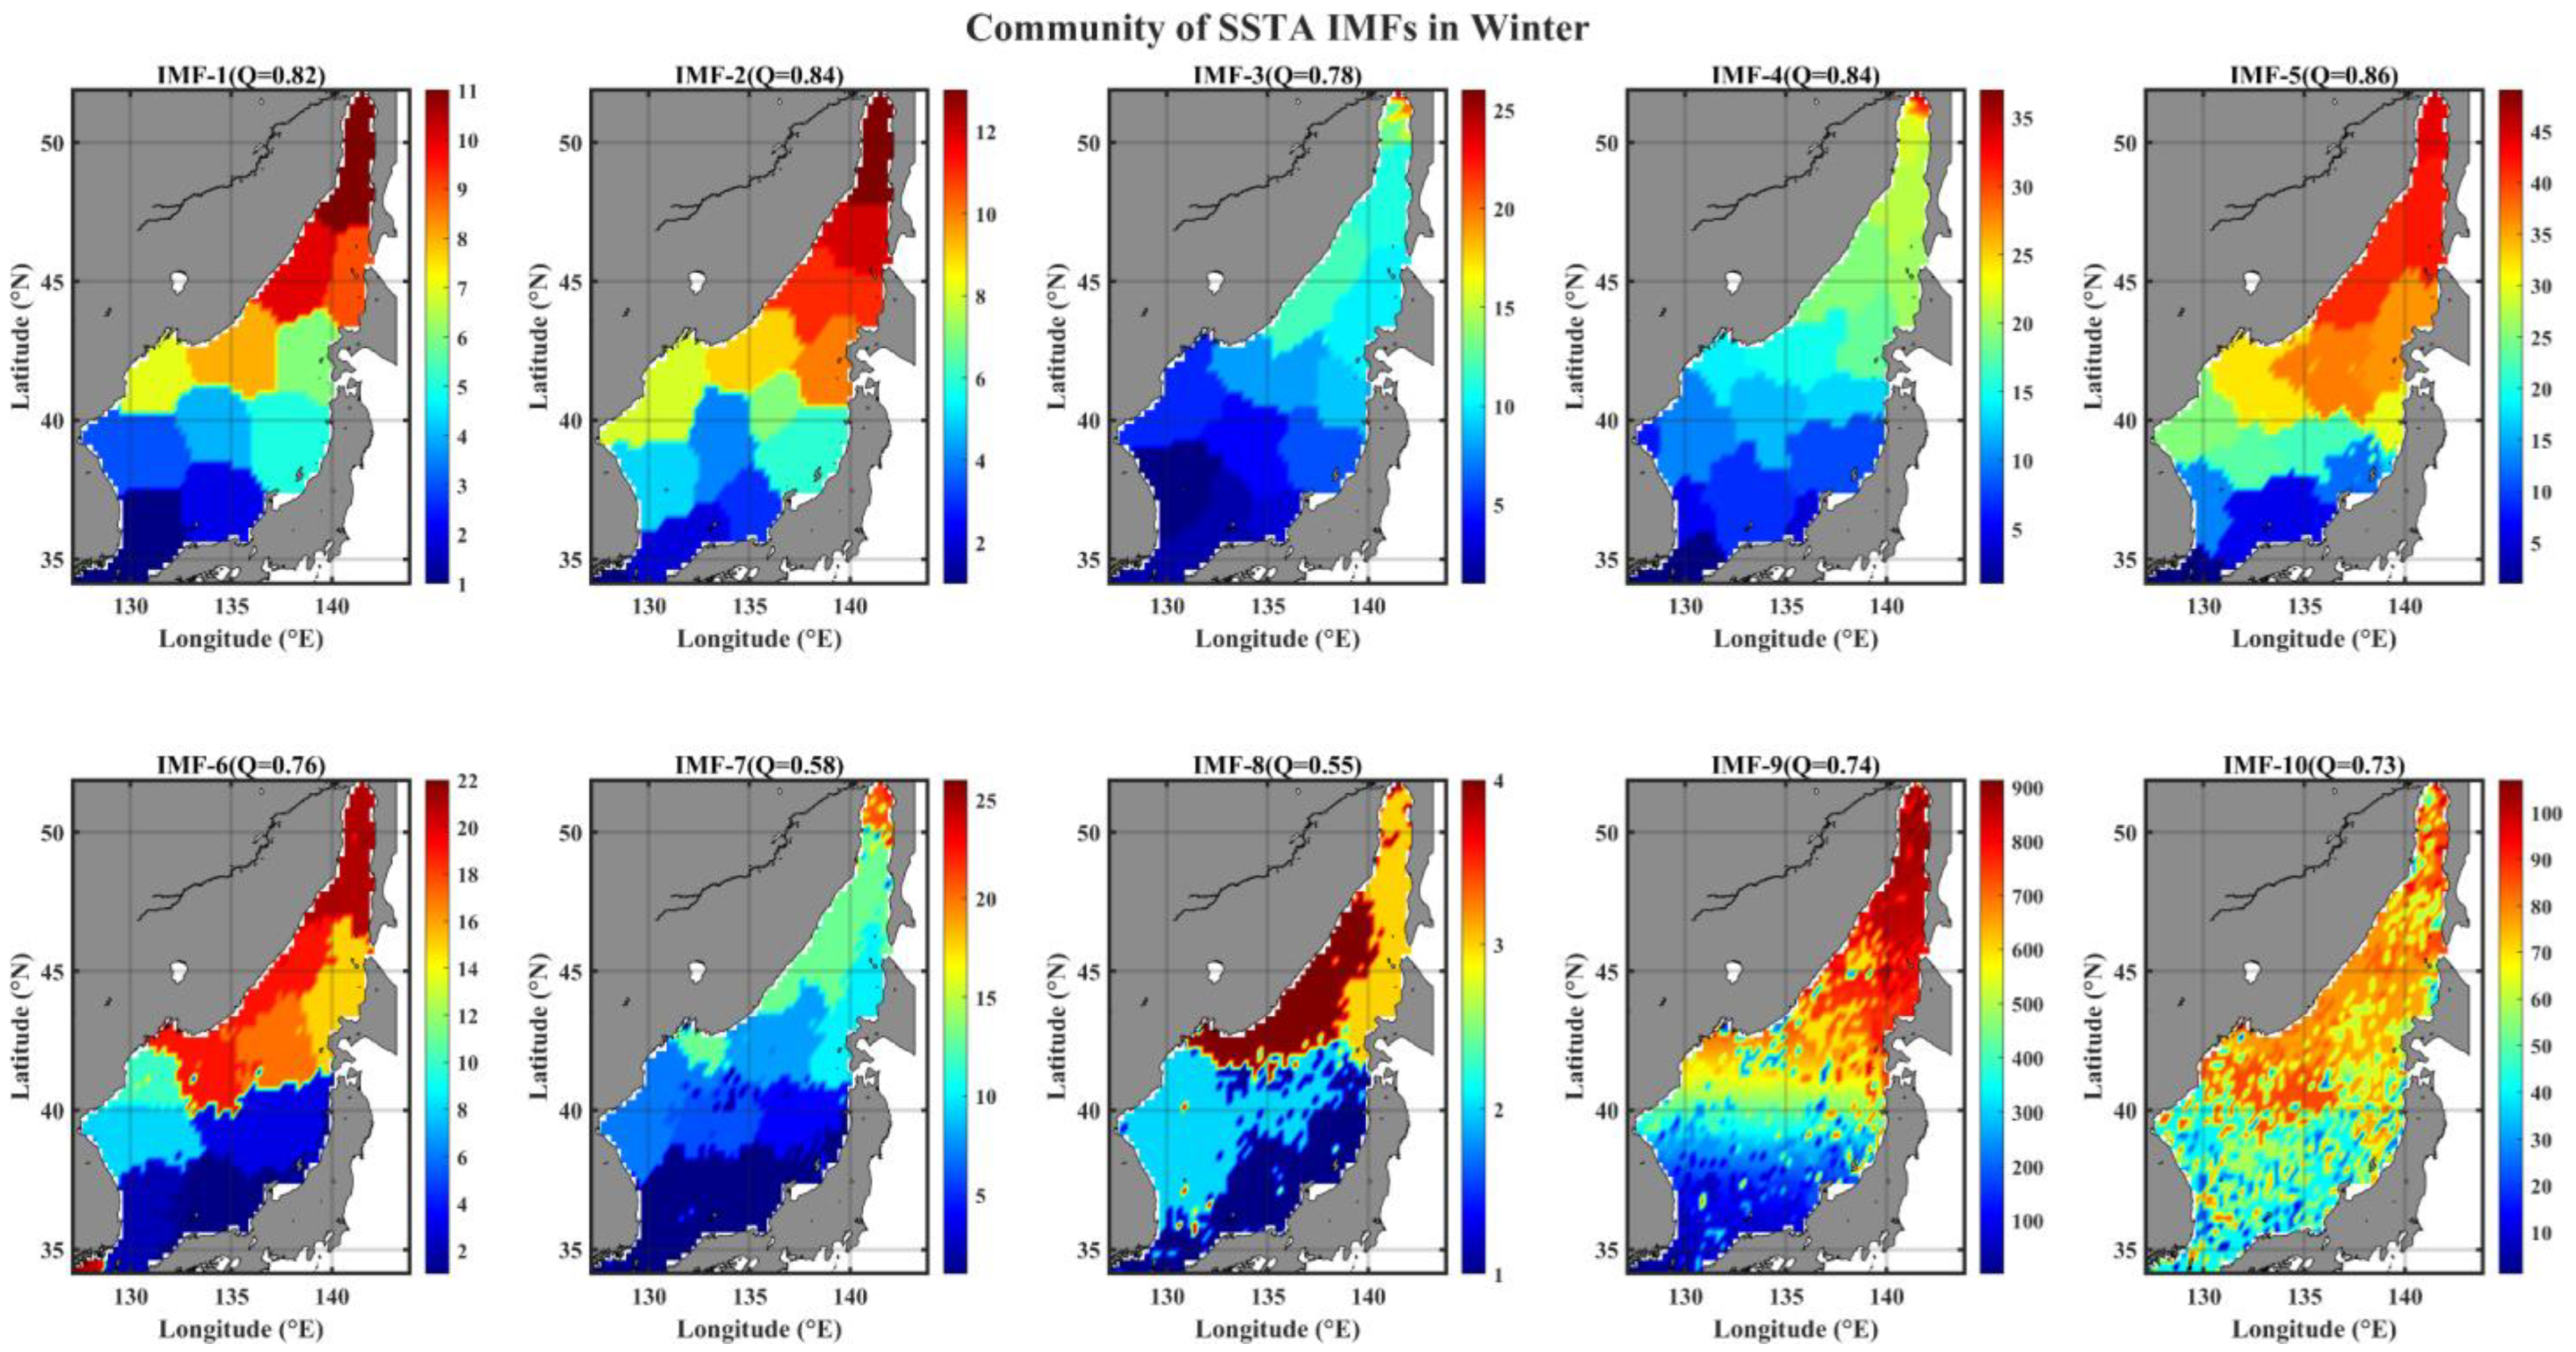
Figure 13. The same as Figure 9, except for winter (DJF).
Applsci 14 01752 g013
Figure 14. Assortativity of IMF networks with respect to mode number.
Applsci 14 01752 g014

3.4. Spatial Pattern of Community in IMF Networks

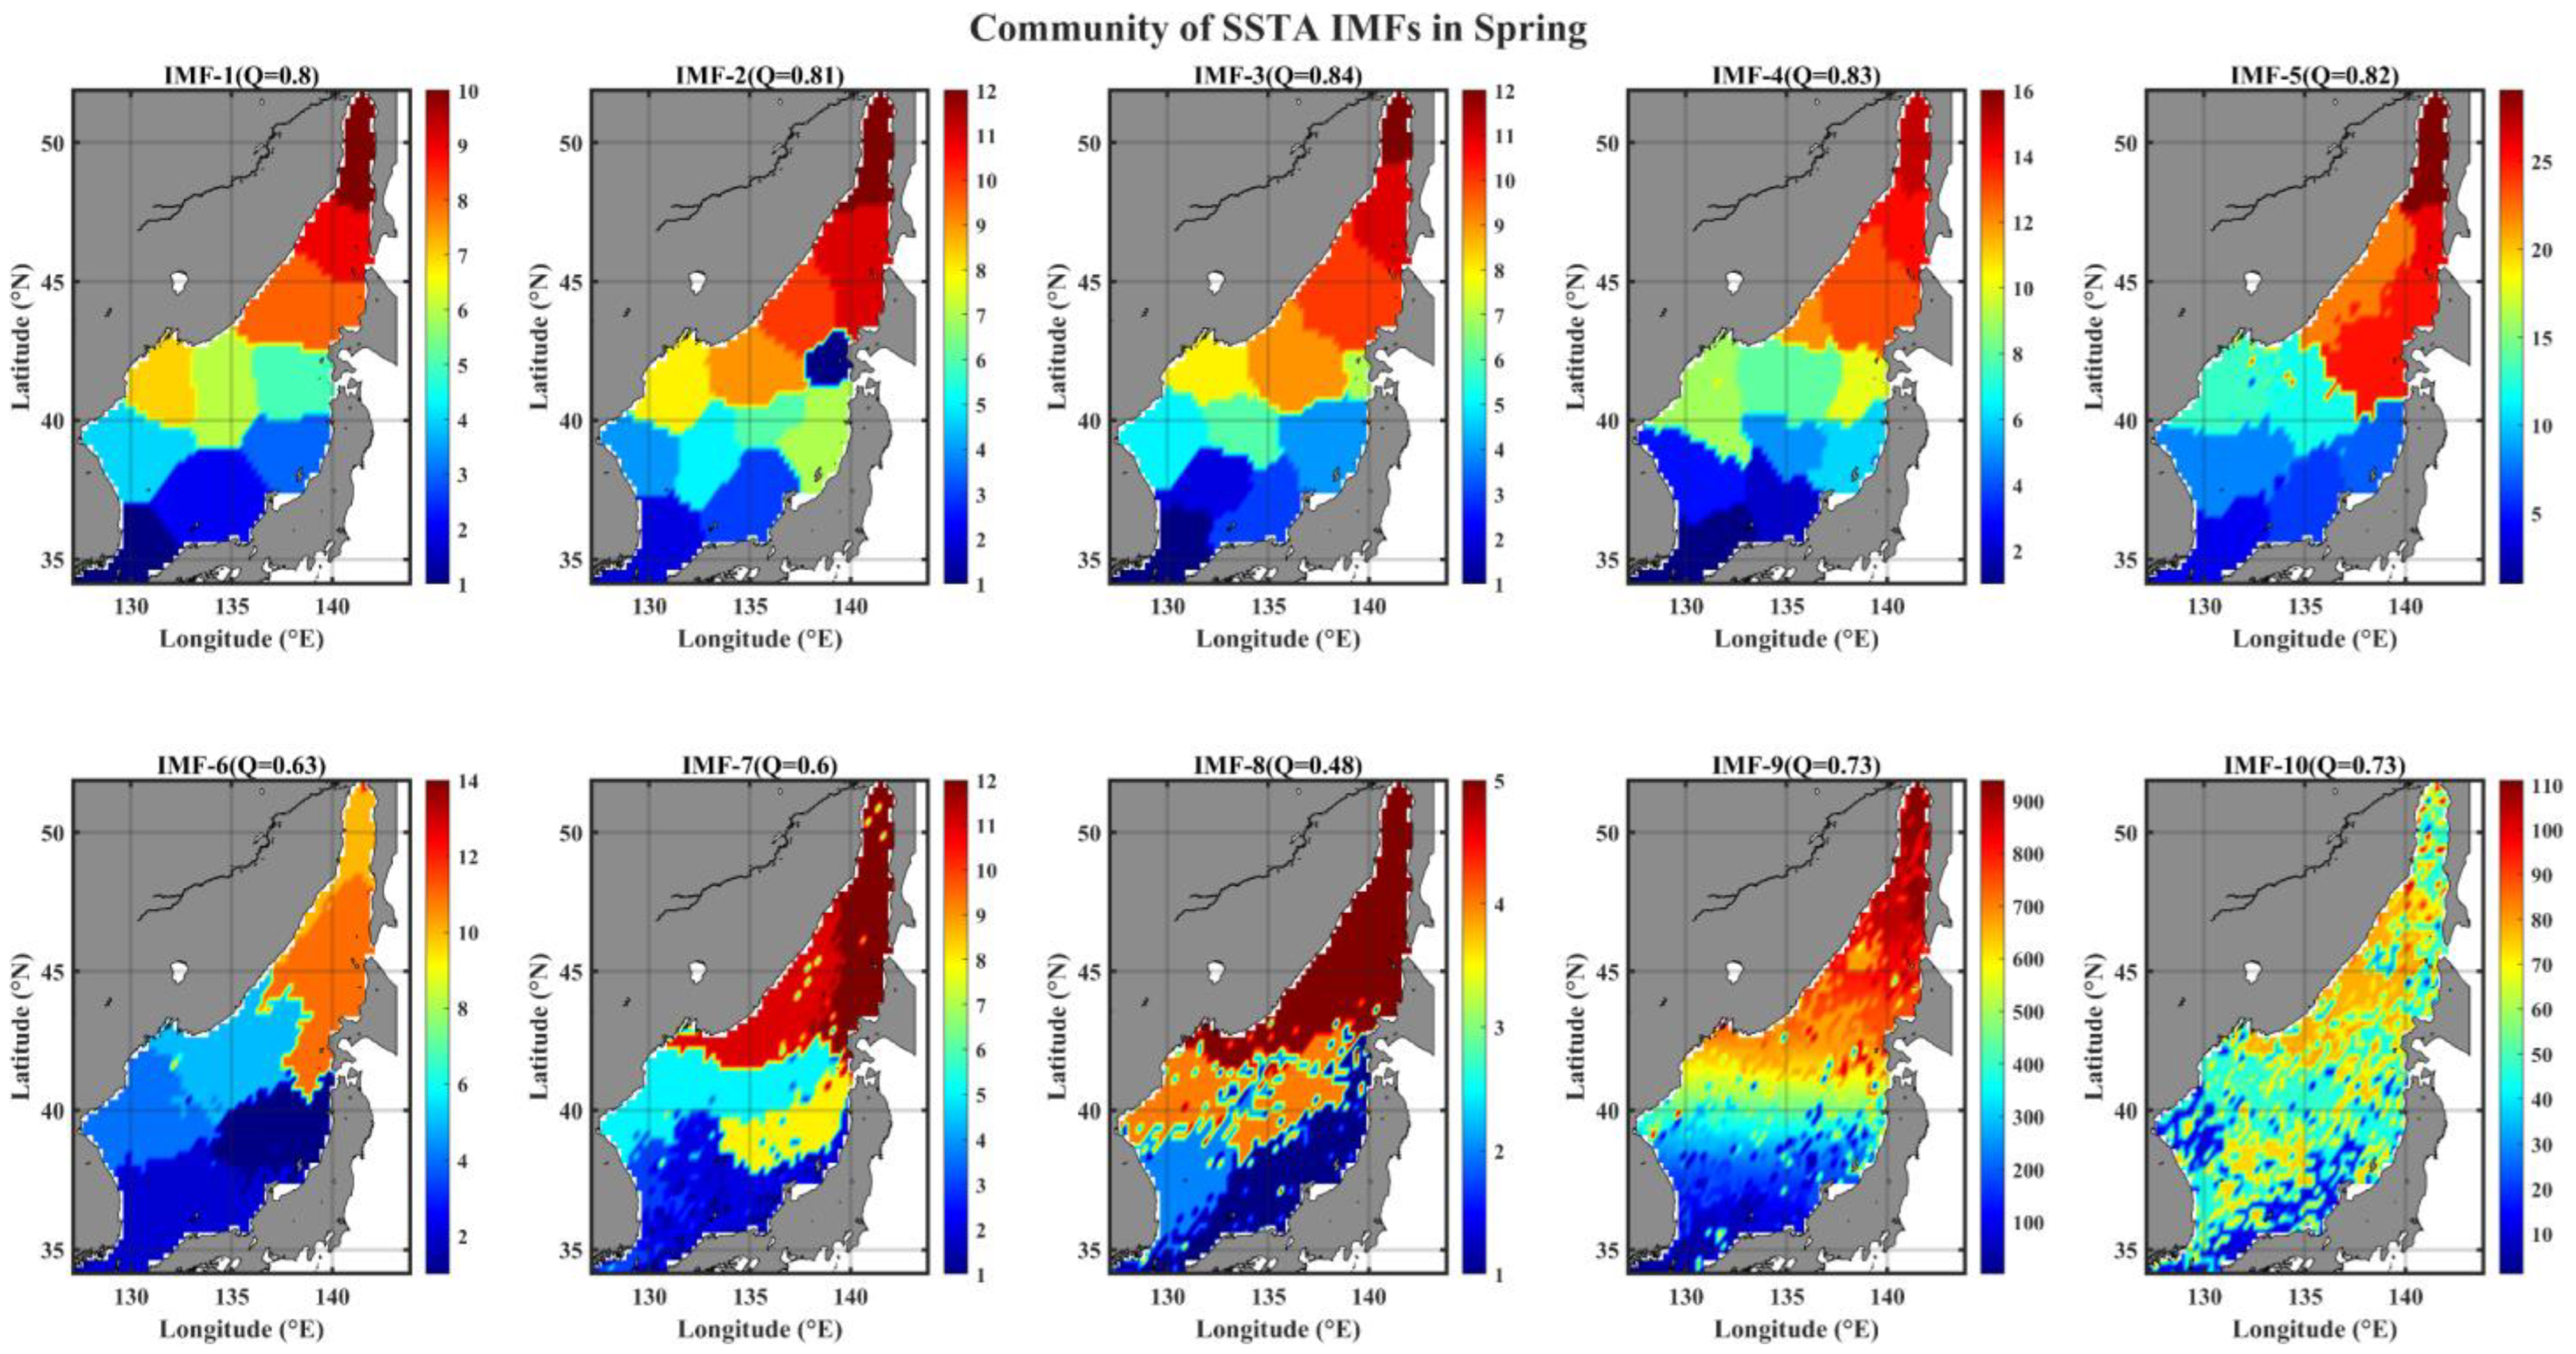
From the spatial pattern of degree distribution of IMF networks, we could confirm the presence of some hub-based clusters (communities); however, there was no spatial information on nodes with low degrees. Nodes with low degrees also make a community. In this section, we explore the community structure of IMF networks (Figure 15); the hub-based clusters seen in Figure 9 are well consistent with the communities at the same location. For low-mode IMF networks (IMF-1 through IMF-5), the regions, such as EKB and SPF, characterized by high IE levels (Figure 4), are distinctly indiscernible. However, as the mode increases, those regions are clearly discernible by the community, especially for IMF-6 through IMF-8. Particularly in both the IMF-7 and IMF-8 networks, there appears to be a connection between the northern end channel of the EJS and the ESIW formation site. More interestingly, the pathway from the northern origin of ESIW to its formation site [31] is consistent with the 4th community structure (IMF-8 network in Figure 15). Note that IMF-8 has a biennial timescale (2~3 years). There is another suggestion for the ESIW formation by Park and Lim [49], in which the ESIW is formed from the flowing-in waters through the KTS. The first community of the IMF-8 network is consistent with the route determined by the drifter trajectories presented in Park and Lim [49]. Further, it is noteworthy that the 7th community of the IMF-7 network in Figure 15 shows a remote-connection feature.
The seasonality of community structures in IMF networks is shown in Figure 16, Figure 17, Figure 18 and Figure 19. The first characteristic is that a small number of communities are formed in IMF-4 and IMF-5 networks only during summer (Figure 17), compared to other seasons. At those modes, the southern part of EJS has a large cluster of hubs (Figure 11). At IMF-8 networks (Figure 16, Figure 17, Figure 18 and Figure 19), the community structure relating to the pathway between the ESIW formation site and its origins seems to be robustly preserved for all seasons, except for winter for the northern origin, and spring for the southern origin. The high IE spatial patterns of IMF-7 through IMF-9 over the tongue-shaped region from the EKB extending towards the SPF (Figure 3, Figure 4, Figure 5, Figure 6 and Figure 7) are almost consistent with the community structure of the IMF-7 and IMF-8 networks only in spring. The community structure along the coasts also shows strong seasonality. As mentioned in Section 2.4.2, it should be noted that the community structure could be related to the causal range of any forcing with a timescale corresponding to a given IMF.

4. Discussions

In this study, we devised a new approach for examining the multiscale characteristics of oscillatory oceanic properties, such as SSTA variability, that is based on the combination of two well-known methods, such as EMD and complex network theory. Although our wavelet-based network methodology shows a noticeable performance in examining the variability of internal tides inside a mesoscale eddy [50], there is still a shortcoming in eliminating spurious harmonics due to a strong nonstationary behavior. Our new EMD-based approach can avoid spurious harmonics due to an abrupt frequency modulation [33].
Also, most previous studies on SST variability have been based on linear statistical analysis tools such as empirical orthogonal function (EOF) and spectral analysis tools based on Fourier transform, which have critical shortcomings in dealing with real-world signals with nonstationary and nonlinearity [33]. In fact, the EMD method has been introduced to overcome the limitations of Fourier-transform-based analyses, including the wavelet approach. Since the traditional EOF approach has been long applied to the analysis of SST variability in the oceanography in order to extract the space-time modes of climate variability [51], notwithstanding that there are two problems, such as uncertainty in the physical interpretation of EOF modes and ambiguity in identifying relationships between spatial and temporal EOFs [52], there has been no attempt to analyze the spatial structure of SST variability, based on EMD approaches. The EMD approach is excellent at extracting scale-based characteristics adaptively from a singular time series [33], so any EMB-based methodology, like in this study, can more effectively obtain spatiotemporal characteristics from multivariate time series even with strong periodic oscillations and nonstationary. Generally, SST variability has a wide range of temporal scales along with their intra- and inter-wave modulations; these frequency and amplitude modulations intrinsic in a singular time series clarify the limitations of linear statistical analysis.
Compared to previous studies on SST variability in the EJS [2,3,4,5,16,17], our results give a more detailed description of spatial patterns due to factors with specific timescales in terms of instant time and separate timescales. Since low-mode EOFs, usually with high variances, have a peaked power on longer temporal scales [17], there is no information relating to smaller scale-based spatial patterns. Furthermore, the temporal evolution of an instantaneous power is nearly impossible to obtain from EOF analysis and spectral analysis based on the Fourier transform.
From the IMFs of a singular SSTA timeseries, we can compute the instantaneous timescales and their respective IE values, providing two important pieces of information on dominant timescales and IE structure at every moment. These quantities are very useful for examining timescales relating to well-known exogenous factors, such as climate factors, air–sea interactions, atmospheric forcing, etc. Further, by using spatial IE patterns of the respective IMF, the multiscale spatial characteristics of SSTA variability could be found; the simple standard deviation and linear regression approaches are not possible due to the impossibility of resolving timescales. We have shown that the degree and community spatial patterns are scale-dependent as well as season-specific; in the widely used EOF analysis, the mode-dependent spatial pattern shows no information on multiscale spatial and causal characteristics of SSTA variability because its corresponding principal component timeseries is usually characterized by multiple peaked or wide-band timescales.
As for the causal aspects of SSTA variability, the IMF networks constructed from components with oscillatory features, like geophysical timeseries, could have any information on causality between two remote locations. It is interesting that the community spatial patterns seem to relate to the pathways of EISW from the potential origins to the formation site [31,49]. However, there is no information on directionality and quantitative lag time. Also, due to the intra- and inter-wave frequency modulations of IMFs, caution should be taken in making a direct interpretation of causal relations from the community spatial pattern. In fact, to address these limitations, we should perform a further study by extending our approach to incorporating the well-known causality measures, such as Granger causality, transfer entropy, etc. We expect that the causal relations in SSTA variability based on our extended approach can give us more information on advection mechanism of atmospheric and oceanic features.

5. Conclusions

By applying our new intrinsic-mode-based network methodology to SST data covering the EJS, we found several multiscale characteristics of SST variability in the EJS. The analysis results show the following noteworthy findings:
  • Distinct spatial patterns of (amplitude) energy density distribution are greatly classified into two temporal scales, the weekly to semiannual timescales and the longer than annual timescales; the former reveals a strong seasonality with a high energy in the north-western (north-eastern) part of EJS during summer (winter), and the latter shows a persistent spatial structure of high energy distribution in a tongue-shape region from East Korea Bay (EKB) extending to Sub-Polar Front (SPF).
  • There is an apparent seasonality in the temporal evolution of the basin-wide summed energy density, with a peak in the summer seasons, as well as an increasing energy level trend since the 2010s.
  • The connectivity topological structure of IMF networks reveals season- and scale-specific features only for monthly to semiannual modes, in terms of nodes (hubs) with high connectivity; in summer, hubs are widely distributed in the southern EJS, while hubs occupy only small areas in the northern EJS during winter.
  • The link-based community structure of IMF networks shows a region-specific feature only for weekly to seasonal modes and gradually expands its spatial extent to a basin-wide scale as the mode number (indicating the timescale of the mode) increases; in addition, there is qualitative information concerning the advection timescale of flowing-in waters with low salinity from the northern and southern ends of the EJS, known to be contributing to the ESIW formation at its formation site (40~43° N, 131~135° E) [31].
Although all the analyses in this study are performed on the full duration (~42 years) and sums of seasons (~11 years), this approach can be extended to the shorter temporal windows, giving us more information on local-time characteristics of SSTA variability with respect to multiple scales; this is our next topic. Also, a time-evolutionary examination of the network’s structural variability of SST can be useful for finding any pattern in the global warming trend. Lastly, causality-based networks using SST data can give us more insight into the dynamic aspect of SST variability in various seas, including the EJS.

Author Contributions

Conceptualization, G.L. and J.-J.P.; methodology, G.L.; validation, G.L. and J.-J.P.; formal analysis, G.L.; investigation, G.L.; data curation, G.L.; writing—original draft preparation, G.L.; writing—review and editing, G.L. and J.-J.P.; visualization, G.L.; supervision, J.-J.P.; project administration, J.-J.P. All authors have read and agreed to the published version of the manuscript.

Funding

This research was supported by Korea Institute of Marine Science & Technology Promotion (KIMST) funded by the Ministry of Oceans and Fisheries (RS-2023-00256005). This research was also supported by Kyungpook National University Development Project Research Fund, 2021.

Institutional Review Board Statement

Not applicable.

Informed Consent Statement

Not applicable.

Data Availability Statement

The data presented in this study are openly available in NCEI at https://www.ncei.noaa.gov/products/optimum-interpolation-sst.

Acknowledgments

NOAA OI SST V2 High Resolution Dataset data were provided by the NOAA PSL, Boulder, CO, USA, from their website at https://psl.noaa.gov (accessed on 4 April 2023).

Conflicts of Interest

The authors declare no conflicts of interest.

References

  1. Deser, C.; Alexander, M.A.; Xie, S.-P.; Phillips, A.S. Sea Surface Temperature Variability: Patterns and Mechanism. Annu. Rev. Mar. Sci. 2010, 2, 115–143. [Google Scholar] [CrossRef]
  2. Park, K.; Chung, J.Y. Spatial and temporal scale variations of sea surface temperature in the East Sea using NOAA/AVHRR data. J. Oceanogr. 1999, 55, 271–288. [Google Scholar] [CrossRef]
  3. Park, W.-S.; Oh, I.S. Interannual and interdecadal variations of sea surface temperature in the East Asian marginal seas. Prog. Oceanogr. 2000, 47, 191–204. [Google Scholar] [CrossRef]
  4. Minobe, S.; Sako, A.; Nakamura, M. Interannual to interdecadal variability in the Japan Sea based on a new gridded upper water temperature dataset. J. Phys. Oceanogr. 2004, 34, 2382–2397. [Google Scholar] [CrossRef]
  5. Jeong, Y.; Nam, S.; Kwon, J.-I.; Uppara, U.; Jo, Y.-H. Surface warming slowdown with continued subsurface warming in the East Sea (Japan Sea) over recent decades (2000–2014). Front. Mar. Sci. 2022, 9, 173. [Google Scholar] [CrossRef]
  6. Kawamura, H.; Wu, P. Formation mechanism of Japan sea proper water in the flux center off Vladivostok. J. Geophys. Res. 1998, 103, 21611–21622. [Google Scholar] [CrossRef]
  7. Hirose, N.; Ostrovskii, A.G. Quasi-biennial variability in the Japan Sea. J. Geophys. Res. 2000, 105, 14011–14027. [Google Scholar] [CrossRef]
  8. Watanabe, T.; Hanawa, K.; Toba, Y. Analyses of year-to-year variation of water temperature along the coast of Japan Sea. Prog. Oceanogr. 1986, 17, 337–357. [Google Scholar] [CrossRef]
  9. Isoda, Y. Interannual SST variations to the north and south of the Polar front in the Japan Sea. La Mer 1994, 32, 285–293. [Google Scholar]
  10. Isoda, Y.; Korematsu, H. Interannual variation of water temperature, salinity, and oxygen vertical distribution in the Tsushima current region. Umi Sora 1995, 71, 47–67. [Google Scholar]
  11. Watanabe, Y.W.; Wakita, M.; Maeda, N.; Ono, T.; Gamo, T. Synchronous bidecadal periodic changes of oxygen, phosphate and temperature between the Japan Sea deep water and the North Pacific intermediate water. Geophys. Res. Lett. 2003, 30, 2273. [Google Scholar] [CrossRef]
  12. Minobe, S. Interdecadal temperature variation of deep water in the Japan Sea (East Sea). In Proceedings of the Fourth Workshop CREAMS, R/V OKEAN, Vladivostok, Russia, 12–13 February 1996; pp. 81–88. [Google Scholar]
  13. Park, S.; Chu, P. Interannual SST variability in the Japan/East Sea and relationship with environmental variables. J. Oceanogr. 2006, 62, 115–132. [Google Scholar] [CrossRef]
  14. Ponomarev, V.I.; Dyakonova, I.; Palshin, N.; Rudykh, N.; Ishida, H. Multiscale Variability of oceanographic and meteorological characteristics in the Japan (East) Sea area. In Past, Present and Future Environments of Pan-Japan Sea Region; Hayakawa, K., Ed.; MARUZEN Co. Ltd.: Kanazawa, Japan, 2006; pp. 407–417. [Google Scholar]
  15. Park, K.-A.; Park, J.-E.; Choi, B.-J.; Byun, D.-S.; Lee, E.-I. An Oceanic Current Map of the East Sea for Science Textbooks Based on Scientific Knowledge Acquired from Oceanic Measurements. Sea J. Korean Soc. Oceanogr. 2013, 18, 234–265. [Google Scholar]
  16. Chen, S.; Wang, H.; Wang, N.; Wang, H.; Yu, P.; Yang, X.; Zhang, Y. Dominant modes of winter SST variability in the Japan Sea and their influences on atmosphere. J. Oceanogr. 2022, 78, 353–368. [Google Scholar] [CrossRef]
  17. Chu, P.C.; Chen, Y.; Lu, S. Temporal and spatial variabilities of Japan Sea surface temperature and atmospheric forcings. J. Oceanogr. 1998, 54, 273–284. [Google Scholar] [CrossRef]
  18. Dorman, C.E.; Friehe, C.A.; Khelif, D.; Scotti, A.; Edson, J.; Beardsley, R.C.; Limeburner, R.; Chen, S.S. Winter atmospheric conditions over the Japan/East Sea: The structure and impact of severe cold air outbreaks. Oceanography 2006, 19, 96–109. [Google Scholar] [CrossRef]
  19. Dorman, C.E.; Beardsley, R.C.; Dashko, N.A.; Friehe, C.A.; Kheilf, D.; Cho, K.; Limeburner, R.; Varlamov, S.M. Winter marine atmospheric conditions over the Japan Sea. J. Geophys. Res. Ocean. 2004, 109. [Google Scholar] [CrossRef]
  20. Trusenkova, O.O.; Lobanov, V.B.; Kaplunenko, D.D. Variability of sea surface temperature in the Japan Sea and its relationship to the wind-curl field. Izv. Atmos. Ocean. Phys. 2008, 44, 517. [Google Scholar] [CrossRef]
  21. Yoshikawa, Y.; Awaji, T.; Akitomo, K. Formation and circulation processes of intermediate water in the Japan Sea. J. Phys. Oceanogr. 1999, 29, 1701–1722. [Google Scholar]
  22. Yoon, J.-H.; Kawamura, H. The formation and circulation of the intermediate water in the Japan Sea. J. Oceanogr. 2002, 58, 197–211. [Google Scholar] [CrossRef]
  23. Park, K.-A.; Chung, J.Y.; Kim, K.; Cornillon, P.C. Wind and bathymetric forcing of the annual sea surface temperature signal in the East (Japan) Sea. Geophys. Res. Lett. 2005, 32, L05610. [Google Scholar] [CrossRef]
  24. Park, K.-A.; Ullman, D.S.; Kim, K.; Chung, J.Y.; Kim, K.-R. Spatial and temporal variability of satellite-observed Subpolar Front in the East/Japan Sea. Deep Sea Res. Part I Oceanogr. Res. Pap. 2007, 54, 453–470. [Google Scholar] [CrossRef]
  25. Park, K.-A.; Lee, E.-Y. Semi-annual cycle of sea-surface temperature in the East/Japan Sea and cooling process. Int. J. Remote Sens. 2014, 35, 4287–4314. [Google Scholar] [CrossRef]
  26. Cui, Y.; Senjyu, T. Interdecadal oscillations in the Japan Sea proper water related to the arctic oscillation. J. Oceanogr. 2010, 66, 337–348. [Google Scholar] [CrossRef]
  27. Hong, C.-H.; Cho, K.-D.; Kim, H.-J. The relationship between ENSO events and sea surface temperature in the East (Japan) Sea. Prog. Oceanogr. 2001, 49, 21–40. [Google Scholar] [CrossRef]
  28. Isobe, A.; Beardsley, R.C. Atmosphere and marginal-sea interaction leading to an interannual variation in cold-air outbreak activity over the Japan Sea. J. Clim. 2007, 20, 5707–5714. [Google Scholar] [CrossRef]
  29. Lee, E.-Y.; Park, K.-A. Change in the recent warming trend of sea surface temperature in the East Sea (Sea of Japan) over decades (1982–2018). Remote Sens. 2019, 11, 2613. [Google Scholar] [CrossRef]
  30. Min, H.-S.; Kim, C.-H. Interannual variability and long-term trend of coastal sea surface temperature in Korea. Ocean Polar Res. 2006, 28, 415–423. [Google Scholar] [CrossRef]
  31. Kim, S.-Y.; Park, Y.-G.; Kim, Y.H.; Seo, S.; Jin, H.; Pak, G.; Lee, H.J. Origin, variability, and pathways of East Sea Intermediate Water in a high-resolution ocean reanalysis. J. Geophys. Res. Ocean. 2021, 126, e2020JC017158. [Google Scholar] [CrossRef]
  32. Ponomarev, V.; Rudykh, N.; Dmitrieva, E.; Ishida, H. Variability of Surface Water Properties in the Japan/East Sea on Different Time Scales. Ocean. Polar Res. 2009, 31, 177–187. [Google Scholar] [CrossRef]
  33. Huang, N.E.; Shen, Z.; Long, S.R.; Wu, M.C.; Shih, H.H.; Zheng, Q.; Yen, N.-C.; Tung, C.C.; Liu, H.H. The Empirical Mode Decomposition and the Hilbert Spectrum for Nonlinear and Non-Stationary Time Series Analysis. Proc. Math. Phys. Eng. Sci. 1998, 454, 903–995. [Google Scholar] [CrossRef]
  34. Newman, M.E.J. Modularity and community structure in networks. Proc. Natl. Acad. Sci. USA 2006, 103, 8577–8582. [Google Scholar] [CrossRef] [PubMed]
  35. Huang, B.; Liu, C.; Freeman, E.; Graham, G.; Smith, T.; Zhang, H.-M. Assessment and intercomparison of NOAA daily optimum interpolation sea surface temperature (DOISST) version 2.1. J. Clim. 2021, 34, 7421–7441. [Google Scholar] [CrossRef]
  36. Reynolds, R.W.; Smith, T.M.; Liu, C.; Chelton, D.B.; Casey, K.S.; Schlax, M.G. Daily high-resolution-blended analyses for sea surface temperature. J. Clim. 2007, 20, 5473–5496. [Google Scholar] [CrossRef]
  37. Wu, Z.; Huang, N.E.; Long, S.R.; Peng, C.K. On the trend, detrending, and variability of nonlinear and nonstationary time series. Proc. Natl. Acad. Sci. USA 2007, 104, 14889–14894. [Google Scholar] [CrossRef] [PubMed]
  38. Wang, G.; Chen, X.-Y.; Qiao, F.-L.; Wu, Z.; Huang, N.E. On Intrinsic Mode Function. Adv. Adapt. Data Anal. 2010, 02, 277–293. [Google Scholar] [CrossRef]
  39. Newman, M.E.J.; Girvan, M. Finding and evaluating community structure in networks. Phys. Rev. E 2004, 69, 026113. [Google Scholar] [CrossRef]
  40. Blondel, V.D.; Guillaume, J.L.; Lambiotte, R.; Lefebvre, E. Fast unfolding of communities in large networks. J. Stat. Mech. 2008, 2008, P10008. [Google Scholar] [CrossRef]
  41. Newman, M.E.J. Assortative Mixing in Networks. Phys. Rev. Lett. 2002, 89, 208701. [Google Scholar] [CrossRef]
  42. Callaway, D.S.; Hopcroft, J.E.; Kleinberg, J.M.; Newman, M.E.J.; Strogatz, S.H. Are randomly grown graphs really random? Phys. Rev. E 2001, 64, 041902. [Google Scholar] [CrossRef]
  43. Song, S.-Y.; Kim, Y.-J.; Lee, E.-J.; Yeh, S.-W.; Park, J.-H.; Park, Y.-G. Wintertime sea surface temperature variability modulated by Arctic Oscillation in the northwestern part of the East/Japan Sea and its relationship with marine heatwaves. Front. Mar. Sci. 2023, 10, 1198418. [Google Scholar] [CrossRef]
  44. Wang, D.; Xu, T.; Fang, G.; Jiang, S.; Wang, G.; Wei, Z.; Wang, Y. Characteristics of Marine Heatwaves in the Japan/East Sea. Remote Sens. 2022, 14, 936. [Google Scholar] [CrossRef]
  45. Kraus, E.B.; Businger, J.A. Atmosphere-Ocean Interaction; Oxford University Press: Oxford, UK, 1994. [Google Scholar]
  46. Choi, B.-J.; Cho, S.H.; Jung, H.S.; Lee, S.-H.; Byun, D.-S.; Kwon, K. Interannual variation of surface circulation in the Japan/East Sea due to external forcings and intrinsic variability. Ocean Sci. J. 2018, 53, 1–16. [Google Scholar] [CrossRef]
  47. Pak, G.; Kim, Y.H.; Park, Y.-G. Lagrangian Approach for a new separation index of the East Korea warm current. Ocean Sci. J. 2019, 54, 29–38. [Google Scholar] [CrossRef]
  48. Yeh, S.-W.; Park, Y.-G.; Min, H.; Kim, C.-H.; Lee, J.-H. Analysis of characteristics in the sea surface temperature variability in the East/Japan Sea. Prog. Oceanogr. 2010, 85, 213–223. [Google Scholar] [CrossRef]
  49. Park, J.; Lim, B. A new perspective on origin of the East Sea intermediate water: Observations of Argo floats. Prog. Oceanogr. 2018, 160, 213–224. [Google Scholar] [CrossRef]
  50. Lim, G.; Park, J.-J. Examining Modulations of Internal Tides within An Anticyclonic Eddy Using a Wavelet-Coherence Network Approach. Appl. Sci. 2024, 14, 1001. [Google Scholar] [CrossRef]
  51. Chen, X.; Tung, K.K. Global-mean surface temperature variability: Space–time perspective from rotated EOFs. Clim Dyn. 2018, 51, 1719–1732. [Google Scholar] [CrossRef]
  52. Borzelli, G.; Ligi, R. Empirical Orthogonal Function Analysis of SST Image Series: A Physical Interpretation. J. Atmos. Ocean. Technol. 1999, 16, 682–690. [Google Scholar] [CrossRef]
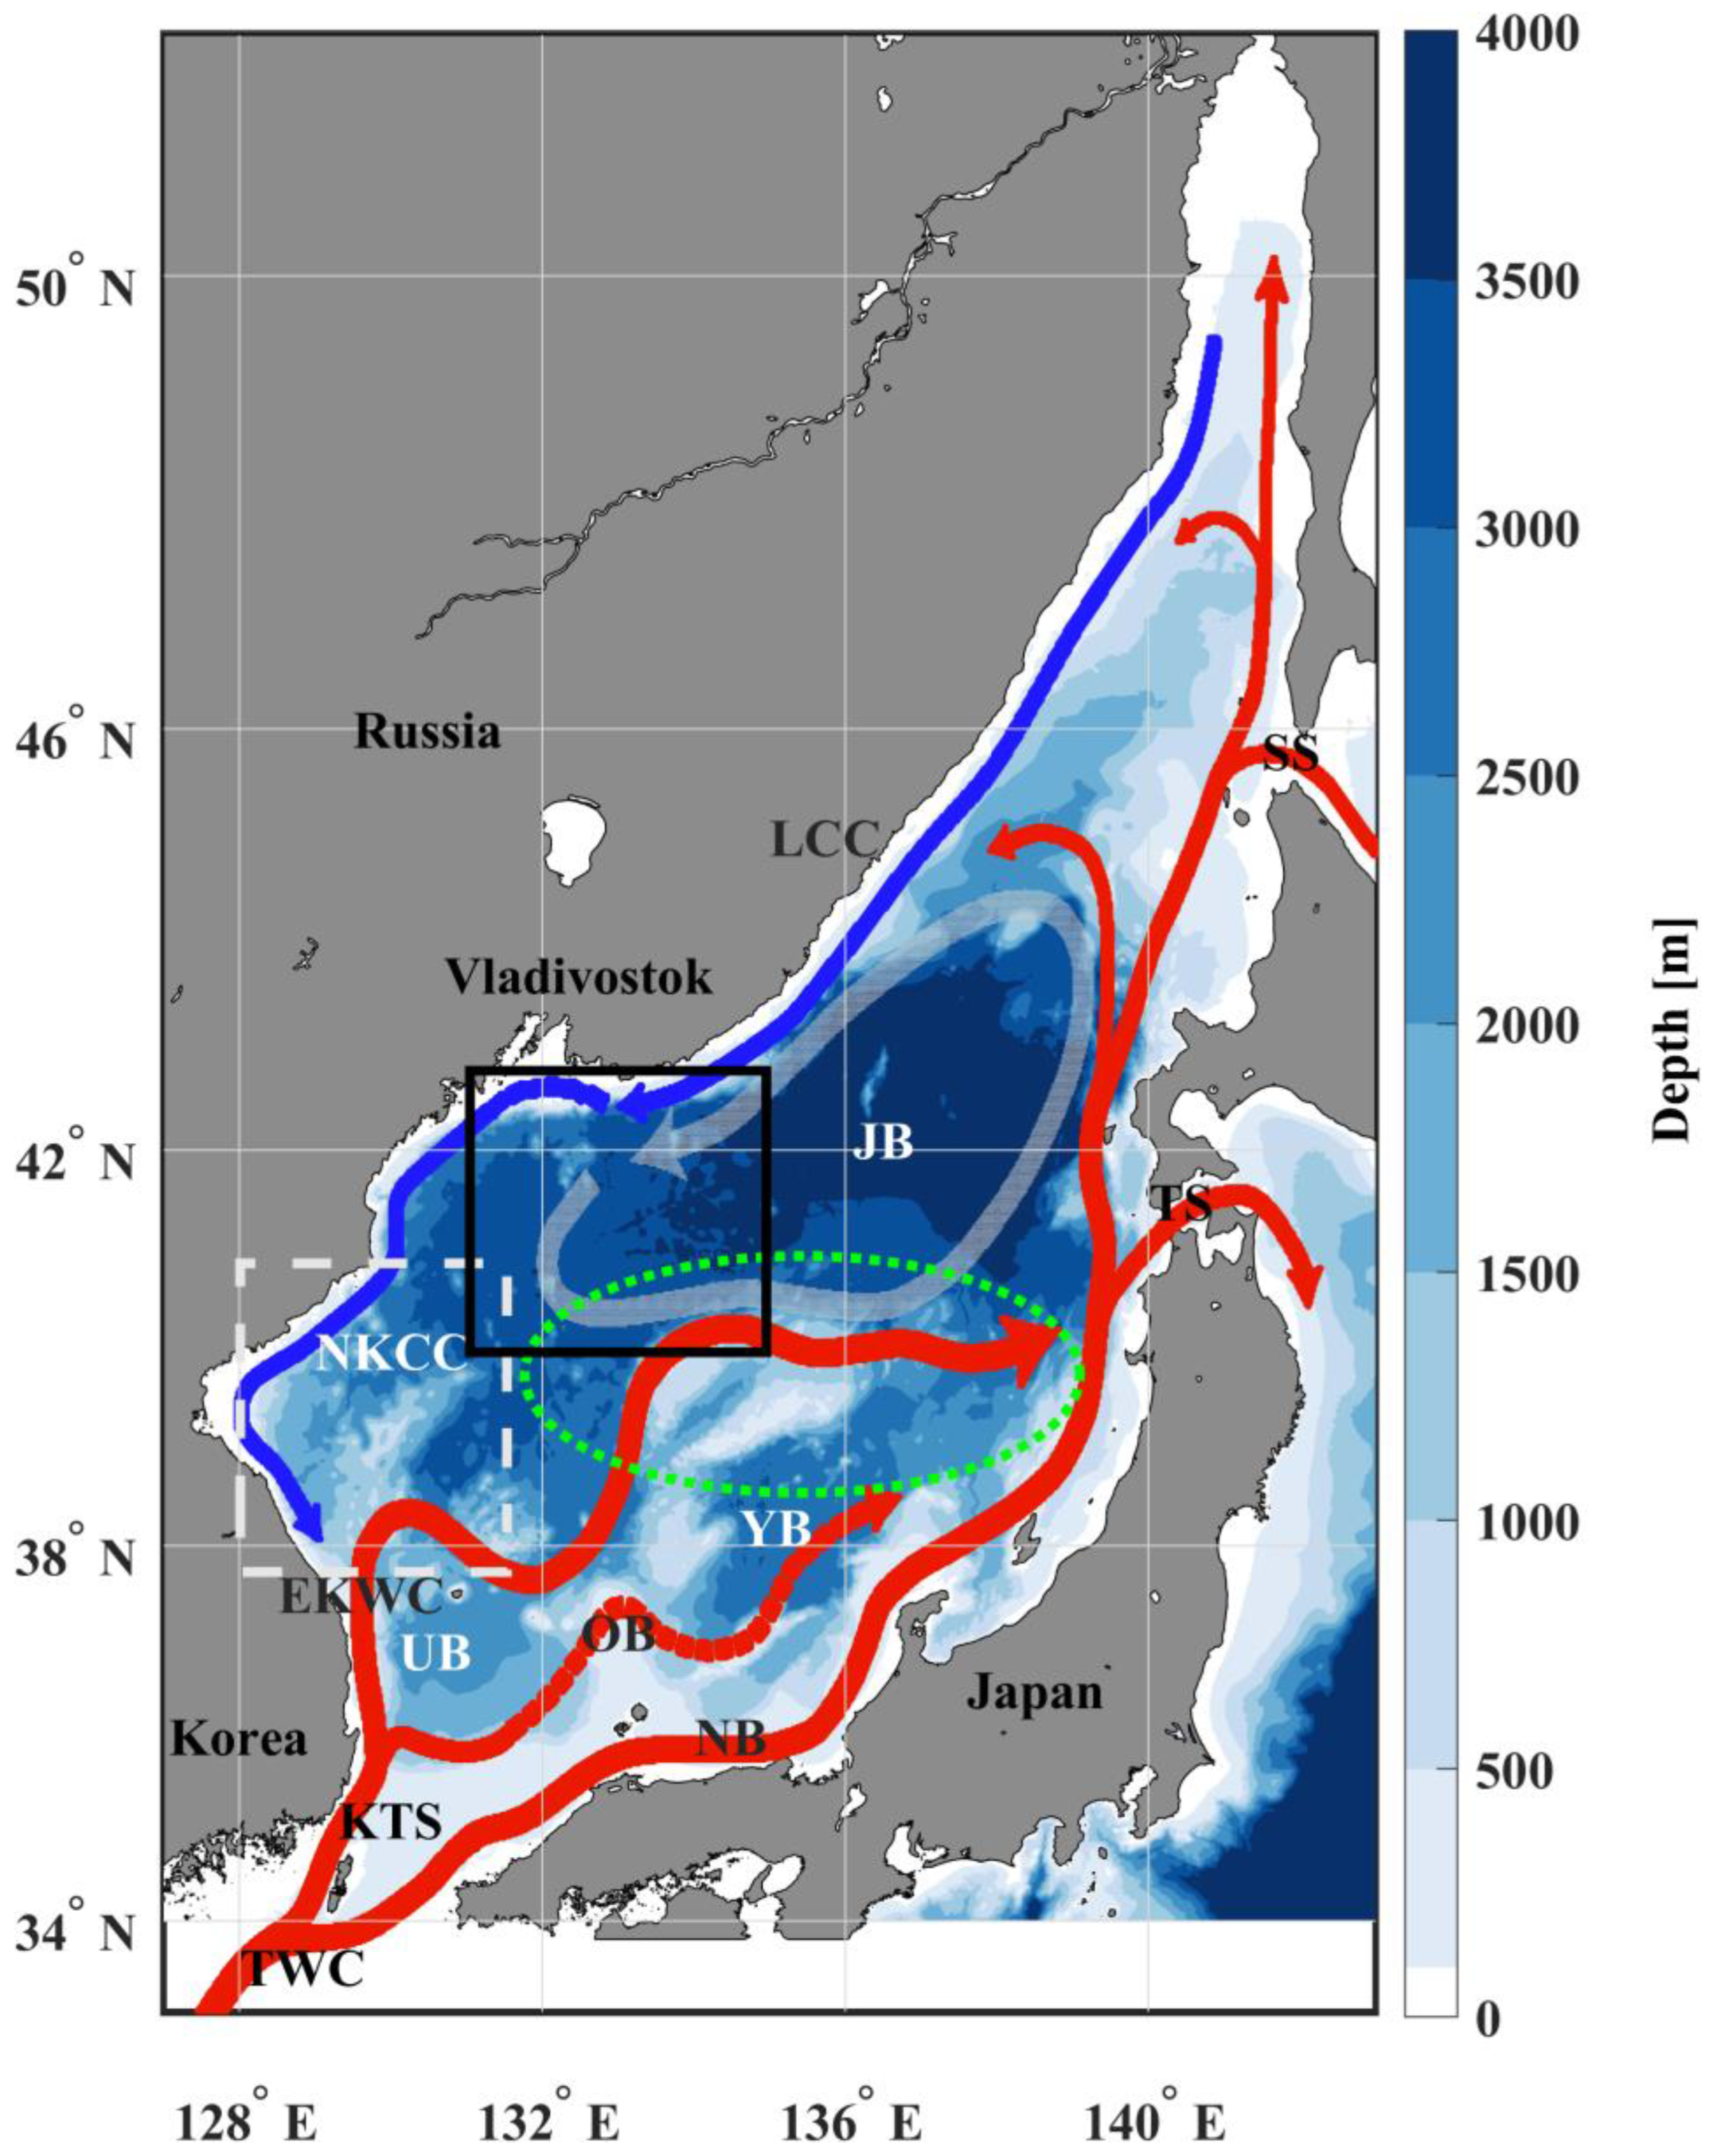
Figure 1. Surface oceanic current of the EJS, averaged over decades [15]. TWC: Tsushima warm current, EKWC: East Korea warm current, NB: nearshore branch of TWC, OB: offshore branch of TWC, NKCC: North Korea cold current, LCC: Liman cold current, KTS: Korea-Tsushima Strait, TS: Tsugaru Strait, SS: Soya Strait, JB: Japan Basin, YB: Yamato Basin, UB: Ulleung Basin. A gray dashed box for EKB, a green dotted box for SPF, and a black solid box for the ESIW formation site.
Applsci 14 01752 g001
Figure 2. Marginal Hilbert spectra of an ensemble of all SSTA IMFs in the form of mean ± STD.
Applsci 14 01752 g002
Figure 3. The map of instantaneous energy density level (IE) with respect to IMF for the full duration from September 1981 to April 2023.
Applsci 14 01752 g003
Figure 4. The same as Figure 3, except for spring (MAM).
Applsci 14 01752 g004
Figure 5. The same as Figure 3, except for summer (JJA).
Applsci 14 01752 g005
Figure 6. The same as Figure 3, except for autumn (SON).
Applsci 14 01752 g006
Figure 7. The same as Figure 3, except for winter (DJF).
Applsci 14 01752 g007
Figure 8. Temporal evolution of the instantaneous energy density level (IE) with respect to the IMF.
Applsci 14 01752 g008
Figure 9. Spatial pattern of degree distribution of IMF networks, constructed from the database with the full length of observation from September 1981 to April 2023.
Applsci 14 01752 g009
Figure 15. The map of communities of IMF networks with respect to the IMF mode number.
Applsci 14 01752 g015
Figure 16. The same as Figure 15, except for spring.
Applsci 14 01752 g016
Figure 17. The same as Figure 15, except for summer.
Applsci 14 01752 g017
Figure 18. The same as Figure 15, except for autumn.
Applsci 14 01752 g018
Figure 19. The same as Figure 15, except for winter.
Applsci 14 01752 g019
Table 1. Timescales of IMFs.
IMF Mode No.Peaked Timescale (Day)Empirical Timescale
16~7Atmospheric synoptic scale (5~18 days)
2~13Atmospheric synoptic scale
3~30Monthly scale
4~60Inter-monthly and seasonal scale
5100~200Seasonal and semi-annual scale
6300~400Semi-annual and intra-annual scale
7300~400Annual scale
8~1000Biennial scale (2~3 years)
92500~3500Inter-annual scale (ENSO’s 3~7 years)
104000~6000Decadal scale (8~15 years)
Disclaimer/Publisher’s Note: The statements, opinions and data contained in all publications are solely those of the individual author(s) and contributor(s) and not of MDPI and/or the editor(s). MDPI and/or the editor(s) disclaim responsibility for any injury to people or property resulting from any ideas, methods, instructions or products referred to in the content.