Article

Machine Learning-Supported Designing of Human–Machine Interfaces

HUN-REN-PE Complex Systems Monitoring Research Group, University of Pannonia, H-8200 Veszprém, Hungary
*
Author to whom correspondence should be addressed.
Appl. Sci. 2024, 14(4), 1564; https://doi.org/10.3390/app14041564
Submission received: 30 November 2023 / Revised: 26 January 2024 / Accepted: 13 February 2024 / Published: 15 February 2024
(This article belongs to the Special Issue New Insights into Human-Computer Interaction)

Abstract

:
The design and functionality of the human–machine interface (HMI) significantly affects operational efficiency and safety related to process control. Alarm management techniques consider the cognitive model of operators, but mainly only from a signal perception point of view. To develop a human-centric alarm management system, the construction of an easy-to-use and supportive HMI is essential. This work suggests a development method that uses machine learning (ML) tools. The key idea is that more supportive higher-level HMI displays can be developed by analysing operator-related events in the process log file. The obtained process model contains relevant data on the relationship of the process events, enabling a network-like visualisation. Attributes of the network allow us to solve the minimisation problem of the ideal workflow–display relation. The suggested approach allows a targeted process pattern exploration to design higher-level HMI displays with respect to content and hierarchy. The method was applied in a real-life hydrofluoric acid alkylation plant, where a proposal was made about the content of an overview display.

1. Introduction

User experience (UX) is identified as an essential topic for design and functionality in the development of user interfaces (UI) [1]. Today, machine learning-based solutions are widely used in all types of production development work [2], including the topic of human–machine interactions. The potential of machine learning techniques has been explored in areas such as air traffic management [3], collaborative robot control [4], and industrial PLC programming [5]. Industrial Human–Machine Interfaces (HMIs) are designed primarily based on the Piping and Instrumentation Diagram (P and ID) or the physical layout of the plant, rather than from a process perspective. As an effect of this design principle, operator actions must be performed through several displays, causing a time loss during the intervention. Time loss can cause decreased production volume, poor product quality, or even hazardous personal and environmental situations. Therefore, it is necessary to reduce the workload of plant personnel to ensure more efficient and safer process management, which is consistent with the Industry 5.0 paradigm [6], focusing on human-centric solutions [7]. The industry is aware of the shortcomings of P and ID-based HMI design, and the solution is to develop high-performance HMIs [8]. However, “high performance” was limited to the information visualisation part of the problem, which failed to touch on the content of the display of hierarchy levels 2 and 3. Drawing level 1 displays based on P and IDs is logical, but levels 2 and 3 need a more process control-related perspective. It is already recognised that HMIs should also be adaptable and easy to use [9]. Distributed Control Systems (DCS) and Supervisory Control And Data Acquisition (SCADA) systems provide a large amount of data stored in data warehouses, supporting the development of a data-driven analysis layer with machine learning (ML) functionality for the management of process safety, and artificial intelligence will become an essential part of smart factories [10]. Although there are solutions for data-driven optimisation of industrial HMIs [9], systems containing parallel and overlapping processes require a more sophisticated method. Operator behaviour models were explored from the operation log [11] or based on semi-Markovian models [12]. The mentioned techniques are essential for developing an adaptive and interactive HMI, but are insufficient on their own. The idea of developing function-based HMI layouts has been discussed before [13], but the methodology is still based on broad system knowledge and the P and IDs. Although state-of-the-art HMI devices are already available [14] for the “greenfield” development of HMI, it is worth optimising existing systems, as “brownfield” investments offer a reasonable solution for modernisation [15]. These brownfield investments can be executed cost effectively with the use of open-source and web-based software, providing high flexibility and customisation. The proposed method shares this approach, which is also aligned with the actual trend of using the Industrial Internet of Things philosophy in HP-HMI development tasks [16].
Our suggestion is to create a HMI hierarchy and displays based on typical process scenarios and operator interactions, which helps to apply the “Navigation and Layout” perspective of the ISA 101 standard [17]. This kind of information can be extracted from the system log files, but not directly. As an operator can perform several corrective actions belonging to different subprocesses in the same time frame, a segmentation of the log file is needed to accurately identify the subprocesses [18]. The operator action log must be merged with the plant log, pairing the alarm management data with all the actions taken on the HMI by the workers. This way, the number of steps taken to react to an alarm event can be analysed, indicating the necessary amendments for the HMI (shortcuts, pop-up notifications, structure hierarchy). Alarm floods are common in DCS systems. In most cases, few alarms indicate the source of the problem, but they can initiate a massive amount of “consequence” alarms. If too many alarms are generated (which can be expected), the source alarms may be thrown out of the display, and the operator may not be able to identify them. A more transparent alarm overview display can be developed by forming alarm groups and labelling source and consequence alarms. Based on frequent alarm co-occurrences, alarms can be labelled by their priority.
The key idea of this work is that typical process event scenarios can be gained by using frequent sequential pattern mining, which is a useful technique for analysing industrial events, for example, to deal with alarm floods [19]. Scenarios enable the creation of goal-orientated log files from which, with the help of process mining tools, an integrated process operator behaviour model can be produced. Process descriptions support the appropriate labelling of the data necessary to obtain precise, informative, and comparable models. The principle of the iterative method developed is to use the combination of proper frequent pattern and process mining techniques. The proposed HMI displays and functionalities are based on the combined interpretation of P and I diagrams, process deviation models based on typical event/alarm sequences, and process control behaviour models based on typical operator responsive action sequences.
The theoretical background of the method is discussed in Section 2. In Section 3, an application example is presented in a case study, and the results and considerations with respect to the application of the method are discussed. Section 4 contains the conclusion and possible future research directions.

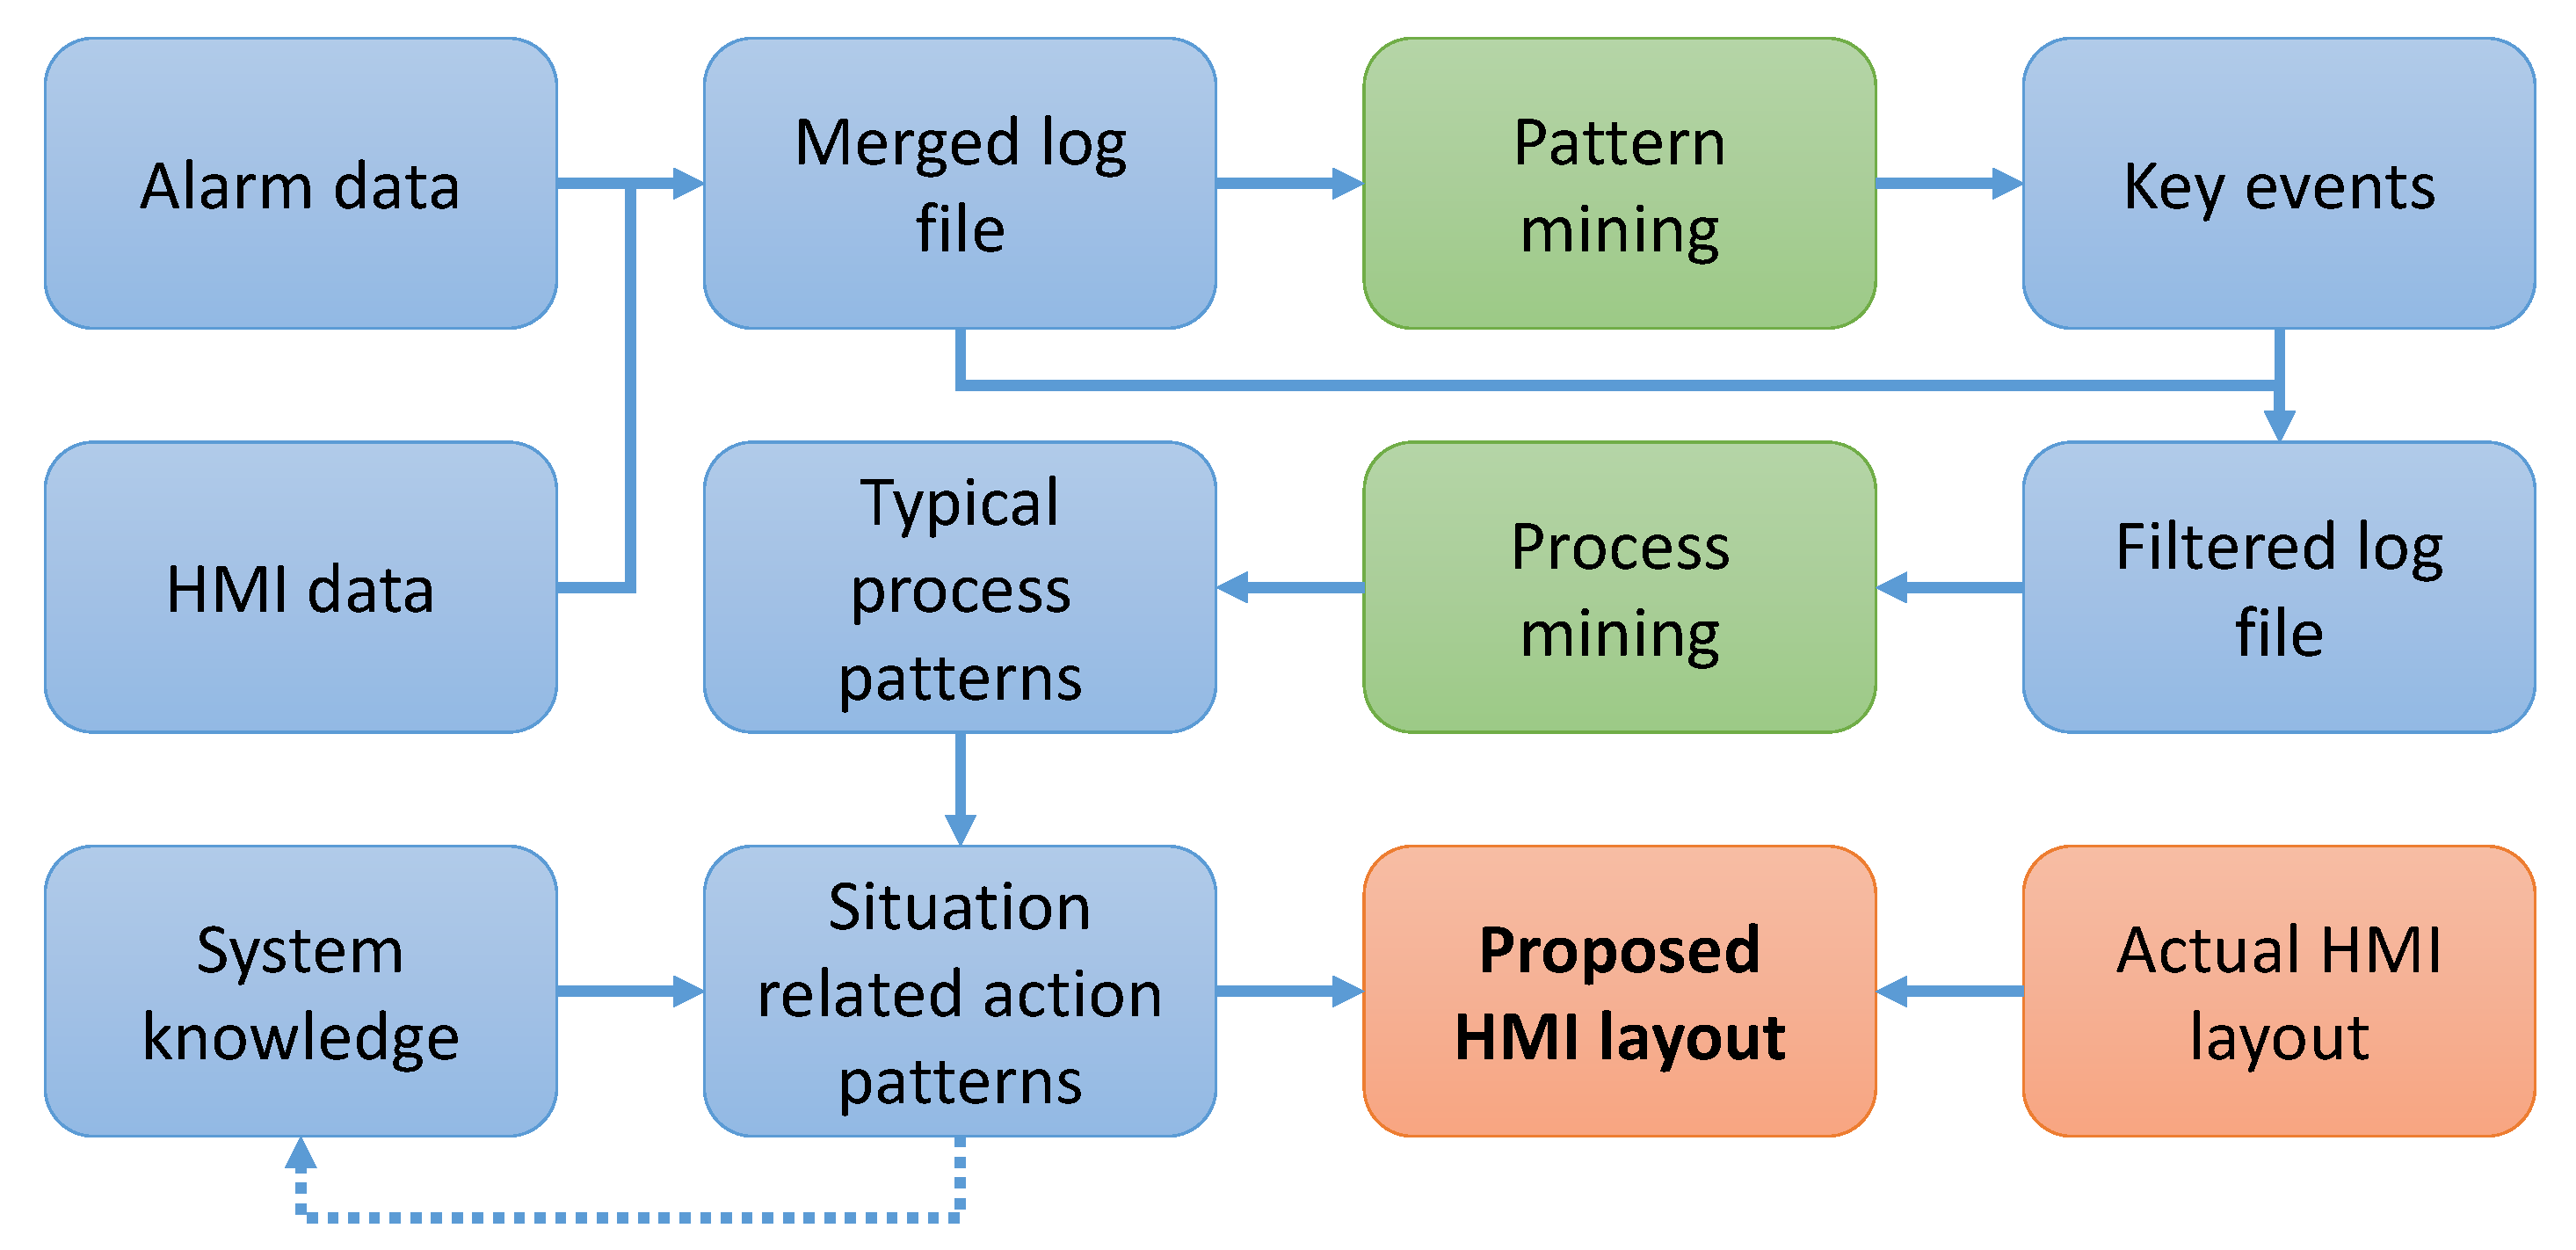
2. Machine Learning-Supported HMI Optimisation

Pattern mining-based filtering is more targeted than post-filtering methods in process mining tools, resulting in more focused process models. The proposed method can effectively support the process mining of any system in which events are stored.
In this work, the applicability is demonstrated on an alarm management system. The concept discussed in the rest of the article will be alarm-related. From the log file in which the alarms, operator actions, and display actions are stored together, key events are identified through frequent pattern mining tools. If these kinds of events are stored in separate log files, they have to be merged. Patterns can be itemsets or sequences of events. These key events frequently occur with each other, and the set of these events will be the basis for log-file filtering. The filtered log file is the input of the process mining and the output is a typical process pattern. Different filtered log files can be created from the group of critical events, resulting in different process patterns. Once typical process patterns are available, with the help of existing system knowledge, situation-related action patterns are obtained, indicating amendments in the actual HMI layout. Each new pattern enriches the knowledge of the system. The concept of the proposed method can be seen in Figure 1.
An essential condition for the development of HMI supported by ML is a properly designed log file [20]. For example, a process event in the log file can be an alarm, an adjustment of a process variable, a measured process value signal, or an alarm acknowledgement. HMI displays are drawn based on P and I diagrams, and one process event may belong to different subprocesses, so some controlled process variables are placed in more displays, as they can affect several parts of the plant. Based on the stored events, process models can be gained by using process mining algorithms, such as Heuristic miner [21].
The design goal of a High-Performance HMI (HP-HMI) can be to minimise the number of displays and the amount of information on the displays, and to have supportive process-orientated display layouts. The applicability of the proposed method is highly dependent on the quality of the stored data in terms of proper labelling. If many subprocesses are related to more plant units, the creation of overview-like displays is recommended, containing only the relevant process values and controlled process variables.

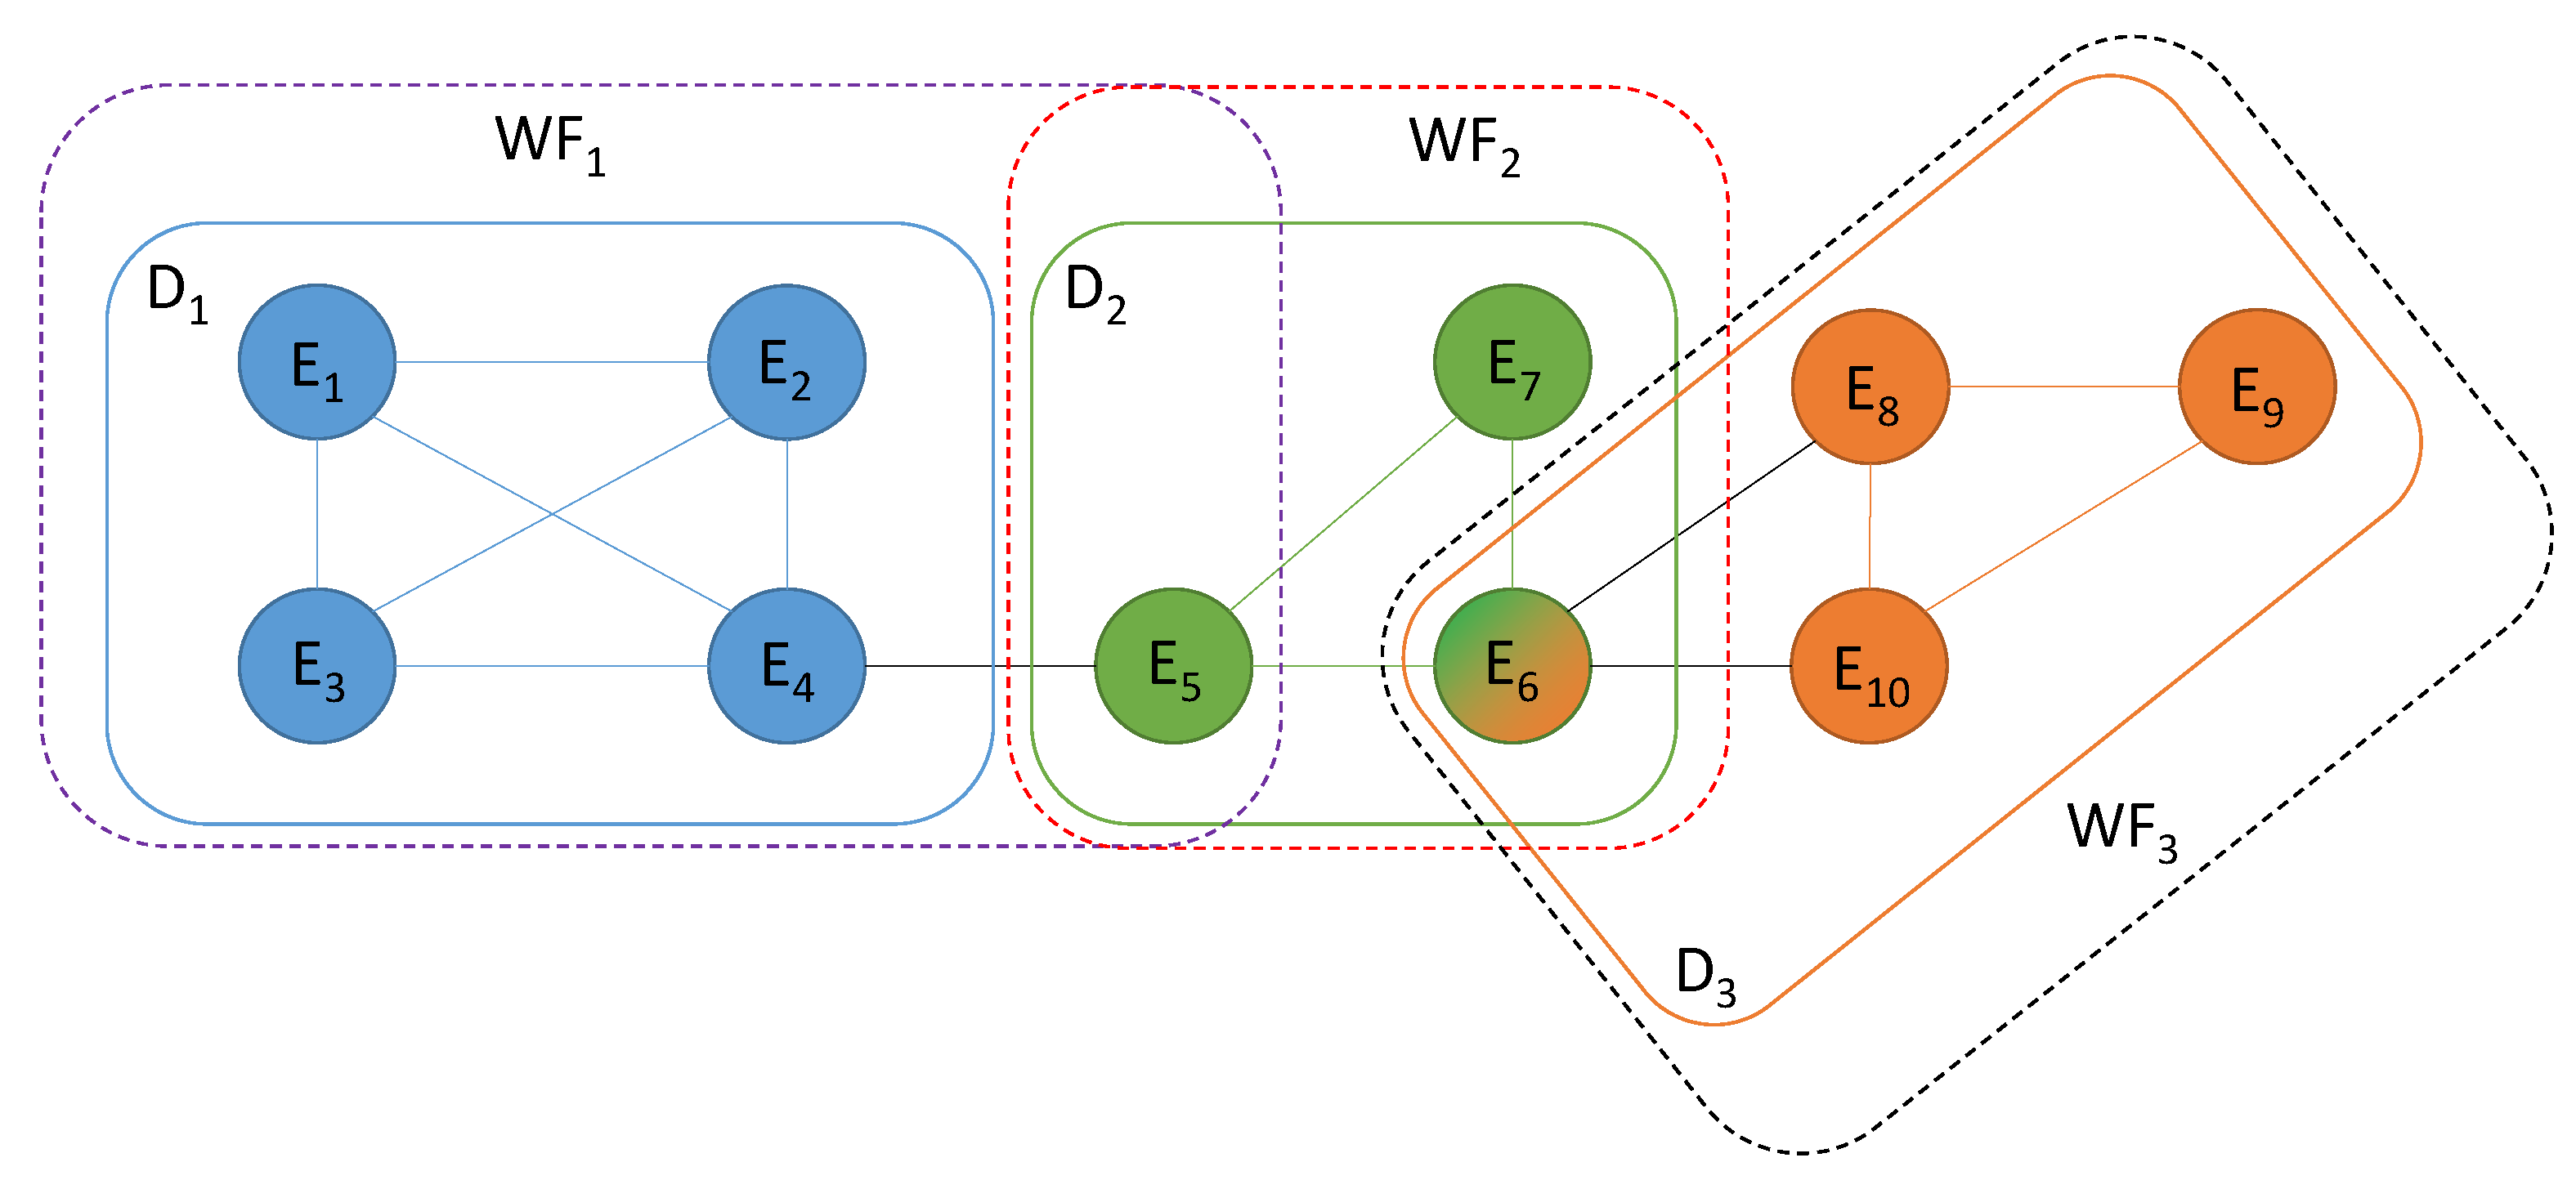
2.1. Identification of the Workflows as Frequent Event Patterns

The basis of the process exploration tasks is an L log, represented as a set of events (E) stored in the order of their occurrences. In alarm management, events can be alarms, operator actions, process variable changes, etc. These events are considered states of the system formed by < P V , a > tuples. P V is a process variable and a is the attribute indicating the state of the variable. For example, E j = < o i l t e m p e r a t u r e , h i g h > .
An L = { T 1 , , T n } log contains T k = { E 1 , , E p } traces, where k = [ 1 , n ] and p = [ 1 , z ] . A trace is a subset of all E = { E 1 , , E z } events within the log file that describe a sequence of process control activities. Considering that traces are formed of events in a given sequence, the most frequent traces can be considered as process patterns or workflows. Therefore, events assigned to a workflow are also a subset of all events.
W F j = { E 1 , , E k } E .
From another perspective, a workflow is a valid frequent sequential pattern and can be defined using frequent sequential pattern mining. A sequential pattern can be considered frequent if it exceeds a predefined minimum support value, that is, the number of traces where the pattern is present and is a hyperparameter of the method. Besides the minimum support value, confidence can be considered as another hyperparameter, that is, the strength of connection of the event patterns. An s-length workflow, e.g., sequence can be split into s subsequences, W F j = { W F j 1 W F j i W F j s } . The confidence can be calculated as follows:
c o n f ( W F j i ) = s u p ( W F j i ) s u p ( W F j i 1 ) × c o n f ( W F j i 1 ) s i > 1 1 i = 1 ,
where s u p ( W F j i ) is the number of traces in L, where W F j i occurs.
Each confidence value of the transitions can be interesting, not just the confidence value of the whole event chain. Consider a sequence of events, where the last event has great negative consequences. If the transition confidence of any parent–child event pair is low, the overall confidence of the whole workflow will be low as well (Equation (2)). If this low transition confidence value is at the beginning of the workflow, and all subsequent transitions have high confidence, then the unwanted last event will have a high probability of occurrence after a certain event sequence has occurred. Knowing these sequence confidences, critical event scenario milestones can be identified that support the creation of event forecast models [22].
Frequent sequential patterns support the goal-orientated creation of log files that describe the target process. The process model can be created using process mining techniques on the created log. The selection of the pattern mining technique depends on the complexity of the actual system, for example, the number of parallel processes.

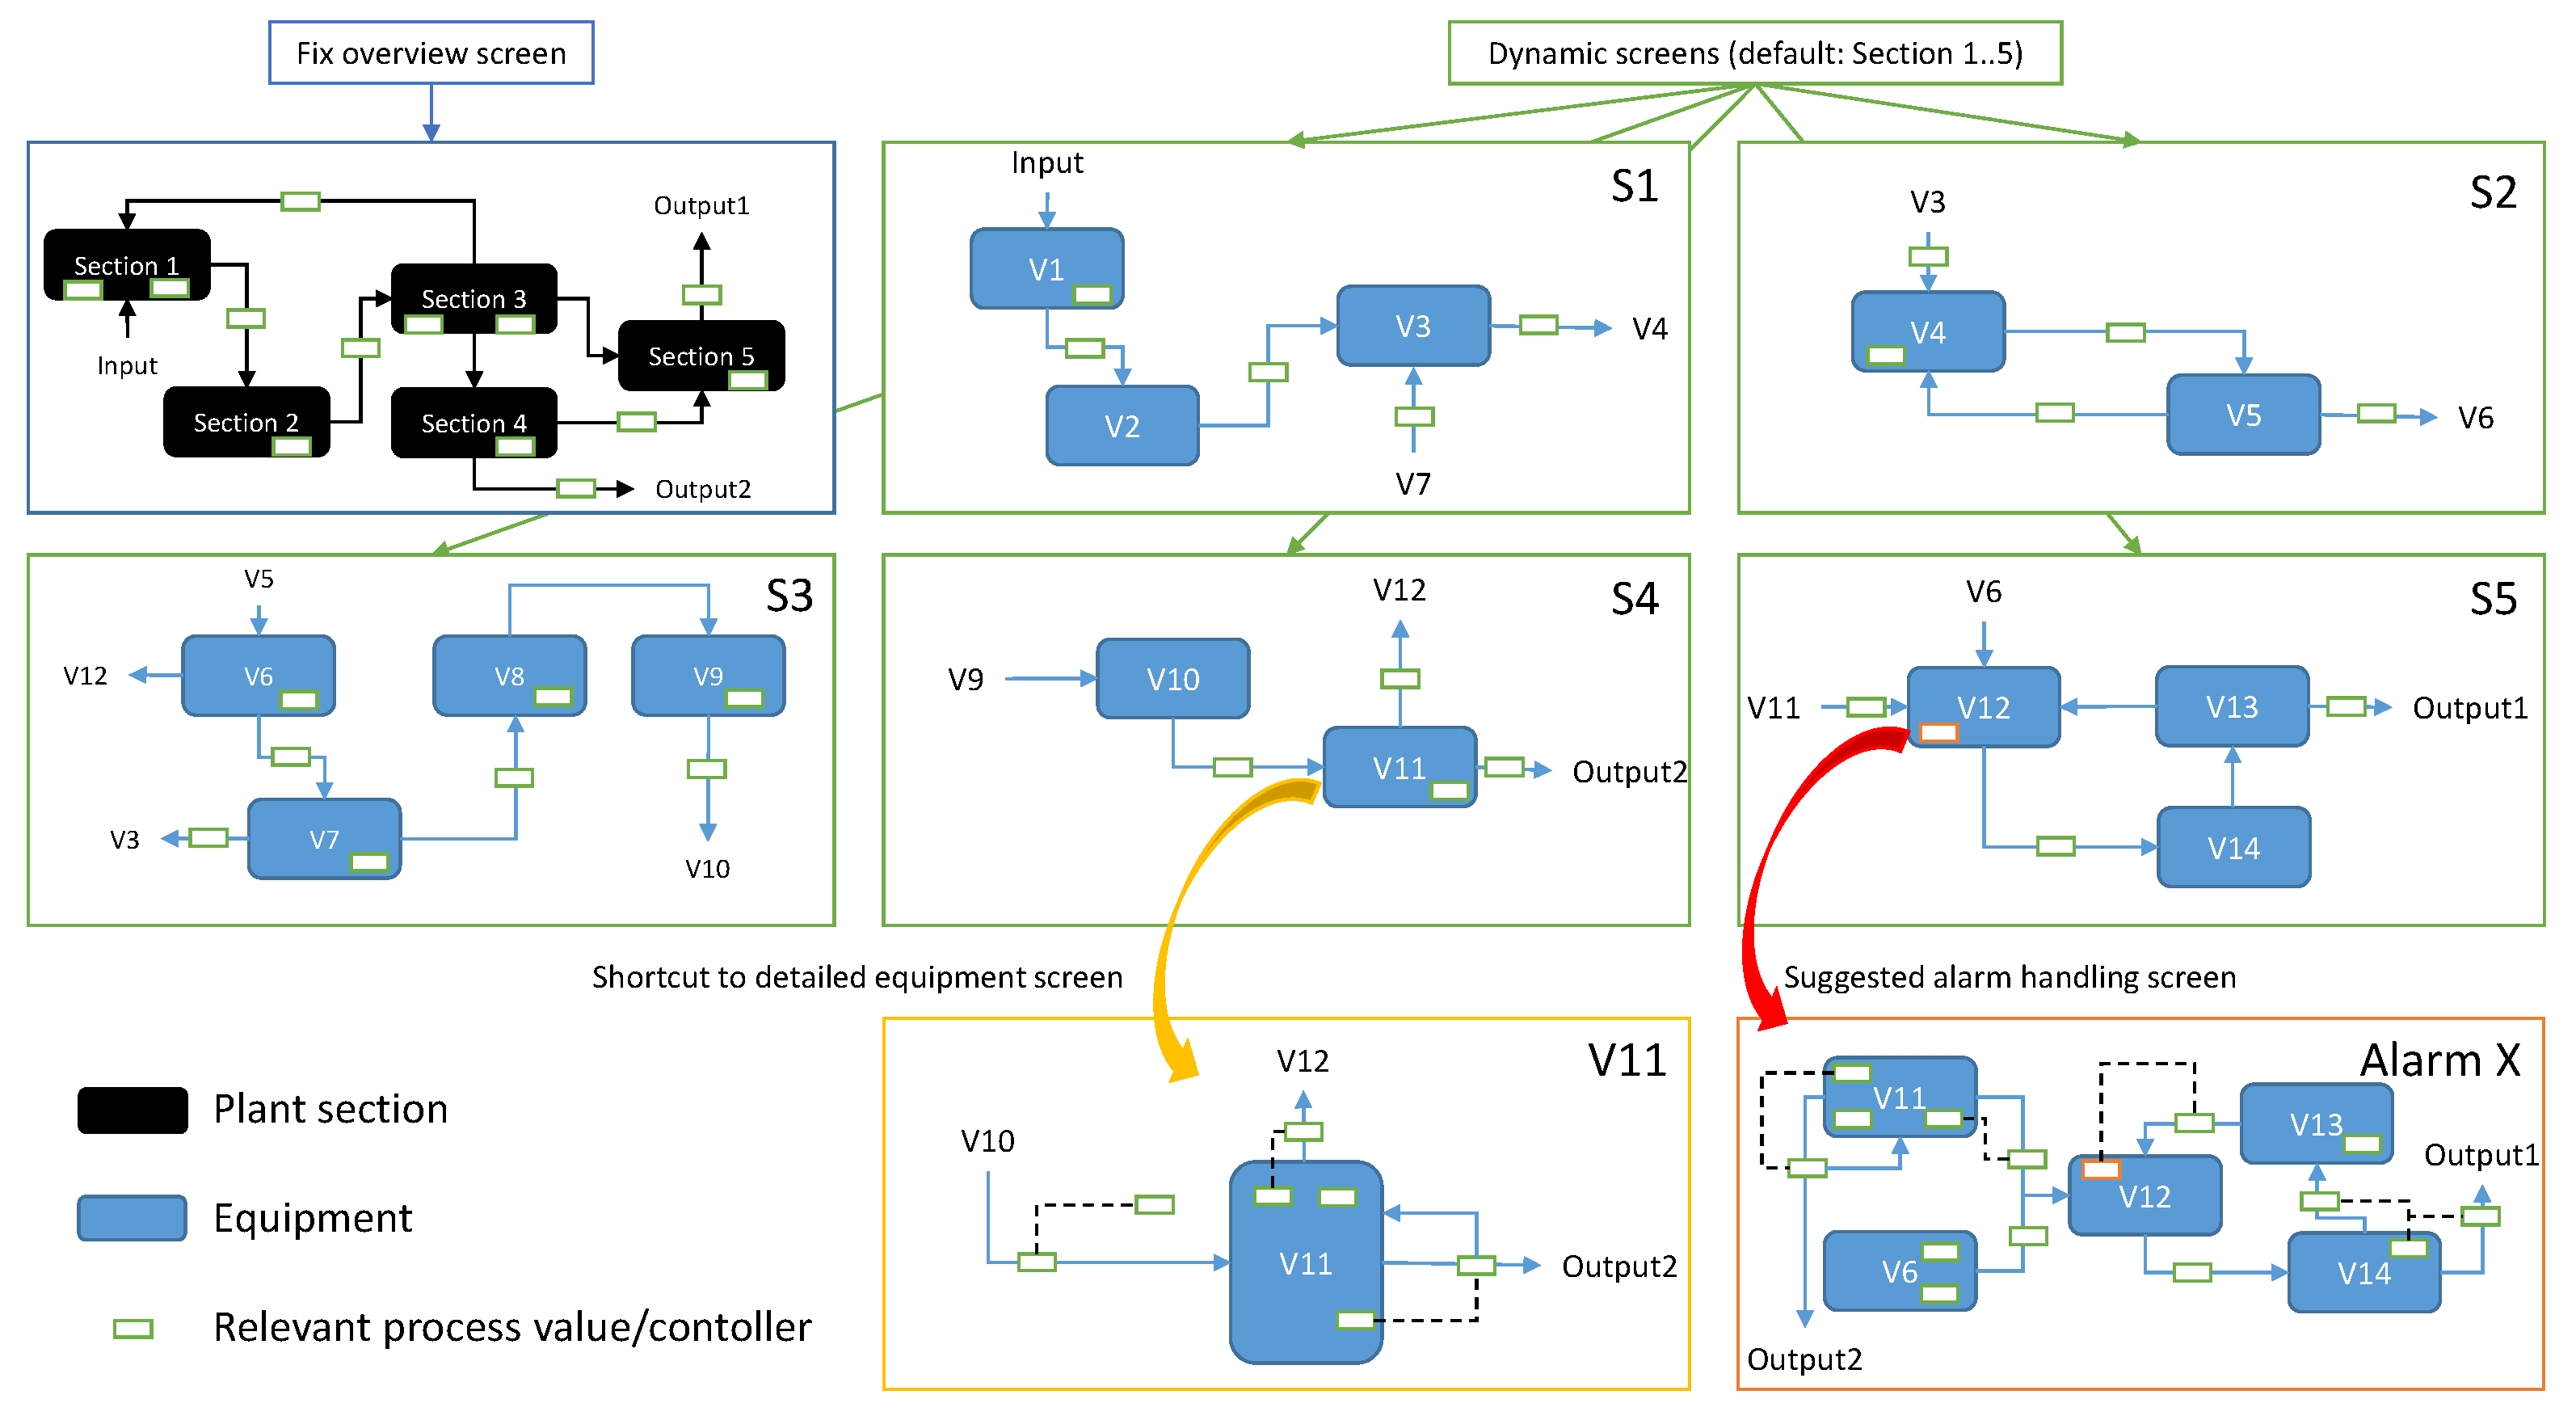
2.2. Connection between Workflows and Displays

Elements of an HMI display are visualisations of the process variables and their conditions; e.g., they describe the actual state of the system. On the basis of this notation, a D display can be considered a set of events, that is, a subset of all events (similarly to workflows). A set of displays is assigned to a workflow.
D m = { E 1 , , E n } E , D ( W F j ) = { D c , , D m } W F j .
This means that an element on a display may belong to more workflows, and a workflow may be represented on more displays. The number of elements in a given display cannot exceed a threshold C due to the cognitive limits of the operators with respect to signal perception [23]. The goal is to minimise the number of displays allocated to a workflow to ensure that the operator does not have to switch too much between different displays when solving a frequently occurring problem. This way, C can also be a hyperparameter of the method.
| D m | < C , m i n | D ( W F j ) | .

2.3. Workflows, Displays, and Their Elements as a Community

Another way to define the ideal event-display order is to apply the community theory [24]. Consider a W F j | j = [ 1 , w ] workflow as a graph, where the W F j = { E 1 , , E z } events are the nodes, and the sequence of the events indicates the edges between them, resulting in a directed graph. Due to the confidence values of the event transitions, the graph is weighted as well. The D ( W F j ) = { D 1 , , D m } set of displays containing events related to W F j are subgraphs of W F j . If more displays are aligned to a workflow, the order of the used displays form a sequence as well; the graph of the displays is also directed and weighted. In a plant, there are w workflows in parallel. D W F = i = 1 w D ( W F i ) is the set of all events on all displays related to all workflows. If the node connections of D W F are marked with V ( D W F ) , then the minimum goal is to have displays that form a weak community, and the problem to solve is
V e x t ( D W F ) V i n t ( D W F ) < 1 ,
where V i n t ( D W F ) is the number of connections for nodes within the displays, and V e x t ( D W F ) is the number of connections for nodes between the displays.
The best solution is to have displays in which the nodes within each display form a strong community. If the number of displays is m, then the optimisation problem is
m i n i = 1 m V e x t ( D i ) V i n t ( D i ) ,
e.g., the intersection of the displays must be minimal. Obviously, in real life, the zero intersection between displays is not realistic, but can be approximated. Equation (6) also indicates that the optimisation is performed for the whole system, not on each workflow–display pair individually. An idealistic state can be seen in Figure 2, which can be reached with the help of a community detection algorithm. It is very important to note that in industrial control systems, communities overlap. This problem must be addressed by the detection method, as in [25,26].
The time complexity of the method consists of three maximum parts: pattern mining ( O p a ), process mining ( O p r ), and optional network visualisation ( O n e ). If E denotes the number of different events stored in the L log (with a size of L ), and N is the number of traces with sizes of T i (considering sequential pattern mining):
O p a = O ( i = 1 N | T i | ) + O ( | L | × | E | ) + O ( 2 | E | 1 ) × O ( | L | ) , O p r = O ( | L | , | E | 2 ) .
In a network-like representation of the sequence of events, the nodes are the events (E) and their transitions are the edges. To visualise the process, a weighted network can be applied, where the weight of the edges is proportional to the number of transitions between the nodes. The complexity is the maximal number of edges between the E nodes:
O n e = O ( E × ( E 1 ) )
Considering that industrial control systems contain a large number of elements, e.g., events, the complexity of the method increases exponentially with E . However, it should be noted that the method is useful in the planning phase. In this way, the speed of applicability is not that important, and the specific system has a huge effect on the complexity.

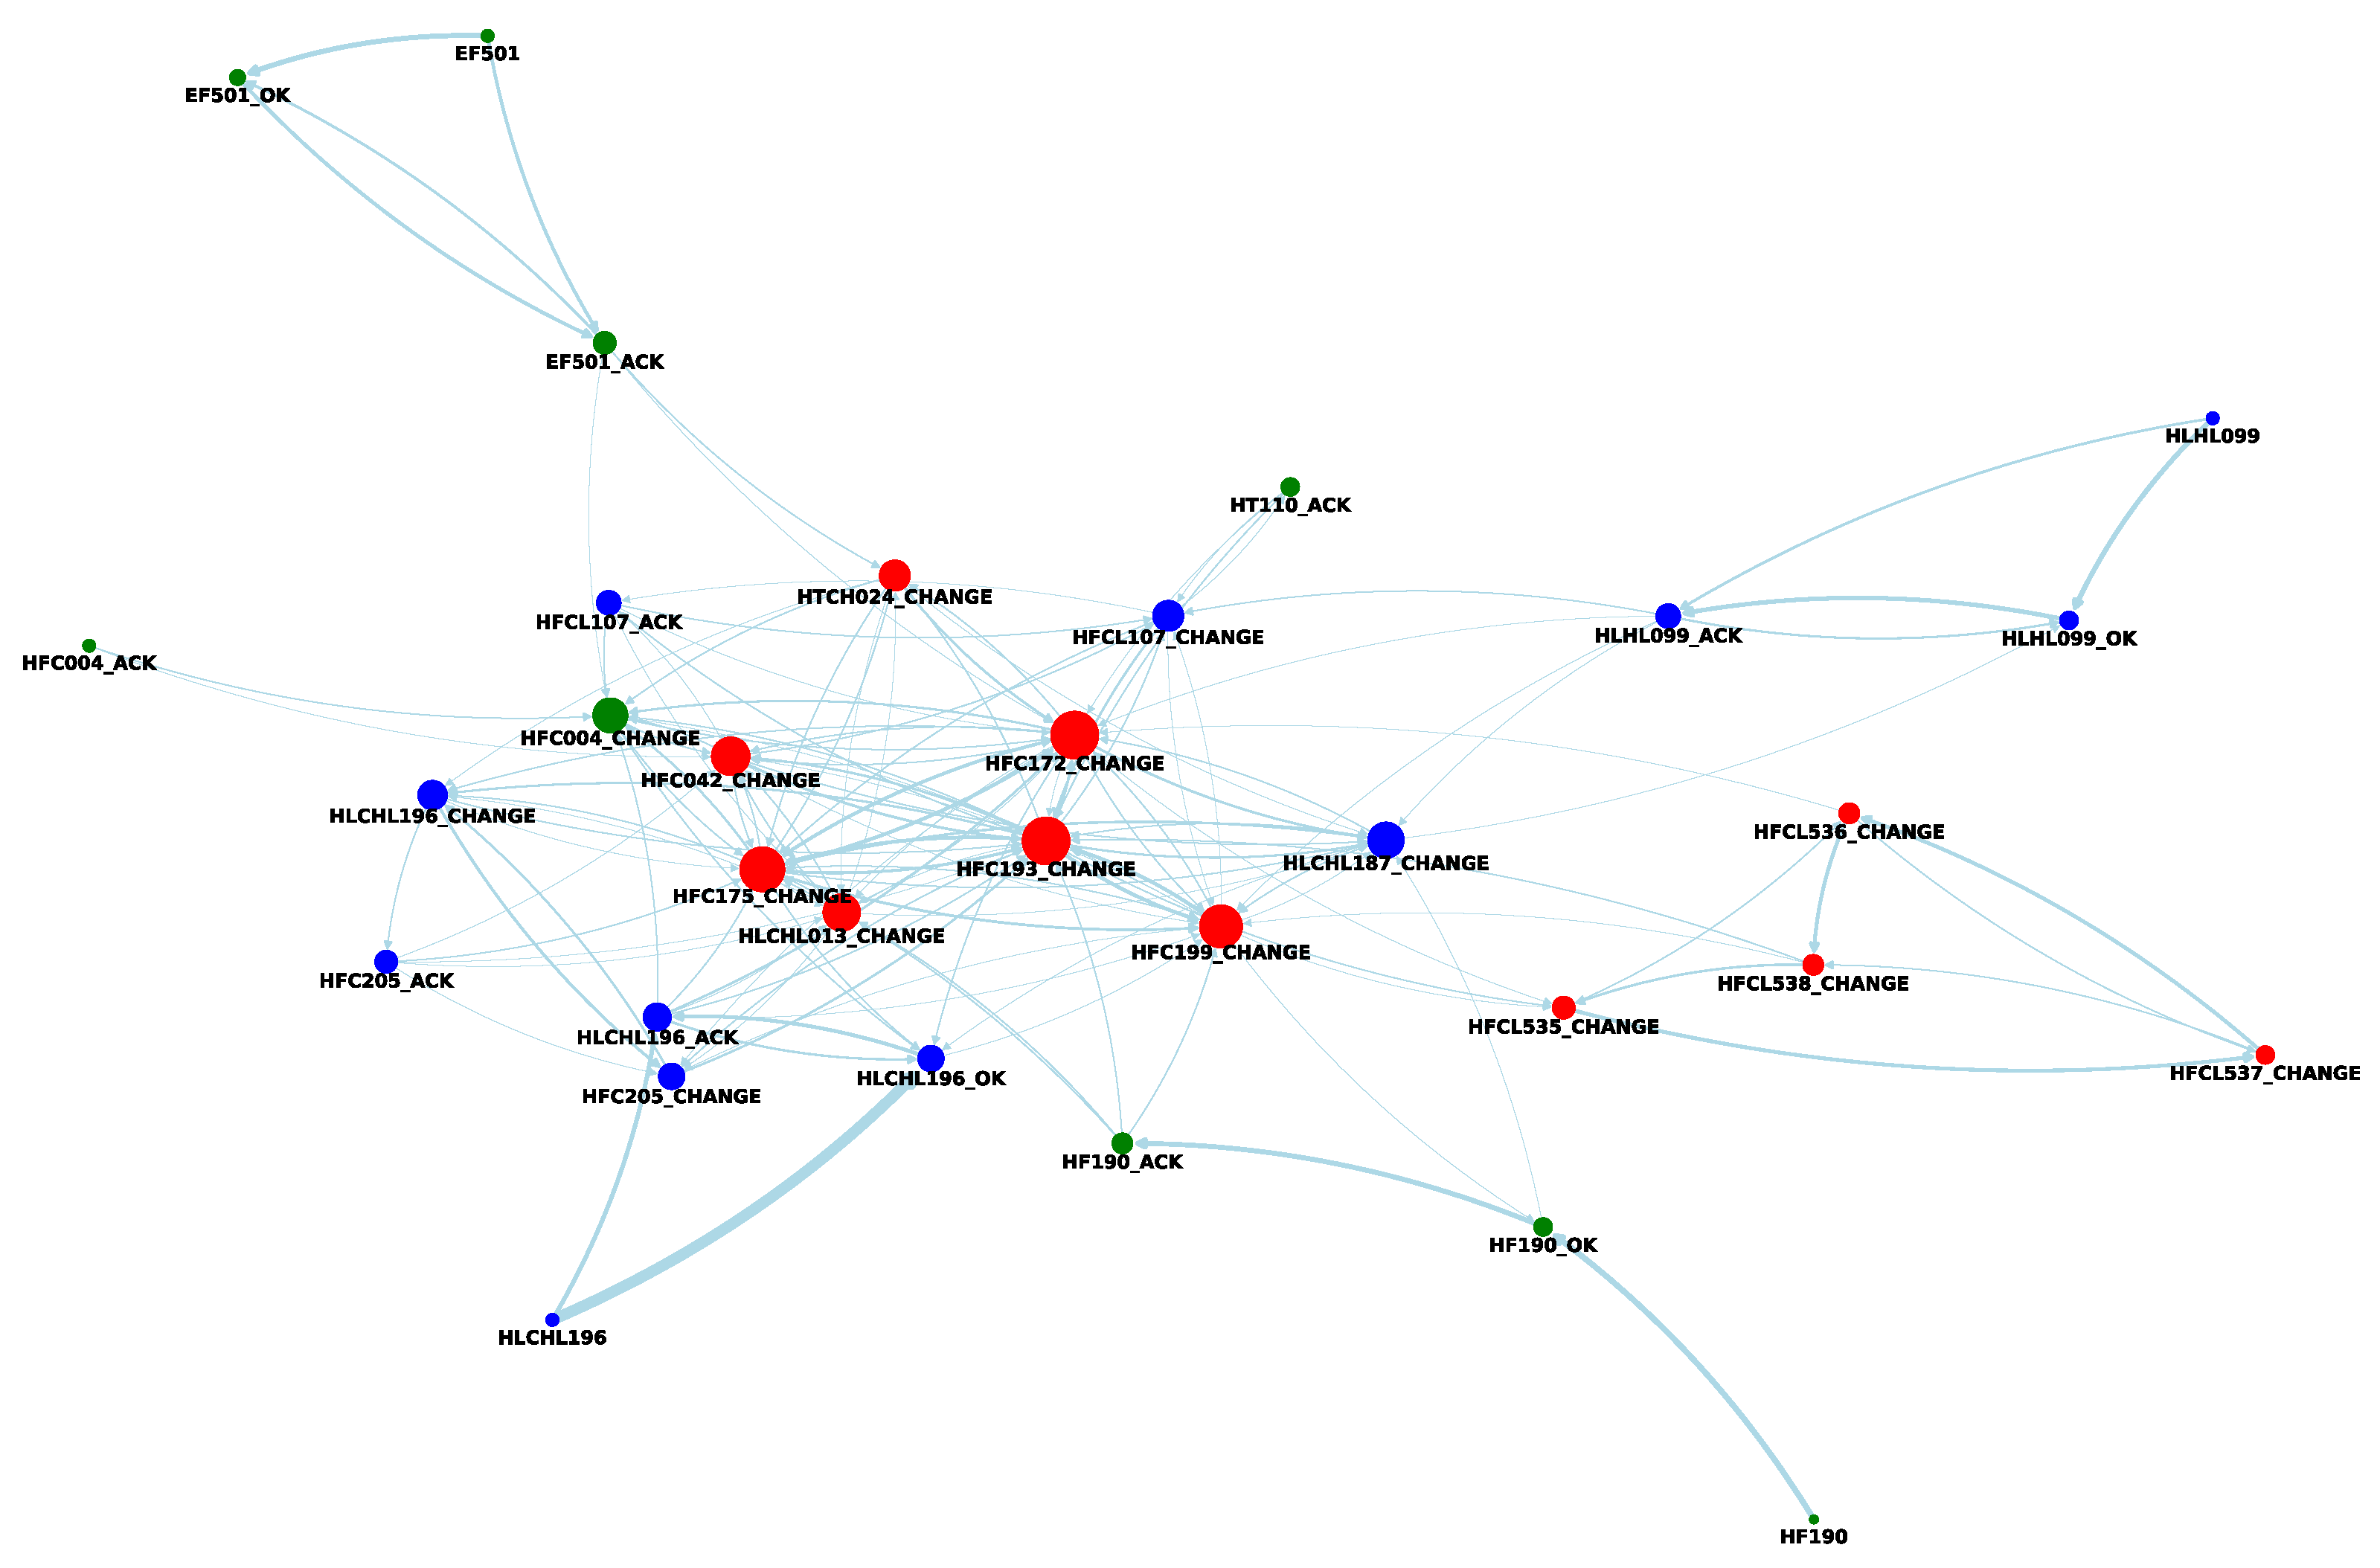
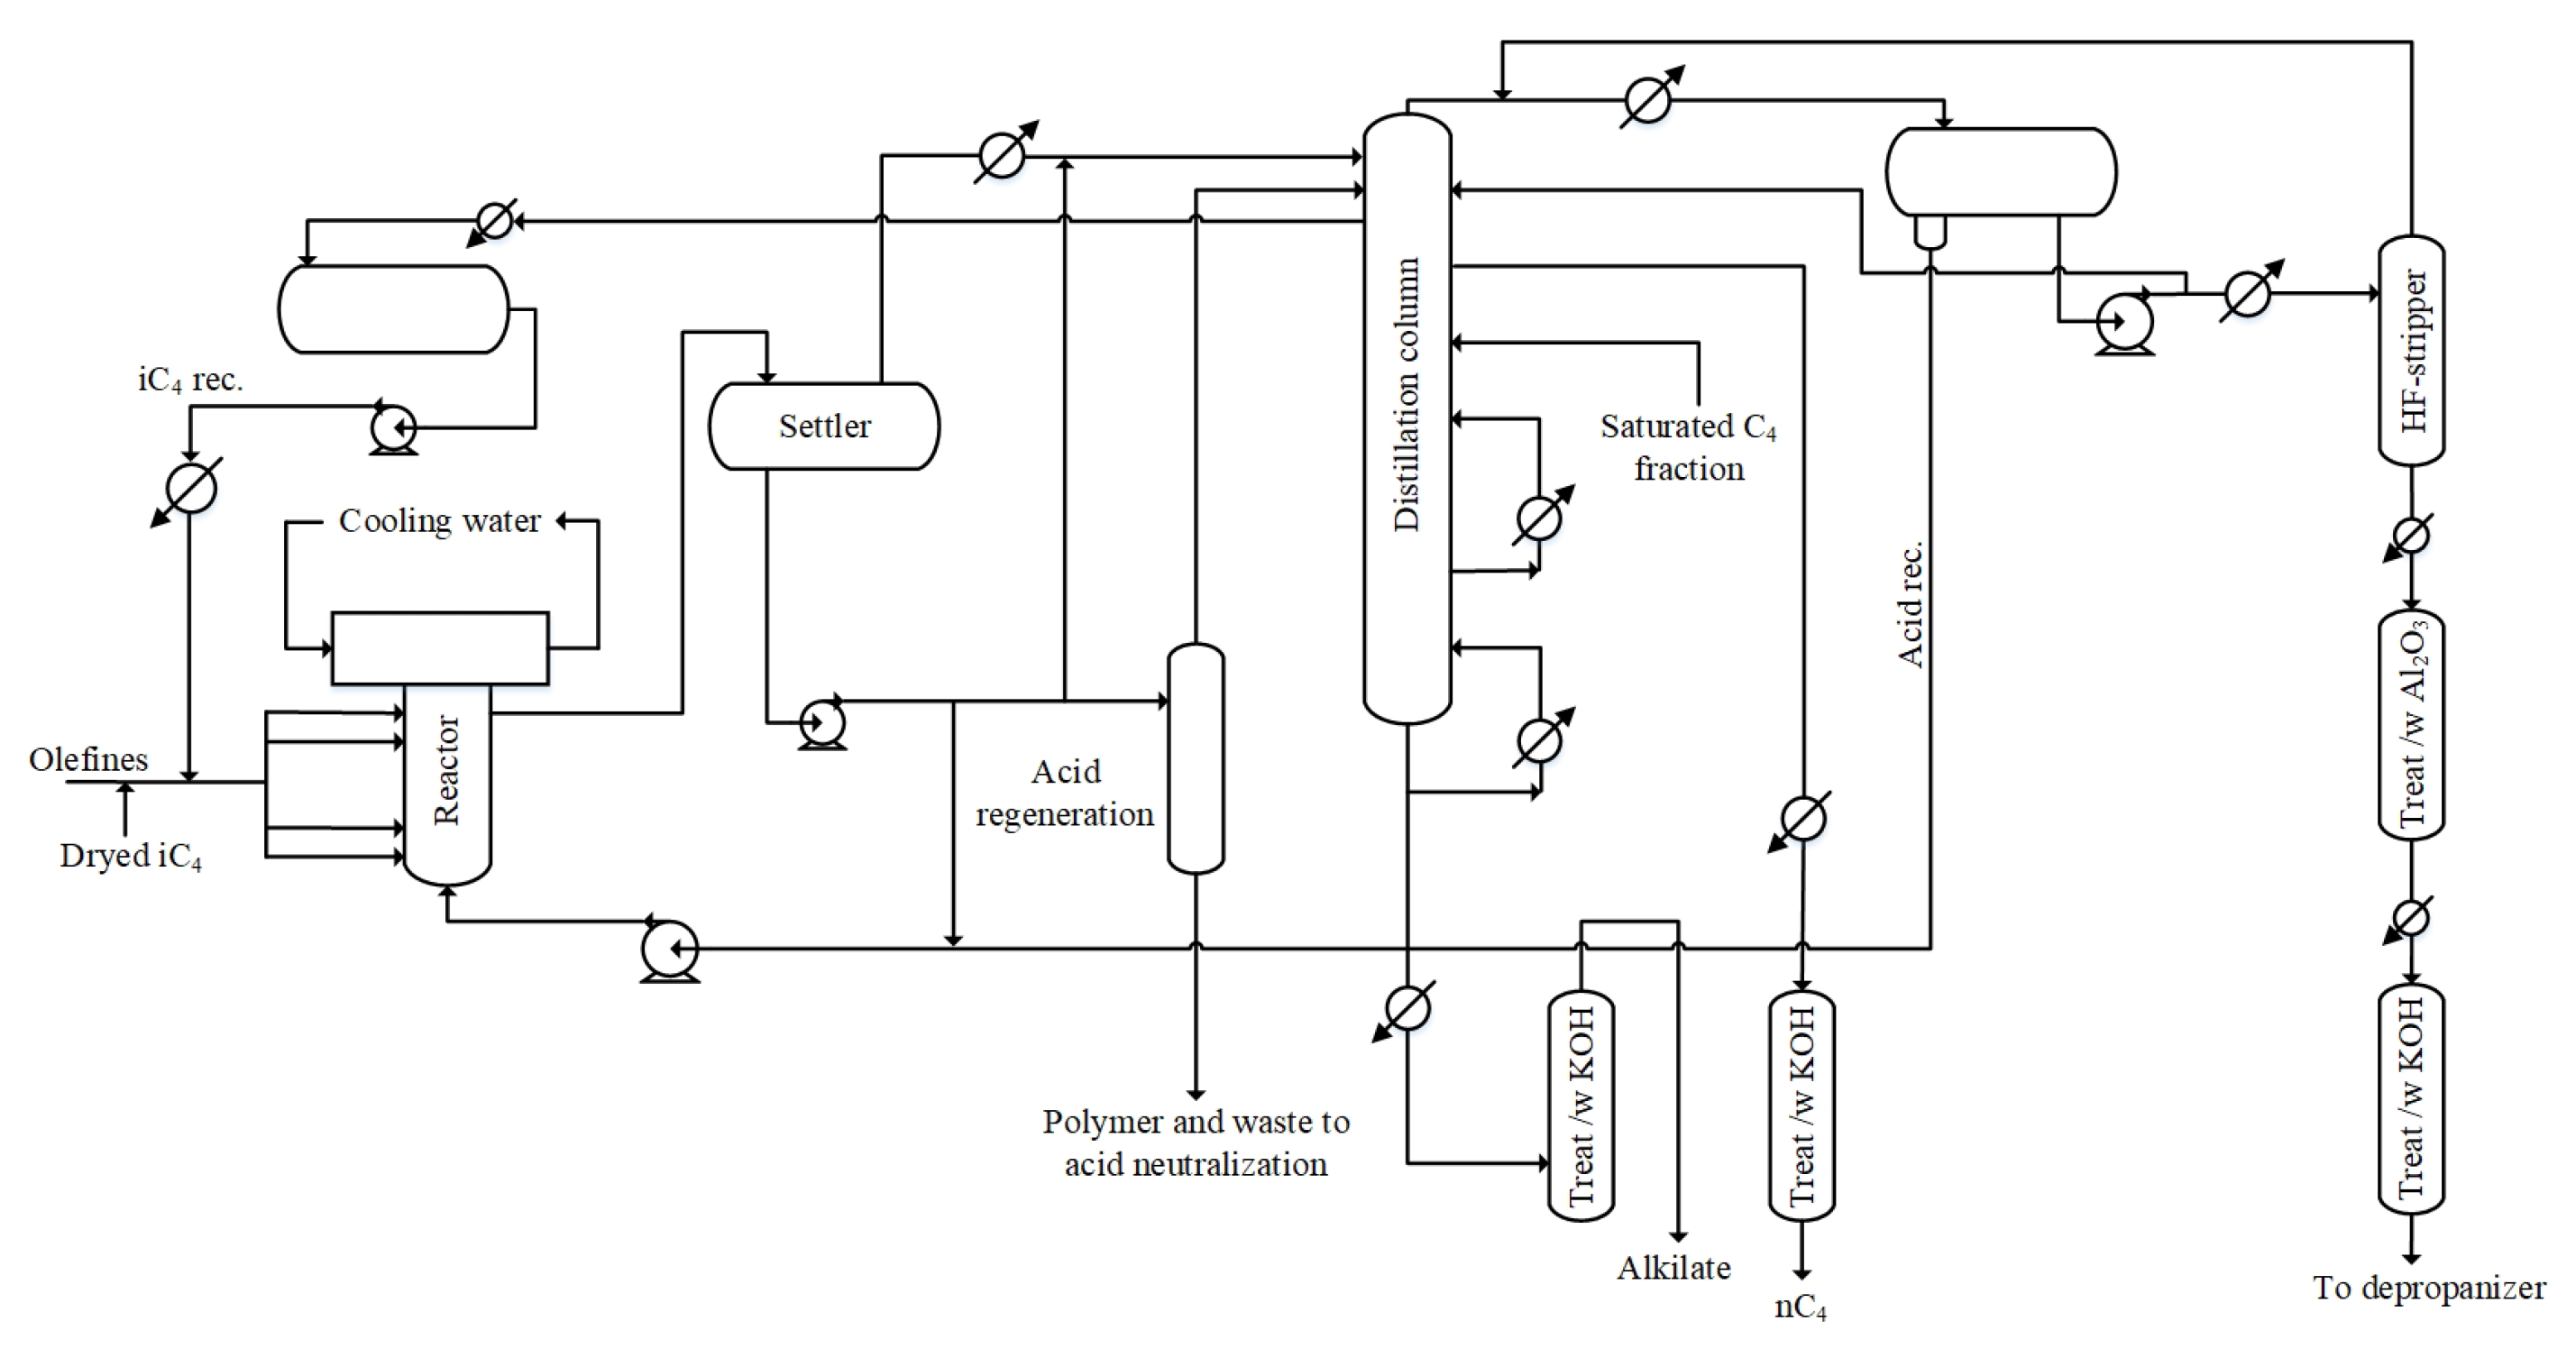
3. Application of the Method on a Real-World Industrial System

To validate the effectiveness of the method, the chosen place of application was a real-life Hydrofluoric Acid Alkylation plant. The schematic drawing of the plant can be seen in Figure 3.
The method has modest computational requirements. The computer used was a HP EliteDesk 800 G3 TWR with an Intel (R) Core (TM) i7-7700K CPU @ 4.20 GHz, 64 GB RAM and Windows 10 pro (x64). With this configuration, the algorithms used had running times in the range of minutes.

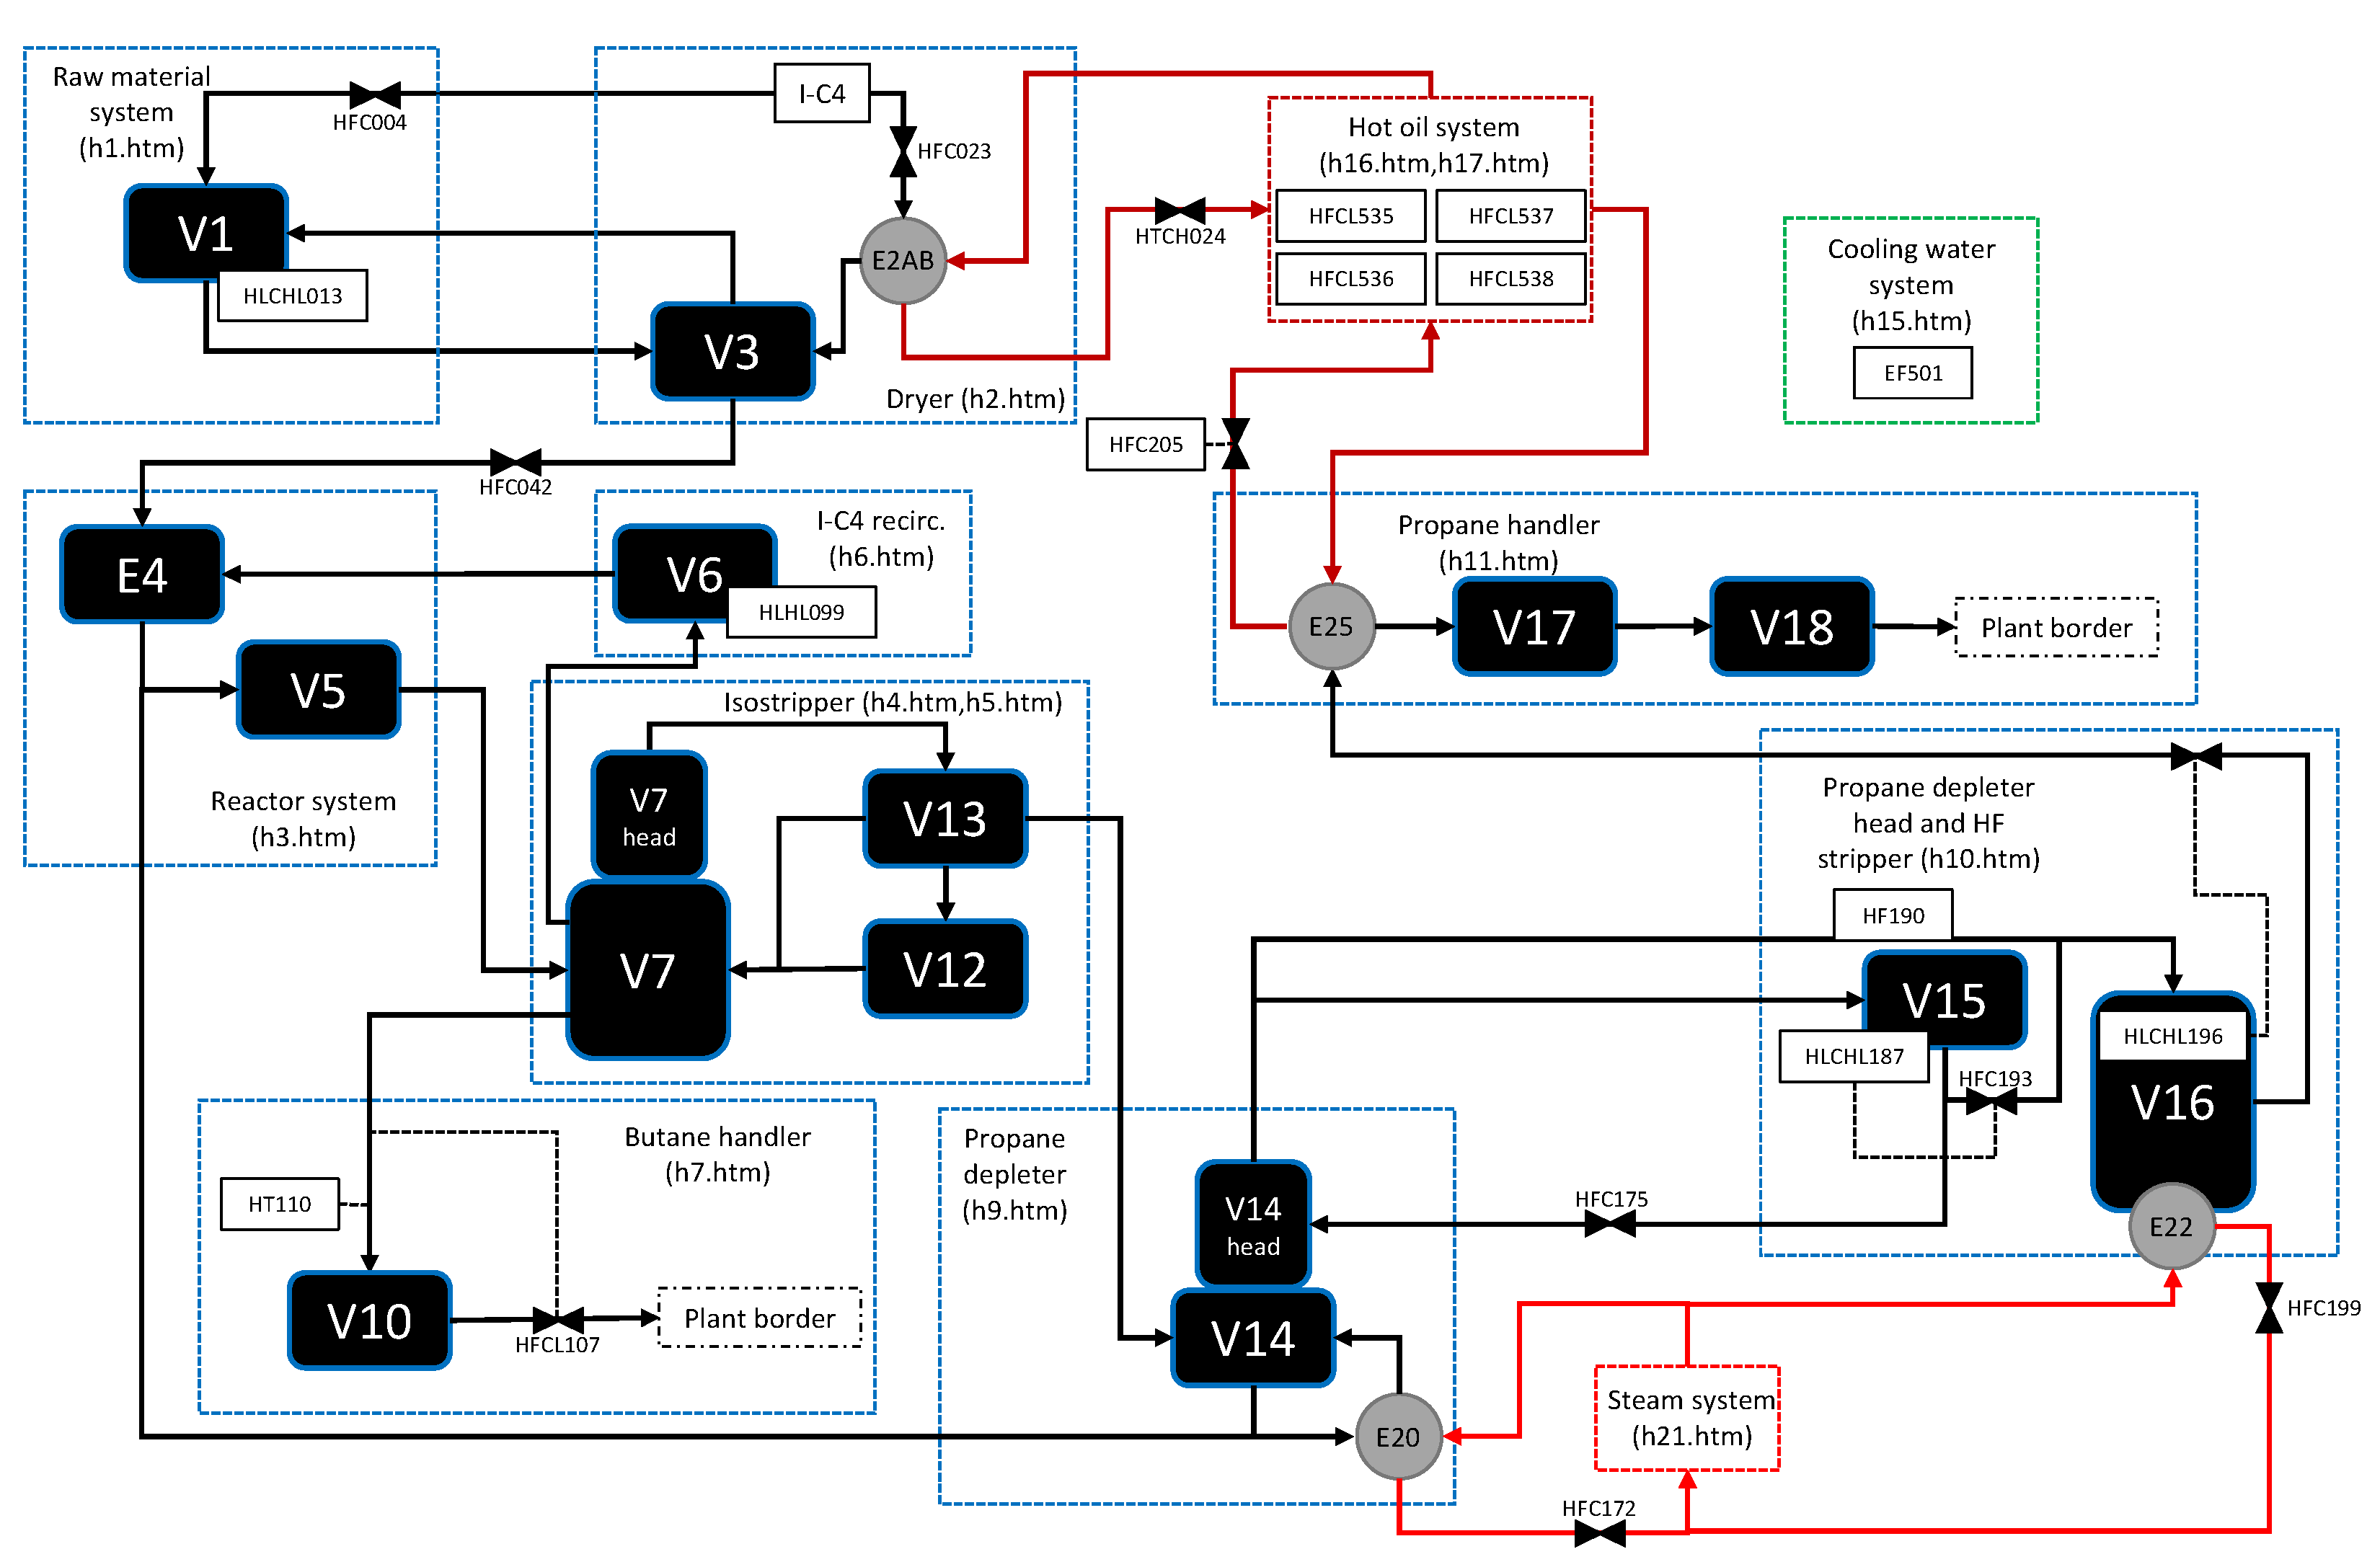
3.1. Problem Description
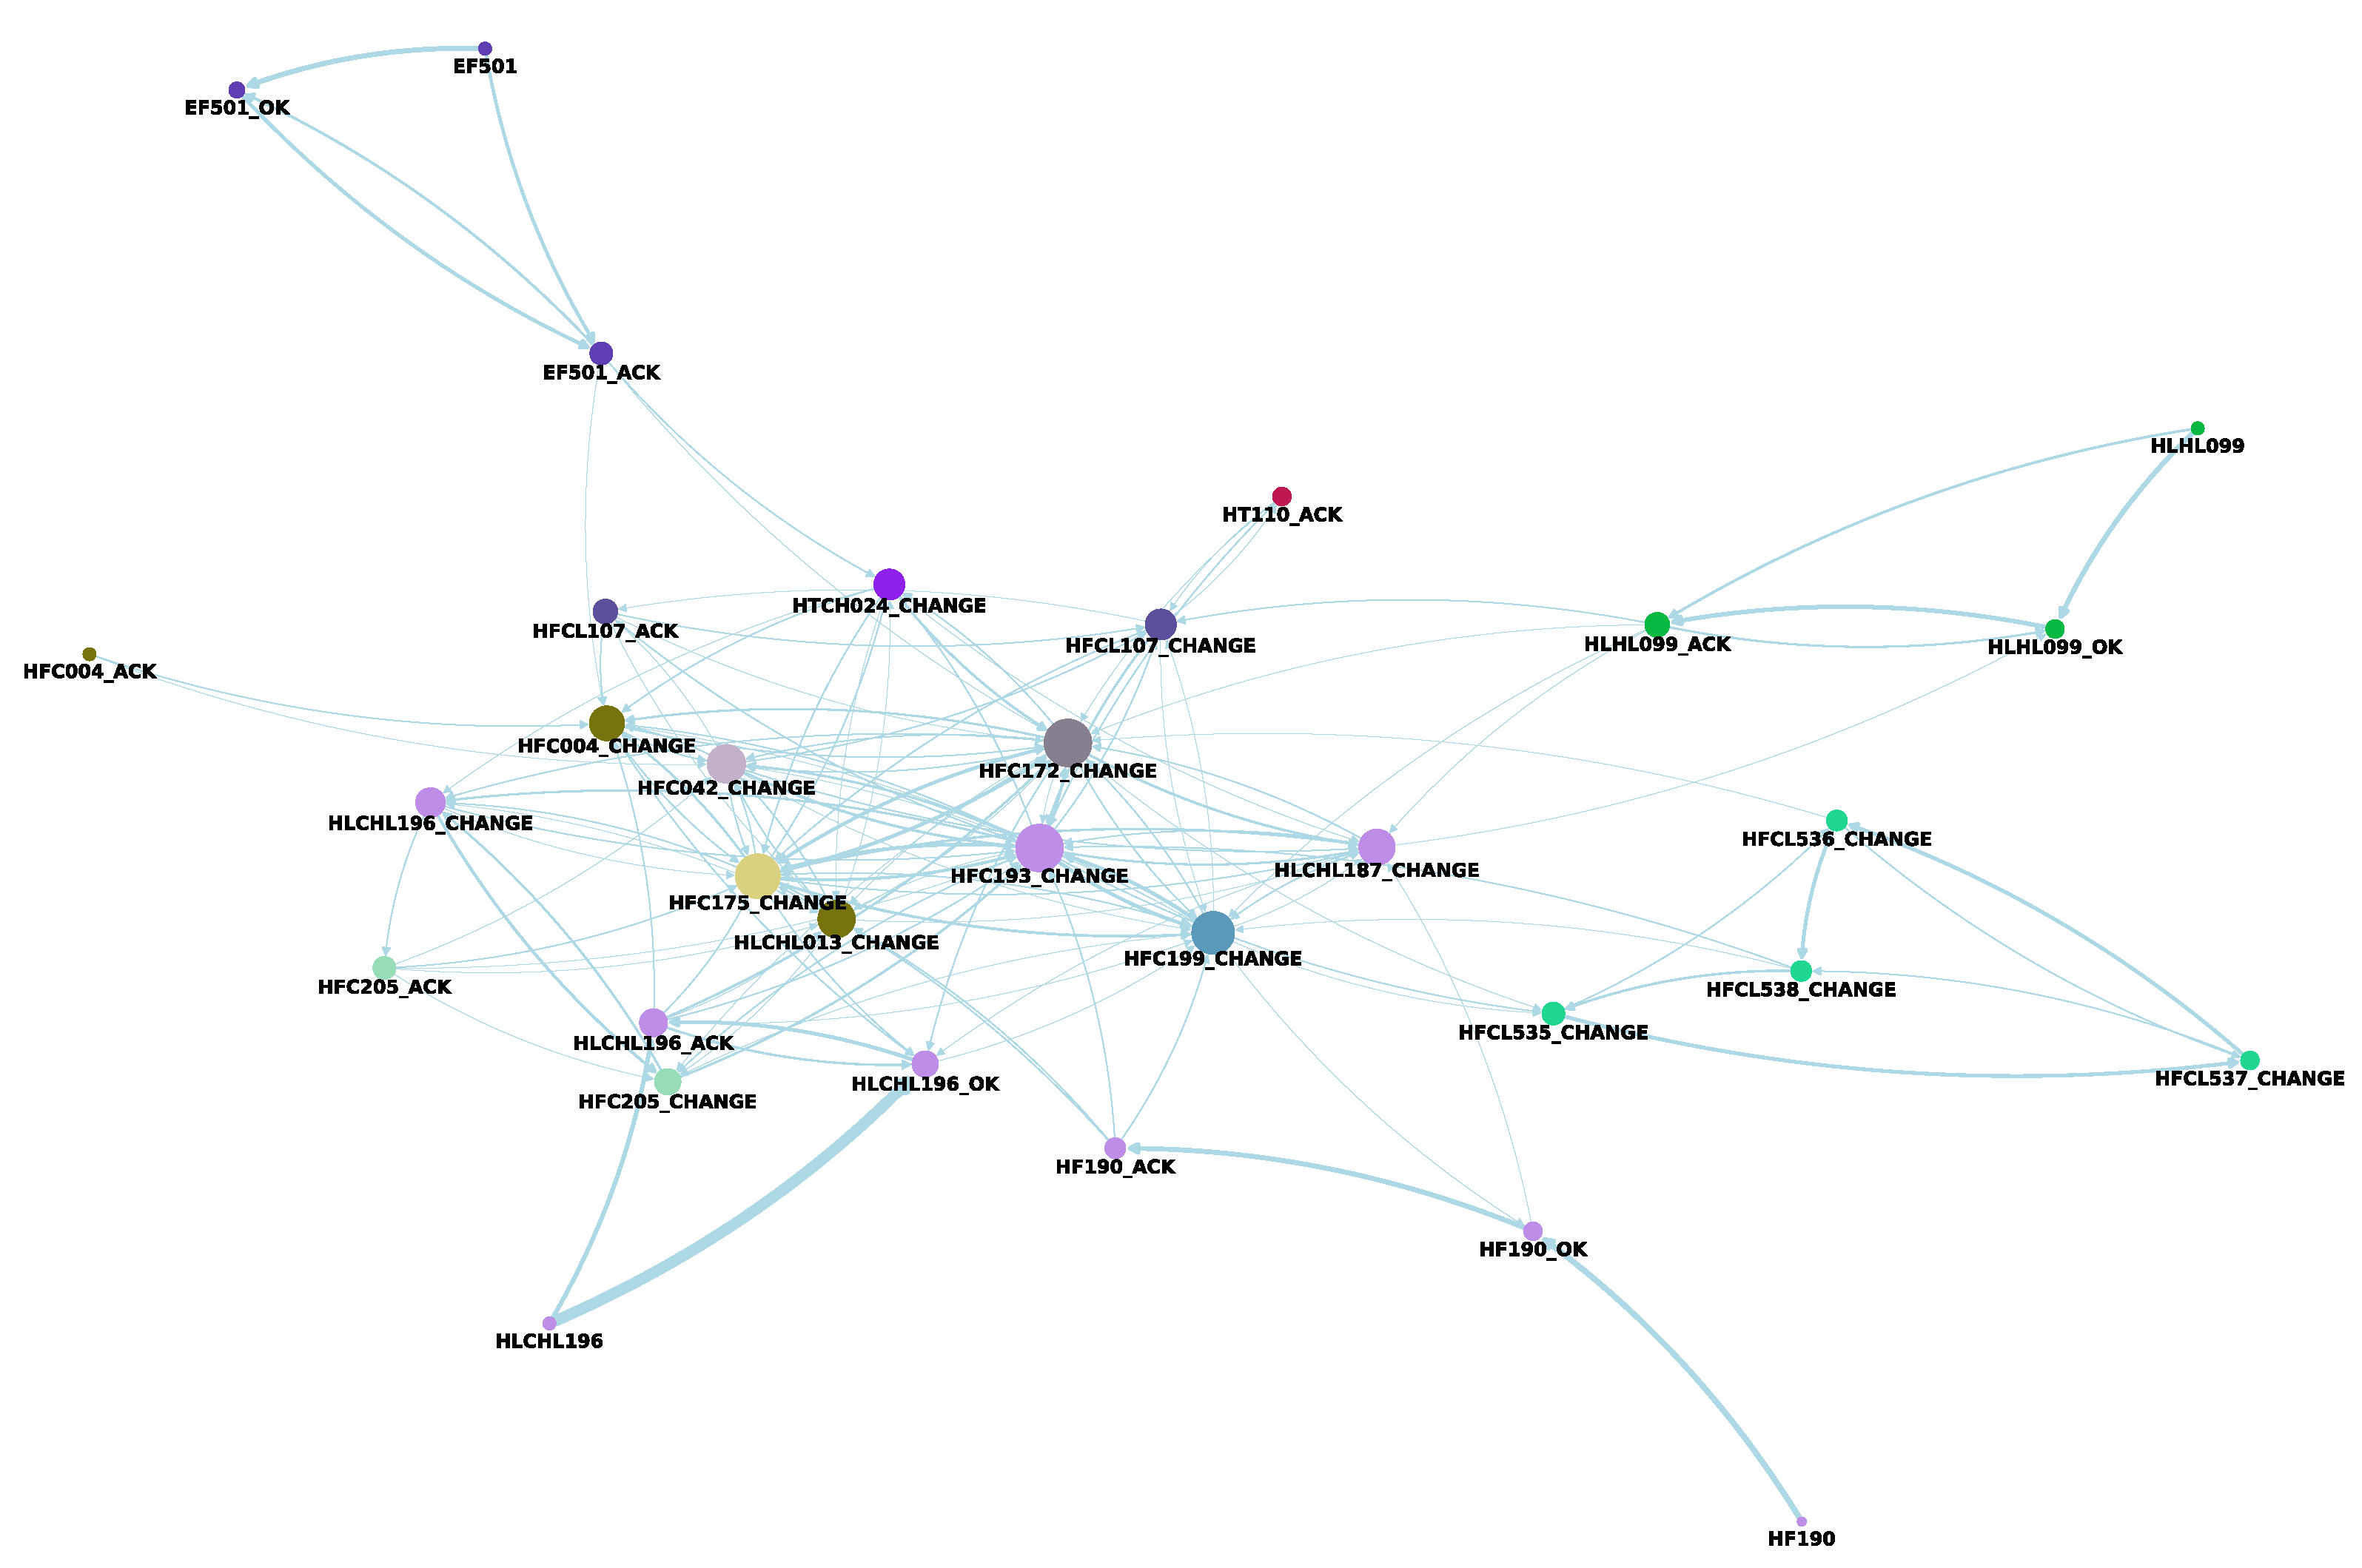
The processed log file contained more than 200,000 events over a month. After filtering out events that have incomplete data regarding relevant properties, approximately 90,000 events remained. After processing the remaining events, one was identified as a chattering alarm; it was also removed, resulting in a log with around 20,000 events, distributed among 276 tags. The trace rule threshold was set at 120 s (the minimum time interval without any logged event) on the basis of industrial experience. Based on the results of frequent sequential pattern mining, the log file was partitioned, defining a specific subprocess. A network-like representation of the frequent sequential patterns found can help us select the ones needed to filter the log file. All steps of the proposed method (Figure 1) were carried out without deep knowledge or experience related to the plant to ensure objectivity and avoid manipulation during the exploration of the process. The results were evaluated with the plant staff.

3.2. Results

The resulting process model can be seen in Figure 4 and Figure 5. The mining algorithm used in the process was Heuristic miner, the minimum activity count was set at 30. This threshold depends on the event-occurrence distribution and has to be specified case by case. Heuristic miner is a well-known and widely used process mining algorithm, offering a good balance between the usual benchmarks of process models: simplicity, generality, fitness, and precision.
The frequent sequential pattern mining algorithm was selected from the SPMF [27] library, which offers a wide range of pattern mining algorithms. The algorithm used was CM-SPAM [28]. The optional hyperparameters offer good flexibility and a customising option for the pattern mining task and also provide good computational speed. Table 1 shows the effect of minimum support on algorithm performance. It is clear that increasing this hyperparameter causes a significant change in the results.
Another performance check option is to change the number of processed traces. Table 2 shows that increasing the number of traces does not cause a significant computational demand. As discussed in the complexity analysis, the dominant factor is related to the pattern mining step, so it can be stated that the method is capable of handling large log files without excessive computational demand.
Based on the data provided by the mining algorithm, a network-like representation of the event chains can be created. This kind of visualisation considers the placement of several process model attributes on the graph, which is an advantage over the built-in visualisation of the Heuristic miner. These attributes can be the occurrence rate of an event, the transition frequency, or the previously defined cluster of the event. In Figure 4, the clusters are the actual displays where the events are presented. In Figure 5, the clusters are defined by the built-in clustering algorithm of the used process mining python package (pm4py), on the basis of the similarity of activity resources [29]. The number of clusters dropped to 3 from 22, and the calculated community coefficient (Equation (6)) was 127 compared to 133 (which is not a significant difference, but should be evaluated considering the change in the number of clusters), meaning that three workflows were dispersed among 22 displays. The results indicate that the actual display layouts need to be reconsidered. Based on the process model and the existing available HMI displays, a new synoptic overview display layout (Figure 6) was proposed.
Obviously, the results and the proposed new layout have to be evaluated together with the plant operators, as their knowledge and experience cannot be ignored in this kind of development task. They can identify irrelevant signals or the need for additional elements on the new displays. Every deviation from “real life” indicates problems with the process model gained. There may be various reasons for this; for example, the structure and data labelling of the log file is not appropriate, or the alarm management system is not adjusted appropriately. However, these deviations can also originate from poor operator practices, and the method also supports the analysis of process control effectiveness. A usability test has to be performed as well. Usability inspection methods were discussed in [30]. Formal usability inspections and pluralistic walkthroughs are especially recommended.

3.3. Discussion

The study has shown that the method is useful in alarm management and in the optimisation of industrial control systems. Its applicability can be broadened, but some limitations must be considered.
One potential issue can arise if one event is allocated to more displays. In this case, a decision has to be made regarding whether the display cluster will be a union of the touched displays, or the event is paired with only one display. Theoretically, an analysis could be performed to determine the display in which the interactions are made with the event the most frequently. In practise, the log file barely indicates this information. One solution is to create “union” displays, which is not an ideal solution; this “error” must be considered during the evaluation of the results. The chosen approach depends on the number of multi-display events. If this number is high, the sequence of events forms a multidimensional network, where the definition of multidimensional edges enables clustering of events [31]. If their number is relatively low, the issue can be handled with experience and knowledge of the actual system.
Visualisation is also a key part of the method. If the number of nodes and edges is high, the readability of the network can quickly worsen. Using open source Python (the used version in the study was 3.9) solutions, this issue can be solved, for example, by changing the layout algorithm to find the most transparent view of the network.
The number of new displays depends on the attributes of the network gained. In the case study, there were three workflows, but only one new display was recommended because the number of nodes was relatively low. If the number of nodes (events) exceeds a recommended threshold with regard to the human cognitive limits, e.g., the maximal information put on a display, the workflow has to be split. The number of splits (displays) has to be optimised considering the dynamics of the system that can be visualised on the network graph, for example, with node sizes and edge thickness. The proposed method allows many information visualisation options, which support a quick understanding of the system mechanism.
The main function of the proposed method, the process-related grouping of HMI elements, allows the development of dynamic HP-HMI screens. As the number of monitors in the control room is limited, it is recommended to display as much situation-aware information as possible. Figure 7 demonstrates a possible working principle of a fictive plant with six monitors in the control room. Again, the aim of the figure is to suggest the content of the screens. The actual displays should be enriched, for example, with trend charts, the visualisation and design should follow the suggestions of the ISA101 standard.

4. Conclusions

In this work, a machine learning-supported HMI designing method was proposed. The method aims to support the application of the Navigation and Layout principle of the ISA101 standard, namely the grouping related elements together aspect. Alarm signals, operator actions, and display actions from a hydrofluoric acid alkylation plant were analysed. The log file was partitioned based on frequent sequential patterns of the stored events. Process control models were explored with process mining tools. A network-like visualisation of a typical process enabled a comparison of the number of workflows and the number of displays in which the workflows are represented. A new, higher-level display was recommended on the basis of the models gained and the existing structure of the HMI displays. Even without deep knowledge of the system, the presented method proved effective. However, manual work is needed to evaluate the displays, which results in subjective decisions. The method can be upgraded to define objective KPIs that support solving the minimisation problem.
In addition to data-driven HMI optimisation, there are other potential benefits to using the extracted knowledge. By comparing the actual online process data with formerly defined event scenarios, a semi- or fully automated online HAZOP analysis tool can be built. The gained process patterns can be compared to a reference model that allows the evaluation of the work quality of the operators and supports the development of the Operator Training System (OTS).
Another potential future research direction is the implementation of machine learning in SCADA systems, which is an actual topic in the industry, as more and more solutions will be assisted by artificial intelligence. The proposed method is capable of processing acquired data and finding patterns among the event chains that lead to failures and the response actions of the operators. Using ML solutions enables the continuous dynamic and adaptive development of industrial process control systems.
The topic of trend charts can also be an interesting area. With the help of ML-supported solutions, process-variable dependencies can be gained from historical data, adding a predictive function to the system. For example, if the operator calls a trend chart of a specific process variable, an intelligent system can offer other trend charts, which may be useful in the actual control activity.
It is important to emphasise that ML-supported process control solutions do not aim to replace the human workforce. Using these methods and techniques shall result in safer and more efficient process operations by supporting decision-making with more process-aware human–machine interfaces.

Author Contributions

Conceptualization, J.A. and L.B.; methodology, L.B.; writing—original draft preparation, L.B.; writing—review and editing, J.A.; supervision, J.A. All authors have read and agreed to the published version of the manuscript.

Funding

This work has been implemented by the OTKA 143482 (Monitoring Complex Systems by goal-oriented clustering algorithms) and the TKP2021-NVA-10 projects with the support provided by the Ministry of Culture and Innovation of Hungary from the National Research, Development and Innovation Fund, financed under the 2021 Thematic Excellence Programme funding scheme.

Institutional Review Board Statement

Not applicable.

Informed Consent Statement

Not applicable.

Data Availability Statement

Restrictions apply to the availability of these data. Data were obtained from MOL Nyrt. and are available in an anonymised form from the authors with the permission of MOL Nyrt.

Conflicts of Interest

The authors declare that they have no known competing financial interests or personal relationships that could have appeared to influence the work reported in this paper.

Abbreviations

The following abbreviations are used in this manuscript:
HMIHuman–Machine Interface.
HP-HMIHigh-Performance Human–Machine Interface.
MLMachine Learning.
UXUser experience.
UIUser interface.
PLCProgrammable Logic Controller.
P&IDPiping and Instrumentation Diagram.
DCSDistributed Control System.
SCADASupervisory Control and Data Acquisition.
HAZOPHazard and Operability.
OTSOperator Training System.

References

  1. Kamizi, S.A. UI/UX of Human-Machine Interface for Industrial Application: Review and Preleminary Design. In Proceedings of the FCSIT UNIMAS FYP Symposium, Kota Samarahan, Malaysia, 28–30 January 2021; pp. 28–30. [Google Scholar]
  2. Kang, Z.; Catal, C.; Tekinerdogan, B. Machine learning applications in production lines: A systematic literature review. Comput. Ind. Eng. 2020, 149, 106773. [Google Scholar] [CrossRef]
  3. Kistan, T.; Gardi, A.; Sabatini, R. Machine learning and cognitive ergonomics in air traffic management: Recent developments and considerations for certification. Aerospace 2018, 5, 103. [Google Scholar] [CrossRef]
  4. Pérez-Reynoso, F.; Farrera-Vazquez, N.; Capetillo, C.; Méndez-Lozano, N.; González-Gutiérrez, C.; López-Neri, E. Pattern Recognition of EMG Signals by Machine Learning for the Control of a Manipulator Robot. Sensors 2022, 22, 3424. [Google Scholar] [CrossRef]
  5. Rashad, O.; Attallah, O.; Morsi, I. A smart PLC-SCADA framework for monitoring petroleum products terminals in industry 4.0 via machine learning. Meas. Control 2022, 55, 830–848. [Google Scholar] [CrossRef]
  6. Valette, E.; Bril El-Haouzi, H.; Demesure, G. Industry 5.0 and its technologies: A systematic literature review upon the human place into IoT- and CPS-based industrial systems. Comput. Ind. Eng. 2023, 184, 109426. [Google Scholar] [CrossRef]
  7. Mourtzis, D.; Angelopoulos, J.; Panopoulos, N. The Future of the Human-Machine Interface (HMI) in Society 5.0. Future Internet 2023, 15, 162. [Google Scholar] [CrossRef]
  8. Hollifield, B. A High Performance HMI: Better Graphics for Operations Effectiveness. In Proceedings of the 2012 Water/Wastewater and Automation Controls Symposium, Orlando, FL, USA, 7–9 August 2012. [Google Scholar]
  9. Reguera-Bakhache, D.; Garitano, I.; Uribeetxeberria, R.; Cernuda, C.; Zurutuza, U. Data-driven industrial human-machine interface temporal adaptation for process optimization. In Proceedings of the 2020 25th IEEE International Conference on Emerging Technologies and Factory Automation (ETFA), Vienna, Austria, 8–11 September 2020; IEEE: Piscataway, NJ, USA, 2020; Volume 1, pp. 518–525. [Google Scholar]
  10. Fortoul-Diaz, J.A.; Carrillo-Martinez, L.A.; Centeno-Tellez, A.; Cortes-Santacruz, F.; Olmos-Pineda, I.; Flores-Quintero, R.R. A Smart Factory Architecture Based on Industry 4.0 Technologies: Open-Source Software Implementation. IEEE Access 2023, 11, 101727–101749. [Google Scholar] [CrossRef]
  11. Sun, G.; Xu, P.; Guo, M.; Sun, H.; Du, Z.; Li, Y.; Zhou, B. OL-JCMSR: A Joint Coding Monitoring Strategy Recommendation Model Based on Operation Log. Mathematics 2022, 10, 2292. [Google Scholar] [CrossRef]
  12. Lin, C.H.; Wang, K.J.; Tadesse, A.A.; Woldegiorgis, B.H. Human-robot collaboration empowered by hidden semi-Markov model for operator behaviour prediction in a smart assembly system. J. Manuf. Syst. 2022, 62, 317–333. [Google Scholar] [CrossRef]
  13. Urbas, L.; Obst, M.; Stöss, M. Formal models for high performance HMI engineering. IFAC Proc. Vol. 2012, 45, 854–859. [Google Scholar] [CrossRef]
  14. Hägle, R.; Schlögel, S.; Klöpfer, K.; Bauernhansl, T. A Methodology for the Systematic Selection of Human-Machine Interface Device Types in Production Machinery Development. Procedia CIRP 2023, 119, 975–980. [Google Scholar] [CrossRef]
  15. Tran, T.A.; Ruppert, T.; Eigner, G.; Abonyi, J. Retrofitting-Based Development of Brownfield Industry 4.0 and Industry 5.0 Solutions. IEEE Access 2022, 10, 64348–64374. [Google Scholar] [CrossRef]
  16. Folgado, F.J.; González, I.; Calderón, A.J. Data acquisition and monitoring system framed in Industrial Internet of Things for PEM hydrogen generators. Internet Things 2023, 22, 100795. [Google Scholar] [CrossRef]
  17. ANSI-ISA-101.01-2015; Human Machine Interfaces for Process Automation Systems. American National Standards Institute: Washington, DC, USA, 2015.
  18. Bántay, L.; Abonyi, J. Frequent pattern mining-based log file partition for process mining. Eng. Appl. Artif. Intell. 2023, 123, 106221. [Google Scholar] [CrossRef]
  19. Fullen, M.; Schüller, P.; Niggemann, O. Semi-supervised Case-based Reasoning Approach to Alarm Flood Analysis. In Machine Learning for Cyber Physical Systems; Beyerer, J., Maier, A., Niggemann, O., Eds.; Springer: Berlin/Heidelberg, Germany, 2020; pp. 53–61. [Google Scholar]
  20. Partovian, S.; Bucaioni, A.; Flammini, F.; Thornadtsson, J. Analysis of log files to enable smart-troubleshooting in Industry 4.0: A systematic mapping study. IEEE Access 2023. [Google Scholar] [CrossRef]
  21. van der Aalst, W. Data Science in Action. In Process Mining: Data Science in Action; Springer: Berlin/Heidelberg, Germany, 2016; pp. 3–23. [Google Scholar]
  22. Bántay, L.; Sas, N.; Dörgő, G.; Abonyi, J. Sequence Compression and Alignment-Based Process Alarm Prediction. Ind. Eng. Chem. Res. 2023, 62, 10577–10586. [Google Scholar] [CrossRef]
  23. Villani, V.; Sabattini, L.; Loch, F.; Vogel-Heuser, B.; Fantuzzi, C. A general methodology for adapting industrial HMIs to human operators. IEEE Trans. Autom. Sci. Eng. 2019, 18, 164–175. [Google Scholar] [CrossRef]
  24. Barabási, A.L. Network science. Philos. Trans. R. Soc. A Math. Phys. Eng. Sci. 2013, 371, 20120375. [Google Scholar] [CrossRef] [PubMed]
  25. Shchur, O.; Günnemann, S. Overlapping community detection with graph neural networks. arXiv 2019, arXiv:1909.12201. [Google Scholar]
  26. Teng, X.; Liu, J.; Li, M. Overlapping Community Detection in Directed and Undirected Attributed Networks Using a Multiobjective Evolutionary Algorithm. IEEE Trans. Cybern. 2021, 51, 138–150. [Google Scholar] [CrossRef]
  27. Fournier-Viger, P.; Lin, C.; Gomariz, A.; Gueniche, T.; Soltani, A.; Deng, Z.; Lam, H.T. The SPMF Open-Source Data Mining Library Version 2. In Machine Learning and Knowledge Discovery in Databases, Proceedings of the 19th European Conference on Principles of Data Mining and Knowledge Discovery (PKDD 2016), Riva del Garda, Italy, 19–23 September 2016; Springer: Cham, Switzerland, 2016; pp. 36–40. [Google Scholar]
  28. Fournier-Viger, P.; Gomariz, A.; Campos, M.; Thomas, R. Fast vertical mining of sequential patterns using co-occurrence information. In Advances in Knowledge Discovery and Data Mining, Proceedings of the 18th Pacific-Asia Conference, PAKDD 2014, Tainan, Taiwan, 13–16 May 2014; Springer: Cham, Switzerland, 2014; pp. 40–52. [Google Scholar]
  29. Van Der Aalst, W.M.; Reijers, H.A.; Song, M. Discovering social networks from event logs. Comput. Support. Coop. Work. (CSCW) 2005, 14, 549–593. [Google Scholar] [CrossRef]
  30. Nielsen, J. Usability inspection methods. In Proceedings of the Conference Companion on Human Factors in Computing Systems, Boston, MA, USA, 24–28 April 1994; pp. 413–414. [Google Scholar]
  31. Gadár, L.; Abonyi, J. Frequent pattern mining in multidimensional organizational networks. Sci. Rep. 2019, 9, 3322. [Google Scholar] [CrossRef]
Figure 1. The proposed ML-supported HMI optimization method with alarm management-related interpretation.
Applsci 14 01564 g001
Figure 2. An optimised example community of events (E), displays (D) and workflows ( W F ). Solid boxes represent the displays, dashed boxes represent the workflows.
Applsci 14 01564 g002
Figure 3. The schematic drawing of the plant.
Applsci 14 01564 g003
Figure 4. A specific process model of the plant. Colours mark the display where the event is represented. The size of the nodes refers to the cardinality of the event. The structure of the node names is XX_YY, where XX denotes the ID of the event and YY is the type of event (in the case of an alarm signal, no type can be seen).
Applsci 14 01564 g004
Figure 5. A specific process model of the plant. The colours represent the workflow clusters provided by the built in clustering algorithm of pm4py. The structure of the node names is XX_YY, where XX denotes the the ID of the event and YY is the type of event (in the case of an alarm signal, no type can be seen).
Applsci 14 01564 g005
Figure 6. The proposed synoptic HMI display. Blue dashed-line boxes represent the actual displays, black lines represent the product flow, red/bourdon lines represent auxiliary flows, arrows indicate the direction of the flow. Elements put between two displays are located on both. The figure is not an exact display; it only represents the proposed content.
Applsci 14 01564 g006
Figure 7. The fictive plant has five sections containing 14 pieces of equipment. The displayed content of the sections is defined by using the proposed method. The suggested alarm handling screen is created based on processed historical data.
Applsci 14 01564 g007
Table 1. Performance results of sequential pattern mining. The performance factor is the quotient of the number of found patterns and the elapsed time.
Minimum SupportFound Sequential PatternsElapsed Time [ms]Performance Factor
0.26,777,245312,27121.7
0.365,601427815.3
0.430583229.5
0.54051014.0
0.699721.4
Table 2. Performance results of sequential pattern mining for a fixed minimum support value of 0.6, changing the number of processed traces.
Number of TracesNumber of EventsFound Sequential PatternsElapsed Time [ms]Performance Factor
49521,27799721.4
98250,87031830.4
147462,49627880.4
197070,404261130.2
246484,824251120.2
Disclaimer/Publisher’s Note: The statements, opinions and data contained in all publications are solely those of the individual author(s) and contributor(s) and not of MDPI and/or the editor(s). MDPI and/or the editor(s) disclaim responsibility for any injury to people or property resulting from any ideas, methods, instructions or products referred to in the content.

