Abstract
Cardiovascular diseases (CVDs) are chronic diseases associated with a high risk of mortality and morbidity. Early detection of CVD is crucial to initiating timely interventions, such as appropriate counseling and medication, which can effectively manage the condition and improve patient outcomes. This study introduces an innovative ontology-based model for the diagnosis of CVD, aimed at improving decision support systems in healthcare. We developed a database model inspired by ontology principles, tailored for the efficient processing and analysis of CVD-related data. Our model’s effectiveness is demonstrated through its integration into a web application, showcasing significant improvements in diagnostic accuracy and utility in resource-limited settings. Our findings indicate a promising direction for the application of artificial intelligence (AI) in early CVD detection and management, offering a scalable solution to healthcare challenges in diverse environments.
1. Introduction
Cardiovascular diseases (CVDs) remain the leading cause of death worldwide [1,2]. Approximately 17.9 million people lost their lives due to cardiovascular disease in 2019, representing 32% of the total death. Among these deaths, 85% were attributed to heart attacks and strokes. Most deaths resulting from cardiovascular diseases, more than 75%, occur in low- and middle-income countries [3]. Of the 17 million premature deaths (accidentally occurring before 70 years of age) caused by non-communicable diseases (NCD) in 2019, 38% were due to cardiovascular disease.
Prevention of cardiovascular disease involves addressing modifiable risk factors, including smoking, unhealthy diet, obesity, sedentary lifestyle, and excessive alcohol consumption. The incidence of cardiovascular diseases can be significantly reduced by mitigating the aforementioned behavioral factors. Early detection of cardiovascular disease is essential for effective interventions, including timely implementation of appropriate advice and medications, which can effectively manage the condition and improve patient outcomes.
Prevention should be implemented at the general public level, promoting a healthy lifestyle [4] and at the individual level, that is, in people with moderate to high CVD risk or patients already diagnosed with CVD by addressing an unhealthy lifestyle (e.g., poor quality diet, lack of exercise, smoking tobacco) and optimizing risk factors. Prevention is effective—eliminating risk-related activities for health would prevent from CVD cases and even 40% from cancer cases [5,6].
A personalized early diagnosis system based on artificial intelligence (AI), ontology, and other medical information processing systems may be a great prevention measure. Ontologies and ontology database models have been applied to the diagnosis of CVD [7,8] and other diseases such as pneumonia [9]. Ontologies are formal representations of knowledge that can be used to define the structure and content of a database, allowing the representation of complex and hierarchical relationships between different concepts [10,11].
The ontology-database model combines ontology principles with those of database management systems, allowing for the integration of large and complex data sets within a structured and well-defined framework [12,13]. This type of model has been applied in a variety of fields, including biology, medicine, and healthcare, to facilitate the management and analysis of large and diverse data sets that exemplified the use of ontologies in the diagnosis of CVD using the Human Phenotype Ontology (HPO) to classify and classify phenotypes, including CVD-related phenotypes. HPO is a standardized vocabulary of phenotypic abnormalities that can be used to describe the clinical features of diseases, such as focus diseases. CVDs, which allows for a systematic and comprehensive description of patient phenotypes [14]. This can facilitate the identification of patients with similar clinical characteristics and help in the diagnosis of CVD. The advantages of ontology-based approaches compared to other methods include high performance in combination with machine and human interpretability, reflecting the hierarchical nature of the description of symptoms and the corresponding health conditions [8,15,16,17,18].
Ontologies allow for encapsulating domain-specific knowledge in human-interpretable and machine-interpretable formats. These formats could conform to the diagnostic guidelines established by healthcare professionals, using a natural language that describes the symptoms of diseases [7,8,9,15,18]. A recently popular alternative is large language models, which are trained on large sets of textual data and generate human-like texts, including diagnostic recommendations; however, they do not demonstrate accurate medical understanding and can introduce the risk of spreading misinformation [19,20].
This work evaluates the accuracy of the diagnosis of cardiovascular diseases based on the ontologies of symptoms and guidelines that are implemented in a web application.
2. Related Work
In this section, we present selected applications of ontologies for effective knowledge modeling and information retrieval in diagnosing diseases. In [21], the authors proposed a method to convert an ontology into a database using predefined transformation rules. We discuss the application of ontologies for representing knowledge within relational databases, as well as its potential for use in web application development.
In addition to known computational algorithms, there is also an alternative approach to predict CVD risk, which involves the use of risk prediction models. The World Health Organization/International Society of Hypertension (WHO/ISH) risk score charts are widely used models to predict CVD risk [22]. These graphs are accompanied by practice notes that provide guidance on interpreting and adjusting scores, as well as on managing risk factors that are not included in the risk score calculations.
A recent study by [23] evaluated the use of WHO/ISH risk prediction charts to assess cardiovascular risk in three low- and middle-income countries in Asia. The study found that these graphs have certain advantages. One limitation is that they may underestimate the risk of CVD if individuals already on treatment are not taken into account. The degree of underestimation varies depending on the extent of coverage and the effectiveness of drug treatment.
The Framingham Risk Score (FRS) is another widely used model to calculate CVD risk. A study by [24] investigated the performance of this model by conducting a validation study on 959 randomly selected individuals aged 30–74 years. The results of the experiment showed that the model tended to overestimate the risk in older women and middle-aged men. On the basis of these findings, the researchers suggest that the model should be reclassified to account for these slight errors.
The systematic coronary risk evaluation (SCORE) model, which is used to predict the risk of the first fatal atherosclerotic cardiovascular event in 10 years, takes into account factors such as age, gender, smoking, total cholesterol, and systolic blood pressure (SBP). In [25], Conroy et al. examined the effectiveness of this model in different regions of Europe with varying levels of CVD risk. The study proposed improvements to the model, but it should be noted that the results may not fully reflect an individual’s typical risk due to the nature of the study being conducted in a single instance.
Selvarajah et al. [26] conducted an evaluation of the FRS, SCORE, and WHO/International Society of Hypertension (WHO/ISH) models. The results showed that the WHO/ISH model was inadequate for the stratification of cardiovascular risk.
However, the Framingham and SCORE models successfully identified the risk levels of Asian men and women. In particular, the SCORE high model accurately predicted the risk for men, but not for women. On the other hand, the Framingham model improved the detection of women’s risk compared with the SCORE model. In general, it was found that the Framingham and SCORE models were more effective at identifying cardiovascular risk in Asian men and women than the WHO/ISH labels [27,28,29].
In [8], El Massari et al. compared the performance of random Forest, logistic regression, decision tree, Naïve Bayes, k-Nearest Neighbors, artificial neural network, and support vector machine with ontology. The results show that ontology model achieved a higher accuracy (0.755) than the other examined models (0.731 for decision tree, 0.721 for logistic regression, 0.715 for random forest, 0.648 for support vector machines, 0.645 for artificial neural networks, 0.59 for Naïve Bayes, and 0.571 for k-nearest neighbors).
3. Materials and Methods
In the development of a diagnostic tool for diseases, several considerations were taken into account. One of the main decisions was the choice between using quantitative or qualitative data. Quantitative data for CVD diagnosis are generally collected through objective measurements, such as electrocardiographic (ECG) signals, and are often used in machine learning algorithms [30,31,32,33,34,35]. However, raw sensor data are not readily available to patients and can only be accessed by medical personnel with specialized software provided by the medical device manufacturer. Therefore, we decided to use patient symptoms as the main source of information for the diagnostic tool.
3.1. Dataset Preparation
To integrate this information into an existing behavioral risk factor calculator, a non-machine-learning-based diagnostic method was sought to address the problem with access to raw sensor data and ease of use for patients. After evaluating different options, it was determined that a knowledge base structured following an ontology-inspired approach would be the most suitable. This involved creating a knowledge base/ontology database model by extracting pertinent data from various disease research studies presented in Table 1 and organizing them into tables in the database schema (see Table 1).

Table 1.
Research items that mention the use of ontology-based approach for major diseases.
Each disease was assigned its own table, which includes details on symptoms, duration of symptoms, and the disease itself. Subsequent investigations have revealed instances of misdiagnosis in which certain diseases resemble cardiovascular disease, as well as associations between specific diseases, such as the correlation between coronary heart disease and panic attacks [51].
3.2. Software
C# and Microsoft SQL-based applications consist of three main components: the database, the application server, and the client user interface. The database is created using Microsoft SQL Server 2022 and is designed to ensure data integrity and efficient data retrieval. The application server processes client requests and handles business logic and data processing. The client user interface communicates with the application server and provides a user-friendly way to interact with the application.
4. System Architecture
4.1. Database Architecture
The CVD database is a collection of structured data that are designed to support the management and analysis of CVD-related information. This database consists of two main types of tables: fixed tables and updatable tables.
Fixed tables, also known as the knowledge base, are a set of predetermined tables within the database that contain structured data that should not be modified by users. Instead, these tables serve as a reference source of information for the database or system, providing a reliable and consistent source of information on CVD-related topics. Examples of data that can be stored in fixed tables include information on different types of CVD, risk factors for CVD, and CVD treatments.
Updatable tables, on the other hand, are the tables within the database that can be modified by users. These tables may contain data entered by users, such as personal data, symptoms, or diagnosis generated by the system per session. The data in these tables can be updated, inserted, or deleted by users as needed, allowing flexibility in the management and analysis of CVD-related information. In the database, tables contain key fields by which we can update the most crucial information regarding symptoms of the disease, disease entities, and patient identification data.
4.2. Applying Inner Join Principle in Diagnosis
Figure 1 shows the use of an inner join in a database to find a match between two tables. The first table, Table A (which also represents all disease tables in the database), contains a list of symptoms for each disease that was collected to create a knowledge base, as illustrated in Figure 2.
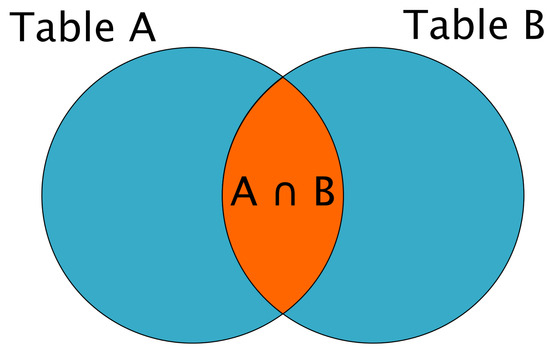
Figure 1.
Diagram of Inner Join. A INNER JOIN B = ∈ and = .
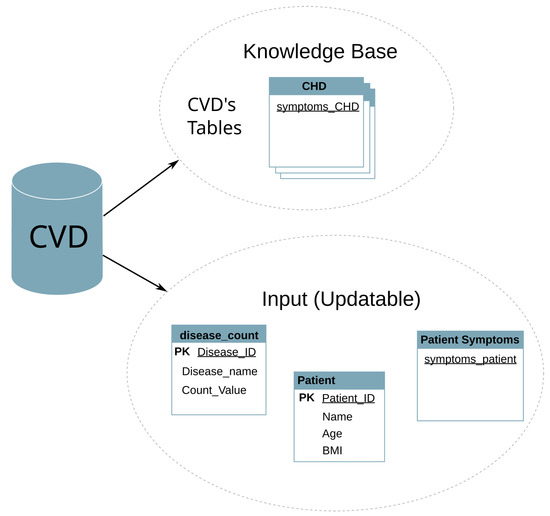
Figure 2.
CVD database architecture. Underlined text depicts the source of keywords.
The second table, Table B, contains the symptoms of a patient, which were input by the user and stored in the database. This database is dynamic and allows the use of SQL commands such as UPDATE and DELETE, meaning that it can change with each user and is reset when the application is closed.
However, during the diagnosis process, Table B is assumed to be static and cannot be changed. This is to ensure that the diagnosis remains accurate and consistent. To find a match between the two tables, the current user’s symptoms in Table B are compared with the symptoms in the disease table (Table A) using an inner join. The inner join function returns only the rows that match the two tables.
To further analyze the match between the two tables, the “count” function is used to count the number of symptoms that match. These values are stored in a table of “disease_count” using the UPDATE command. There is one query for each major CVD and to handle the counting process for each disease (see Figure 3).
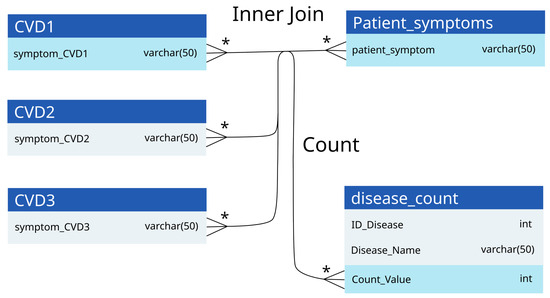
Figure 3.
Inner join principle and count of our proposed approach. An asterisk (*) depicts the foreign key.
Utilizing the database of CVD symptoms, we align corresponding symptom descriptions from patient data. The maximum correlation identifies the most likely disease entity. To ascertain the most probable disease, the ’max’ function is employed to identify the highest count value among all diseases. This maximum value corresponds to the disease with the highest number of matching symptoms and is therefore the most likely diagnosis for the patient. This process of inner joining, counting, and finding the maximum value allows an accurate prediction of a disease based on the symptoms of the patient, as shown in Figure 4.
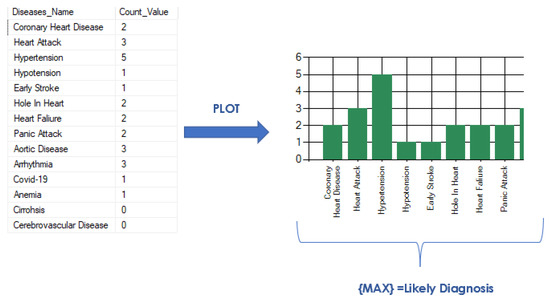
Figure 4.
Max plot for diagnosing cardiovascular disease with ontologies.
5. Results
In order to evaluate the performance of the application, various scenarios were employed.
5.1. Application Test with Real Subjects as Diagnosed by a Doctor
The first evaluation method involved seeking feedback from patients who currently have a CVD. These patients were asked to document the symptoms they had experienced before receiving a diagnosis, and a physician was also consulted to obtain information on symptoms reported by patients diagnosed with CVDs. Using this approach, three subjects were studied and the results are summarized in Table 2.
Table 2.
Comparison of diagnosis of CVDs conducted by physicians and an app.
5.2. Prototype Application vs. Existing Application
The second evaluation method involved comparing the performance of the prototype application with that of an existing application, specifically an AI-based Android application named “Symptom Checker”. Seven combinations of random symptoms were entered into both applications and the results were compared (see Table 3).
Table 3.
Comparison of diagnoses suggested by the prototype application and an existing application.
- Symptom combination 1: chest pain, shortness of breath, back pain, nausea, feeling faint, cough, nose bleed.
- Symptom combination 2: chest pain, nausea, dizziness, cough, fever.
- Symptom combination 3: shortness of breath, body pain, nausea, fatigue, cough, fever, headache.
- Symptom combination 4: dizziness, disorientation, blurred vision, headache.
- Symptom combination 5: chest pain, pain (jaw/neck/back), disorientation, jaundice, lack of appetite.
- Symptom combination 6: shortness of breath, body pain, lack of appetite, dry mouth, bleeding gums.
- Symptom combination 7: chest pain, shortness of breath, weakness, headache, loose bladder.
5.3. Measuring Diagnostic Accuracy
Measuring the diagnostic accuracy of a new diagnostic application involves comparing its performance with established reference points provided by other applications. By evaluating the diagnostic results produced by the new application and comparing them to the results obtained from established apps, it is possible to assess the application’s ability to correctly identify and classify medical conditions. Key metrics such as sensitivity, specificity, positive predictive value, and negative predictive value can be calculated to quantitatively evaluate the performance of the new application [52].
According to [52], these parameters are ideally used to calculate the accuracy of diagnosis and to elucidate their respective meanings.
- True positive (TP): This refers to the number of individuals correctly identified as positive by the test. In medical terms, it represents the number of people with the condition being tested who were correctly identified as having the condition.
- True negative (TN): This represents the number of individuals correctly identified as negative by the test. It refers to individuals without the condition who were correctly identified as not having the condition.
- False positive (FP): These are the individuals who were incorrectly classified as positive by the test but do not have the condition. In medical terms, it represents the number of people who were mistakenly identified as having the condition when they were actually healthy.
- False negative (FN): These are the individuals who were incorrectly classified as negative by the test, but actually have the condition. It represents the number of individuals who were mistakenly identified as not having the condition when they actually did.
However, the representation is modified for each test to compare the diagnosis of the app with already proven or existing parameters. Test 1 is a comparison of the diagnosis provided by the designed app and a doctor and Test 2 is a comparison of the diagnosis provided by the designed application and an existing AI-based diagnostic Android application (see the confusion matrices in Table 4 and Table 5 respectively). The performance metrics for both tests are provided in Table 6.
Table 4.
Confusion matrix of Test 1 (comparison of the suggested diagnosis by an app with the diagnosis conducted by a medical doctor.)
Table 5.
Confusion matrix of Test 2 (comparison of the suggested diagnosis by an app with the diagnosis suggested by an existing AI-based diagnosis Android app.)
Table 6.
Performance indicators of the diagnosis made by the prototype application (App), medical doctor, and an existing application.
- True positive (TP): Number of CVD cases correctly identified by the app and that matches the preexisting diagnosis of the doctor (test 1)/AI-diagnosis android app (test 2).
- True negative (TN): Number of CVD cases identified as negative (that is, not identified as CVD) by the app and by the doctor (Test 1)/AI-diagnosis Android app (Test 2).
- False positive (FP): Number of cases of CVD that were inaccurately identified by the app, despite the absence of the actual condition, as proven by a doctor or AI-based diagnosis Android app.
- False negative (FN): Number of cases of CVD that went undetected by the app, but were actually identified and diagnosed by a doctor or an AI-based diagnosis Android app.
- Actual positive: Possible CVD diagnosis that was evaluated by a doctor or an existing application, with supporting evidence or validation.
- Actual negative: Possible diagnosis that was not identified as cardiovascular disease by a doctor or an existing application.
- Predicted positive: Possible CVD diagnosis made by the app, based on its analysis and algorithm.
- Predicted negative: This denotes other diagnoses that were not detected or identified as cardiovascular diseases by the app. These diagnoses may include conditions or diseases not related to CVD.
Parameters for Calculating Accuracy
- Positive predictive value (PPV), also known as precision, tells the proportion of correctly predicted positive instances out of all instances predicted as positive by the application. A higher PPV indicates that the application is more reliable for correctly identifying positive instances. It suggests that when the application predicts a positive result, there is a relatively higher chance that it is accurate.
- The negative predictive value (NPV) tells us the proportion of correctly predicted negative instances out of all instances predicted as negative by the application.
- Sensitivity, also known as the recall or true positive rate, indicates the proportion of correctly predicted positive instances out of all of the actual positive instances.
- Specificity tells us the proportion of correctly predicted negative instances out of all actual negative instances.
- Accuracy is a performance metric that tells us the overall correctness of the predictions made by the application or system being evaluated.
We observed that the accuracy of the application was 1.0 or 100%. This high accuracy was achieved because the three cases were accurately diagnosed with cardiovascular disease, matching the predictions made by the application. Furthermore, the positive predictive value was 100%, indicating that all positive diagnoses made by the application were true positives. However, the negative predictive value was undefined because there were no negative diagnoses; all cases were positively diagnosed as cardiovascular disease, according to the evaluations of medical doctors.
5.4. GUI
Figure 5, Figure 6 and Figure 7 show screenshots of the graphical user interface (GUI) of the designed application. Figure 5 presents the selection of symptoms and Figure 6 presents an example of the diagnosis results. An example of the report is shown in Figure 7 in the application and in the form of a PDF file, respectively.
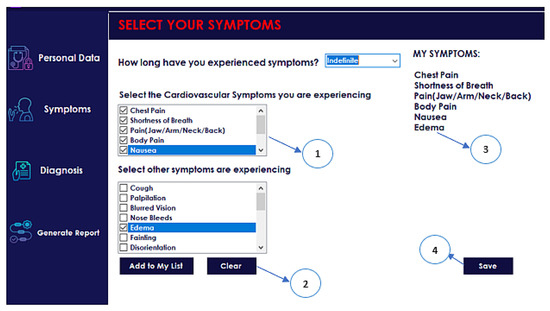
Figure 5.
Symptom-select Panel. (1) Choice of symptoms related to CVDs; (2) Choice of other symptoms; (3) List of chosen symptoms, (4) “Save” button.
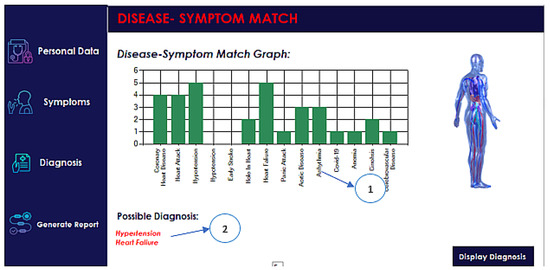
Figure 6.
Diagnosis result panel. (1) Bar graph of disease-symptom matches; (2) The most probable diagnosis according to the app.
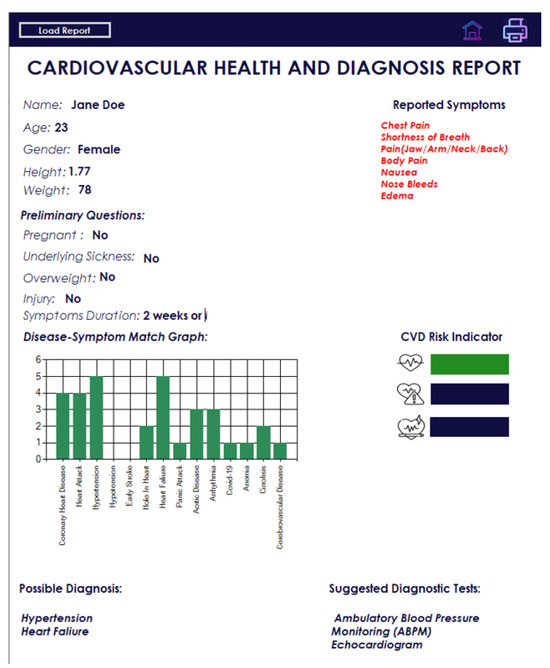
Figure 7.
Auto-generated report.
6. Discussion
The use of an ontology-inspired database model and inner join or diagnosis demonstrates a reasonably good level of accuracy. Test 1 achieved a perfect accuracy rate of 100%, while Test 2 yielded an accuracy of 75%. Taking the average of these two tests, we can conclude that the overall accuracy of the diagnosis process is 85%, without considering any bias.
Other studies on the diagnosis of cardiovascular diseases based on ontologies reported an accuracy of 75.5% (10-fold cross-validation) in [8], sensitivity of 0.83 and precision of 0.87 in [7], and accuracy of more than 90% in [53].
The accuracy of the decision trees, SVM, or ANN models proposed in [54] was 89.6%, 92.1%, and 91.0%, respectively. In our study, we achieved a sensitivity of 1.0 (100%), indicating that it performed excellently in detecting positive cases of cardiovascular disease. Furthermore, the combinations of diseases used to test both evaluated and existing applications were similar to those associated with cardiovascular disease.
The reason for testing the application with real subjects diagnosed by physicians was to determine whether the application designed for the diagnosis of CVD can provide accurate diagnoses similar to those of physicians. However, only three patients with preexisting cardiovascular disease were tested, resulting in a small sample size that could introduce bias when evaluating the accuracy of the application.
Furthermore, when diagnosing cardiovascular disease, doctors can also consider other coexisting conditions, as demonstrated in the first subject where the doctor’s diagnosis included hypertension and diabetes mellitus. This highlights the complexity of the diagnosis of cardiovascular disease and the need to consider potential comorbidities.
The second test aimed to compare the diagnosis provided by the application under evaluation with that of an established and proven application. On the basis of the results of the second test, several observations can be made. In general, when testing the application against the existing one, it exhibited an accuracy rate of 0.75 (75%) and a positive predictive value (PPV) of 0.714 (71.4%). This indicates that the application was 75% accurate in its diagnoses. This result was lower than reported in [7,8,53] and suggests the need for improvement by changing the sources and design of the ontology.
However, the designed application has some limitations. First, the application was tested against the existing application only seven times. This limited sample size suggests a bias in the experiment and also implies that the accuracy values could be influenced by further testing. Second, only one architecture was considered because of the focus on the accuracy of diagnosis and the simplicity of the schema that implements the proposed ontology.
Second, this application concentrates only on the main cardiovascular diseases and on diseases that closely resemble cardiovascular disease. As a result, we were working with approximately 14 tables using the ontology-based database model. The efficiency of the diagnosis process may vary in terms of speed, but this aspect was not thoroughly explored due to the limited sample size of the diseases under investigation.
7. Conclusions and Future Work
The application has the potential to improve the efficiency and precision of the diagnosis of cardiovascular diseases, particularly in resource-limited settings where access to specialized medical personnel may be limited. By providing users with a tool to identify potential diagnoses and guide further testing, the application can help ensure that patients receive timely and appropriate care. Given that the application is based on novel research, accurate verification is needed.
There are many directions in which this work could be extended in the future:
- One potential avenue for future work is to improve the symptom checker by adding more detailed and specialized questions and a description of the database to create a more comprehensive and accurate diagnostic tool.
- The evaluation of the processing time and its influence on the accuracy.
- Another potential direction is to expand the range of diseases covered by the application. Although the current version focuses on major cardiovascular diseases, there is the potential to add support for other types of disease or health conditions.
- Another area of future work is the integration of the application with electronic medical record systems, allowing for the seamless exchange of data and a more efficient diagnosis and treatment.
- Developing a mobile version of the application that allows users to access it from their smartphones or tablets.
- Adding a feature that allows users to track their symptoms over time could aid in the diagnosis and management of chronic diseases. Integrating the application with wearable devices, such as fitness trackers or smartwatches, allows continuous monitoring of vital signs and other health metrics.
Author Contributions
Conceptualization, R.D., E.O.B. and S.S.; methodology, R.D. and E.O.B.; software, E.O.B. and R.D.; validation, R.D. and E.O.B.; formal analysis, R.D. and E.O.B., investigation, R.D., E.O.B., S.S. and M.T.I.; resources, R.D.; data curation, E.O.B. and R.D.; writing—original draft preparation, R.D., E.O.B., N.P., S.S. and M.T.I.; writing—review and editing, R.D., N.P., S.S., M.T.I. and A.P.; visualization, E.O.B., R.D. and S.S.; supervision, R.D., E.T., M.G. and W.G.; project administration, R.D., E.T., M.G. and W.G.; funding acquisition, R.D., E.T. and M.G. All authors have read and agreed to the published version of the manuscript.
Funding
This research received no external funding and The APC was funded by University of Lübeck.
Institutional Review Board Statement
The study was conducted in accordance with the Declaration of Helsinki, and was approved by the Ethics Committee of Medical University of Silesia (resolution number KNW/0022/KB1/79/18 taken on 16 October 2018).
Informed Consent Statement
Informed consent was obtained from all subjects involved in the study.
Data Availability Statement
The data presented in this study are available upon request from the corresponding author. The data are not publicly available due to privacy.
Acknowledgments
We thank Tomasz Cedro, Abid Ali Fareedi, and Stéphane Gagnon for providing useful insights regarding the design and application of the ontology and for helping revise the manuscript.
Conflicts of Interest
The authors declare no conflicts of interest.
Abbreviations
The following abbreviations are used in this manuscript:
| AI | Artificial Intelligence |
| CHD | Coronary heart disease |
| CHF | Congenital heart failure |
| CVA | Cerebrovascular accident |
| CVD | Cardiovascular disease |
| DM2 | Diabetes mellitus 2 |
| ECG | Electrocardiography, electrocardiogram |
| FP | False positive |
| FN | False negative |
| FRS | Framingham risk score |
| GUI | Graphical user interface |
| HF | Heart failure |
| HPO | Human phenotype ontology |
| HTN | Hypertension |
| ISH | International Society of Hypertension |
| NCD | Noncommunicable disease |
| NPV | Negative predictive value |
| PPV | Positive predictive value |
| SCORE | Systematic coronary risk evaluation |
| SBP | Systolic blood pressure |
| SQL | Structured query language |
| TP | True positive |
| TN | True negative |
| vs. | Versus |
| WHO | World Health Organization |
References
- WHO. Cardiovascular Diseases. 2013. Available online: https://www.who.int/health-topics/cardiovascular-diseases#tab=tab_1 (accessed on 30 January 2024).
- Virani, S.S.; Alonso, A.; Aparicio, H.J.; Benjamin, E.J.; Bittencourt, M.S.; Callaway, C.W.; Carson, A.P.; Chamberlain, A.M.; Cheng, S.; Delling, F.N.; et al. Heart Disease and Stroke Statistics—2021 Update. Circulation 2021, 143, e254–e743. [Google Scholar] [CrossRef]
- Ramesh, S.; Kosalram, K. The burden of non-communicable diseases: A scoping review focus on the context of India. J. Educ. Health Promot. 2023, 12, 41. [Google Scholar]
- Cooney, M.T.; Dudina, A.L.; Graham, I.M. Value and limitations of existing scores for the assessment of cardiovascular risk: A review for clinicians. J. Am. Coll. Cardiol. 2009, 54, 1209–1227. [Google Scholar] [CrossRef] [PubMed]
- Liu, K.; Daviglus, M.L.; Loria, C.M.; Colangelo, L.A.; Spring, B.; Moller, A.C.; Lloyd-Jones, D.M. Healthy lifestyle through young adulthood and the presence of low cardiovascular disease risk profile in middle age: The Coronary Artery Risk Development in (Young) Adults (CARDIA) study. Circulation 2012, 125, 996–1004. [Google Scholar] [CrossRef] [PubMed]
- National Institute for Health and Care Excellence. Cardiovascular Disease Prevention. 2010. Available online: https://www.nice.org.uk/guidance/ph25 (accessed on 30 January 2024).
- Al-Hamadani, B.T.; Alwan, R.F. An ontology-based expert system for general practitioners to diagnose cardiovascular diseases. Adv. Comput. Sci. Technol. 2015, 8, 53–65. [Google Scholar]
- El Massari, H.; Gherabi, N.; Mhammedi, S.; Ghandi, H.; Bahaj, M.; Raza Naqvi, M. The Impact of Ontology on the Prediction of Cardiovascular Disease Compared to Machine Learning Algorithms. Int. J. Online Biomed. Eng. 2022, 18, 143–157. [Google Scholar] [CrossRef]
- Azzi, S.; Michalowski, W.; Iglewski, M. Developing a pneumonia diagnosis ontology from multiple knowledge sources. Health Inform. J. 2022, 28, 14604582221083850. [Google Scholar] [CrossRef] [PubMed]
- Stevens, R.; Rector, A.; Hull, D. What is an ontology? Ontogenesis. 2010. Available online: https://ontogenesis.knowledgeblog.org/66/ (accessed on 30 January 2024).
- Guarino, N.; Oberle, D.; Staab, S. What Is an Ontology? In Handbook on Ontologies; Springer: Berlin/Heidelberg, Germany, 2009; pp. 1–17. [Google Scholar] [CrossRef]
- LePendu, P.; Dou, D.; Frishkoff, G.A.; Rong, J. Ontology database: A new method for semantic modeling and an application to brainwave data. In Proceedings of the International Conference on Scientific and Statistical Database Management, Hong Kong, China, 9–11 July 2008; Springer: Berlin/Heidelberg, Germany, 2008; pp. 313–330. [Google Scholar]
- Fareedi, A.A.; Hassan, S. The semantic alignment of H-FOAF, DOMAIN and DBLP ontologies with link open data for a health social network. In Proceedings of the 2014 14th International Conference on Control, Automation and Systems (ICCAS 2014), Gyeonggi-do, Republic of Korea, 22–25 October 2014; pp. 1508–1513. [Google Scholar] [CrossRef]
- Robinson, P.; Mundlos, S. The Human Phenotype Ontology. Clin. Genet. 2010, 77, 525–534. [Google Scholar] [CrossRef] [PubMed]
- Razzaq, M.A.; Amin, M.B.; Lee, S. An ontology-based hybrid approach for accurate context reasoning. In Proceedings of the 2017 19th Asia-Pacific Network Operations and Management Symposium (APNOMS), Seoul, Republic of Korea, 27–29 September 2017; pp. 403–406. [Google Scholar] [CrossRef]
- Borgwardt, S.; Ceylan, I.I.; Lukasiewicz, T. Ontology-Mediated Query Answering over Log-Linear Probabilistic Data. Proc. Aaai Conf. Artif. Intell. 2019, 33, 2711–2718. [Google Scholar] [CrossRef][Green Version]
- Prabowo, R.; Jackson, M.; Burden, P.; Knoell, H.D. Ontology-based automatic classification for Web pages: Design, implementation and evaluation. In Proceedings of the Third International Conference on Web Information Systems Engineering, 2002—WISE 2002, Singapore, 14 December 2002. [Google Scholar] [CrossRef]
- El Idrissi, B.; Baina, S.; Baina, K. Automatic generation of ontology from data models: A practical evaluation of existing approaches. In Proceedings of the IEEE 7th International Conference on Research Challenges in Information Science (RCIS), Paris, France, 29–31 May 2013. [Google Scholar] [CrossRef]
- Barnard, F.; Sittert, M.V.; Rambhatla, S. Self-Diagnosis and Large Language Models: A New Front for Medical Misinformation. arXiv 2023, arXiv:2307.04910. [Google Scholar]
- De Angelis, L.; Baglivo, F.; Arzilli, G.; Privitera, G.P.; Ferragina, P.; Tozzi, A.E.; Rizzo, C. ChatGPT and the Rise of Large Language Models: The New AI-Driven Infodemic Threat in Public Health. Front. Public Health 2023, 11, 1166120. [Google Scholar] [CrossRef] [PubMed]
- Mahmudi, K.; Liem, M.I.; Akbar, S. Ontology to relational database transformation for web application development and maintenance. J. Phys. Conf. Ser. 2018, 971, 012031. [Google Scholar] [CrossRef]
- Mendis, S.; Lindholm, L.H.; Mancia, G.; Whitworth, J.; Alderman, M.; Lim, S.; Heagerty, T. World Health Organization (WHO) and International Society of Hypertension (ISH)s risk prediction charts: Assessment of cardiovascular risk for prevention and control of cardiovascular disease in low and middle-income countries. J. Hypertens. 2007, 25, 1578–1582. [Google Scholar] [CrossRef]
- Otgontuya, D.; Oum, S.; Buckley, B.S.; Bonita, R. Assessment of total cardiovascular risk using WHO/ISH risk prediction charts in three low and middle income countries in Asia. BMC Public Health 2013, 13, 539. [Google Scholar] [CrossRef]
- Artigao-Rodenas, L.M.; Carbayo-Herencia, J.A.; Divison-Garrote, J.A.; Gil-Guillen, V.F.; Masso-Orozco, J.; Simarro-Rueda, M.; Molina-Escribano, F.; Sanchis, C.; Carrion-Valero, L.; Lopez de Coca, E.; et al. Framingham risk score for prediction of cardiovascular diseases: A population-based study from southern Europe. PLoS ONE 2013, 8, e73529. [Google Scholar] [CrossRef]
- Conroy, R.M.; Pyörälä, K.; Fitzgerald, A.; Sans, S.; Menotti, A.; De Backer, G.; De Bacquer, D.; Ducimetiere, P.; Jousilahti, P.; Keil, U.; et al. Estimation of ten-year risk of fatal cardiovascular disease in Europe: The SCORE project. Eur. Heart J. 2003, 24, 987–1003. [Google Scholar] [CrossRef] [PubMed]
- Selvarajah, S.; Kaur, G.; Haniff, J.; Cheong, K.C.; Hiong, T.G.; van der Graaf, Y.; Bots, M.L. Comparison of the Framingham Risk Score, SCORE and WHO/ISH cardiovascular risk prediction models in an Asian population. Int. J. Cardiol. 2014, 176, 211–218. [Google Scholar] [CrossRef]
- Miller, C.L. A review of symptoms of coronary artery disease in women. J. Adv. Nurs. 2002, 39, 17–23. [Google Scholar] [CrossRef] [PubMed]
- Qiu, J.; Chang, Z.; Wang, K.; Chen, K.; Wang, Q.; Zhang, J.; Li, J.; Yang, C.; Zhao, Y.; Zhang, Y. The predictive accuracy of coronary heart disease risk prediction models in rural Northwestern China. Prev. Med. Rep. 2023, 36, 102503. [Google Scholar] [CrossRef] [PubMed]
- Kasim, S.S.; Ibrahim, N.; Malek, S.; Ibrahim, K.S.; Aziz, M.F.; Song, C.; Chia, Y.C.; Ramli, A.S.; Negishi, K.; Mat Nasir, N. Validation of the general Framingham Risk Score (FRS), SCORE2, revised PCE and WHO CVD risk scores in an Asian population. Lancet Reg. Health—West. Pac. 2023, 35, 100742. [Google Scholar] [CrossRef]
- Sieciński, S.; Kostka, P.S.; Tkacz, E.J. Gyrocardiography: A Review of the Definition, History, Waveform Description, and Applications. Sensors 2020, 20, 6675. [Google Scholar] [CrossRef]
- Irshad, M.T.; Nisar, M.A.; Huang, X.; Hartz, J.; Flak, O.; Li, F.; Gouverneur, P.; Piet, A.; Oltmanns, K.M.; Grzegorzek, M. SenseHunger: Machine Learning Approach to Hunger Detection Using Wearable Sensors. Sensors 2022, 22, 7711. [Google Scholar] [CrossRef]
- Duraj, K.; Piaseczna, N.; Kostka, P.; Tkacz, E. Semantic Segmentation of 12-Lead ECG Using 1D Residual U-Net with Squeeze-Excitation Blocks. Appl. Sci. 2022, 12, 3332. [Google Scholar] [CrossRef]
- Duraj, K.M.; Siecinski, S.; Doniec, R.J.; Piaseczna, N.J.; Kostka, P.S.; Tkacz, E.J. Heartbeat Detection in Seismocardiograms with Semantic Segmentation. In Proceedings of the 2022 44th Annual International Conference of the IEEE Engineering in Medicine & Biology Society (EMBC), Glasgow, UK, 11–15 July 2022. [Google Scholar] [CrossRef]
- Huang, X.; Shirahama, K.; Irshad, M.T.; Nisar, M.A.; Piet, A.; Grzegorzek, M. Sleep Stage Classification in Children Using Self-Attention and Gaussian Noise Data Augmentation. Sensors 2023, 23, 3446. [Google Scholar] [CrossRef]
- Irshad, M.T.; Li, F.; Nisar, M.A.; Huang, X.; Buss, M.; Kloep, L.; Peifer, C.; Kozusznik, B.; Pollak, A.; Pyszka, A.; et al. Wearable-based human flow experience recognition enhanced by transfer learning methods using emotion data. Comput. Biol. Med. 2023, 166, 107489. [Google Scholar] [CrossRef]
- Goff, D.C.; Sellers, D.E.; McGovern, P.G.; Meischke, H.; Goldberg, R.J.; Bittner, V.; Hedges, J.R.; Allender, P.S.; Nichaman, M.Z.; Group, R.S.; et al. Knowledge of heart attack symptoms in a population survey in the United States: The REACT trial. Arch. Intern. Med. 1998, 158, 2329–2338. [Google Scholar] [CrossRef]
- Quah, J.L.J.; Yap, S.; Cheah, S.O.; Ng, Y.Y.; Goh, E.S.; Doctor, N.; Leong, B.S.H.; Tiah, L.; Chia, M.Y.C.; Ong, M.E.H. Knowledge of signs and symptoms of heart attack and stroke among Singapore residents. BioMed Res. Int. 2014, 2014, 572425. [Google Scholar] [CrossRef] [PubMed]
- Nauser, T.D.; Stites, S.W. Diagnosis and treatment of pulmonary hypertension. Am. Fam. Physician 2001, 63, 1789. [Google Scholar]
- Wessely, S.; Nickson, J.; Cox, B. Symptoms of low blood pressure: A population study. Br. Med. J. 1990, 301, 362–365. [Google Scholar] [CrossRef] [PubMed]
- Ekman, I.; Cleland, J.G.; Andersson, B.; Swedberg, K. Exploring symptoms in chronic heart failure. Eur. J. Heart Fail. 2005, 7, 699–703. [Google Scholar] [CrossRef] [PubMed]
- Coats, A.J.; Clark, A.L.; Piepoli, M.; Volterrani, M.; Poole-Wilson, P.A. Symptoms and quality of life in heart failure: The muscle hypothesis. Br. Heart J. 1994, 72, S36. [Google Scholar] [CrossRef] [PubMed]
- Albert, N.; Trochelman, K.; Li, J.; Lin, S. Signs and symptoms of heart failure: Are you asking the right questions? Am. J. Crit. Care 2010, 19, 443–452. [Google Scholar] [CrossRef] [PubMed]
- Sun, R.; Liu, M.; Lu, L.; Zheng, Y.; Zhang, P. Congenital heart disease: Causes, diagnosis, symptoms, and treatments. Cell Biochem. Biophys. 2015, 72, 857–860. [Google Scholar] [CrossRef] [PubMed]
- Grimard, B.H.; Larson, J.M. Aortic stenosis: Diagnosis and treatment. Am. Fam. Physician 2008, 78, 717–724. [Google Scholar]
- Hansson, A.; Madsen-Härdig, B.; Bertil Olsson, S. Arrhythmia-provoking factors and symptoms at the onset of paroxysmal atrial fibrillation: A study based on interviews with 100 patients seeking hospital assistance. BMC Cardiovasc. Disord. 2004, 4, 13. [Google Scholar] [CrossRef] [PubMed]
- Portegies, M.; Koudstaal, P.; Ikram, M. Cerebrovascular disease. Handb. Clin. Neurol. 2016, 138, 239–261. [Google Scholar]
- Krystal, J.H.; Woods, S.W.; Hill, C.L.; Charney, D.S. Characteristics of panic attack subtypes: Assessment of spontaneous panic, situational panic, sleep panic, and limited symptom attacks. Compr. Psychiatry 1991, 32, 474–480. [Google Scholar] [CrossRef]
- Struyf, T.; Deeks, J.J.; Dinnes, J.; Takwoingi, Y.; Davenport, C.; Leeflang, M.M.; Spijker, R.; Hooft, L.; Emperador, D.; Domen, J.; et al. Signs and symptoms to determine if a patient presenting in primary care or hospital outpatient settings has COVID-19. Cochrane Database Syst. Rev. 2022, 2022, CD013665. [Google Scholar]
- Ludwig, H.; Strasser, K. Symptomatology of anemia. In Seminars in Oncology; Elsevier: Amsterdam, The Netherlands, 2001; Volume 28, pp. 7–14. [Google Scholar]
- Kim, S.H.; Oh, E.G.; Lee, W.H.; Kim, O.S.; Han, K.H. Symptom experience in Korean patients with liver cirrhosis. J. Pain Symptom Manag. 2006, 31, 326–334. [Google Scholar] [CrossRef] [PubMed]
- Tully, P.J.; Turnbull, D.A.; Beltrame, J.; Horowitz, J.; Cosh, S.; Baumeister, H.; Wittert, G.A. Panic disorder and incident coronary heart disease: A systematic review and meta-regression in 1,131,612 persons and 58,111 cardiac events. Psychol. Med. 2015, 45, 2909–2920. [Google Scholar] [CrossRef] [PubMed]
- Šimundić, A.M. Measures of diagnostic accuracy: Basic definitions. EJIFCC 2009, 19, 203–211. [Google Scholar] [PubMed]
- Qrenawi, M.I.; Al Sarraj, W. Identification of Cardiovascular Diseases Risk Factors among Diabetes Patients Using Ontological Data Mining Techniques. In Proceedings of the 2018 International Conference on Promising Electronic Technologies (ICPET), Deir El-Balah, Palestine, 3–4 October 2018; pp. 129–134. [Google Scholar] [CrossRef]
- Xing, Y.; Wang, J.; Zhao, Z.; Gao, Y. Combination Data Mining Methods with New Medical Data to Predicting Outcome of Coronary Heart Disease. In Proceedings of the 2007 International Conference on Convergence Information Technology (ICCIT 2007), Gwangju, Republic of Korea, 21–23 November 2007; pp. 868–872. [Google Scholar] [CrossRef]
Disclaimer/Publisher’s Note: The statements, opinions and data contained in all publications are solely those of the individual author(s) and contributor(s) and not of MDPI and/or the editor(s). MDPI and/or the editor(s) disclaim responsibility for any injury to people or property resulting from any ideas, methods, instructions or products referred to in the content. |
© 2024 by the authors. Licensee MDPI, Basel, Switzerland. This article is an open access article distributed under the terms and conditions of the Creative Commons Attribution (CC BY) license (https://creativecommons.org/licenses/by/4.0/).