Article

A Study on the Rock-Breaking Characteristics of an Arcing-Blade Cutter under Different Cutting Parameters

1
School of Mechanical and Electronical Engineering, Xidian University, Xi’an 710071, China
2
Shanxi Tiandi Coal Mining Machinery Co., Ltd., Taiyuan 030032, China
*
Author to whom correspondence should be addressed.
Appl. Sci. 2024, 14(3), 1241; https://doi.org/10.3390/app14031241
Submission received: 25 December 2023 / Revised: 26 January 2024 / Accepted: 29 January 2024 / Published: 2 February 2024

Abstract

:
To analyze the rock-breaking characteristics of an arcing-blade cutter in cutting red sandstone, a two-cutter cutting model was established based on the finite element method. Then, the cutting processes of the arcing-blade cutter at penetrations of 2 mm, 4 mm, and 6 mm with different cutter spacings were investigated, and the changing rules of the rock-breaking load, rock crushing state, and rock-breaking efficiency were obtained. Subsequently, the obtained simulation results were validated through linear cutting experiments. The research results showed that, as the penetration of the arcing-blade cutter increased, the rock-breaking load also increased; specifically, under 2 mm penetration, the rock-breaking load remained stable, irrespective of the cutter spacing. However, under 4 mm and 6 mm penetration, the vertical and rolling force increased and then stabilized with an increase in the cutter spacing, while the lateral force decreased and then stabilized, attributed to the synergistic effect between the cutters. At 2 mm penetration, the absence of interaction between the cutting of two cutters in sequence resulted in two separate crushed areas on the rock surface. However, at 4 mm and 6 mm penetration, the rock ridge could be crushed under a smaller cutter spacing. Meanwhile, with an increase in the cutter spacing, the synergistic effect between the cutters diminished, causing the rock ridge between two cuttings to remain uncrushed. The specific energy at the 4 mm and 6 mm penetrations decreased initially with an increase in the cutter spacing, then increased, and eventually stabilized. The optimal cutter spacings at these penetrations were determined as 50 mm and 60 mm, respectively. Conversely, at 2 mm penetration, the specific energy remained almost unchanged with an increase in the cutter spacing, maintaining at a high level and resulting in a low efficiency in cutting rock.

1. Introduction

Tunnel Boring Machines (TBM) are widely utilized in underground construction due to their superior safety and efficiency compared to traditional tunneling methods [1,2,3]. At present, there are many projects using TBM construction internationally, but due to complex global geological conditions, the excavation efficiency of TBMs varies within different geological conditions. For example, low-strength rock can cause instability in tunnel excavation, while high-strength rock can lead to a low penetration rate. TBMs primarily operate by using the disc cutter on the cutter head to interface with the rock, and its substantial thrust and torque enable the cutter to effectively excavate the rock [4,5]. Generally, a good rock-breaking performance of the disc cutter directly determines the tunnelling efficiency of the TBM. Therefore, the rock-breaking characteristics of disc cutters have attracted great attention from researchers around the world. The cutting parameters and structural parameters of the disc cutter are the most important factors affecting the rock–cutter interaction behavior [6,7]. Among them, the structural parameters of the disc cutter are mainly affected by the cross-sectional shape of the cutter. Thus, selecting an appropriate blade shape for the cutter according to the specific rock formations can significantly enhance the TBM’s construction efficiency [8,9]. Consequently, research on the blade shape of the cutter has received considerable attention among scholars, as it has the potential to improve TBM performance.
Currently, the flat-blade cutter is widely used and has been the focus of extensive research, as shown in Figure 1a. Liu et al. [10] studied the rock-breaking characteristics of the flat-blade cutter with the assistance of pre-cutting grooves, and studied the rock-breaking load and the distribution of the internal stress of the rock under experimental and simulation conditions. Hu et al. [11] conducted a numerical simulation of press in rock breaking with different edge widths of the flat-blade cutter to investigate its impact on rock-breaking efficiency. Wen et al. [12] used discrete elements to analyze the cutting characteristics of the flat-blade cutter under coupled strata, identifying the laws of rock-breaking load and efficiency. Additionally, Li et al. [13] examined different cutting sequences of the flat-blade cutter using discrete elements and established a rotary cutting model with various arrangements of multiple cutters to study the mechanical response characteristics. Agrawal et al. [14] investigated the cutter force and cutter wear with the discrete element method. Comakli et al. [15] conducted linear cutting tests with small flat-blade cutters and tried to use the testing results to predict the TBM performance. Ayawah et al. [16] proposed a new method to decide the cutting geometry of the flat-blade cutter based on cutting experiments and simulations. Zare et al. [17] optimized the cutter spacing of the flat-blade cutters considering the joint with the distinct element method.
In TBM engineering, the flat-blade cutter is prone to overload due to its large contact area with rocks under hard rock conditions, resulting in significant deformation or even the failure of the flat-blade cutter. In response to these limitations, the arcing-blade cutter was developed as a modification of the flat-blade cutter, as shown in Figure 1b. Due to its structural characteristics, the contact area of the arcing-blade cutter with rocks is small, providing a significant advantage in load reduction. There is also a small amount of research on the arcing-blade cutter. Jiang et al. [18] used PFC3D to establish a rotational cutting model of the arcing-blade cutter and simulate its rock-breaking process. Zhang et al. [19] simulated the dynamic indentation process of the arcing-blade cutter and analyzed the change in rock-breaking load under different peripheral pressures. Furthermore, Duan et al. [20] compared the rock-breaking mechanisms of flat- and arcing-blade cutters under hard rock, summarizing the characteristics of rock-breaking load, rock chips, rock-breaking efficiency, and stress distribution. Zhang et al. [21] simulated the crack propagation induced by the arcing-blade cutter.
The above studies have a preliminary understanding of the action mechanism of the arcing-blade cutter, but lack research on its performance under different cutting parameters, such as cutter spacing and penetration, which cannot effectively guide the arrangement and construction of the arcing-blade cutter. As a comprehensive approach, numerical simulation has proven to be an effective method for studying the rock-cutting process of TBM cutters [22,23]. Consequently, this paper establishes a linear cutting model of the arcing-blade cutter based on the finite element method, analyzes the influence of different cutter spacings and penetrations on its performance, and provides valuable insights for optimizing the parameters and cutter arrangement of the arcing-blade cutter. It should be noted that the rock surface simulated in this paper is smooth and intact, which is slightly different from the rock surfaces cut by TBM cutters in actual TBM engineering. Meanwhile, this paper only studied the cutting process of two TBM cutters, which differs from the actual sequential cutting of multiple TBM cutters.

2. Calibration of Rock Materials

The mechanical parameters of red sandstone were obtained through uniaxial compression and Brazilian splitting experiments, which are summarized in Table 1. In this paper, the rock-breaking process of an arcing-blade cutter is simulated using the finite element method, and the Riedel–Hiermaier–Thoma (RHT) material intrinsic model is utilized to describe the red sandstone material. The RHT material model divides the stress development of rock materials under dynamic loading into three stages: the elastic stage, linear strengthening stage, and damage softening stage, and correspondingly introduces two limit surfaces: the elastic yield surface and failure surface. The residual strength surface is used to describe the change patterns of material failure strength, initial yield strength, and residual strength, which can better simulate the rock failure process and crack propagation [24]. In order to accurately simulate red sandstone, it is necessary to calibrate this rock sample.
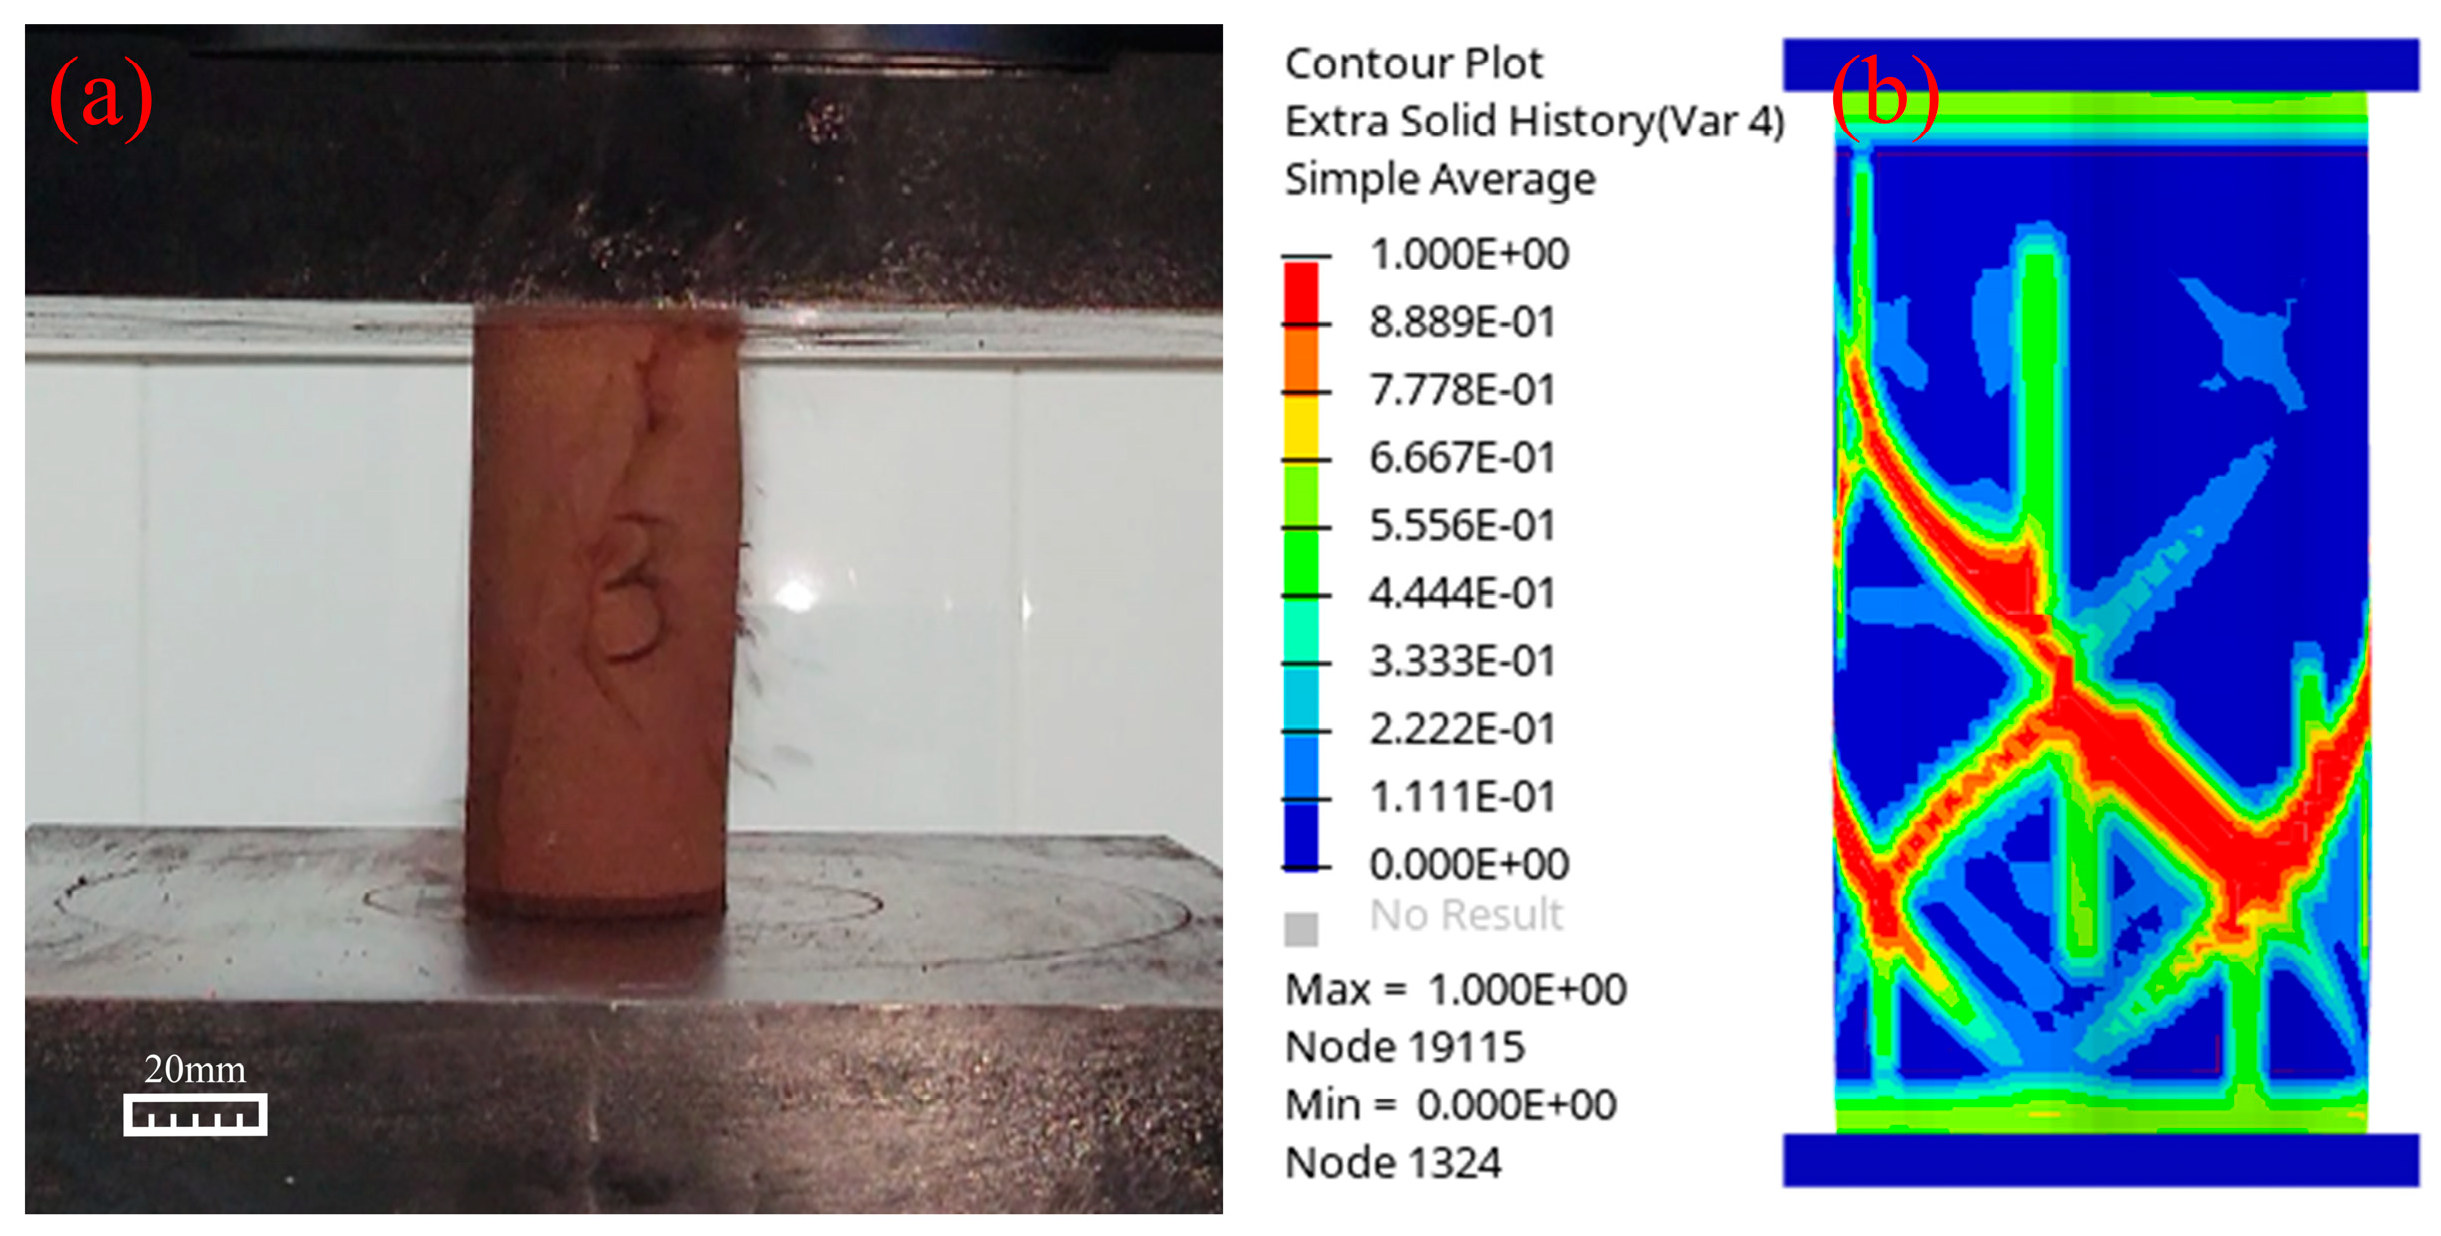
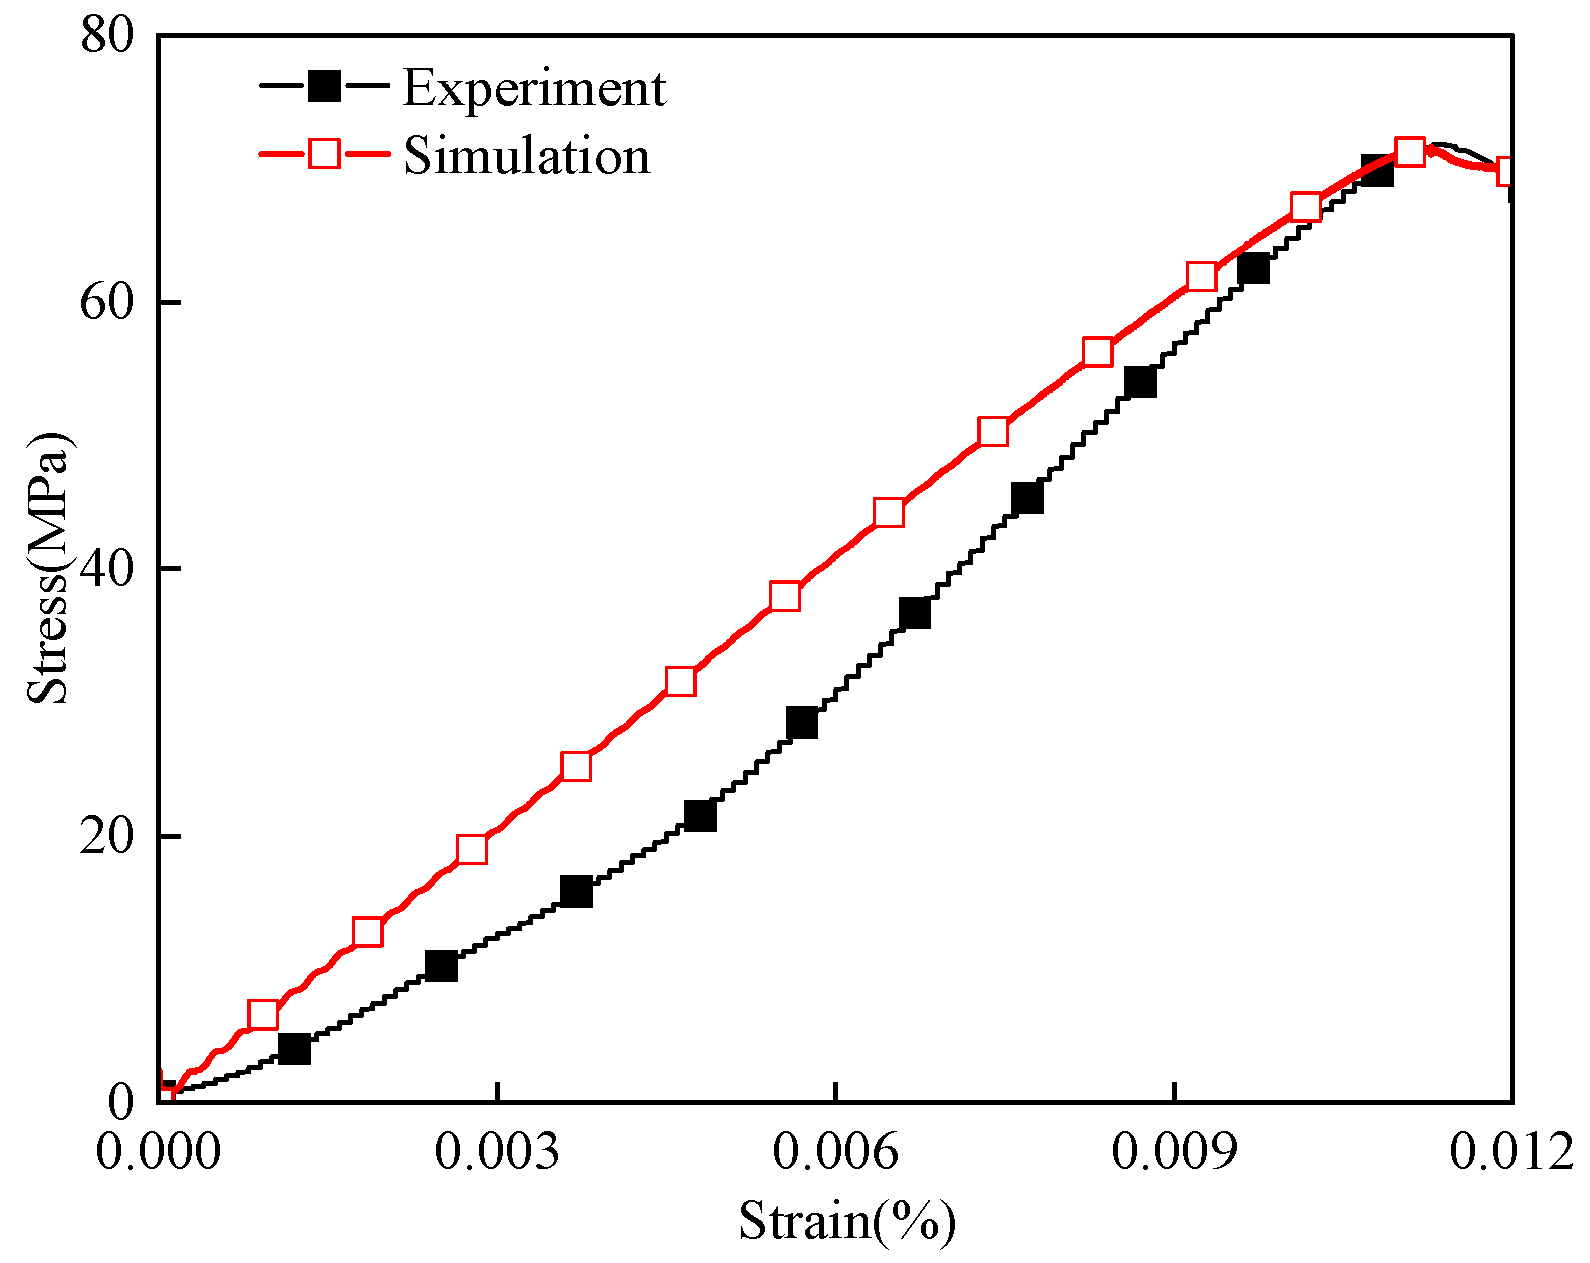
Taking uniaxial compression calibration as an example, a cylindrical rock sample with a size of ∅50 mm × 100 mm corresponding to the uniaxial compression experiment was generated and compressed in the simulation. Then, the calculated curves of the axial compressive stress and axial strain in the simulation results were extracted. Following this step, the simulation parameters were adjusted to fit the simulation curve to the experimental curve. Figure 2 shows the results of the uniaxial compression experiments and simulations. Among them, the rock in Figure 2b has the same size as the rock in Figure 2a. In the simulation, a certain displacement was applied to the upper surface of the rock, causing the rock to break. The rock-breaking process in Figure 2a was simulated, and the output stress–strain curve was compared with the experimental data. Figure 2 indicates that the crack extension and material failure in the simulation of the rock sample was in good agreement with the experimental phenomenon.
Figure 3 illustrates a comparison of the extracted axial compressive stress and axial strain curves. It can be seen that the simulation result exhibits a high consistency with the experimental one. This outcome serves as a foundation for the subsequent numerical modeling of cutting rock with arcing-blade cutters.

3. Rock-Cutting Model of Two Arcing-Blade Cutters

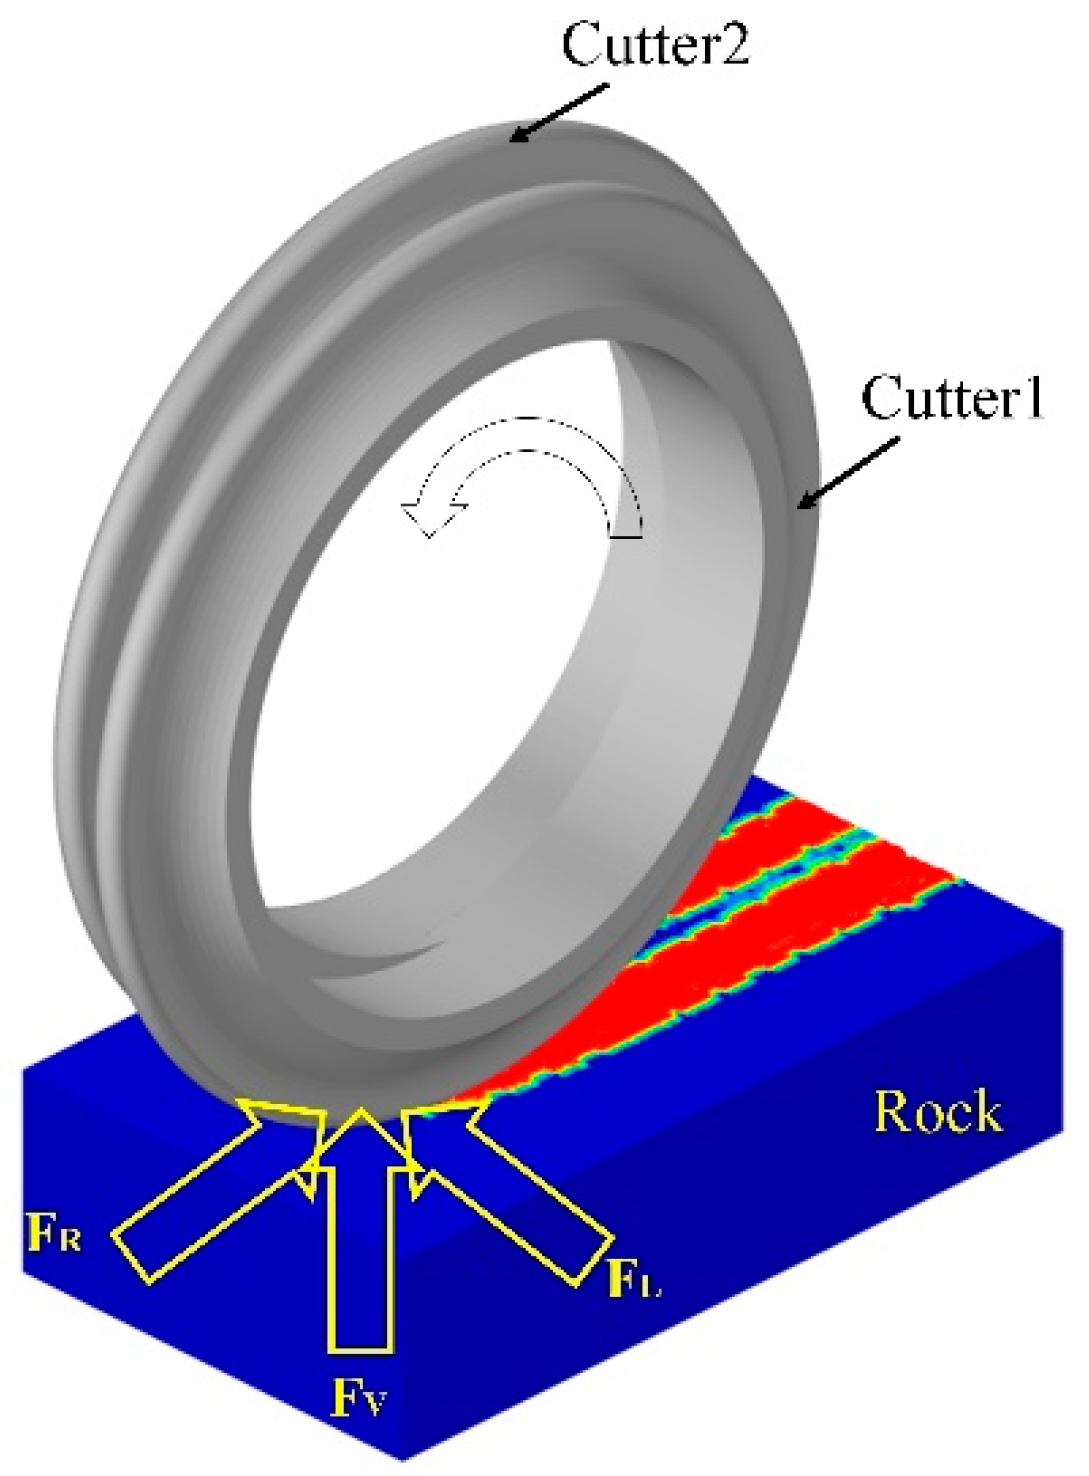
This paper mainly focuses on the influence of cutter spacing and penetration on the rock-breaking characteristics of the arcing-blade cutter. Additionally, the cutter ring, rather than the complete arcing-blade cutter, was used to cut the rock sample in these simulations, considering the calculation cost. Therefore, a sequential cutting model of two arcing-blade cutter rings with different cutting parameters was established, as depicted in Figure 4. In fact, the TBM cutter cut the rock with a rotary cutting mode. However, it can be regarded as a linear cutting model due to the large radius of rotary cutting. Therefore, a linear cutting simulation model is established in this article that is consistent with subsequent linear cutting experiments.
The two cutters were arranged coaxially, with the distance between the centers of the blades of the two cutters representing the cutter spacing and the depth of cutting the rock denoting the penetration. The section of the red sandstone was rectangular, with a width and height of 230 mm and 100 mm, respectively, and the length of the rock in the cutting direction set at 400 mm. In these simulations, the penetration of the arcing-blade cutter was varied at 2, 4, and 6 mm, with each penetration corresponding to different cutter spacings of 40 mm, 50 mm, 60 mm, 70 mm, and 80 mm. During the cutting process, the left arcing-blade cutter (cutter 1) first cut a length of 75 mm, then the right arcing-blade cutter (cutter 2) started to cut the rock sample subsequently.
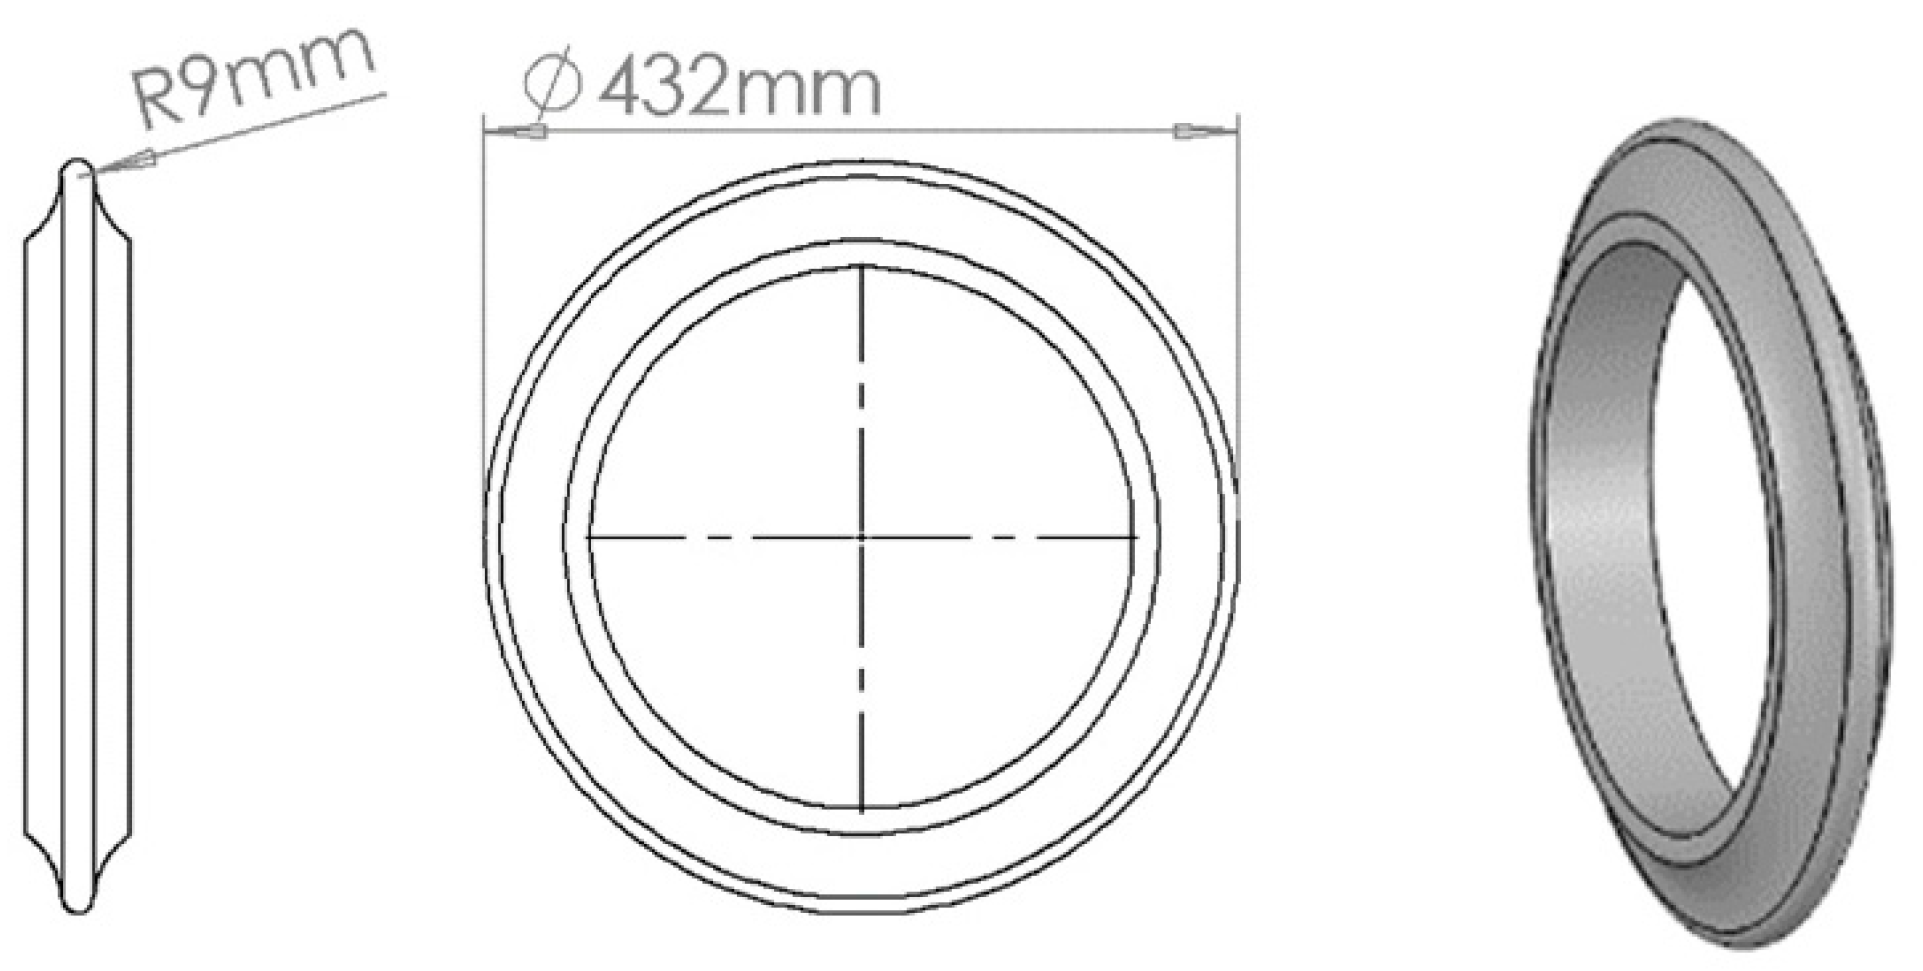
In Figure 5, the detailed parameters of the arcing-blade cutter are presented, with a cutter diameter of 432 mm and a cutting blade radius of 9 mm. During the simulation, the cutter ring was treated as a rigid body with a cutting speed set at 15 m/s. The mesh of the rock was entirely a hexahedral mesh. To save computing resources, the rock grid was divided into three layers. Specifically, the mesh size was set at 2 mm for the top 25 mm depth, 3 mm for the 25–50 mm depth range, and 4 mm for the remaining 50–100 mm depth range of the rock sample. Given the rigidity of the cutter, a six-plane mesh mixed with a four-plane mesh dominated its mesh type, with a mesh size set at 4 mm. Rigid walls were installed on the left and right sides, as well as at the bottom of the rock, to maintain its position. Additionally, non-reflective boundary conditions were applied to all faces except the upper surface of the rock sample to eliminate the boundary effect on the rock-breaking process.

4. Analysis of Calculation Results

4.1. Rock-Breaking Load of Arcing-Blade Cutters

In the cutting process, the cutter is primarily subject to three loads, as indicated in Figure 6. These loads consist of the vertical force (FV), rolling force (FR), and lateral force (FL). The vertical force (FV) is applied in the normal direction of the cutter, while the rolling force (FR) is directed tangentially to the cutter ring. The lateral force (FL) is applied in the direction of the cutter shaft.
The dynamic rock-breaking load under the working conditions of 2 mm penetration and 80 mm cutter spacing was taken as an example to study the dynamic process of the rock-breaking load of two cutters cutting in sequence. As observed from Figure 7, at the beginning of the cutting stage, the rock-breaking loads of cutter 1 and cutter 2 first increased from 0 to a certain value. Subsequently, the rock-breaking loads exhibited a certain degree of volatility. Comparisons of the three rock-breaking loads reveal that the FV was the largest and the FL was the smallest, which fluctuated around 0. The magnitudes of the rock-breaking loads for cutter 1 and cutter 2 were almost identical, and varied only at the start and end time.
The data represented in Figure 8 depict the average values of the three-directional loads applied to cutter 2 at various penetrations and cutter spacings. At a penetration of 2 mm, the three-directional loads exhibited minimal variation with an increase in the cutter spacing. Specifically, the FV remained nearly constant at around 40 kN, the FR remained steady at approximately 4 kN, and the FL essentially stayed at about 0. It can be observed that the three-directional loads did not change significantly with an increase in the cutter spacing at such a low penetration. Upon increasing the penetration to 4 mm, the FV and FR initially displayed an upward trend as the cutter spacing increased, followed by a subsequent decline and eventual stabilization. To elaborate, the FV increased from 80.5 kN to 105.5 kN as the cutter spacing grew from 40 mm to 60 mm, after which, it remained stable around 105 kN as the cutter spacing extended to 80 mm. Conversely, the FL demonstrated an inverse pattern to the FV and FR, as it decreased from 1.7 kN to 0.7 kN with a rise in the cutter spacing from 40 mm to 60 mm, ultimately plateauing near 0 kN with further increases in the cutter spacing. Similarly, at a penetration of 6 mm, the trend of the three-directional loads with an increase in cutter spacing was similar to that observed for 4 mm penetration. It should be pointed out that the three-directional loads at a penetration of 6 mm began to be stable as the cutter spacing reached 70 mm, which is different from the situation for 4 mm penetration. Moreover, for a given cutter spacing, the change trend of the three-directional loads showed an increase with a rise in penetration. For instance, at a cutter spacing of 60 mm, the FV increased from 38.4 kN to 141.7 kN and the FR increased from 4.3 kN to 15.9 kN as the penetration expanded from 2 mm to 6 mm.
In summary, the rock-breaking loads of the arcing-blade cutter did not change significantly as the cutter spacing increased at a penetration of 2 mm. However, when the penetration was 4 mm or 6 mm, the three-directional loads were significantly affected by an increase in the cutter spacing. This change trend is attributed to the synergistic effect between cutter 1 and cutter 2. Cutter 1 initiated the rock-cutting process before cutter 2, then cutter 2 cut the rock under a given cutter space. At a penetration of 2 mm, there was no synergistic effect between the cutters for different cutter spacings, causing cutter 2 to independently function like a single unit in rock cutting. Consequently, the rock-breaking load did not change with an increase in the cutter spacing. Conversely, when the penetration was 4 mm, the smaller cutter spacing enabled the two cutters to synergistically cut the rock. As the cutter spacing exceeded a certain value, this synergistic effect weakened or disappeared. Observably, at a cutter spacing of 60 mm, the synergistic effect vanished, causing cutter 2 to be similar to a single unit in rock cutting, thereby maintaining a stable rock-breaking load, as shown in Figure 8.
When the penetration reached 6 mm, it can be found that the synergistic effect between cutter 1 and cutter 2 was eliminated when the cutter spacing increased to 70 mm, and the rock-breaking loads stayed stable with a further increase in the cutter spacing, as shown in Figure 8. This indicates that the cutter spacing had a significant impact on the rock-breaking load for a large penetration. Moreover, the difference in the rock-breaking load between cutter 2 and cutter 1 was very small when the synergistic effect disappeared, as depicted in Figure 7. Consequently, the cutter spacing associated with the synergistic effect could reduce the rock-breaking load of cutter 2 for a large penetration. Specifically, when the penetration level is fixed, a smaller cutter spacing strengthens the synergistic effect, while a larger cutter spacing weakens or even eliminates the synergistic effect for two cutters, leading to the stabilization of the rock-breaking loads with an increase in cutter spacing.

4.2. Rock Crushing State Induced by Arcing-Blade Cutters

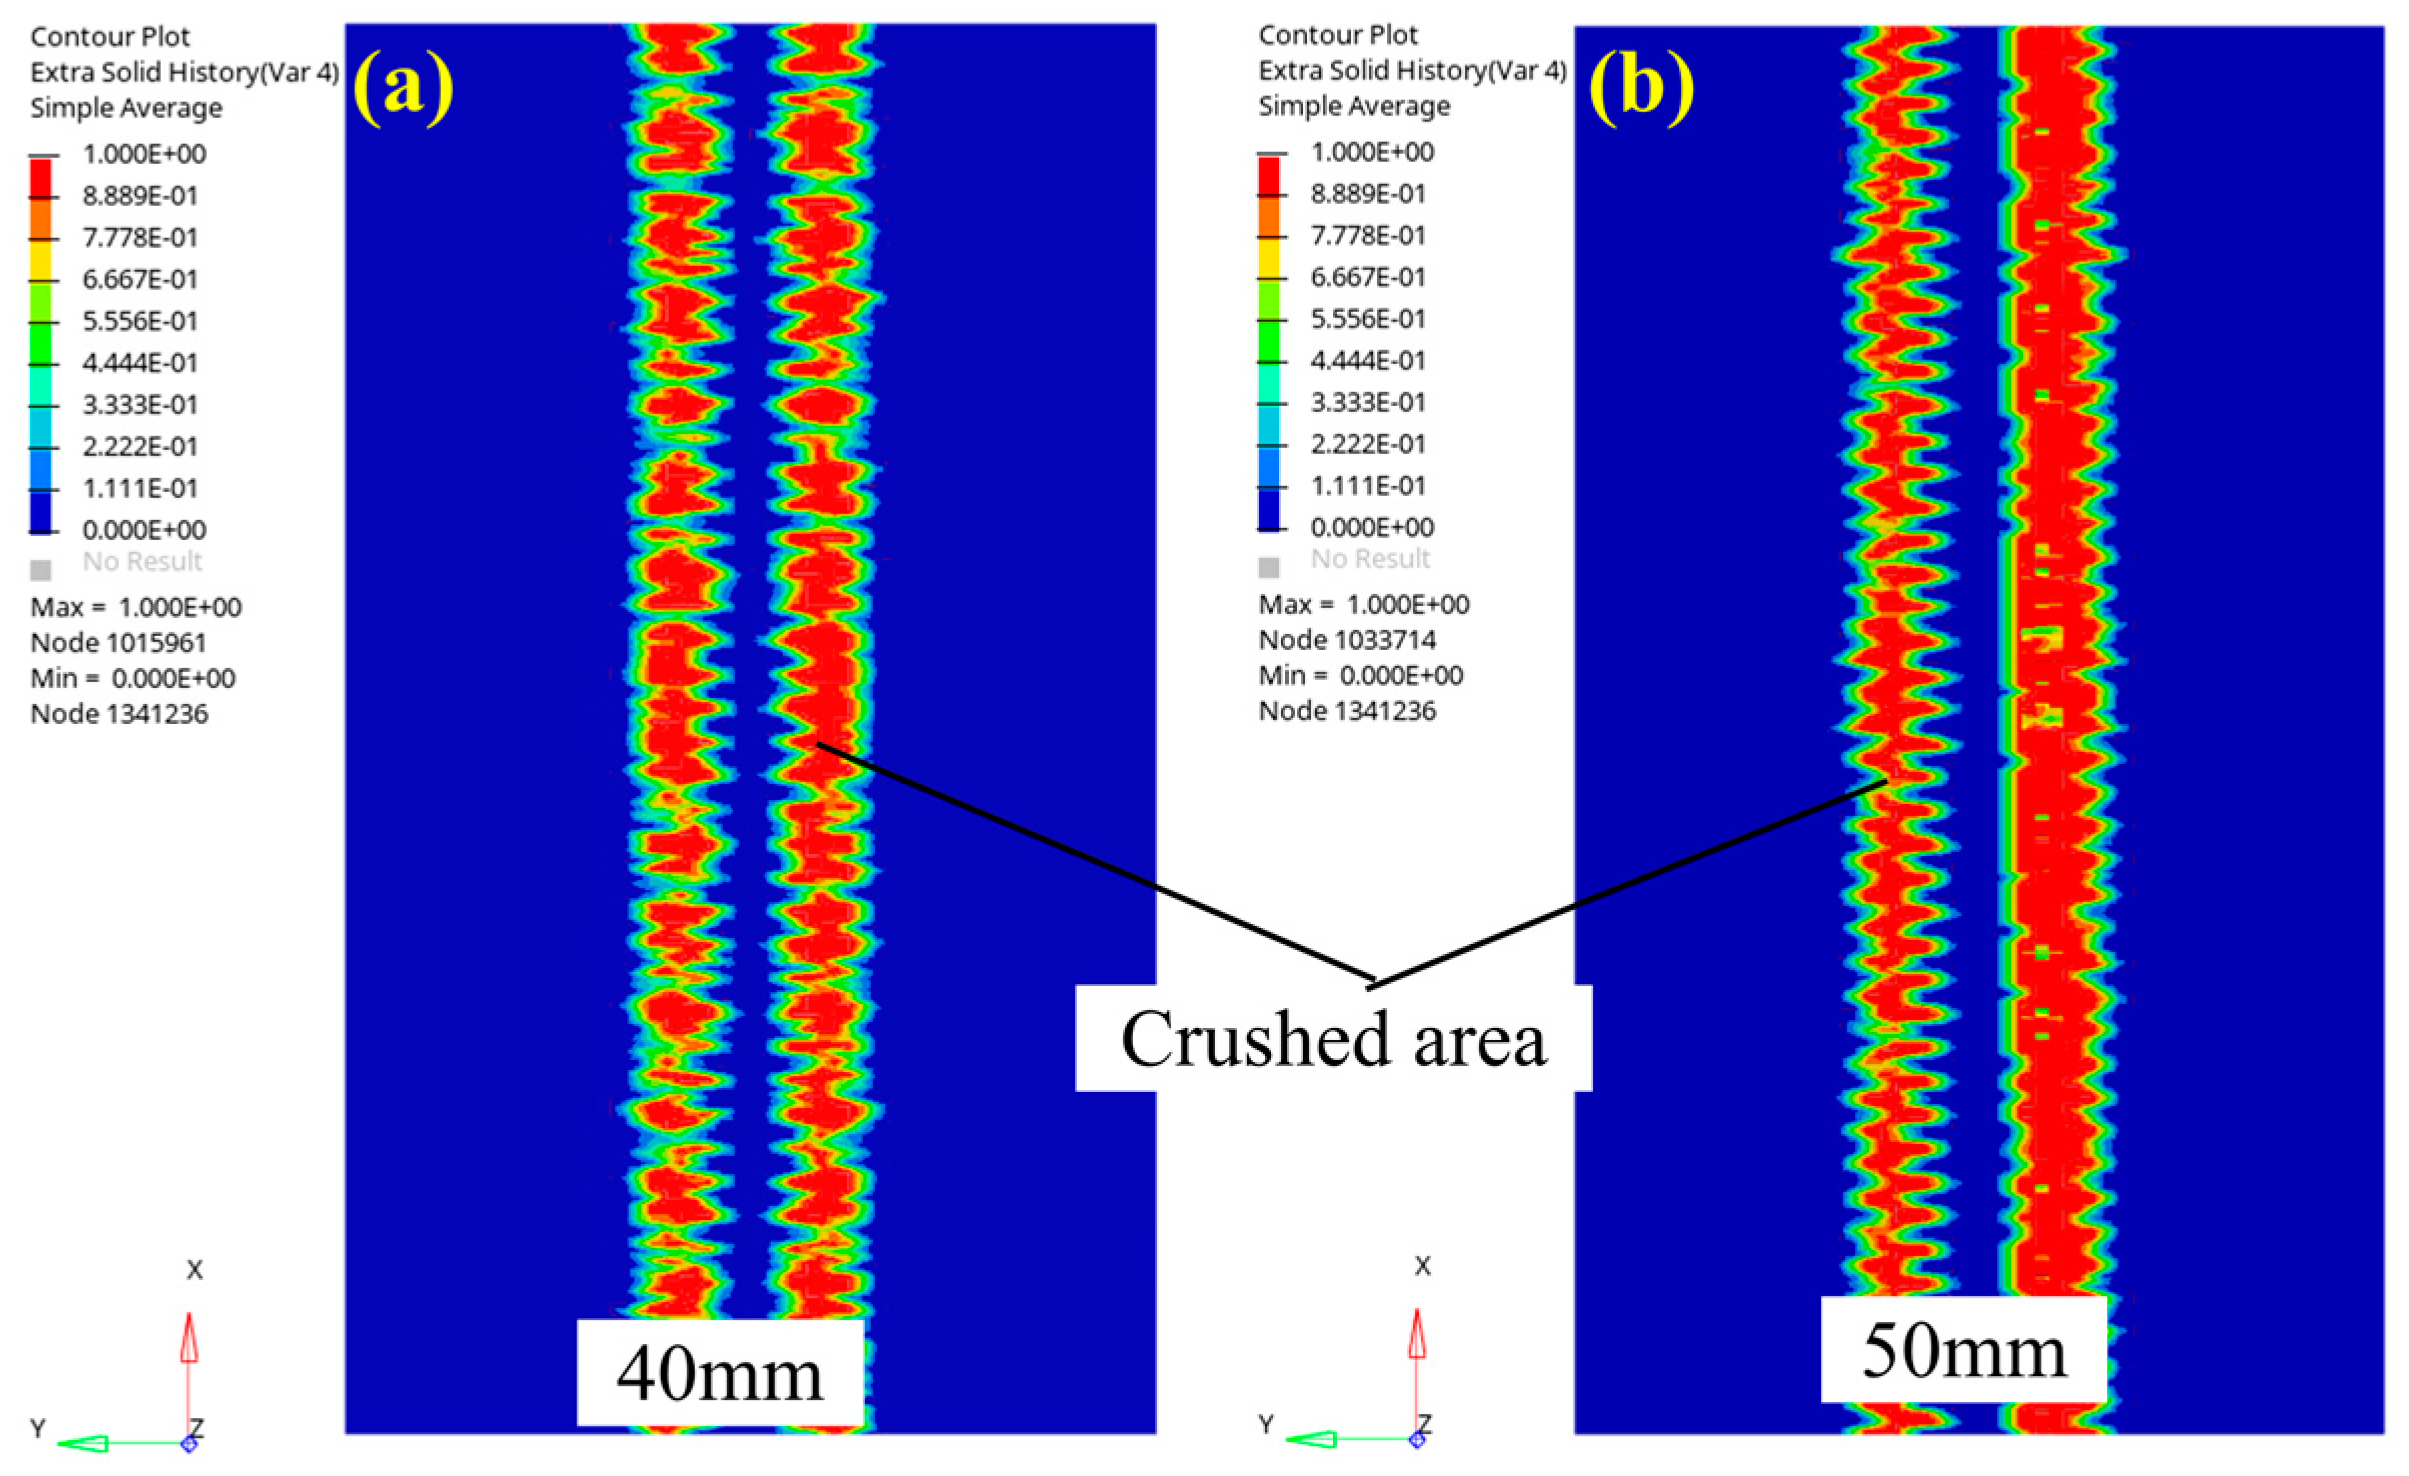
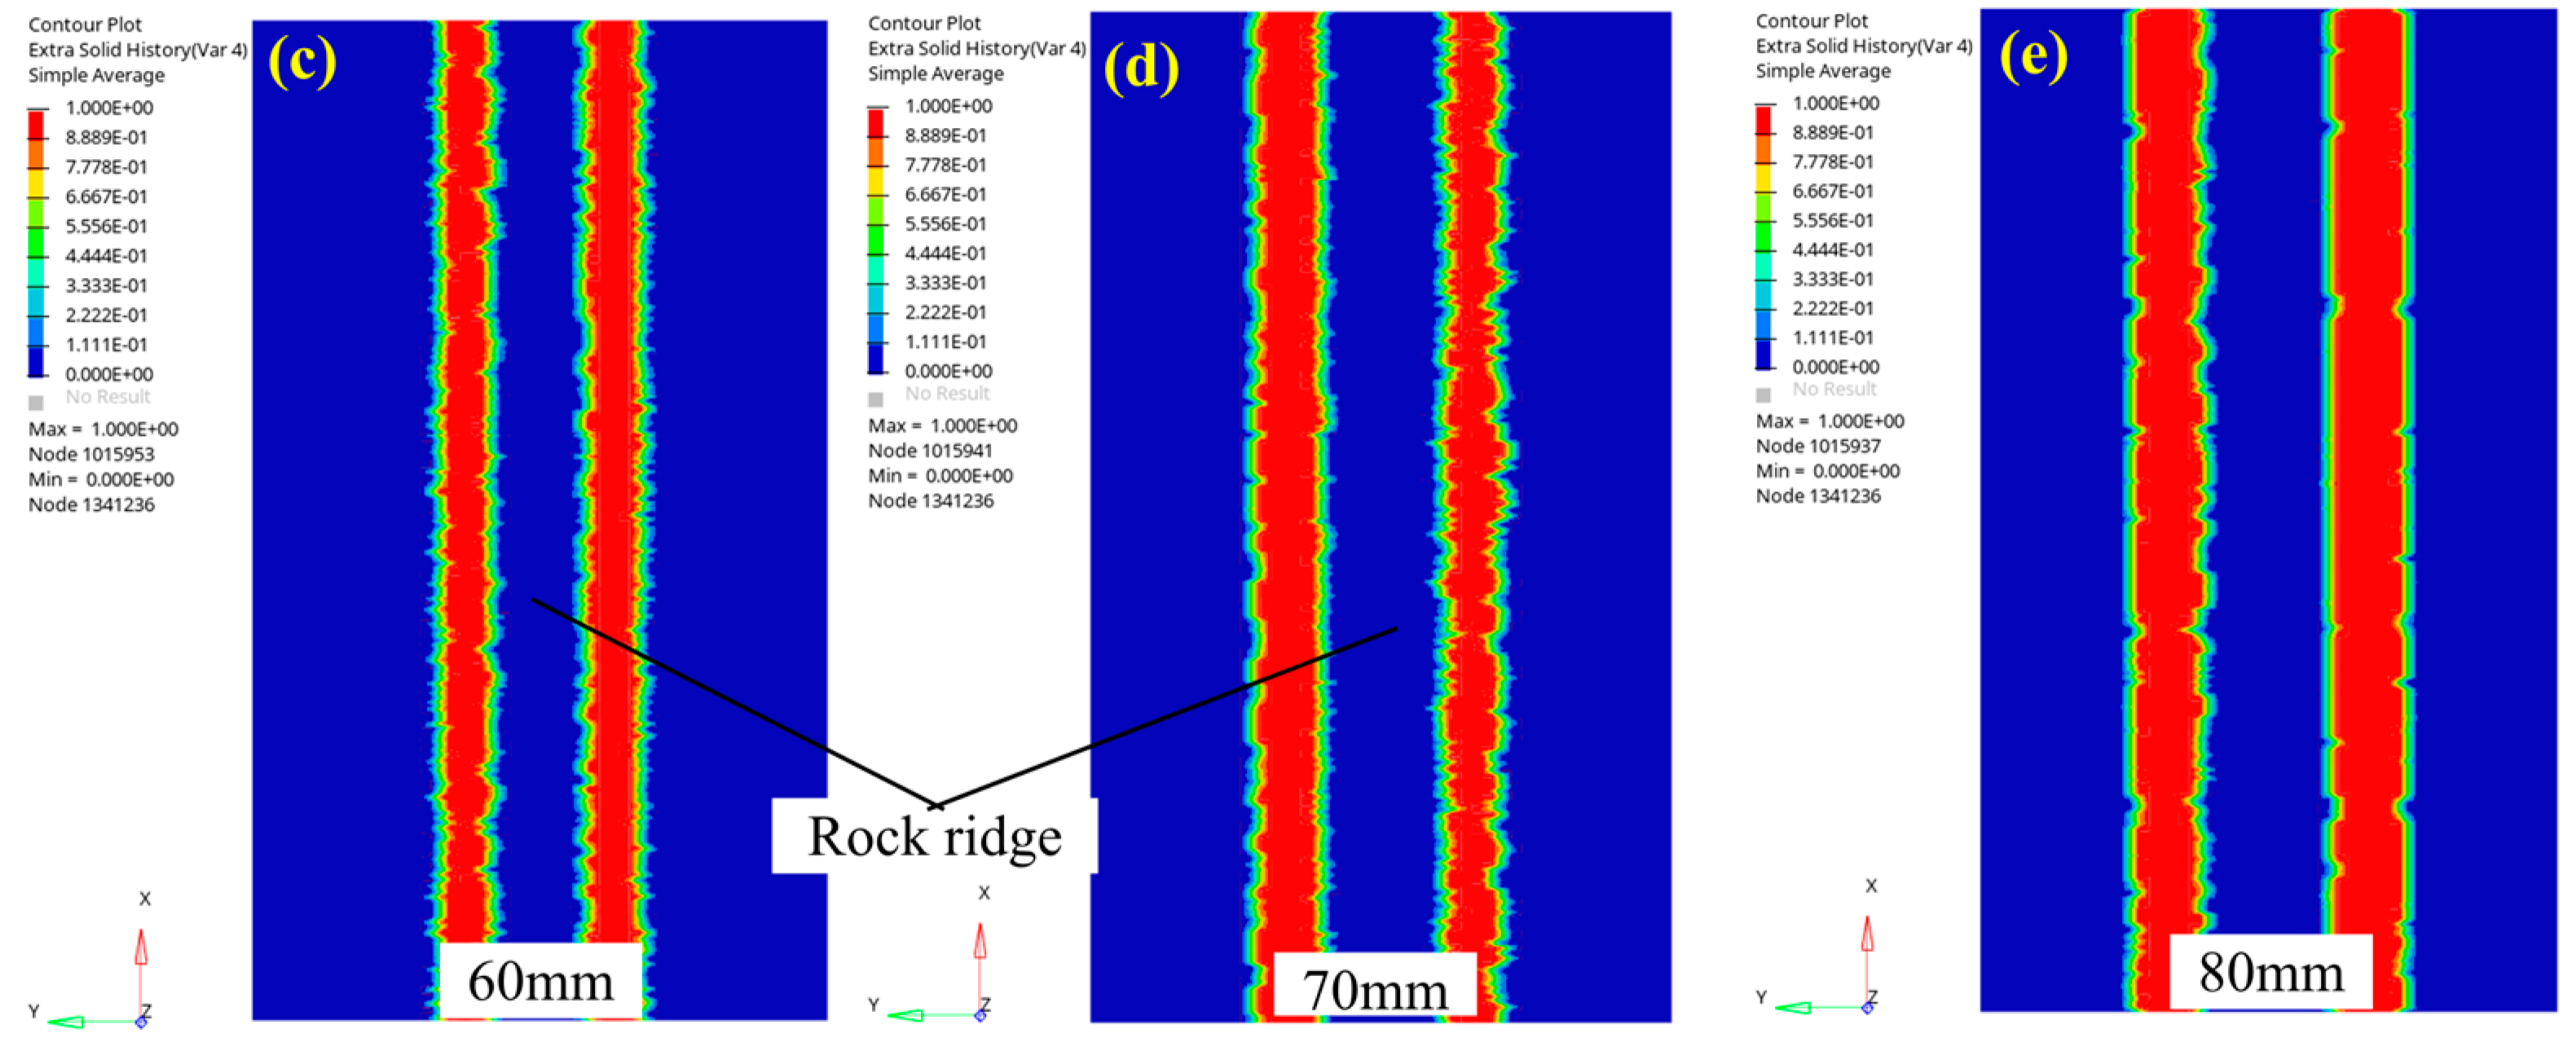
At 2 mm penetration, the crushing states on the rock surface are depicted in Figure 9. The rock surface displayed two distinct “strip” crushed areas, which resulted from the successive cutting actions of cutter 1 and cutter 2. Notably, the cutters left undamaged rock ridges between the crushed areas. This observation aligns with the rock-breaking load law discussed in Section 4.1. Specifically, at a 2 mm penetration, there was a lack of synergistic effect between the cutters at any spacing. Therefore, the two cutters operated independently, leading to the formation of separate and non-interacting crushed areas. Furthermore, it was evident that these independent crushed areas did not affect each other. Additionally, with an increase in the cutter spacing, there was a corresponding increment in the width of the rock ridge.
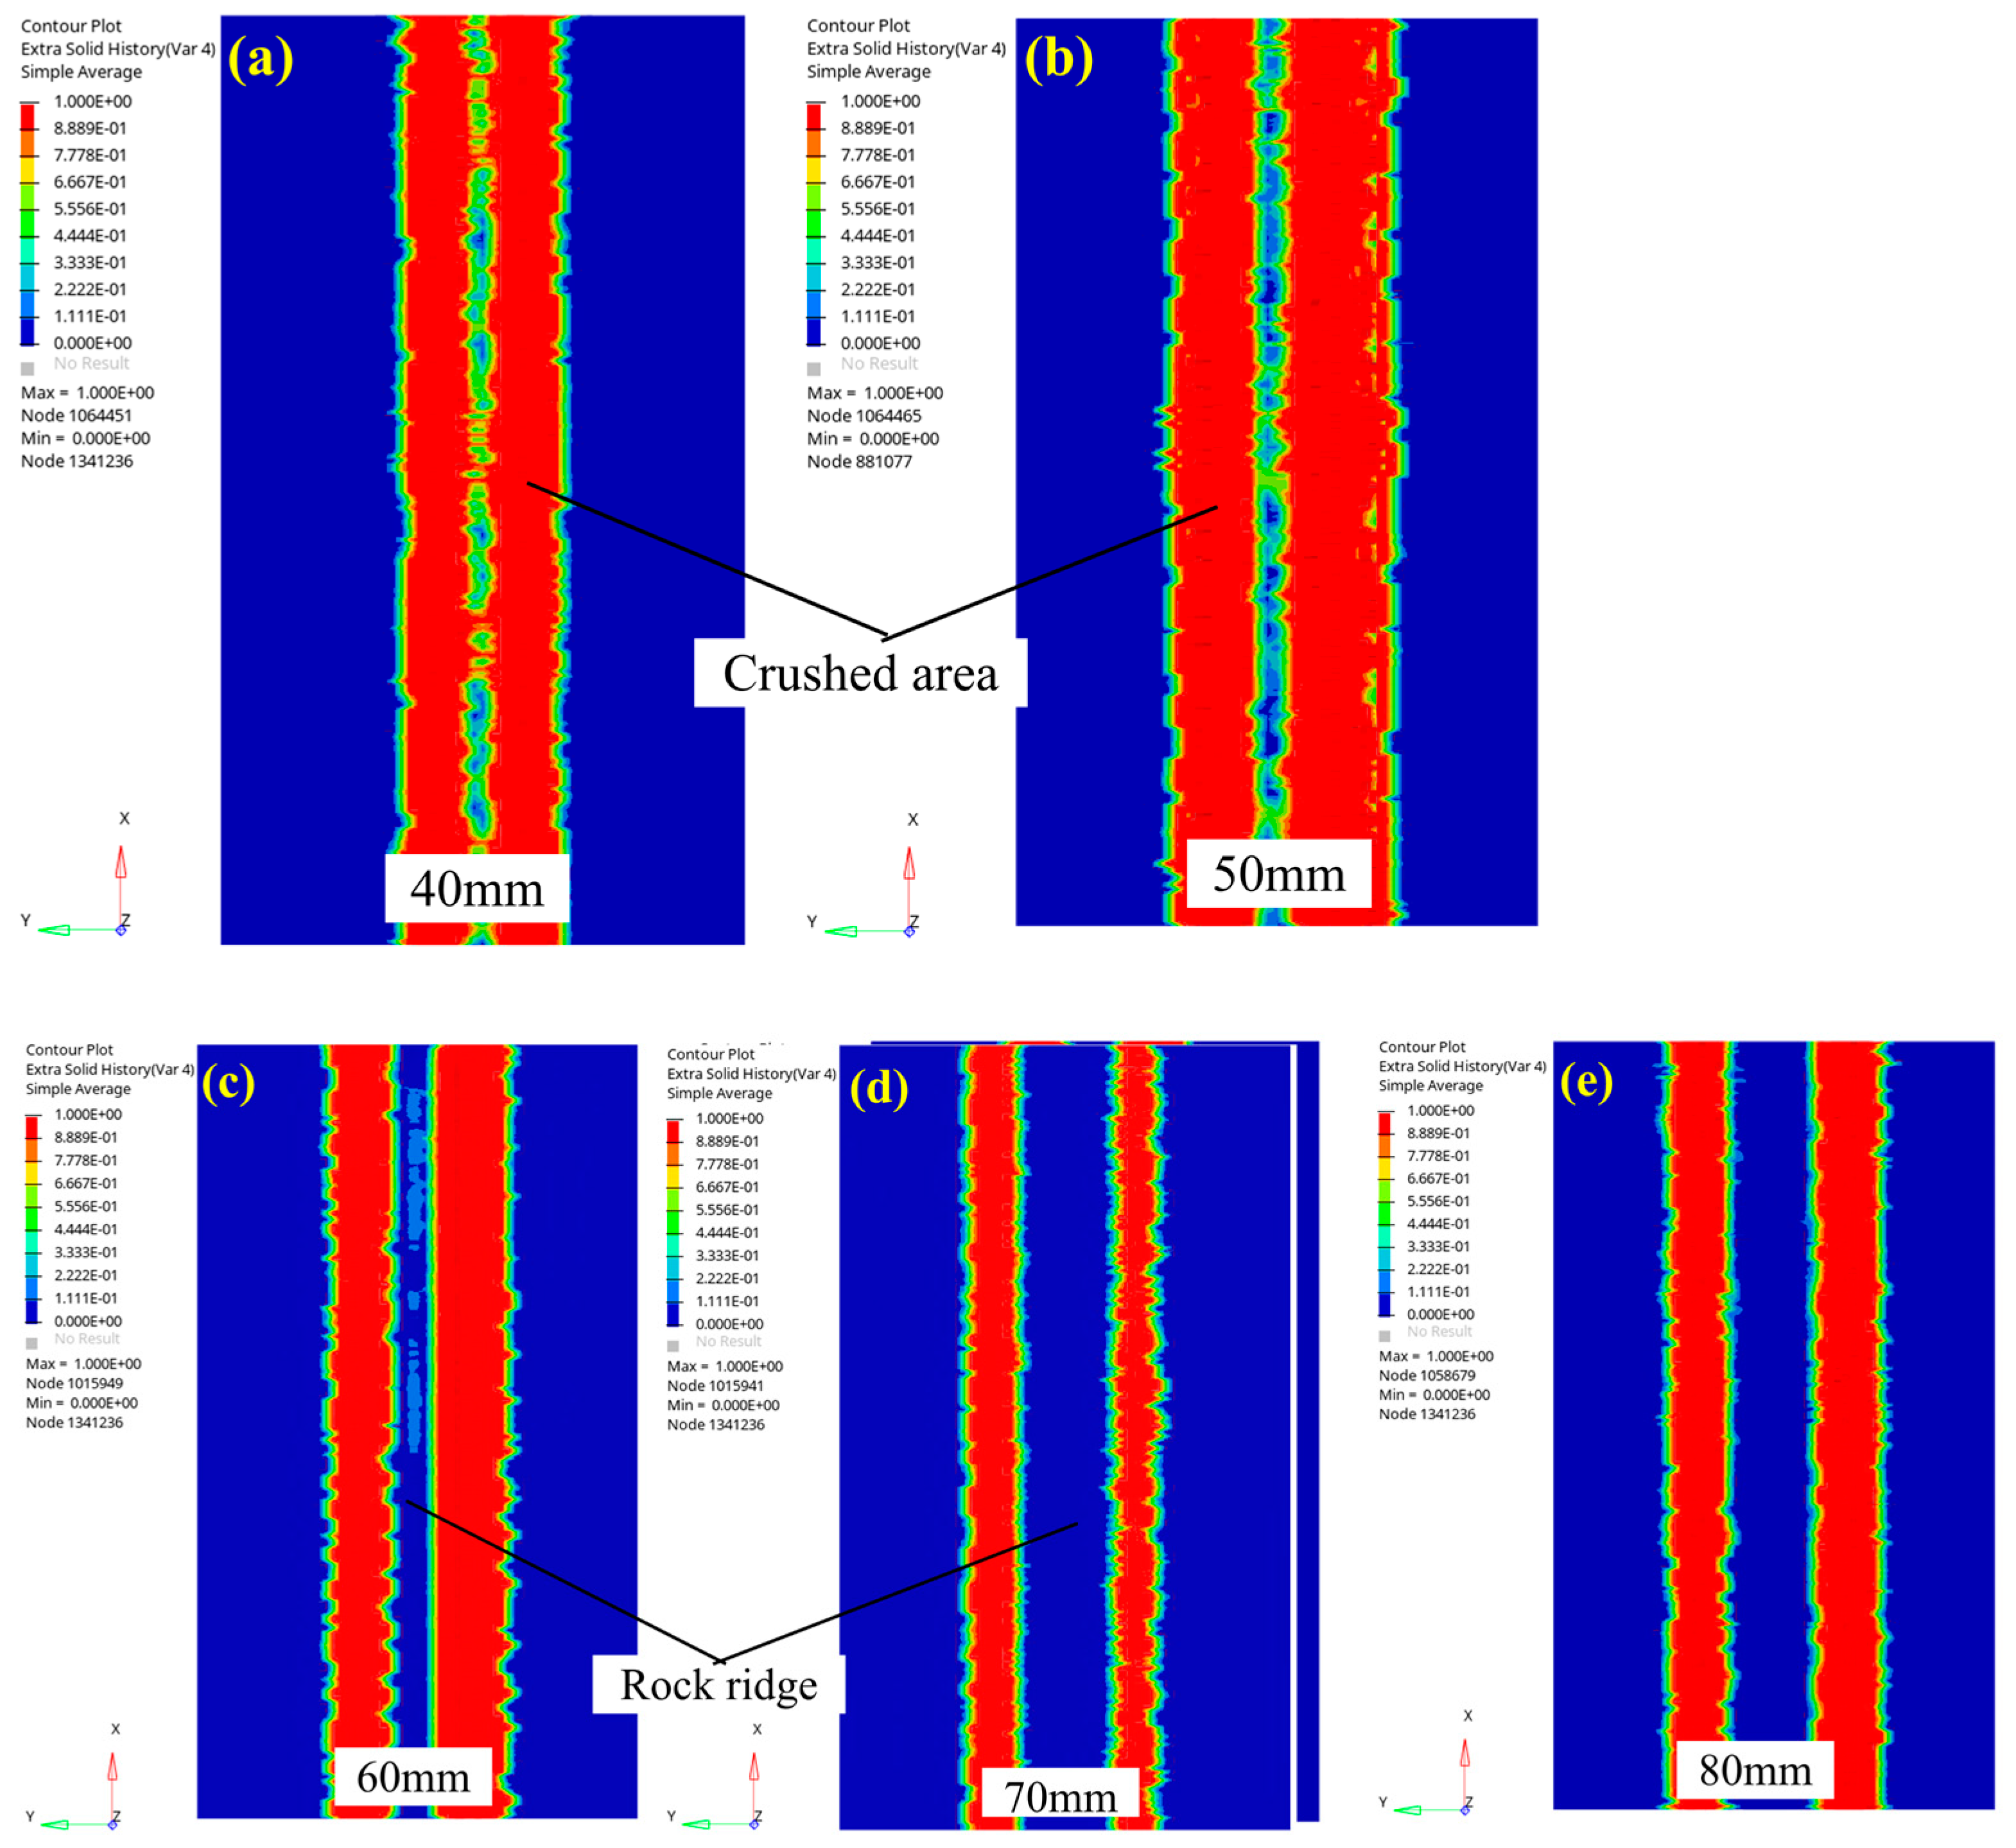
At a penetration of 4 mm, the crushing state of the rock surface is depicted in Figure 10. Figure 10a,b reveal an interconnected crushed area on the rock surface at cutter spacings of 40 mm and 50 mm, suggesting the crushing of the rock ridge by the two cutters. When the cutter spacing increased over 60 mm, the rock surface displayed two distinct crushed areas along with uncrushed rock ridges. Considering the analysis in Section 4.1, it can be concluded that, at the penetration of 4 mm, there existed a synergistic effect between the cutters under cutter spacings of 40 mm and 50 mm. This synergistic effect facilitated rock ridge crushing. However, with a further increase in cutter spacing, the synergistic effect weakened and may even have disappeared, leading to a failure in rock ridge crushing.
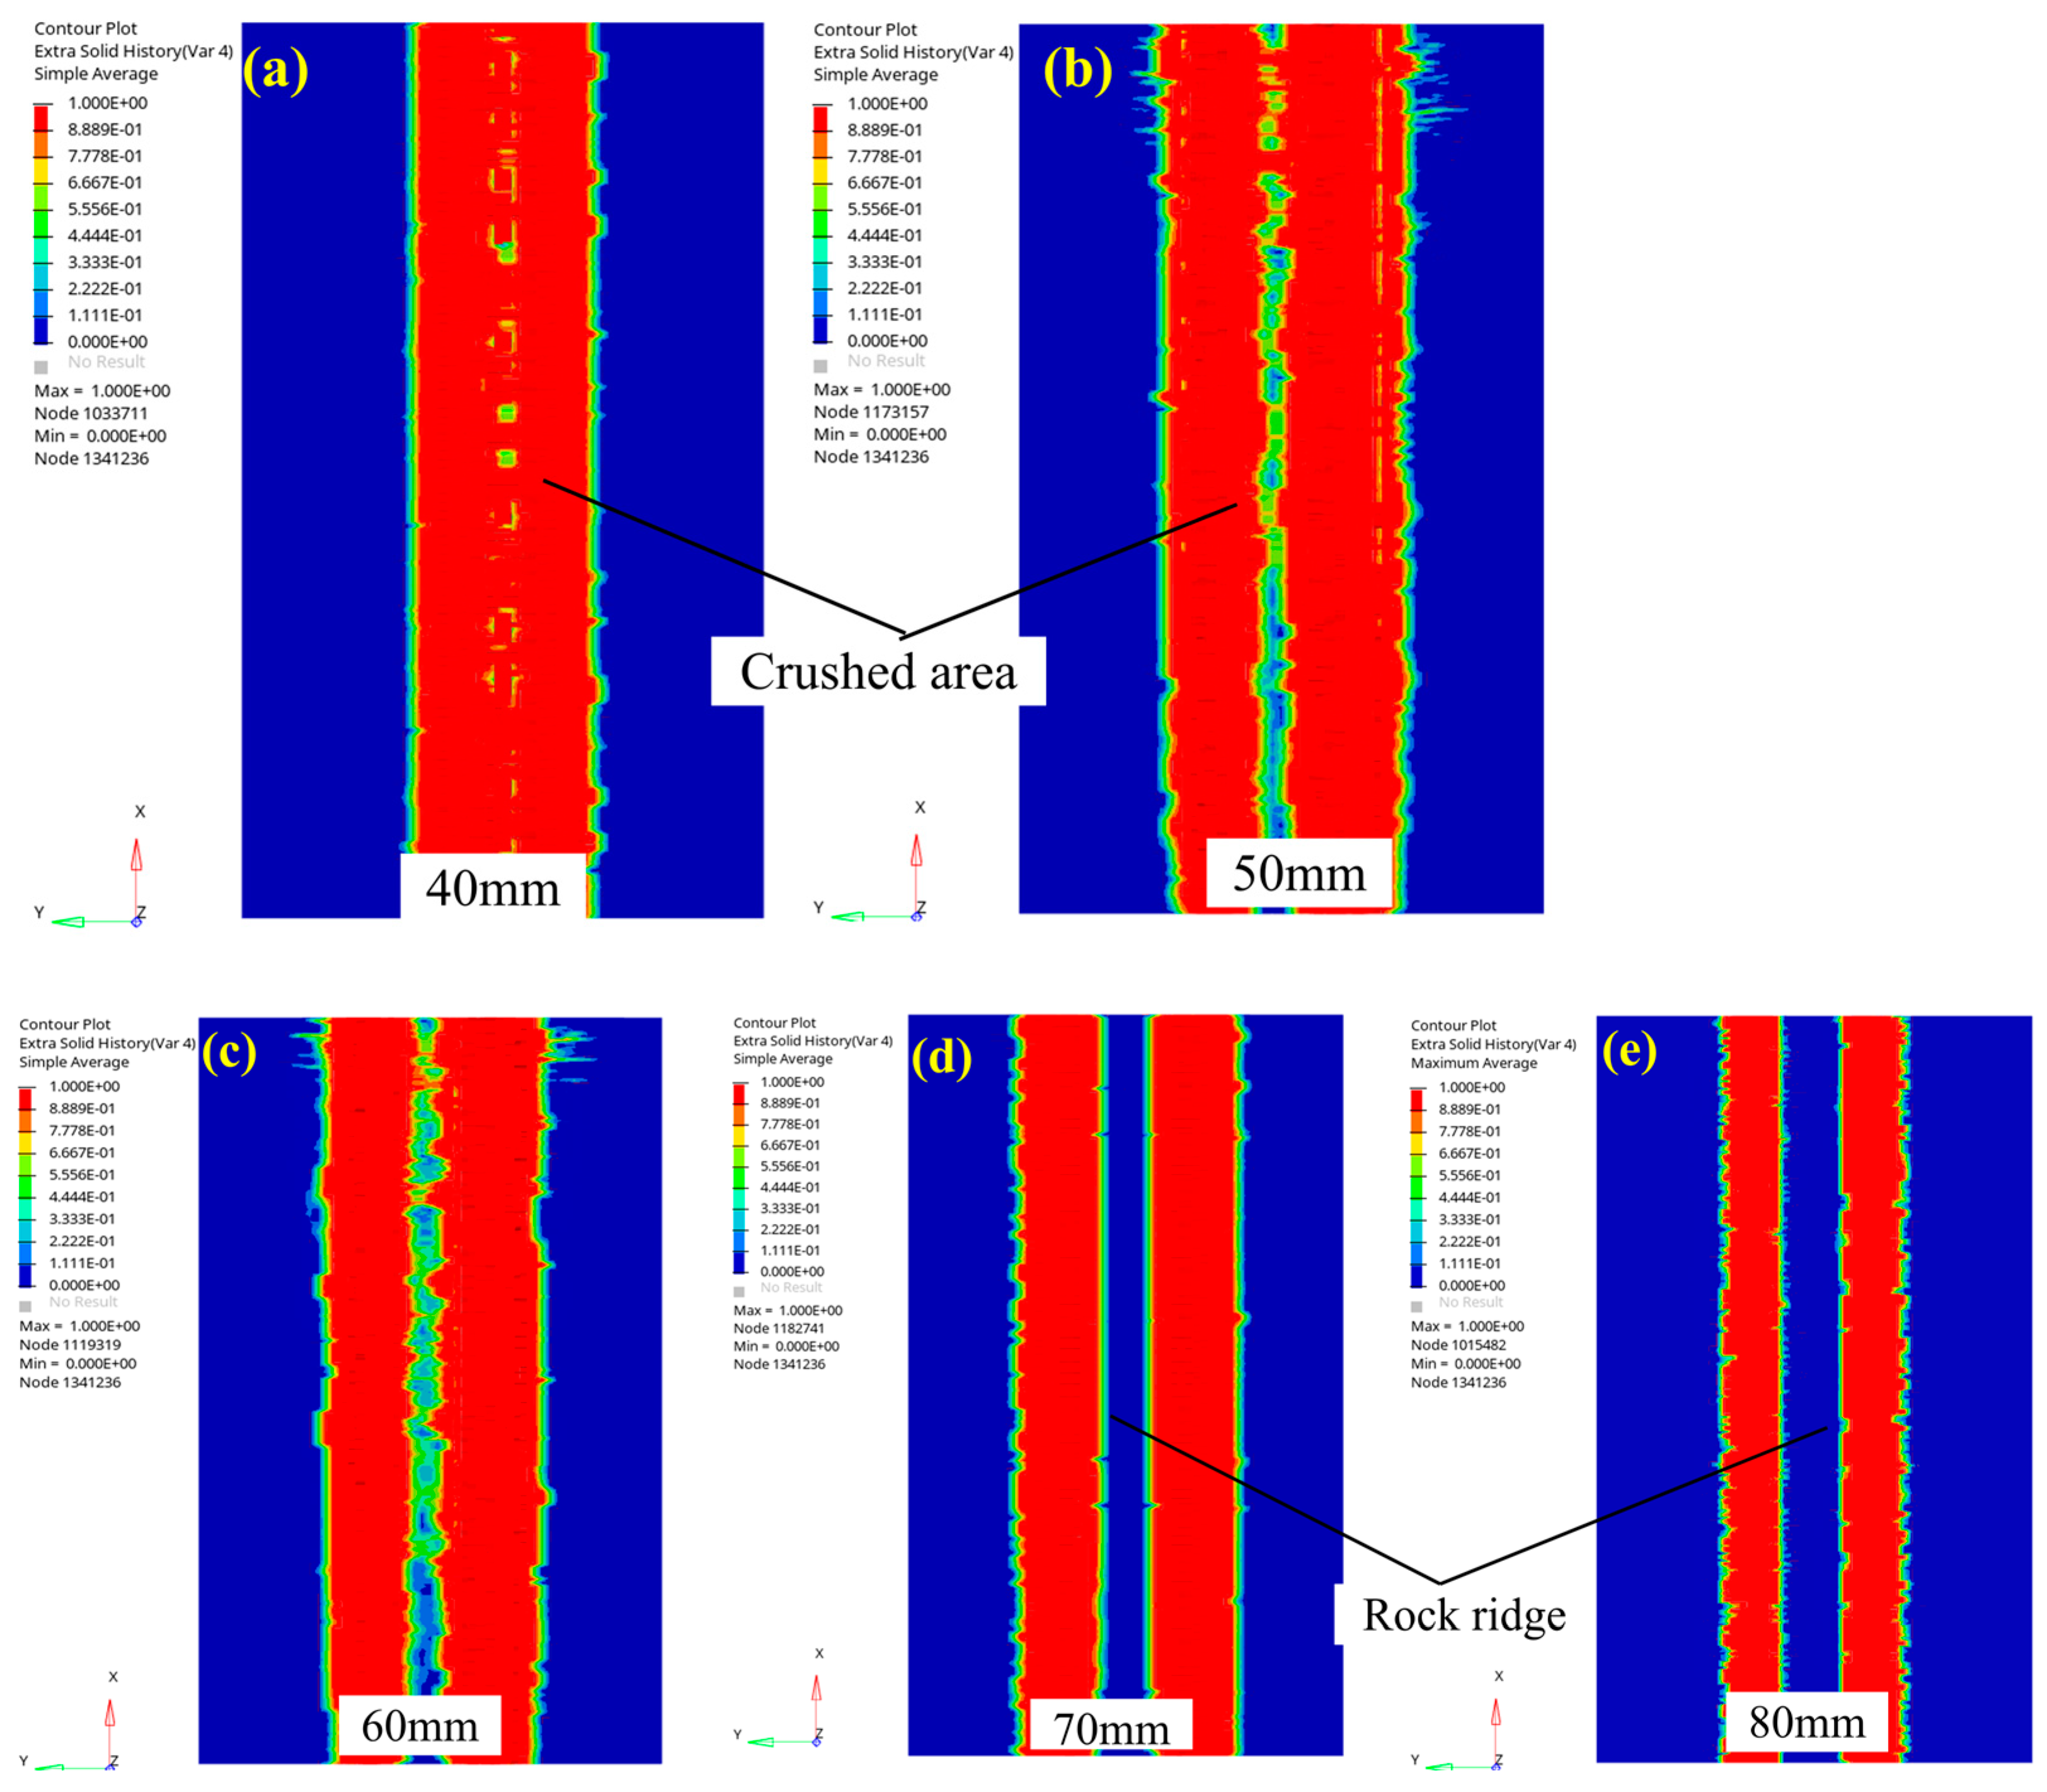
The crushing state on the rock surface when the penetration was 6 mm is illustrated in Figure 11. It is evident that a synergistic effect occurred between the two cutters when they were spaced at 40 mm, 50 mm, and 60 mm. Notably, in Figure 11a, the rock surface at the 40 mm position displays a strong synergistic effect, with the two adjacent crushed areas intersecting with each other and causing the intermediate rock ridge between two cutters to disappear. As the cutter spacing increased to 50 mm and 60 mm, as depicted in Figure 11b,c, the weakening of the synergistic effect between the cutters correlated with a gradual reduction in the level of rock ridge crushing. Moreover, as the cutter spacing reached over 70 mm, as demonstrated in Figure 11d,e, the absence of the synergistic effect prompted the appearance of two distinct crushed areas and undamaged rock ridges on the rock surface.
In summary, the degree of rock surface crushing was influenced by the penetration and cutter spacing. For instance, with a small penetration, such as 2 mm, there was an absence of synergy between two cutters at different cutter spacings in this paper. Under these cutting conditions, the two cutters acted independently to cut the rock, leading to a lack of interaction and inability to crush the rock surface. However, as the penetration increased to 4 mm and 6 mm, the synergistic effect between the cutters could effectively crush the rock surface given an appropriate cutter spacing. Notably, a smaller cutter spacing enhanced the synergistic effect and increased the degree of crushing.
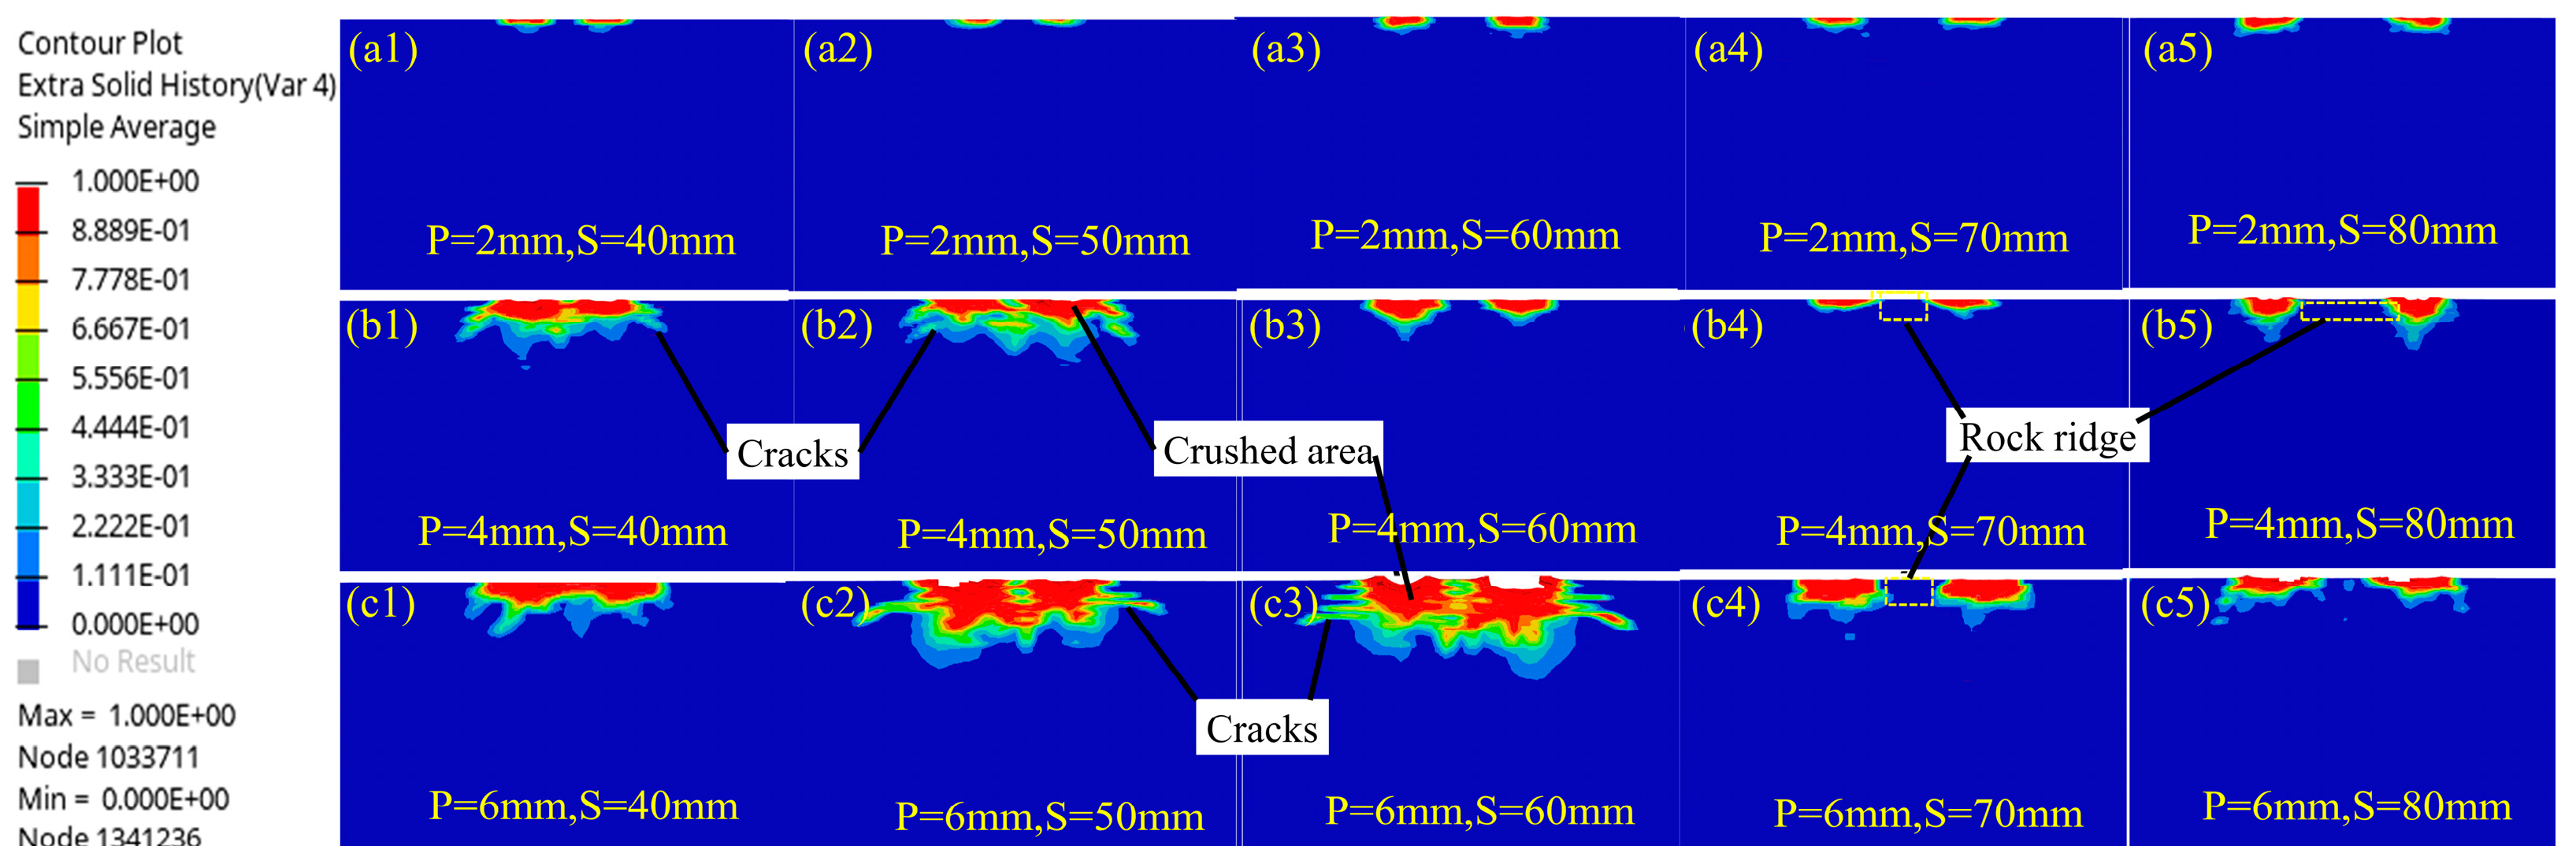
The crushing state inside the rock could be observed through a section cutting in the middle of the rock, where the cutter cut 200 mm, as shown in Figure 12. The variations in the crushing state with the cutter spacings under different penetrations are presented in Figure 13. When the penetration was 2 mm, the two crushed areas inside the rock were not connected and were independent of each other, which aligns with the observed phenomenon on the rock surface in Figure 9. On the other hand, under the 4 mm penetration condition, the two crushed areas inside the rock were connected with each other at cutter spacings of 40 mm and 50 mm, accompanied by the outward expansion of cracks, as exemplified in Figure 13(b1,b2). Similarly, the 6 mm penetration condition demonstrated analogous characteristics to the 4 mm penetration condition, with the two crushed areas being connected at the cutter spacings of 40 mm, 50 mm, and 60 mm, as depicted in Figure 13(c1–c3).
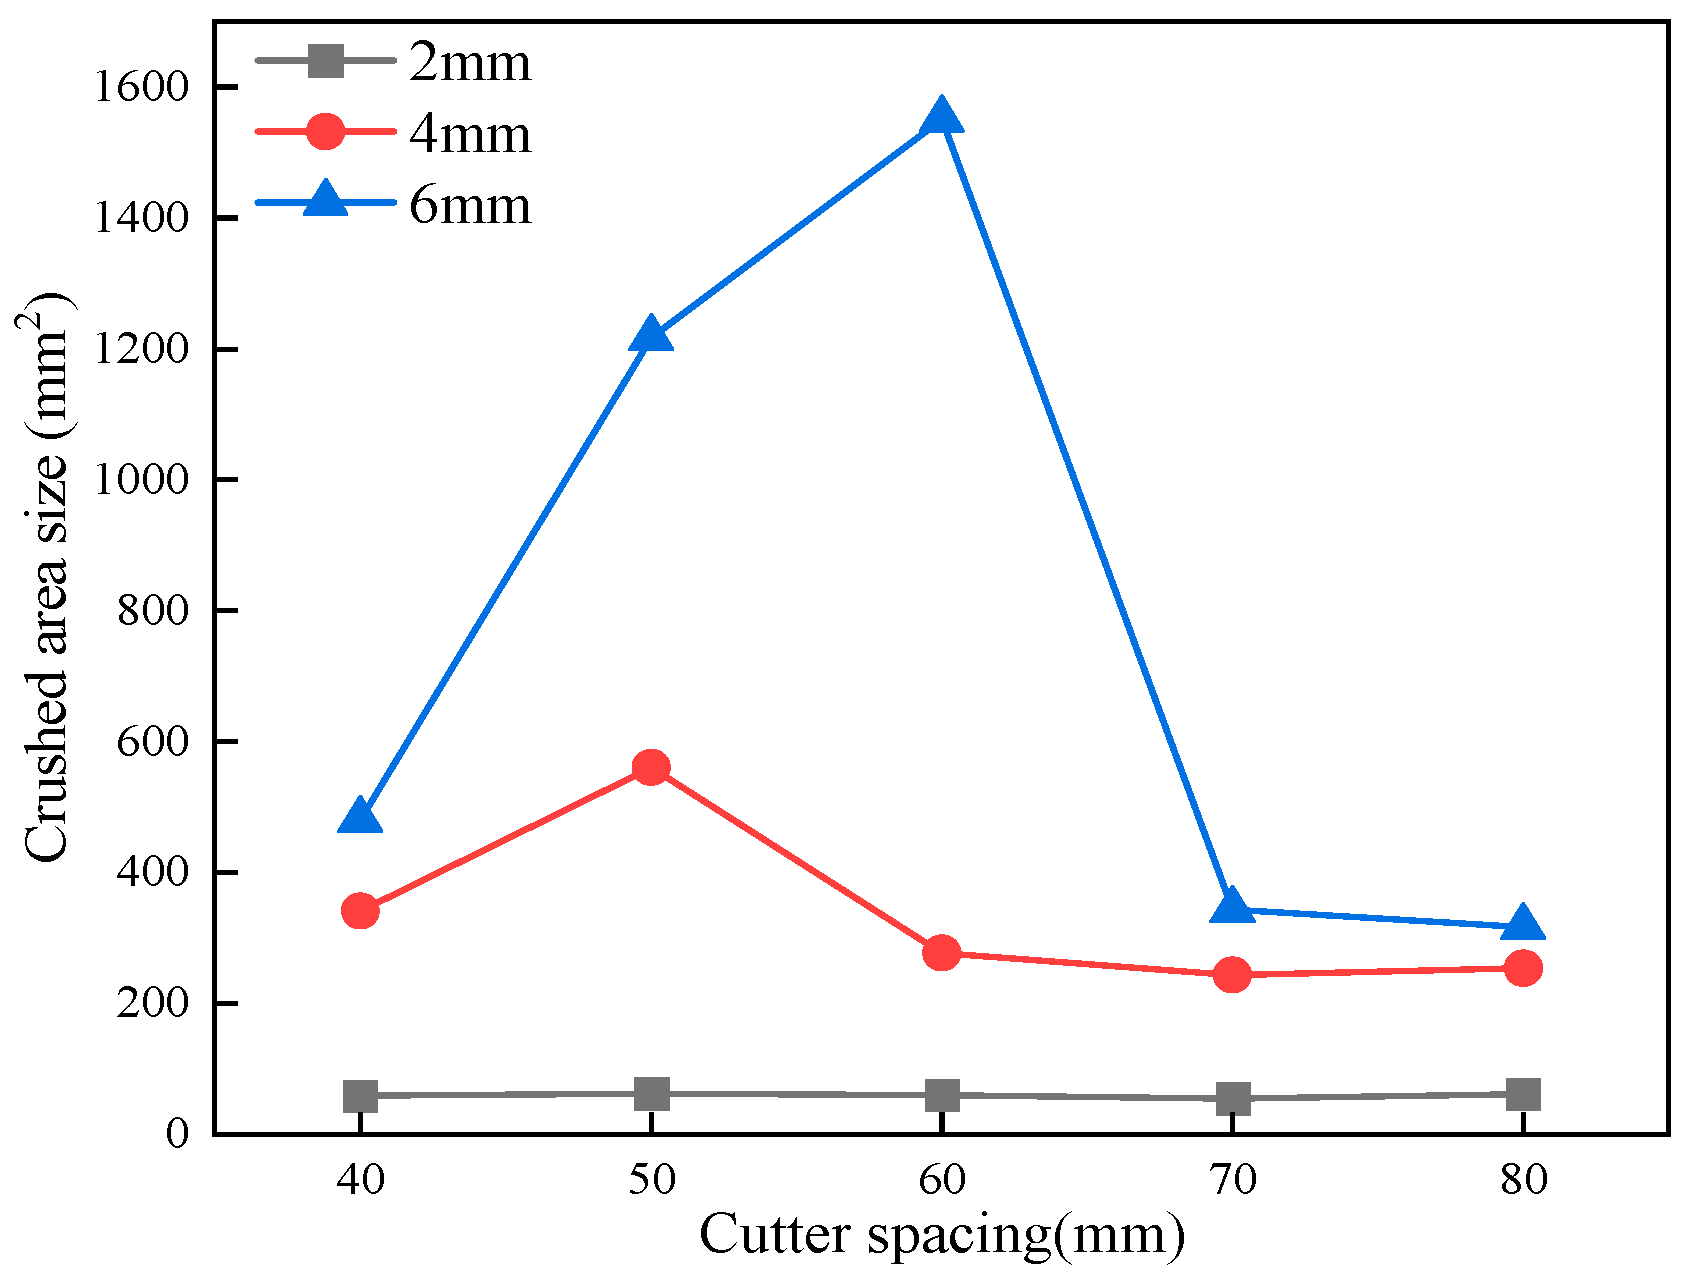
In order to visually understand the size characteristics of the crushed area, the crushed areas under different cutting parameters from Figure 13 are summarized in Figure 14. This reveals that the crushed area size was largest for penetration under 6 mm and smallest for penetration under 2 mm. Moreover, the crushing area size demonstrated an increasing trend with an increase in penetration. For instance, at a cutter spacing of 50 mm, as the penetration increased from 2 mm to 6 mm, the crushed area size escalated from 62.1 mm2 to 1216.8 mm2, leading to a nearly 19-fold increase. Notably, the crushing area size was also notably influenced by the cutter spacing when the penetration was consistent. At 2 mm penetration, the two cutters acted independently, resulting in similar crushing area sizes. At 4 mm penetration, the cutters exhibited a synergistic effect at cutter spacings of 40 mm and 50 mm, thereby crushing the rock ridge, leading to a substantial increase in the crushed area size from 340.8 mm2 to 560.4 mm2, an improvement of approximately 1.6 times. However, at a cutter spacing of 60 mm, the synergistic effect between the cutters diminished and the crushed area size decreased to 276.9 mm2 and stayed stable at around 270 mm2 with a further increase in the cutter spacing. When the penetration was 6 mm, the change trend in the crushed area was consistent with that of the 4 mm penetration, where the crushed area size substantially escalated from 480.1 mm2 to 1550.7 mm2 as the cutter spacing increased from 40 mm to 60 mm. When the cutter spacing was over 60 mm, the synergistic effect between two cutters disappeared, subsequent to which, the crushed area size rapidly decreased to 343.2 mm2 and stabilized.

4.3. Crushing Efficiency of Arcing-Blade Cutters

The specific energy (SE) refers to the energy required by the cutter to cut a unit volume of rock. A lower specific energy indicates a higher crushing efficiency of the cutter [25,26,27]. The calculation formula is as follows:
S E = F R · L V
where SE is the specific energy; FR is the rolling force; and V is the volume of the crushed rock.
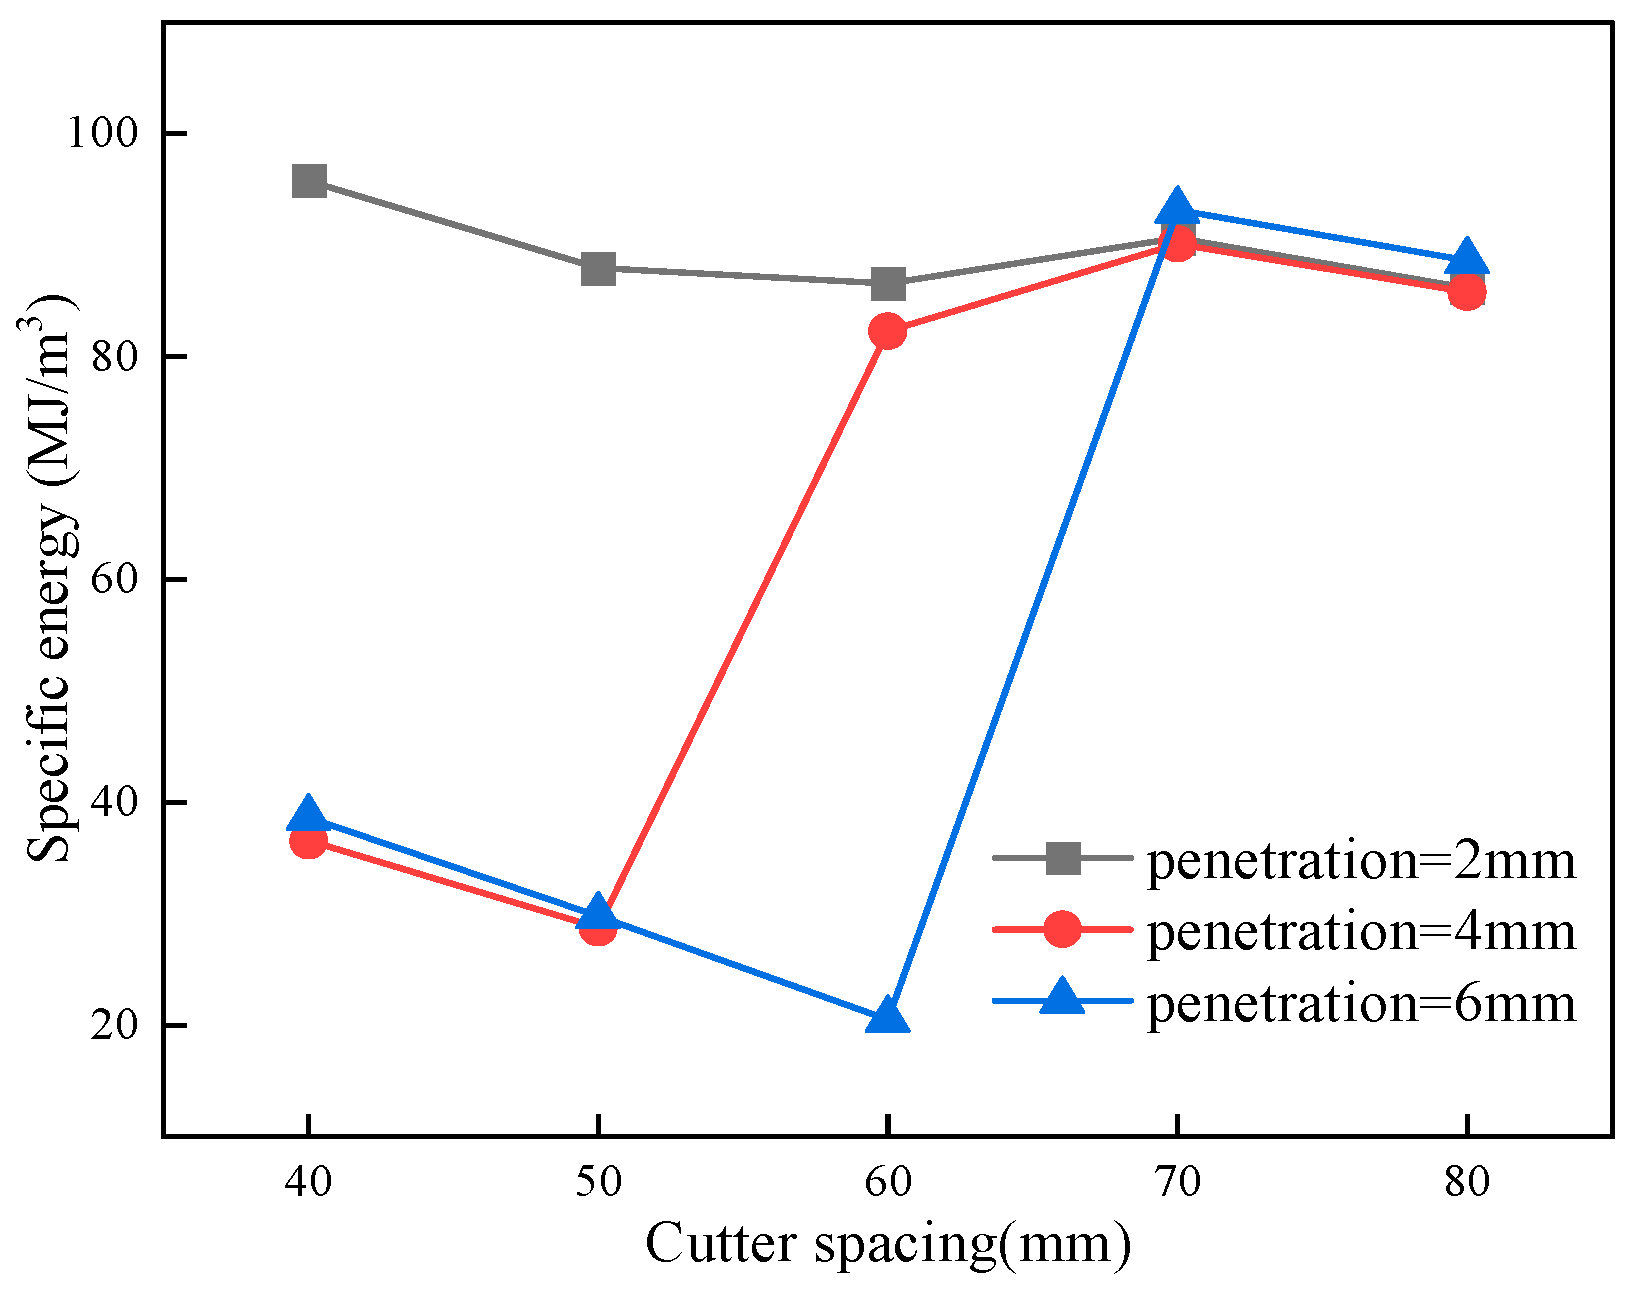
The variation in the specific energy with different cutting parameters when cutting the red sandstone is illustrated in Figure 15. Regardless of the type of penetration, the specific energy exhibited a decreasing trend followed by an increasing trend with an increase in the cutter spacing, and eventually stabilized. Notably, for the 4 mm and 6 mm penetrations, there was an optimal cutter spacing that yielded the lowest specific energy, referred to as the optimal cutter spacing, which corresponds to the highest crushing efficiency. For instance, with a 4 mm penetration, the specific energy decreased from 36.5 MJ/m3 to 28.7 MJ/m3 as the cutter spacing increased from 40 mm to 50 mm, reaching its minimum at a cutter spacing of 50 mm. Subsequently, the specific energy began to rise with further increases in the cutter spacing, stabilizing at the cutter spacing of 60 mm. Similarly, for a 6 mm penetration, the specific energy decreased from 32.1 MJ/m3 to 20.5 MJ/m3 as the cutter spacing increased from 40 mm to 60 mm, then increased to 93.1 MJ/m3 at 70 mm, after which, it stabilized. In contrast, for a penetration of 2 mm, the specific energy remained stable at approximately 86 MJ/m3 across various cutter spacings, without displaying the aforementioned trend.
This change trend can be explained by the crushing states under different cutting conditions. When the penetration was small, such as 2 mm, each arcing-blade cutter operated independently of the other, leading to a limited crushed area in the middle of the rock cross-section (Figure 14). Consequently, there was minimal change in the specific energy under different cutter spacings, resulting in a low rock-crushing efficiency. As the penetration increased to 4 mm, a synergy effect between the cutters was observed at cutter spacings of 40 mm and 50 mm (Figure 10a,b), with the synergy effect being stronger at 40 mm than at 50 mm. This resulted in excessive crushing of the rock ridges, subsequently leading to higher specific energy values at a 40 mm cutter spacing than those at a 50 mm cutter spacing. However, as the cutter spacing further increased, the synergy effect diminished and the rock ridges remained uncrushed (Figure 10c–e). This caused the specific energy to quickly reach a stable value, making the sequential cutting similar to a single cutting operation. Subsequently, with a further increase in penetration to 6 mm, a similar trend in specific energy as that with 4 mm penetration was observed. Notably, the specific energy reached its minimum value when the cutter spacing was 60 mm, signifying the highest crushing efficiency. This also indicates that, at cutter spacings 40 mm and 50 mm, the specific energy for 6 mm penetration was marginally higher than that for 4 mm penetration, owing to the excessive crushing of the rock ridges at these spacings. In summary, the most optimal cutter spacings under the conditions of 4 mm and 6 mm penetration were 50 mm and 60 mm, respectively. At these cutter spacings, the specific energy was the lowest, corresponding to the highest crushing efficiency.

5. Rock-Cutting Experiments with Arcing-Blade Cutter

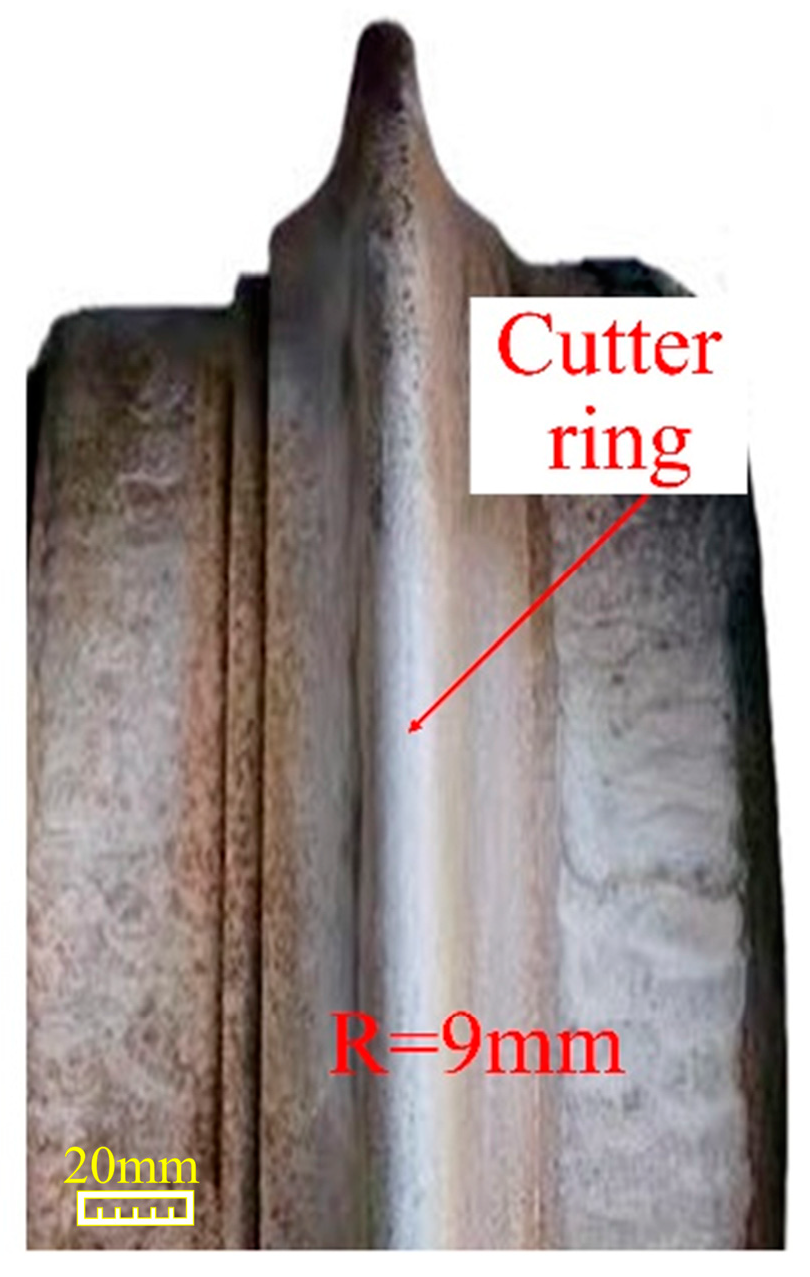
In order to verify the reliability of the simulation in this paper, linear cutting experiments were conducted with an arcing-blade cutter, and the rock crushing states under different cutter spacing were observed. The size of the arcing-blade cutter ring for the experiment was consistent with that for the simulation, as depicted in Figure 16. In these cutting experiments, the penetration was set at 2 mm and 4 mm, resulting in corresponding cutter spacings of 40 mm, 50 mm, 60 mm, and 70 mm. Subsequently, the crushing state of the rock surface was observed upon the completion of the cutting process.
Figure 17 illustrates the crushing state of the red sandstone caused by the sequential cutting of the arcing-blade cutter. Figure 17a,b present the crushing state of the rock surface with 2 mm and 4 mm penetration. When the penetration was 2 mm, the cutter left a “strip” crushed area on the rock surface, while the rock ridge between the cutters remained uncrushed. On the other hand, with a 4 mm penetration (as depicted in Figure 17b), the rock ridge was effectively crushed at cutter spacings 40 mm and 50 mm, as shown in Figure 17(b1,b2). Further analysis reveals that, at cutter spacings of 60 mm and 70 mm, as illustrated in Figure 17(b3,b4), the rock ridge between two cuts could not be effectively crushed, resulting in only two distinct “strip” crushed areas produced by the arcing-blade cutter. Compared with the rock crushing state from Section 4.2, it can be found that the crushing state observed from this experiment was similar to that observed in the simulation, confirming the reliability of the simulation results.
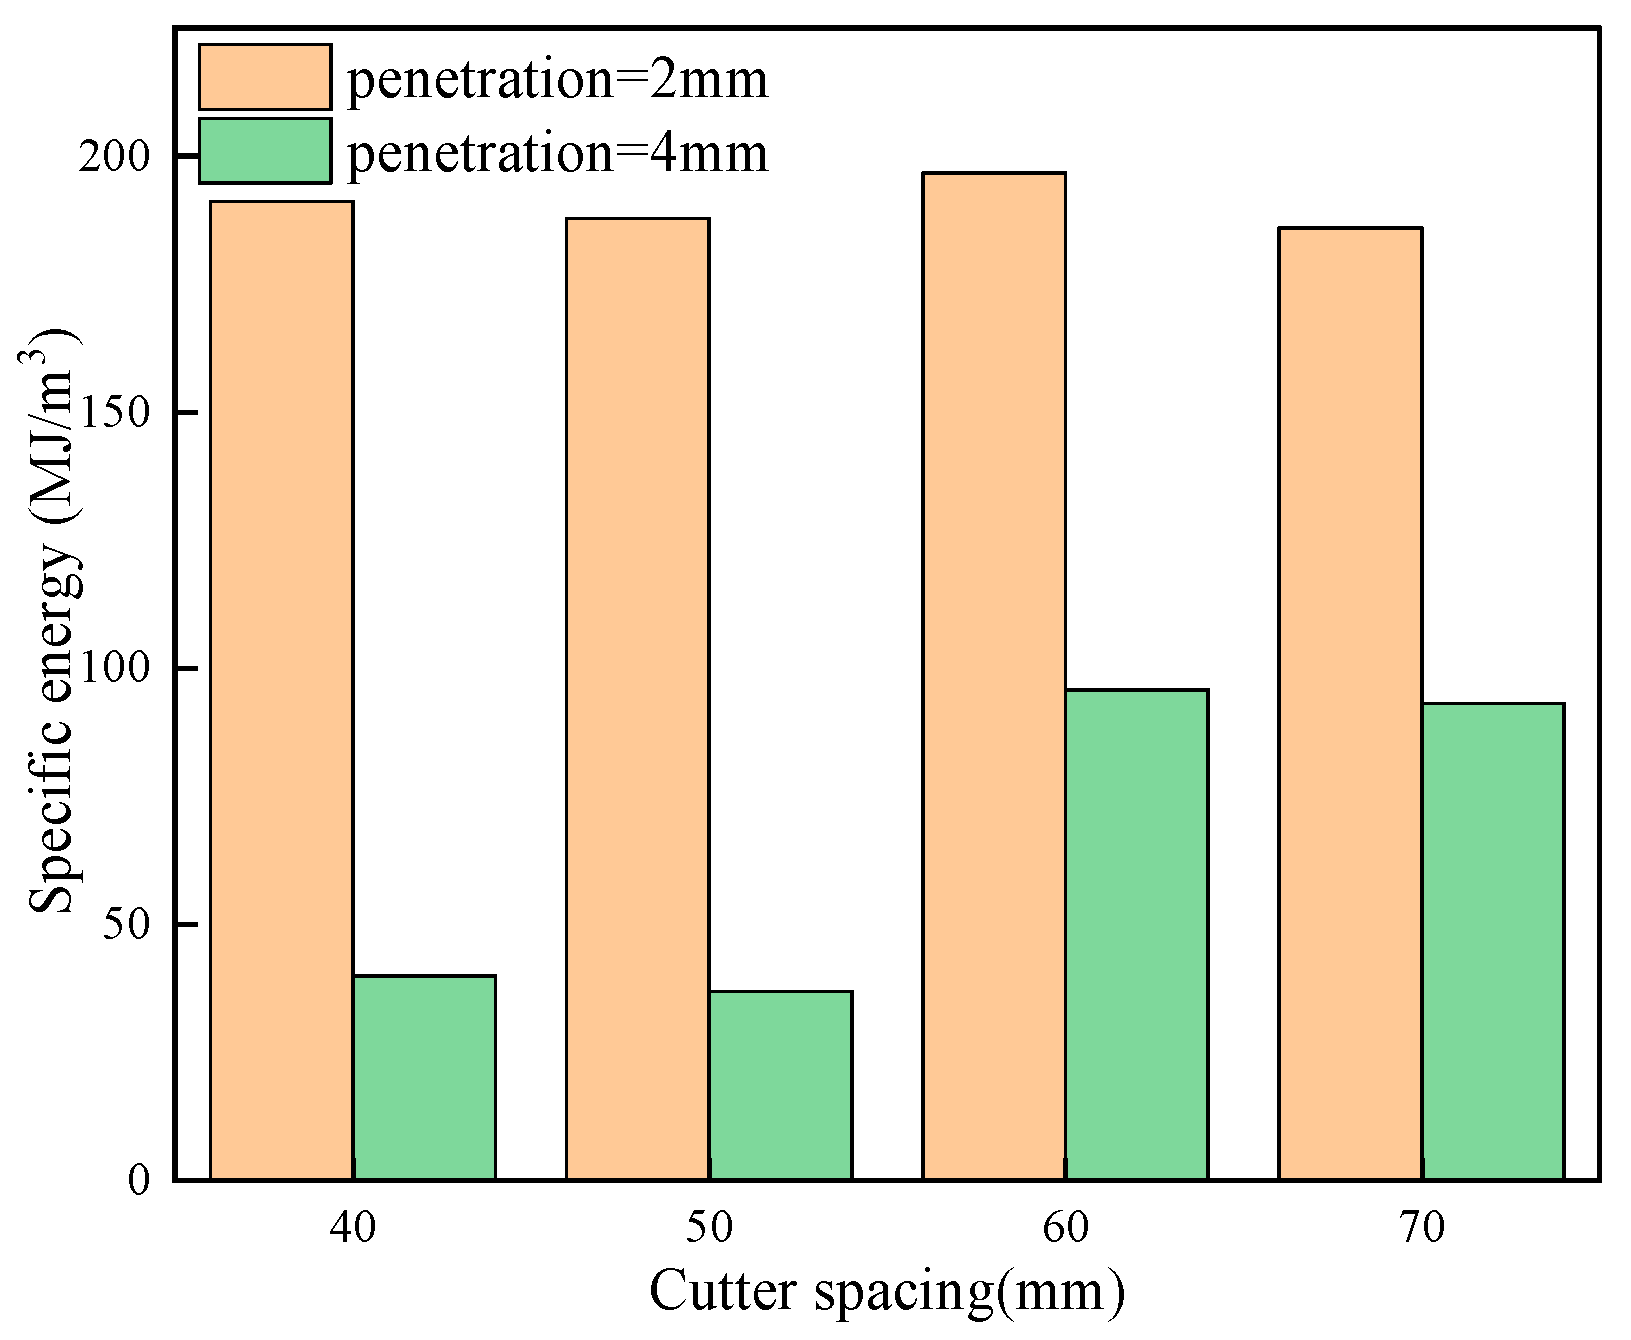
The specific energy in the cutting experiments under different cutting parameters is illustrated in Figure 18. At 2 mm penetration, the specific energy of the arcing-blade cutter remained consistently high, regardless of an increase in cutter spacing. This observation suggests a low crushing efficiency of the arcing-blade cutter at such a low penetration. However, at a penetration of 4 mm, the specific energy initially decreased, then rose before stabilizing. Based on the above observations, the variation trend of the specific energy of the arcing-blade cutter in the experiment is consistent with the simulation, further demonstrating the reliability of the simulation results.

6. Discussion

By calibrating the material parameters of the rock, the simulation results were matched with the uniaxial compression test. On this basis, a simulation model for cutting red sandstone with an arcing-blade cutter was established. Based on the above analysis, the rock-breaking load of the arcing-blade cutter exhibited fluctuation characteristics when cutting rock. The three-directional loads obtained from the simulations were compared with the maximum vertical force, followed by the rolling force and the minimum lateral force. At a penetration of 2 mm, the rock-breaking load of the arcing-blade cutter did not change with an increase in the cutter spacing. At penetrations of 4 mm and 6 mm, as the cutter spacing increased, the vertical force and rolling force showed a trend of first increasing and then maintaining stability, while the trend of the lateral force change was the opposite, showing a first decreasing trend and then maintaining stability around 0. The above explanation shows that there was a synergistic effect between the two arcing-blade cutters under the conditions of penetrations of 4 mm and 6 mm. The synergistic effect can promote rock crushing. However, this synergistic effect between the arcing-blade cutters will weaken or even disappear with an increase in cutter spacing. In addition, under the condition of a penetration of 2 mm, there was no synergistic effect between the two arcing-blade cutters, so the rock-breaking load did not change significantly.
The rock crushing state was closely related to the rock-breaking load. At a penetration of 2 mm, due to the inability of the arcing-blade cutters to synergistically break the rock, unbreakable rock ridges appeared at different cutter spacings in this paper. The crushed area generated by the two arcing blade cutters could not be effectively connected. Under the 4 mm and 6 mm penetrations, there existed a limit on the cutter spacing value, which connected the crushing area generated by the two arcing-blade cutters. The rock ridge was completely crushed. As the cutter spacing further increased beyond the limit value, the rock ridge could not be broken. The cutter spacing limit values at the 4 mm and 6 mm penetrations were about 50 mm and 60 mm, respectively.
In addition, the crushing efficiency of the arcing-blade cutter was related to the crushing state of the rock. At a penetration rate of 2 mm, the two arcing-blade cutters were unable to synergistically break the rock, resulting in a stable specific energy at any cutter spacing. However, at penetration rates of 4 mm and 6 mm, the specific energy showed a trend of first decreasing, then increasing, and finally maintaining stability as the cutter spacing increased. This indicates that the arcing-blade cutter had the highest crushing efficiency at the cutter spacings of 50 mm and 60 mm under the penetration rates of 4 mm and 6 mm. Interestingly, the experimental results from the liner cutting of the arcing-blade cutter also confirmed this conclusion. It shows that the simulations are reliable.

7. Conclusions

The rock-breaking characteristics of arcing-blade cutters under various cutting parameters using both finite element analysis and experimental methods were investigated in this paper. The study leads to the following conclusions:
(1)
At a penetration of 2 mm, the rock-breaking load of the cutter remained constant across three directions, regardless of the cutter spacing. However, when the penetration increased to 4 mm and 6 mm, the vertical and rolling force of the cutter initially rose with an increase in the cutter spacing before stabilizing. In contrast, the tangential force decreased at first and then stabilized with an increase in the cutter spacing.
(2)
When the penetration was 2 mm, two cutters performed sequential cutting without any synergy effect at different cutter spacings, resulting in a rock ridge formation between two sequential cuts. With a penetration of 4 mm, the rock ridge could be crushed under cutter spacings of 40 mm and 50 mm. Increasing the penetration to 6 mm allowed for the successful crushing of the rock ridge under cutter spacings of 40 mm, 50 mm, and 60 mm.
(3)
There was no significant difference in the specific energy among different cutter spacings at a 2 mm penetration, and it remained consistently high. However, for the penetrations of 4 mm and 6 mm, the specific energy initially decreased, then increased, and ultimately stabilized. The optimal cutter spacings were 50 mm and 60 mm, respectively, at the penetrations of 4 mm and 6 mm.
(4)
The change trend of the crushing state and specific energy under different cutting parameters observed from the experiments was consistent with that observed from the simulations, confirming the reliability of the simulation results.
(5)
The rock-breaking characteristics of the arcing-blade cutter are also related to other factors, such as rock types and the blade radii of the arcing-blade cutter. In the future, the impacts of different blade radii of the arcing-blade cutter and the rock types on rock-breaking characteristics will be studied.

Author Contributions

Conceptualization, Z.M.; methodology, Z.M. and J.Y.; software, Z.M.; validation, Z.M. and J.Y.; formal analysis, X.Z.; investigation, X.Z.; resources, J.Y.; data curation, X.Z.; writing—original draft preparation, Z.M.; writing—review and editing, X.Z.; visualization, W.Y.; supervision, J.Y.; project administration, W.Y.; funding acquisition, J.Y. All authors have read and agreed to the published version of the manuscript.

Funding

This work was supported by the National Natural Science Foundation of China under grant nos. 52175112.

Institutional Review Board Statement

Not applicable.

Informed Consent Statement

Not applicable.

Data Availability Statement

All data, models and codes that support the findings of this study are available from the corresponding author upon reasonable request. The data are not publicly available due to privacy restrictions.

Acknowledgments

The experimental operation process was supported by Dingbang Hu, Thanks for his help.

Conflicts of Interest

Authors Zhao Ma and Xin Zhang were employed by the company Shanxi Tiandi Coal Mining Machinery Co., Ltd. The remaining authors declare that the research was conducted in the absence of any commercial or financial relationships that could be construed as a potential conflict of interest.

References

  1. Rajati, M.; Rostami, J.; Memarian, H.; Hamzaban, M. A study on predicting the wear of TBM disc cutters using Cerchar testing. Tunn. Undergr. Space Technol. 2023, 140, 105290. [Google Scholar]
  2. Ates, U.; Copur, H. Investigation of parameters affecting vibration patterns generated during excavation by EPB TBMs. Tunn. Undergr. Space Technol. 2023, 138, 105185. [Google Scholar]
  3. Nilot, E.A.; Fang, G.; Elita Li, Y.; Tan, Y.Z.; Cheng, A. Real-time tunneling risk forecasting using vibrations from the working TBM. Tunn. Undergr. Space Technol. 2023, 139, 105213. [Google Scholar]
  4. Liu, B.; Yang, H.; Karekal, S. Reliability analysis of TBM disc cutters under different conditions. Undergr. Space 2021, 6, 142–152. [Google Scholar]
  5. Pan, Y.; Liu, Q.; Liu, Q.; Bo, Y.; Liu, J.; Peng, X.; Cai, T. Comparison and correlation between the laboratory, semi-theoretical and empirical methods in predicting the field excavation performance of tunnel boring machine (TBM). Acta Geotech. 2022, 17, 653–676. [Google Scholar]
  6. Farrokh, E. Optimum design of the peripheral cutters’ specification on the head profile for hard-rock TBMs. Tunn. Undergr. Space Technol. 2021, 107, 103668. [Google Scholar]
  7. Ning, B.; Xia, Y.; Lin, L.; Zhang, X.; He, Y.; Liu, Y. Experimental study on the adaptability of cutters with different blade widths under hard rock and extremely hard rock conditions. Acta Geotech. 2020, 15, 3283–3294. [Google Scholar]
  8. Liu, J.; Jiang, G.; Huang, Z.; Liu, T. An experimental and numerical study of sandstone fractures caused by modified and CCS cutters. Eng. Fract. Mech. 2022, 271, 108627. [Google Scholar]
  9. Balci, C.; Tumac, D. Investigation into the effects of different rocks on rock cuttability by a V-type disc cutter. Tunn. Undergr. Space Technol. 2012, 30, 183–193. [Google Scholar]
  10. Liu, J.; Chen, W.; Liu, T.; Peng, D. Stress evolution of rock breakages by a disc cutter assisted by pre-cuts. Arch. Civ. Mech. Eng. 2023, 23, 115. [Google Scholar]
  11. Hu, M.; Zhang, B.; Li, B.; Cao, W. Using discrete element method to study the rock breaking effect of worn tbm cutters. Geotech. Geol. Eng. 2022, 40, 2843–2856. [Google Scholar] [CrossRef]
  12. Wen, S.; Zhang, C. Experimental and simulation study on rock-breaking efficiency of disc cutters on composite rocks. Int. J. Rock Mech. Min. 2022, 153, 105089. [Google Scholar] [CrossRef]
  13. Li, T.; Zhang, Z.; Jia, C.; Liu, B.; Liu, Y.; Jiang, Y. Investigating the cutting force of disc cutter in multi-cutter rotary cutting of sandstone: Simulations and experiments. Int. J. Rock Mech. Min. 2022, 152, 105069. [Google Scholar] [CrossRef]
  14. Agrawal, A.K.; Chattopadhyaya, S.; Murthy, V.M.S.R. Delineation of cutter force and cutter wear in different edge configurations of disc cutters—An analysis using discrete element method. Eng. Fail. Anal. 2021, 129, 105727. [Google Scholar] [CrossRef]
  15. Comakli, R.; Balci, C.; Copur, H.; Tumac, D. Experimental studies using a new portable linear rock cutting machine and verification for disc cutters. Tunn. Undergr. Space Technol. 2021, 108, 103702. [Google Scholar] [CrossRef]
  16. Ayawah, P.E.A.; Kaba, A.G.A.; Gertsch, L.S. A novel approach for determining cutting geometry for TBM using full-scale laboratory linear rock cutting and PFC3D-based numerical simulations. Tunn. Undergr. Space Technol. 2024, 144, 105559. [Google Scholar] [CrossRef]
  17. Naghadehi, M.Z.; Mikaeil, R. Optimization of tunnel boring machine (TBM) disc cutter spacing in jointed hard rock using a distinct element numerical simulation. Period. Polytech. Civ. Eng. 2017, 1, 56–65. [Google Scholar] [CrossRef]
  18. Jiang, H.; Zhao, H.; Zhang, X.; Jiang, Y.; Zheng, Y. Comparative study of the rock-breaking mechanism of a disc cutter and wedge tooth cutter by discrete element modelling. Chin. J. Mech. Eng. 2023, 36, 70. [Google Scholar] [CrossRef]
  19. Zhang, Q.; Zhu, Y.; Du, C.; Du, S.; Shao, K.; Jin, Z.; Lei, M. Dynamic rock-breaking process of tbm disc cutters and response mechanism of rock mass based on discrete element. Adv. Civ. Eng. 2022, 2022, 1917836. [Google Scholar] [CrossRef]
  20. Duan, W.; Zhang, L.; Zhang, M.; Su, Y.; Mo, J.; Zhou, Z. Numerical and experimental studies on the effects of the TBM cutter profile on rock cutting. KSCE J. Civ. Eng. 2022, 26, 416–432. [Google Scholar] [CrossRef]
  21. Zhang, X.; Wu, J.; Hu, D.; He, M.; Xia, Y. Comparative study on rock breaking performances by arc and wedge TBM hob with two blades. Geotech. Geol. Eng. 2021, 39, 4581–4591. [Google Scholar] [CrossRef]
  22. Haeri, H.; Marji, M.F. Simulating the crack propagation and cracks coalescence underneath TBM disc cutters. Arab. J. Geosci. 2016, 9, 124. [Google Scholar] [CrossRef]
  23. Cho, J.; Jeon, S.; Yu, S.; Chang, S. Optimum spacing of TBM disc cutters: A numerical simulation using the three-dimensional dynamic fracturing method. Tunn. Undergr. Space Technol. 2010, 25, 230–244. [Google Scholar] [CrossRef]
  24. Zhang, X.; Tan, T.; Hu, D.; Li, M.; Lin, L.; Lin, S. Investigation of cutting rock by TBM hob using a SPG method. Period. Polytech. Civ. Eng. 2022, 4, 1133–1143. [Google Scholar] [CrossRef]
  25. Evans, I.; Pomeroy, C.D. The Strength, Fracture and Workability of Coal; Pergamon Press: Oxford, UK, 1966. [Google Scholar]
  26. Brînaș, I.; Andraș, A.; Radu, S.M.; Popescu, F.D.; Andraș, I.; Marc, B.I.; Cioclu, A.R. Determination of the bucket wheel drive power by computer modeling based on specific energy consumption and cutting geometry. Energies 2021, 14, 3892. [Google Scholar] [CrossRef]
  27. Teale, R. The concept of specific energy in rock drilling. Int. J. Rock Mech. Min. Sci. Geomech. Abstr. 1965, 2, 57–73. [Google Scholar] [CrossRef]
Figure 1. Two types of cutter: (a) flat-blade cutter and (b) arcing-blade cutter.
Applsci 14 01241 g001
Figure 2. Experimental and simulated phenomena in uniaxial compression test: (a) uniaxial compression experiment and (b) uniaxial compression simulation.
Applsci 14 01241 g002
Figure 3. Comparison of uniaxial compression data between experiment and simulation.
Applsci 14 01241 g003
Figure 4. Rock-cutting model of two arcing-blade cutters.
Applsci 14 01241 g004
Figure 5. Dimensions of the arcing-blade cutter.
Applsci 14 01241 g005
Figure 6. Three-way loads on the cutters.
Applsci 14 01241 g006
Figure 7. Three-directional loads: (a) vertical force; (b) rolling force; and (c) lateral force.
Applsci 14 01241 g007
Figure 8. The average values of three-directional loads: (a) vertical force; (b) rolling force; and (c) lateral force.
Applsci 14 01241 g008
Figure 9. Rock surface crushing state under 2 mm penetration with different cutter spacings: (a) 40 mm; (b) 50 mm; (c) 60 mm; (d) 70 mm; and (e) 80 mm.
Applsci 14 01241 g009aApplsci 14 01241 g009b
Figure 10. Rock surface crushing state under 4 mm penetration with different cutter spacings: (a) 40 mm; (b) 50 mm; (c) 60 mm; (d) 70 mm; and (e) 80 mm.
Applsci 14 01241 g010
Figure 11. Rock surface crushing state under 6 mm penetration with different cutter spacings: (a) 40 mm; (b) 50 mm; (c) 60 mm; (d) 70 mm; and (e) 80 mm.
Applsci 14 01241 g011
Figure 12. Section position in the middle of rock sample.
Applsci 14 01241 g012
Figure 13. Crushing state of the cross-section at the middle position of the rock, P denotes penetration and S denotes cutter spacing. (a1) P = 2 mm, S = 40 mm; (a2) P = 2 mm, S = 50 mm; (a3) P = 2 mm, S = 60 mm; (a4) P = 2 mm, S = 70 mm; (a5) P = 2 mm, S = 80 mm. (b1) P = 4 mm, S = 40 mm; (b2) P = 4 mm, S = 50 mm; (b3) P = 4 mm, S = 60 mm; (b4) P = 4 mm, S = 70 mm; (b5) P = 4 mm, S = 80 mm. (c1) P = 6 mm, S = 40 mm; (c2) P = 6 mm, S = 50 mm; (c3) P = 6 mm, S = 60 mm; (c4) P = 6 mm, S = 70 mm; and (c5) P = 6 mm, S = 80 mm.
Applsci 14 01241 g013
Figure 14. Statistics on crushed areas.
Applsci 14 01241 g014
Figure 15. Specific energy of rock crushing by arcing-blade cutter.
Applsci 14 01241 g015
Figure 16. Arcing-blade cutter for experiment.
Applsci 14 01241 g016
Figure 17. Crushing state of rock surface in experiments: (a) 2 mm penetration and (b) 4 mm penetration. (a1) P = 2 mm, S = 40 mm; (a2) P = 2 mm, S = 50 mm; (a3) P = 2 mm, S = 60 mm; (a4) P = 2 mm, S = 70 mm. (b1) P = 4 mm, S = 40 mm; (b2) P = 4 mm, S = 50 mm; (b3) P = 4 mm, S = 60 mm; (b4) P = 4 mm, S = 70 mm.
Applsci 14 01241 g017
Figure 18. Specific energy in experiments.
Applsci 14 01241 g018
Table 1. Rock mechanics parameters of experiment.
Rock TypeCompressive Strength/MPaTensile Strength/MPaDensity/kg m−3Elastic Modulus/GPa
Red sandstone71.84.72370.66.2
Disclaimer/Publisher’s Note: The statements, opinions and data contained in all publications are solely those of the individual author(s) and contributor(s) and not of MDPI and/or the editor(s). MDPI and/or the editor(s) disclaim responsibility for any injury to people or property resulting from any ideas, methods, instructions or products referred to in the content.