Article

Ensemble Learning-Based Coronary Artery Disease Detection Using Computer Tomography Images

by
Abdul Rahaman Wahab Sait
1,* and
Ali Mohammad Alorsan Bani Awad
2
1
Department of Documents and Archive, Center of Documents and Administrative Communication, King Faisal University, P.O. Box 400, Hofuf 31982, Al-Ahsa, Saudi Arabia
2
Center of Measurement and Evaluation, King Faisal University, P.O. Box 400, Hofuf 31982, Al-Ahsa, Saudi Arabia
*
Author to whom correspondence should be addressed.
Appl. Sci. 2024, 14(3), 1238; https://doi.org/10.3390/app14031238
Submission received: 8 January 2024 / Revised: 25 January 2024 / Accepted: 1 February 2024 / Published: 1 February 2024
(This article belongs to the Special Issue Artificial Intelligence Applications in Healthcare System)

Abstract

:
Coronary artery disease (CAD) is the most prevalent form of cardiovascular disease that may result in myocardial infarction. Annually, it leads to millions of fatalities and causes billions of dollars in global economic losses. Limited resources and complexities in interpreting results pose challenges to healthcare centers in implementing deep learning (DL)-based CAD detection models. Ensemble learning (EL) allows developers to build an effective CAD detection model by integrating the outcomes of multiple medical imaging models. In this study, the authors build an EL-based CAD detection model to identify CAD from coronary computer tomography angiography (CCTA) images. They employ a feature engineering technique, including MobileNet V3, CatBoost, and LightGBM models. A random forest (RF) classifier is used to ensemble the outcomes of the CatBoost and LightGBM models. The authors generalize the model using two benchmark datasets. The proposed model achieved an accuracy of 99.7% and 99.6% with limited computational resources. The generalization results highlight the importance of the proposed model’s efficiency in identifying CAD from the CCTA images. Healthcare centers and cardiologists can benefit from the proposed model to identify CAD in the initial stages. The proposed feature engineering can be extended using a liquid neural network model to reduce computational resources.

1. Introduction

CAD is a form of cardiovascular disease that increases global mortality [1]. Hardening and narrowing coronary arteries reduces blood flow to the heart chambers [2,3]. Early diagnosis can impede disease development and support healthcare centers in treating patients effectively [4]. CAD treatment options are based on the severity level of the disease [5]. Large-scale population screening using image-based detection technologies may be expensive, especially in developing countries [6,7,8,9]. Due to these challenges, researchers consider non-invasive, cost-effective, rapid, and dependable methods to identify the disease in the initial stages [10].
In order to detect CAD, medical professionals use a variety of imaging techniques to inspect the heart, blood arteries, and tissues [11]. Stress testing can evaluate the cardiovascular system’s capacity to resist physical stress by imaging and monitoring its electrical activity in response to exercise and drugs [12]. It may detect cardiac blood circulation issues. Nuclear stress tests measure blood circulation using radioactive tracers, whereas stress echocardiography measures heart function with ultrasound [13]. Acoustic waves are used in echocardiography to visualize the heart’s anatomy and function. This approach may assist healthcare centers in identifying cardiac functionality, valve abnormalities, and regional wall motion anomalies [13]. Coronary angiography involves injecting contrast dye into the coronary arteries while performing X-ray imaging to measure blood flow and blockages [13]. It is used to identify coronary syndrome patients. Angiography is the standard intrusive procedure for determining CAD, which may harm the patient [14]. It allows cardiologists to examine blood artery issues, including stenosis, plaque, and obstruction [15]. Using their experience, cardiologists diagnose CAD and select treatment choices. This straightforward method requires optimal accuracy, objectivity, and consistency [16]. Evidence suggests automated systems may reduce human errors in CAD identification [17].
Coronary artery stenosis or atherosclerotic blockage may be observed using the high-resolution images [17]. A computed tomography (CT) scan is extremely adaptable. It can detect chronic cardiovascular diseases, cancers, and severe injuries [18]. CCTA is a non-invasive medical treatment that employs CT to provide comprehensive images of the coronary arteries [18]. It visualizes the anatomy of coronary arteries and plaque, stenosis, and other abnormalities. In addition, it is highly beneficial in ensuring the existence of CAD [19]. CT and CCTA are sophisticated imaging techniques to visualize intricate cross-sectional images [20]. These imaging techniques are crucial in assisting clinicians in diagnosing cardiac diseases. To assist cardiologists in detecting plaque and stenosis, blood vessels may be retrieved using image segmentation techniques [20]. These technologies improve prediction accuracy and treatments and provide follow-up care for individuals with cardiovascular diseases.
Convolutional neural network (CNN) models are based on deep learning (DL) techniques [21]. The critical features of CAD can be extracted using the pre-trained CNN models. These models can analyze complex images and produce an optimal outcome. Transfer learning characteristics of DL techniques can be used in medical imaging for anomaly detection, size, and diagnosis [21]. Medical imaging applications employ the CNN models for identifying organs, tumors, and additional anatomical characteristics. CNN models can evaluate three-dimensional (3D) medical images, including CT scans and magnetic resonance imaging volumes [22]. 3D CNN models can capture spatial relationships, making them ideal for volumetric medical data analysis. DL-based medical image analysis models show potential in automated radiography, CT, and mammography anomaly identification and categorization. To generalize across multiple contexts, DL-based CAD identification models demand an extensive amount of labeled training data [22]. CNN models typically analyze small portions of a CCTA image and lack an adequate understanding of the underlying context [22]. In significant medical scenarios, uncertainty assessment is crucial. The model’s ability to reinforce and magnify biases in the training data raises ethical concerns, specifically when applied to populations with varying levels of diversity [23,24,25]. EL combines predictions from models trained on diverse datasets to reduce class imbalances [26]. This helps in avoiding the majority class’s dominance in predictions. Interpretability may be improved by combining the outcomes of the simpler and more complex models. Uncertainty is intrinsically measured by ensemble models [26]. The capability of EL-based models to address the limitations and uncertainties of individual models makes them a beneficial technique for healthcare applications. Across different datasets and environments, ensembles frequently deliver higher levels of performance [26]. The ability to offer dependable and consistent outcomes is significant in medical applications. It is possible to reduce the impact of biases in individual models by using ensemble approaches. In order to generate an evenly distributed CAD detection system, it is recommended to use ensembles with diverse biases, as individual models may have a bias toward certain kinds of data [27].
In recent times, researchers have used EL to build effective and reliable medical image classifiers. Zhang et al. [26] developed an EL-based CAD detection model using echocardiography. The authors [27] proposed a model based on the EL technique for detecting CAD. Alothman et al. [28] proposed a model to detect CAD using CCTA images. In study [29], the authors proposed a CNN-based CAD detection model. Han et al. [30] built an assessment model using the CCTA images. Chen et al. [31] proposed a vascular extraction and stenosis detection model using the DL technique. Papandrianos et al. [32] employed a DL technique for automating CAD detection. Pan et al. [33] applied a U-Net model for segmenting the coronary arteries from the CCTA images. Zeleznik et al. [34] built a model for predicting cardiovascular risk using a deep CNN model. Huang et al. [35] developed a reporting system in order to predict CAD. They employed pre-trained models to extract the crucial features. Moon et al. [36] employed a CNN model to identify CAD. However, training and maintaining multiple models may be computationally expensive, especially when dealing with massive datasets [37]. The efficiency of EL-based models may be influenced by mislabeled or extremely noisy data. In comparison to individual models, ensemble models demand extensive training periods. There is a lack of a CAD detection model that can operate with limited processing power and storage space. In addition, a resource-constrained CAD detection model can be integrated with modern medical diagnostics and accelerate early identification. Therefore, the authors intend to build an EL-based detection model to detect CAD with limited resources.
The contributions of the proposed study are as follows:
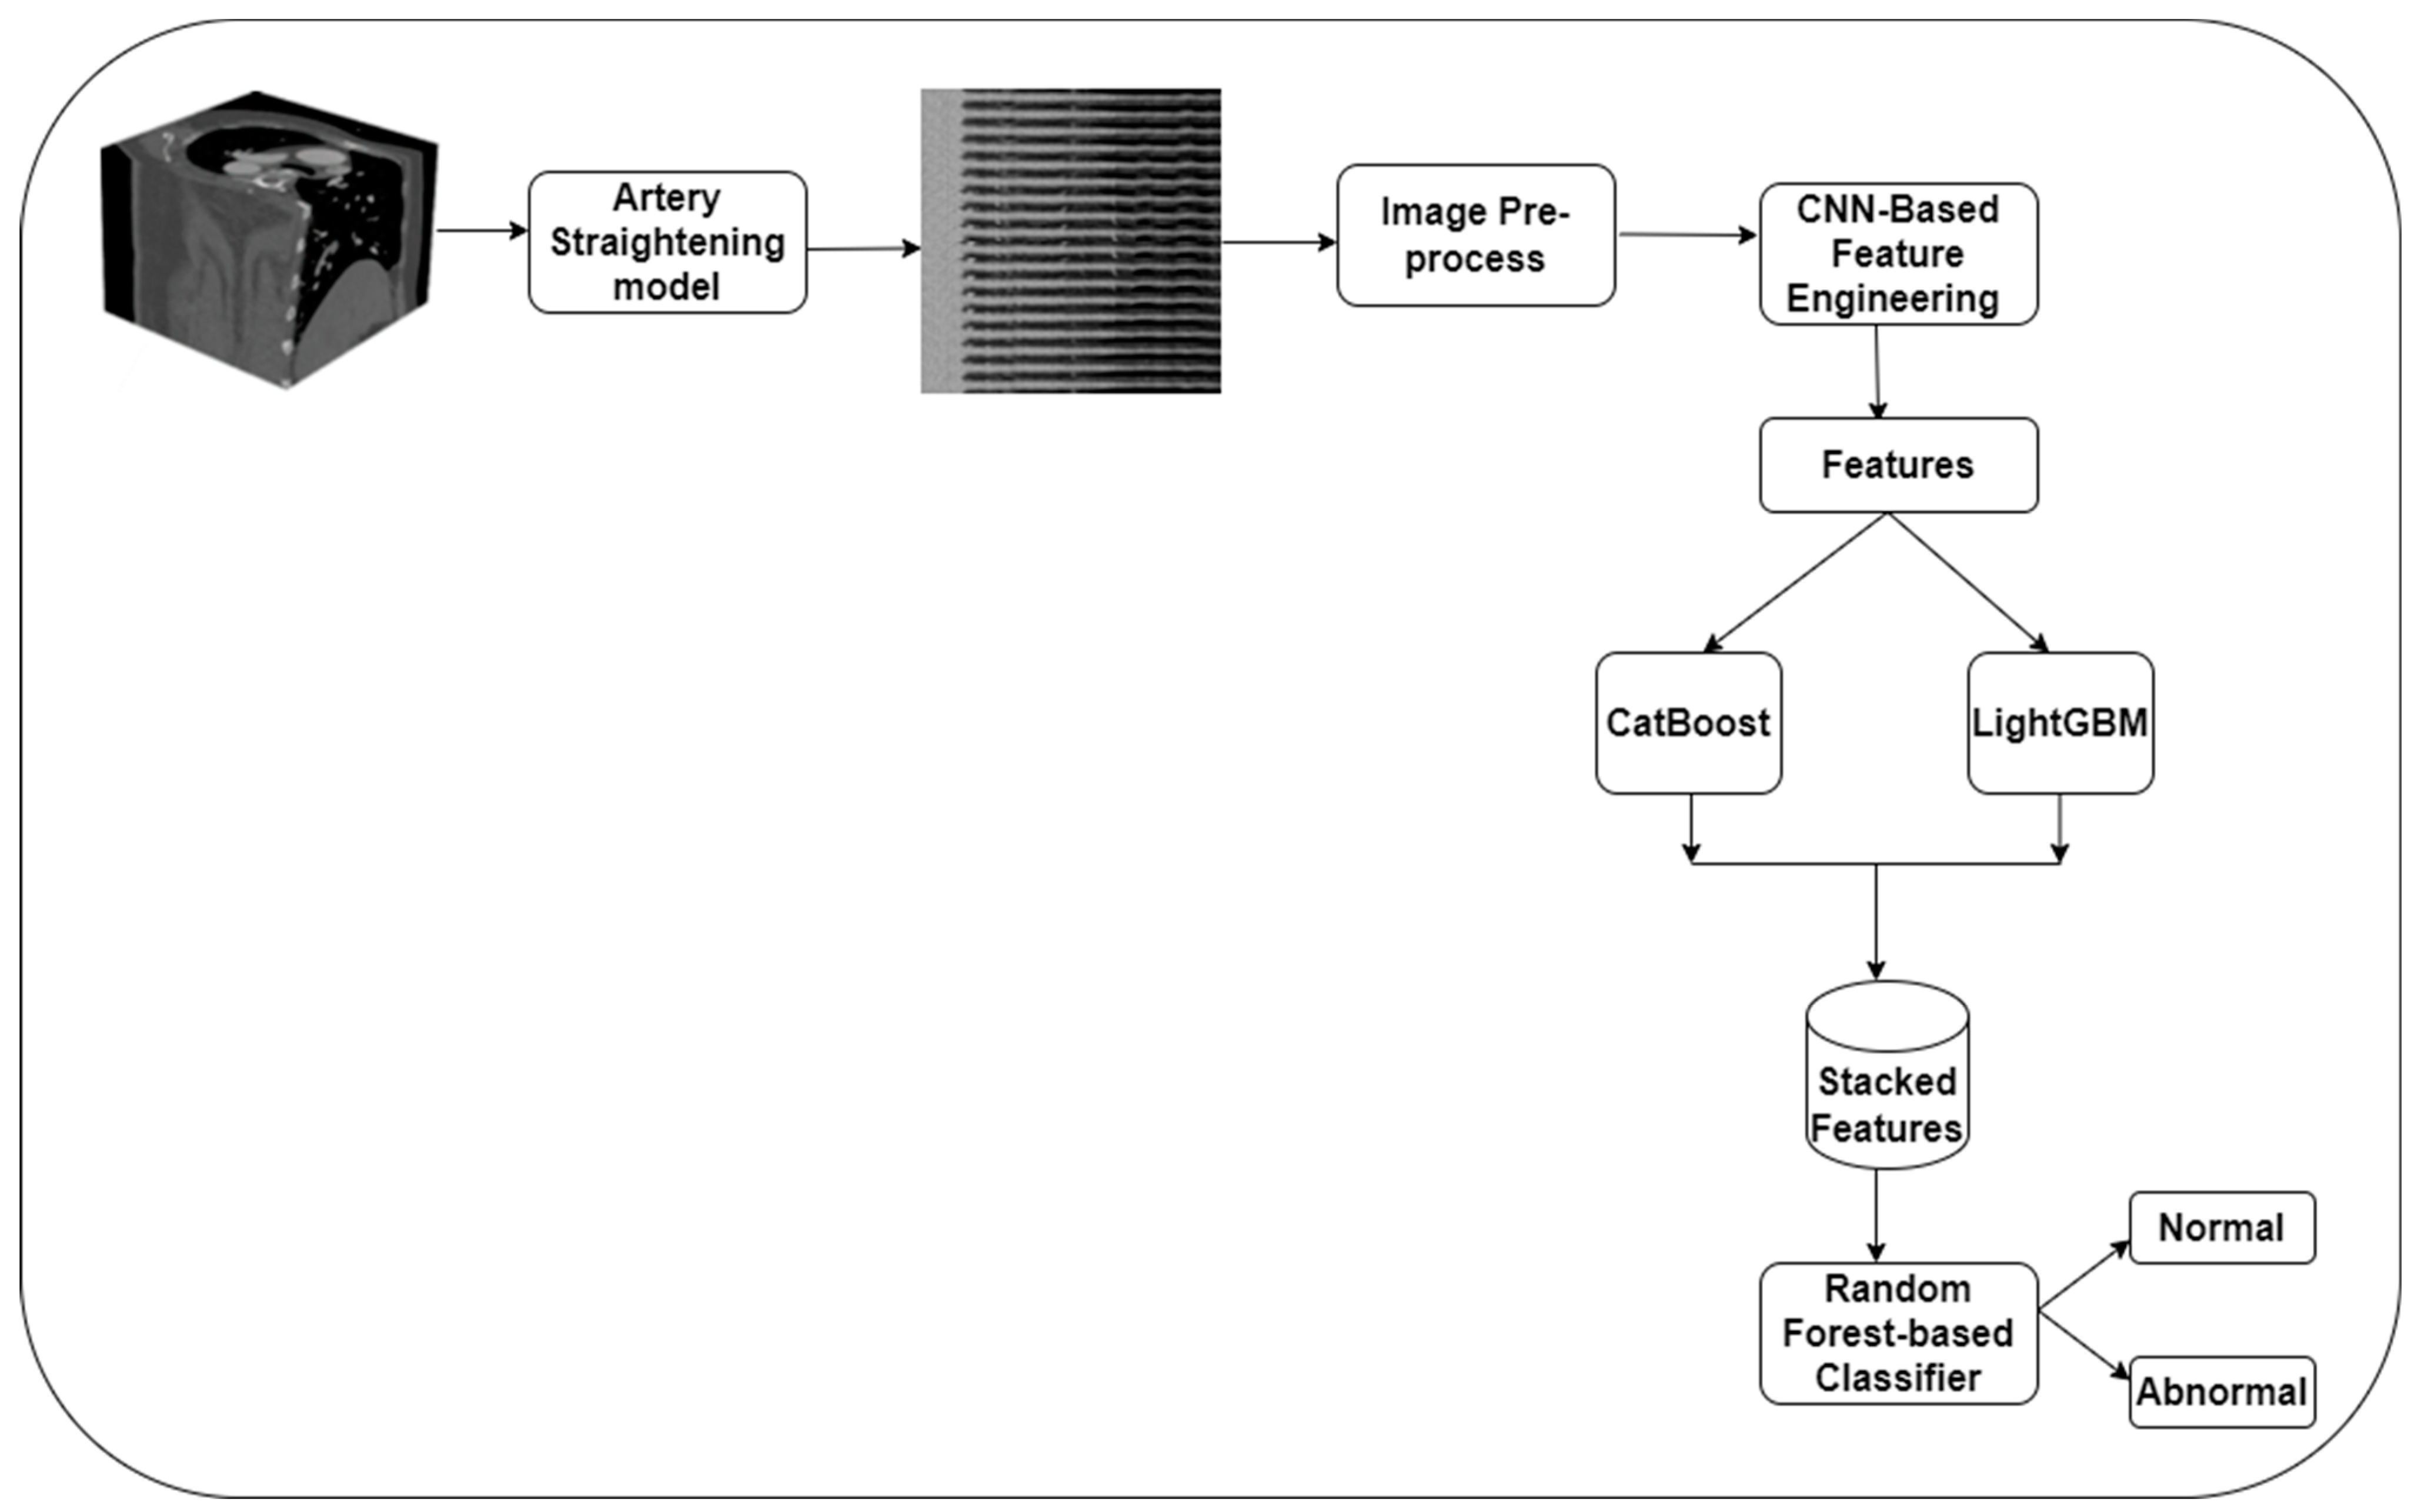
  • A feature engineering model based on the MobileNet V3 model is proposed for extracting meaningful features from the CCTA images.
  • An EL-based CAD detection model is introduced using CatBoost, LightGBM, and RF classifiers to classify the CCTA images into normal and abnormal classes.
  • Generalization of the CAD detection model using real-time datasets.
The study is organized as follows: Section 2 presents the proposed methodology for detecting CAD using the CCTA images. The experimental results are presented in Section 3. Section 4 discusses the significance of the proposed CAD detection model. Lastly, the contributions and future directions of the proposed study are presented in Section 5.

2. Materials and Methods

In this study, the authors built a CAD detection model using the EL technique. The EL technique is a prominent strategy integrating numerous base models to increase overall prediction performance. In contrast to straightforward ensemble methods such as bagging and boosting, stacked generalization combines the benefits of multiple base models to produce a more robust and accurate predictive model. A meta-model learns to efficiently balance the contributions of each base model, which may capture different elements of the underlying patterns in the CCTA images. Medical image classification relies on RF [38], CatBoost [39], and Microsoft’s Light Gradient Boosting Machine (LightGBM) [40] due to their robust performance, interpretability, and ability to handle complex data. LightGBM is an efficient and fast gradient boosting system [40]. A histogram-based learning strategy is employed to expedite training by dividing continuous feature values into discrete bins. As an EL technique, RF constructs multiple decision trees and integrates their findings. The generalizability and robustness of results are enhanced using the ensemble technique. Compared to other models, CatBoost typically requires limited hyperparameter modification, making it user-friendly for medical image analysis with various features. LightGBM is scalable and handles massive datasets, making it ideal for medical imaging applications with multiple images and features. Therefore, the authors were motivated to apply CatBoost, LightGBM, and RF models in the proposed study for classifying the CCTA images.
Figure 1 presents the proposed methodology for classifying the CCTA images. Initially, a 3D CNN technique generates the straightened MPR volume in a longitudinal view of vessels. The CCTA image quality is improved using pre-processing techniques. In order to classify the CCTA images, the authors construct a CNN-based feature engineering model using the MobileNet V3 model’s weights. The features are converted into a one-dimensional array using a flattened layer. CatBoost and LightGBM models are employed to classify the features, and outcomes are stacked into a single layer. Finally, the authors apply the RF model to categorize the CCTA images into normal and abnormal classes.

2.1. Image Acquisition

The authors generalized the proposed model using two datasets. Dataset 1 consists of 1000 3D CCTA images [41]. The data were collected from the Guangdong Provincial People’s Hospital, China, between April 2012 and December 2018. The images were captured using a Siemens 128-slice dual-source scanner. The size of CCTA images is 512 × 512 × (206–275) voxels with a planar resolution of 0.29–0.43 mm2 and spacing of 0.25–0.45 mm. Dataset 2 encompasses 2364 CCTA images of 500 patients [42]. The images were represented in Mosaic Projection View (MPV) format, consisting of 18 unique views of vertically stacked straightened coronary arteries. Table 1 offers the attributes of datasets 1 and 2, respectively.
Straightening arteries reduces vascular complexity, simplifying the feature extraction process [43]. Stacking straightened images generates cohesive input for training the DL models. Straightened artery images are stacked to minimize optical angle and tortuous vessel fluctuations. Using these characteristics, the CNN models classify the images. This consistency helps the model learn and generalize across scenarios [43]. Deep learning algorithms may require fewer layers and parameters to extract useful information from straightened artery images compared to complex, convoluted representations. This may boost model performance and training efficiency. In order to extract the straightened arteries from the 3D CCTA images, the authors follow the Candemir et al. [43] model. However, they used a three-dimensional U-Net model to improve the performance of the extraction process. The annotated 3D CCTA images are processed through the U-Net model in order to extract the normal and abnormal images. The centerline extraction method is used to deform the mean shape model to the vessel volume. It utilizes the coronary ostia and cardia chambers for centerline extraction. Figure 2 shows the recommended straightened artery extraction technique.
Equation (1) shows the vessel extraction process.
V i = C e n t e r l i n e _ e x t r a c t i o n ( C C T A i , C o , C c )
where V i is the vessel-centerline extraction, C o is the coronary ostia, and C c is the cardiac chamber.
The authors applied custom clamping logic to handle the variations in the coronary artery lengths. The empty frames were integrated with the arterial volumes to reshape the vessel borders. The authors used the weights of the 3D-U-Net model to process the coronary MPV volumes. A set of five convolutional layers with 16, 32, 64, 128, and 256 filters were used for constructing the CNN model. A 2 × 2 × 2 max pool and ReLu layers were used for handling the spatial invariance and model parameters. A flattened layer with a fully connected (FCN) layer generated normal and abnormal CCTA images.

2.2. Image Preprocessing

The shape and curvature of the arteries play a crucial role in CAD detection. The vessel curvature, bends, and twists are the critical features for classifying the CCTA images. An abnormal coronary artery diameter may suggest stenosis or other complications. Calcifications or plaques in the arterial walls may indicate atherosclerosis, a prevalent concern in coronary artery disease. A crucial characteristic to observe is the narrowing of the coronary arteries due to stenosis. This condition suggests reduced blood flow to the heart. The existence of coronary arteries can be rendered apparent by using contrast enhancements and variations. The CCTA images contain multiple noises and artifacts that may influence the performance of the proposed CAD detection model. In addition, the preprocessed images can improve the proposed feature engineering process to generate meaningful features. Thus, the authors employed a number of image preprocessing techniques to address the noise and motion artifacts. Steerable filters can respond to gradients at any angle [44]. To control the direction of a filter, the horizontal and vertical components can be combined at a certain angle of orientation [44]. There is an option to fine-tune the parameters to modify the responses of the filters or directly control the filters themselves in order to maintain the steering process. Steerable filters can enhance, compress, identify edges, analyze textures, and analyze image motion. Initially, the steerable filter function is used to obtain crucial features with specific orientations in the CCTA images. The sinusoidal function optimizes the filter to select the desired orientation. Additionally, the steerable pyramid feature captures the vessel lengths of the primary CCTA images. Equation (2) highlights the steerable filter function.
C C T A i = S t e e r a b l e _ f i l t e r ( C C T A i , n , ω , s )     , i = 1 , 2 , n
where C C T A i is the image, n is the filter order that determines the filter’s orientation, ω is the spatial frequency, and s is the filter’s size.
To address the limitations of traditional back projection, filtered back projection (FBP) uses a convolution filter to reduce blurring [45]. The cross-section attenuation coefficients are calculated using simultaneous equations of ray summing at different sine wave angles. The authors apply a filtered back projection algorithm to reconstruct the CCTA images. The algorithm uses maximum likelihood expectation maximization to refine the reconstructed images in order to reduce the artifacts. Equation (3) presents the motion artifact reduction process.
C C T A i = F B P ( C C T A i , T )     , i = 1 , 2 , n
where C C T A i is the image, FBP is the filtered back projection, and T is the threshold for image reconstruction.
Furthermore, the Frangi filter enhances vessel-like features using a multiplicative sigmoid function [46]. It calculates vessels from eigenvalues. High vessels are used for tubular structures like blood vessels, and low vessels are used for non-tubular structures. The Frangi filter allows for improved vessel appearance adaptation due to its greater sensitivity to vessel sizes and shapes. It improves blood vessel visibility and recognition in angiograms and other vascular imaging modalities. Similarly, the Sato filter enhances tubular or vessel-like features in medical images [47]. It uses Hessian matrix eigenvalues to represent local second-order intensity fluctuations in an image. It is designed to improve structures with a tubular form, which is typical of blood arteries. An eigenvalue of the Hessian matrix is used to calculate vesselness, and the filter highlights high vesselness locations. This study used the Frangi and Sato filters to enhance blood vessel quality. The Frangi filter emphasizes the elongated structures and suppresses the noises. The Sato filter computes the eigenvalues of the structure tensor to improve vessels of different sizes. Equation (4) highlights the vessel enhancement processes.
C C T A i = F _ F ( C C T A i ) + S _ F ( C C T A i )     , i = 1 , 2 , n
where C C T A i is the image, F _ F is the Frangi filter, and S _ F is the Sato filter.
In addition, the authors used a data augmentation technique to address the class imbalance of the datasets. They applied rotation ( 90 ° , 180 ° , a n d   270 ° ), horizontal and vertical flips, translation, and elastic deformation to generate multiple views of the CCTA images.

2.3. Feature Engineering

The authors construct a CNN-based feature engineering model using six convolutional layers with batch normalization and ReLu layers. They employed the weights of the MobileNet V3 model to train the final set of layers in order to extract the image features. An FCN layer with a sigmoid function was used for image classification. Figure 3 presents the proposed feature engineering process. CatBoost is an open-source framework that handles categorical features using gradient boosting. It operates on organized categorical data, including tabular datasets. Without pre-processing or one-hot encoding, CatBoost automatically handles categorical features. This may streamline the DL processes, which is especially beneficial for datasets that contain numerical and categorical columns. CatBoost reduces the demand for imputation when dealing with missing datasets. The data imputation is performed using the inherent functionality of the CatBoost framework. CatBoost can utilize GPU acceleration on suitable hardware, resulting in accelerated training and improved performance. It offers a range of hyperparameters to maximize the performance of the proposed model. In addition, it incorporates functionality for conducting grid and random searches to optimize hyperparameters. Using the CatBoost model’s features, the authors classified the CCTA images.
The CatBoost model is initialized with a single decision tree. The initial weights are assigned to the instances of the dataset. An iterative training procedure is followed to build an ensemble of decision trees. Based on the ensemble’s current prediction, a new tree is assigned to the negative gradient of the loss function. In addition, ordered boosting is applied to handle the categorical features without complexities. Using the target variable’s response, a sorting of the features is performed. The ordered structure is employed to build the tree in order to manage the categorical splits. The FCN layer is replaced with CatBoost after the completion of the training phase. The outcomes are stacked into a vector. Figure 3 highlights the feature engineering processes.
Equation (5) presents the mathematical form of the loss function for CatBoost-based binary classification.
L o s s   ( T , P ) = 1 N i = 1 N T i   l o g ( P i ) + ( 1 T i )   l o g ( 1 P i )
where N is the number of features, T i is the actual class, P i is the predicted class. CatBoost minimizes the loss function by adjusting the model’s hyperparameters. Equation (6) shows the overall ensemble prediction.
F ( x ) = η f 1 ( x ) + η f 2 ( x ) + + η f n ( x )
where F ( x ) is the final prediction of the CatBoost model, η is the learning rate, and f n ( x ) is the prediction of the nth tree.
LightGBM is especially suitable for handling massive datasets and highly dimensional feature spaces. The authors apply LightGBM to classify the extracted features into normal and abnormal classes. The findings of the LightGBM model are stacked into the vector. LightGBM assembles a group of imperfect learners, typically decision trees, in an ordered manner, intending to fix the errors made by earlier trees. A differentiable loss function is minimized to reduce the difference between predicted values and actual labels. In order to minimize loss, LightGBM builds the tree level by level using a leaf-wise tree development technique. LightGBM uses regularization to prevent overfitting. Leaf weights are regularized to control model complexity. To accelerate training, LightGBM uses a method called gradient-based one-side sampling. The gradient of the loss function determines the sampling of instances for the expansion of each tree. The training method assigns substantial weight to instances with larger gradients, resulting in more effective learning. In addition, the authors enable parallel learning in order to generalize the outcome across diverse computational resources. The sum of the logistic regression and regularization terms generates the objective function. Equations (7) and (8) present the objective function generation.
O = i = 1 N l o g ( 1 + e x p ( 2 T i F ( a i ) ) ) + λ m = 1 k W k 2
where O is the objective function, N is the number of features, T i is the true label, F ( a i ) is the sum of prediction, k is the number of leaves in all the trees, W k is the weight of the k t h tree, λ is the regularization parameter.
O = O + η   t = 1 T O t
where O t is the objective function of the T t h tree.

2.4. CAD Identification

The authors employ RF as a meta-model to aggregate the outcomes of the CatBoost and LightGBM models to generate a final prediction. The stacked outcomes are used as input for the RF classifier. The inherent prediction aggregation functionality supports the model to generalize on diverse datasets. The mathematical form of the EL-based predictions is represented in Equation (9). Figure 4 reveals the meta-model-based CAD detection.
Equation shows the computational form of ensemble prediction.
E n s e m b l e _ P r e d i c t i o n = R F _ C l a s s i f i e r ( C a t b o o s t ( f ) , L i g h t G B M ( f ) , h )
where f is the features, and h are the hyperparameters of the RF classifier.
In order to fine-tune the hyperparameters of the RF classifier, the random search technique is employed. Equation (10) presents the mathematical form of the fine-tuning process.
E n s e m b l e _ P r e d i c t i o n = R a n d o m _ s e a r c h . R F _ C l a s s i f i e r ( f , n ,   m , r )
where “.” represents the fine-tuning process, f is the features, n is the number of estimators, m is the maximum depth of the tree, and r is the random state.

2.5. Performance Evaluation

In the process of analyzing a deep learning-based CAD detection model, it is standard practice to utilize a number of performance measures to evaluate multiple facets of the model’s performance. These metrics include accuracy (Acc), precision (Pre), recall (Rec), F1-score (F1), and Cohen’s kappa (Kap). Acc is the ratio of occurrences that were accurately predicted to the total number of instances. It offers a comprehensive evaluation of the accuracy of the proposed CAD detection model. In CAD identification, Pre assesses the model’s ability to prevent false positives. A high level of accuracy in CAD identification suggests that the model is likely to provide effective CAD predictions. As a measurement of the model’s capacity to capture every instance of CAD, Rec is an essential component in the process of CAD detection. A high recall guarantees the model detects CAD instances accurately, minimizing false negatives. F1 is useful in situations where there is an unequal distribution of classes. It is a unified measure that incorporates both recall and precision data. Kap provides a measurement of the degree of agreement between the predictions made by the model and the actual labels, while considering the influence of randomness. Uncertainty analysis evaluates model prediction risk. It determines the likelihood of an inaccurate prediction. Standard deviation (SD) and confidence interval (CI) are crucial in medical diagnostics systems. Uncertainty analysis can facilitate the evaluation of a model’s calibration. A well-calibrated model delivers precise predictions and trustworthy confidence estimations. The generalization of the EL-based medical image classification model may be effectively assessed using uncertainty analysis.

3. Results

To evaluate the performance of the proposed CAD detection model, the authors used Windows 10 Professional, Intel i7 with 16 GB RAM, NVIDIA GeForce RTX 3050, and the Python 3.8.1 environment. They generalized the model using datasets 1 and 2. The datasets are divided into a train set (70%) and a test set (30%). The source codes of MobileNet V3, CatBoost, and LightGBM are extracted from the Github repositories [39,40]. However, the suggested image pre-processing and fine-tuning procedures are required to generate the outcome. In addition, PyTorch and Keras libraries are used for the model development. The authors trained the model with epochs of 12 and 16 and batches of 14 and 15 for datasets 1 and 2, respectively. A learning rate of 1 × 10⁻⁴, strides of 2, a decay rate of 0.94 per 2 epochs, and a sigmoid function are used for the image classification. Figure 5 shows the performance of the proposed model in different epochs. The proposed EL-based CAD detection achieved an exceptional outcome. The suggested feature engineering model assists the model in identifying the normal and abnormal classes effectively.
The binary classification performance of the proposed model is listed in Table 2. Figure 6 highlights the significance of the recommended CAD detection model. It is evident that the proposed preprocess techniques and feature engineering model have addressed the existing challenges in generating meaningful features.
The findings of the comparative analysis using dataset 1 are presented in Table 3. The recommended model outperforms the existing CAD detection by achieving superior results. The suggested stacked generalization using CatBoost, LightGBM, and RF models produced remarkable performance. Figure 7 reveals the performance of the CAD detection models on dataset 1.
Table 4 offers the outcome of the comparative analysis using dataset 2. The recommended hyperparameter optimization has tuned the RF classifier to yield an effective outcome. In addition, the feature engineering technique generated meaningful features from the CCTA images. The results of the comparative analysis are presented in Figure 8.
The uncertainty analysis is presented in Table 5. The findings indicate the reliability of the proposed model. In addition, it reveals that the model is well calibrated and can support the physician in making effective decisions.
Lastly, the computational configuration for the CAD detection model is listed in Table 6. The proposed CAD detection model demands a minimum number of parameters and floating point operations (FLOPs) for generating the outcome. It is evident that the recommended model can be deployed in healthcare centers with minimal computational resources.

4. Discussion

In this study, the authors developed a CAD detection model using the EL approach. Image preprocessing techniques were applied to overcome the image noise and artifacts. These techniques were employed to support the MobileNet V3 model to extract meaningful features. The 3D-U-Net model was used to generate the straightened coronary artery images. The artery straightening process was employed to produce the vertically stacked artery images. These images are crucial in identifying normal and abnormal images. The authors addressed the class imbalances using multiple data augmentation techniques. CatBoost and LightGBM models were used to generate the outcome using the image features. Finally, the outcomes were assembled using the RF model. The generalization of the CAD detection model was performed using two benchmark datasets. Baseline models were compared with the proposed model.
Comparative analysis outcomes are presented in Table 3 and Table 4. The recommended EL-based classification model obtained an exceptional Acc of 99.7 and 99.6 and F1 of 98.9 and 98.7 for datasets 1 and 2, respectively. The proposed EL-based CAD detection model obtained outstanding results in datasets 1 and 2. Compared to the existing models, the proposed model produced a higher level of accuracy. By assembling the predictions of the CatBoost and LightGBM models, the overall accuracy of CAD detection is improved. The suggested model outperformed the baseline models. In addition, the outcome of the uncertainty analysis is listed in Table 5. It revealed the reliability of the proposed model’s results. The recommended artery straightening process assisted the model in detecting the crucial features needed to identify CAD. Finally, Table 6 highlights the importance of the proposed CAD detection model in a resource-constrained environment. The proposed model generated the results with few parameters and FLOPs. In contrast, the existing models required substantial computational resources for CAD detection.
Alothman et al. [28] employed a set of image preprocessing techniques and a pretrained model for classifying the CCTA images. Likewise, Wahabsait et al. [29] employed a UNet++ model that requires additional computational resources for CAD detection. Huang et al. [35] built the CAD detection model using the one-dimensional sequence checking hybrid technique. They used the 3D-U-Net architecture for image segmentation. The model demanded substantial computational resources to produce a reasonable performance. Moon et al. [36] proposed an algorithm to extract critical elements of CAD. They applied a self-attention mechanism for classifying the images. The gradient-weighted class activation mapping was used to visualize the stenosis locations. Li et al. [37] proposed a risk stratification system for predicting CAD. They employed a fusion framework to identify CAD from the complex images. The EfficientNet B7 architecture is relatively complex, which may pose challenges to implementing the CAD detection model in a resource-constrained environment. A dedicated hyperparameter tuning was required to enhance the EfficientNet B7 model’s efficiency. The MobileNet V3 model is a lightweight feature extraction model. An additional training phase and image preprocessing were required to detect CAD effectively. In contrast, the proposed model followed the EL approach for image classification. It required a limited amount of resources to generate the outcome. Disanto et al. [46] introduced an image preprocessing technique to enhance the quality of the CCTA images. They employed multiple filter techniques to support the DL models in detecting CAD. The proposed CAD detection model has used Frangi and Sato filters to overcome the challenges in classifying the CCTA images. The findings revealed that the suggested image preprocessing techniques have improved the proposed model’s performance.
The studies [47,48,49,50] proposed a method for detecting CAD markers from the CCTA images. They applied image segmentation and pixel enhancement techniques to enhance the CCTA image quality. Likewise, the proposed model used the FBP algorithm for CCTA image reconstruction. The exceptional performance of the recommended model represents the significance of the FBP algorithm. The studies [51,52,53] discussed the importance of Bayesian inference models in decoding anomalous diffusion using CT images. Similarly, the proposed model employed feature engineering based on the MobileNet V3 model for classifying the normal and abnormal classes by identifying the intricate patterns of CAD.
The suggested approach can automatically evaluate CT scans to detect CAD symptoms, assisting medical personnel with the initial screening procedure. The recommended CAD detection approach can rapidly analyze medical images to minimize the CCTA image interpretation period. With the help of the suggested model, it is possible to quantify the degree of coronary artery blockages and their severity. This information can assist physicians in determining the appropriate medical intervention, including angioplasty and coronary artery bypass grafting. Prioritizing patients by irregularity severity can optimize healthcare resource allocation. The proposed model can evaluate massive datasets in a consistent and efficient manner, increasing the likelihood of identifying minor irregularities that may be missed in human evaluations. When compared with conventional approaches, the suggested CAD detection model can process medical image analysis efficiently. This efficiency enables healthcare practitioners to focus on interpretation and decision-making. The proposed model can quantify CAD markers, including vascular diameters, stenosis severity, and other quantitative treatment planning parameters. In contrast to subjective interpretations, it can offer a more objective and standardized evaluation, which may result in more consistent diagnoses. The experimental results indicated that there is no bias or overfitting in the model’s outcome. Using the recommended model, healthcare centers maintain the users’ data privacy.
In resource-constrained contexts, the suggested CAD detection model can detect abnormalities in CCTA images. It maintained a trade-off between model complexity and interpretability. The proposed model can improve the diagnostic procedure without a substantial workforce or infrastructure. Healthcare facilities and cardiologists may greatly benefit from the proposed model for detecting CAD during the initial screening procedure. Within healthcare settings, patient data may produce a large amount of unpredictability. The authors trained the proposed model using benchmark datasets to handle such unpredictability. The model’s generalizability is essential across a wide range of patient populations for reliable CAD diagnosis. Patients with a greater risk for CAD may be identified with the use of the suggested model. The proposed method can be beneficial in offering personalized treatments based on the patient’s risk profile. Furthermore, the recommended CAD detection model can be updated or retrained to identify CAD in diverse patient populations.
During the model development, the authors encountered a few challenges. The image noise and artifacts reduced the feature’s quality. Multiple image preprocessing steps were required to improve the performance of the MobileNet V3 model. The artery straightening process was applied in order to generate vertically stacked artery images similar to dataset 2. The authors conducted various data augmentation techniques to improve the proposed model’s performance. The RF-based classifier has demanded a fine-tuning process to streamline the classification process. The model was generalized to two datasets. However, it demands substantial training in order to generate an exceptional result in real-time applications. An additional training program is required to assist the cardiologist in making effective decisions. To ensure proper and effective deployment in healthcare practice, the developers should address model interpretability, ethical issues, and ongoing validation in diverse patient groups. The number of parameters and FLOPs depends on the dataset’s size. However, the suggested model required limited resources to identify the normal and abnormal classes. The severity of CAD is based on factors including the age and lifestyle of the individual. To strengthen the decision-making capability of the proposed model, diverse datasets are required. There is a demand for effective collaboration between researchers and healthcare centers to use CCTA images while maintaining data privacy policies. This collaboration can reduce the data bias in CAD detection models. The proposed model can be improved using liquid neural network-based feature extraction. Multiple CNN models can be integrated with the proposed model to generate unique CAD features.

5. Conclusions

The authors developed a model based on the EL technique for detecting CAD using the CCTA images. They proposed image preprocessing, feature engineering, and image classification techniques to overcome the shortcomings of the existing CAD detection model. The 3D-U-Net model was developed to generate the vertically stacked coronary artery images. A CNN model with the MobileNet V3 model’s weights was proposed for feature extraction. The CatBoost and LightGBM models were used to classify the features. In addition, the outcomes were assembled using the RF classifier. The proposed model was generalized using two benchmark datasets. It detected CAD with an accuracy of 99.7 and 99.6 and a number of parameters of 3.8 M and 4.1 M for datasets 1 and 2. The experimental results highlighted the proposed CAD detection model’s effectiveness in detecting CAD. The EL approach supported the proposed model, which outperformed the recent CAD detection models. The recommended model can be deployed in healthcare centers to assist cardiologists in making a practical decision. Researchers and developers can use the study’s findings to build EL-based CAD detection models. Integrating a liquid neural network-based feature extraction can improve the model’s performance.

Author Contributions

Conceptualization, A.R.W.S.; Methodology, A.R.W.S.; Software, A.R.W.S.; Validation, A.M.A.B.A.; Formal analysis, A.R.W.S. and A.M.A.B.A.; Investigation, A.R.W.S.; Resources, A.R.W.S.; Data curation, A.R.W.S. and A.M.A.B.A.; Visualization, A.R.W.S.; Supervision, A.M.A.B.A.; Project administration, A.M.A.B.A.; Funding acquisition, A.R.W.S. All authors have read and agreed to the published version of the manuscript.

Funding

This work was supported by the Deanship of Scientific Research, Vice Presidency for Graduate Studies and Scientific Research, King Faisal University, Saudi Arabia (Grant No. 5498).

Institutional Review Board Statement

Not applicable.

Informed Consent Statement

Not applicable.

Data Availability Statement

The datasets can be found in the following repositories: https://data.mendeley.com/datasets/fk6rys63h9/1 (accessed on 14 February 2023) and https://github.com/XiaoweiXu/ImageCAS-A-Large-Scale-Dataset-and-Benchmark-for-Coronary-Artery-Segmentation-based-on-CT (accessed on 15 February 2023).

Conflicts of Interest

The authors declare no conflict of interest.

References

  1. Lee, S.; Rim, B.; Jou, S.-S.; Gil, H.-W.; Jia, X.; Lee, A.; Hong, M. Deep-Learning-Based Coronary Artery Calcium Detection from CT Image. Sensors 2021, 21, 7059. [Google Scholar] [CrossRef] [PubMed]
  2. Chen, X.; Fu, Y.; Lin, J.; Ji, Y.; Fang, Y.; Wu, J. Coronary Artery Disease Detection by Machine Learning with Coronary Bifurcation Features. Appl. Sci. 2020, 10, 7656. [Google Scholar] [CrossRef]
  3. Abdar, M.; Książek, W.; Acharya, U.R.; Tan, R.-S.; Makarenkov, V.; Pławiak, P. A new machine learning technique for an accurate diagnosis of coronary artery disease. Comput. Methods Programs Biomed. 2019, 179, 104992. [Google Scholar] [CrossRef] [PubMed]
  4. Denzinger, F.; Wels, M.; Breininger, K.; Taubmann, O.; Mühlberg, A.; Allmendinger, T.; Gülsün, M.A.; Schöbinger, M.; André, F.; Buss, S.J.; et al. How scan parameter choice affects deep learning-based coronary artery disease assessment from computed tomography. Sci. Rep. 2023, 13, 2563. [Google Scholar] [CrossRef] [PubMed]
  5. Zreik, M.; van Hamersvelt, R.W.; Khalili, N.; Wolterink, J.M.; Voskuil, M.; Viergever, M.A.; Leiner, T.; Isgum, I. Deep Learning Analysis of Coronary Arteries in Cardiac CT Angiography for Detection of Patients Requiring Invasive Coronary Angiography. IEEE Trans. Med. Imaging 2019, 39, 1545–1557. [Google Scholar] [CrossRef]
  6. Cheung, W.K.; Bell, R.; Nair, A.; Menezes, L.J.; Patel, R.; Wan, S.; Chou, K.; Chen, J.; Torii, R.; Davies, R.H.; et al. A Computationally Efficient Approach to Segmentation of the Aorta and Coronary Arteries Using Deep Learning. IEEE Access 2021, 9, 108873–108888. [Google Scholar] [CrossRef]
  7. Alizadehsani, R.; Abdar, M.; Roshanzamir, M.; Khosravi, A.; Kebria, P.M.; Khozeimeh, F.; Nahavandi, S.; Sarrafzadegan, N.; Acharya, U.R. Machine learning-based coronary artery disease diagnosis: A comprehensive review. Comput. Biol. Med. 2019, 111, 103346. [Google Scholar] [CrossRef]
  8. Yang, W.; Chen, C.; Yang, Y.; Chen, L.; Yang, C.; Gong, L.; Wang, J.; Shi, F.; Wu, D.; Yan, F. Diagnostic performance of deep learning-based vessel extraction and stenosis detection on coronary com-puted tomography angiography for coronary artery disease: A multi-reader multi-case study. Radiol. Medica 2023, 128, 307–315. [Google Scholar] [CrossRef]
  9. Al’aref, S.J.; Maliakal, G.; Singh, G.; van Rosendael, A.R.; Ma, X.; Xu, Z.; Alawamlh, O.A.H.; Lee, B.; Pandey, M.; Achenbach, S.; et al. Machine learning of clinical variables and coronary artery calcium scoring for the prediction of obstructive coronary artery disease on coronary computed tomography angiography: Analysis from the CONFIRM registry. Eur. Hear. J. 2020, 41, 359–367. [Google Scholar] [CrossRef]
  10. Ren, P.; He, Y.; Guo, N.; Luo, N.; Li, F.; Wang, Z.; Yang, Z. A deep learning-based automated algorithm for labeling coronary arteries in computed tomography angiography images. BMC Med. Inform. Decis. Mak. 2023, 23, 249. [Google Scholar] [CrossRef]
  11. Kaba, Ş.; Haci, H.; Isin, A.; Ilhan, A.; Conkbayir, C. The Application of Deep Learning for the Segmentation and Classification of Coronary Arteries. Diagnostics 2023, 13, 2274. [Google Scholar] [CrossRef] [PubMed]
  12. Rjiba, S.; Urruty, T.; Bourdon, P.; Fernandez-Maloigne, C.; Delepaule, R.; Christiaens, L.-P.; Guillevin, R. CenterlineNet: Automatic Coronary Artery Centerline Extraction for Computed Tomographic Angiographic Images Using Convolutional Neural Network Architectures. In Proceedings of the 2020 Tenth International Conference on Image Processing Theory, Tools and Applications (IPTA), Paris, France, 9–12 November 2020; pp. 1–6. [Google Scholar]
  13. Apostolopoulos, I.D.; Apostolopoulos, D.I.; Spyridonidis, T.I.; Papathanasiou, N.D.; Panayiotakis, G.S. Multi-input deep learning approach for Cardiovascular Disease diagnosis using Myocardial Perfusion Imaging and clinical data. Phys. Medica 2021, 84, 168–177. [Google Scholar] [CrossRef] [PubMed]
  14. Algarni, M.; Al-Rezqi, A.; Saeed, F.; Alsaeedi, A.; Ghabban, F. Multi-constraints based deep learning model for automated segmentation and diagnosis of coronary artery disease in X-ray angiographic images. PeerJ Comput. Sci. 2022, 8, e993. [Google Scholar] [CrossRef] [PubMed]
  15. Li, D.; Xiong, G.; Zeng, H.; Zhou, Q.; Jiang, J.; Guo, X. Machine learning-aided risk strati-fication system for the prediction of coronary artery disease. Int. J. Cardiol. 2021, 326, 30–34. [Google Scholar] [CrossRef] [PubMed]
  16. Wu, W.; Zhang, J.; Xie, H.; Zhao, Y.; Zhang, S.; Gu, L. Automatic detection of coronary artery stenosis by convolutional neural network with temporal constraint. Comput. Biol. Med. 2020, 118, 103657. [Google Scholar] [CrossRef] [PubMed]
  17. Yang, S.; Kweon, J.; Roh, J.-H.; Lee, J.-H.; Kang, H.; Park, L.-J.; Kim, D.J.; Yang, H.; Hur, J.; Kang, D.-Y.; et al. Deep learning segmentation of major vessels in X-ray coronary angiography. Sci. Rep. 2019, 9, 16897. [Google Scholar] [CrossRef] [PubMed]
  18. Magboo VP, C.; Magboo MS, A. Diagnosis of Coronary Artery Disease from Myocardial Perfusion Imaging Using Convolutional Neural Networks. Procedia Comput. Sci. 2023, 218, 810–817. [Google Scholar] [CrossRef]
  19. Acharya, U.R.; Meiburger, K.M.; Koh, J.E.W.; Vicnesh, J.; Ciaccio, E.J.; Lih, O.S.; Tan, S.K.; Aman, R.R.A.R.; Molinari, F.; Ng, K.H. Automated plaque classification using computed tomography angiography and Gabor transformations. Artif. Intell. Med. 2019, 100, 101724. [Google Scholar] [CrossRef]
  20. Masuda, T.; Nakaura, T.; Funama, Y.; Oda, S.; Okimoto, T.; Sato, T.; Noda, N.; Yoshiura, T.; Baba, Y.; Arao, S.; et al. Deep learning with convolutional neural network for estimation of the characterisation of coronary plaques: Validation using IB-IVUS. Radiography 2021, 28, 61–67. [Google Scholar] [CrossRef]
  21. Tatsugami, F.; Higaki, T.; Nakamura, Y.; Yu, Z.; Zhou, J.; Lu, Y.; Fujioka, C.; Kitagawa, T.; Kihara, Y.; Iida, M.; et al. Deep learning–based image restoration algorithm for coronary CT angiography. Eur. Radiol. 2019, 29, 5322–5329. [Google Scholar] [CrossRef]
  22. Peper, J.; Suchá, D.; Swaans, M.; Leiner, T. Functional cardiac CT–going beyond anatomical evaluation of coronary artery disease with Cine CT, CT-FFR, CT perfusion and machine learning. Br. J. Radiol. 2020, 93, 20200349. [Google Scholar] [CrossRef]
  23. Muscogiuri, G.; Chiesa, M.; Baggiano, A.; Spadafora, P.; De Santis, R.; Guglielmo, M.; Scafuri, S.; Fusini, L.; Mushtaq, S.; Conte, E.; et al. Diagnostic performance of deep learning algorithm for analysis of computed tomography myocardial perfusion. Eur. J. Nucl. Med. 2022, 49, 3119–3128. [Google Scholar] [CrossRef]
  24. Wong, K.K.; Fortino, G.; Abbott, D. Deep learning-based cardiovascular image diagnosis: A promising challenge. Futur. Gener. Comput. Syst. 2020, 110, 802–811. [Google Scholar] [CrossRef]
  25. Serrano-Antón, B.; Otero-Cacho, A.; López-Otero, D.; Díaz-Fernández, B.; Bastos-Fernández, M.; Pérez-Muñuzuri, V.; Muñuzuri, A.P. Muñuzuri. Coronary artery segmentation based on transfer learning and UNet architecture on computed tomography coronary angiography images. IEEE Access 2023, 11, 75484–75496. [Google Scholar] [CrossRef]
  26. Zhang, J.; Zhu, H.; Chen, Y.; Yang, C.; Cheng, H.; Li, Y.; Wang, F. En-semble machine learning approach for screening of coronary heart disease based on echocardiography and risk factors. BMC Med. Inform. Decis. Mak. 2021, 21, 187. [Google Scholar] [CrossRef]
  27. Kolukisa, B.; Bakir-Gungor, B. Ensemble feature selection and classification methods for machine learning-based coronary artery disease diagnosis. Comput. Stand. Interfaces 2023, 84, 103706. [Google Scholar] [CrossRef]
  28. Alothman, A.F.; Sait, A.R.W.; Alhussain, T.A. Detecting Coronary Artery Disease from Computed Tomography Images Using a Deep Learning Technique. Diagnostics 2022, 12, 2073. [Google Scholar] [CrossRef]
  29. Wahab Sait, A.R.; Dutta, A.K. Developing a Deep-Learning-Based Coronary Artery Disease Detec-tion Technique Using Computer Tomography Images. Diagnostics 2023, 13, 1312. [Google Scholar] [CrossRef] [PubMed]
  30. Han, D.; Liu, J.; Sun, Z.; Cui, Y.; He, Y.; Yang, Z. Deep learning analysis in coronary computed tomographic angiography imaging for the assessment of patients with coronary artery stenosis. Comput. Methods Programs Biomed. 2020, 196, 105651. [Google Scholar] [CrossRef] [PubMed]
  31. Chen, M.; Chen, M.; Wang, X.; Wang, X.; Hao, G.; Hao, G.; Cheng, X.; Cheng, X.; Ma, C.; Ma, C.; et al. Diagnostic performance of deep learning-based vascular extraction and stenosis detection technique for coronary artery disease. Br. J. Radiol. 2020, 93, 20191028. [Google Scholar] [CrossRef] [PubMed]
  32. Papandrianos, N.; Papageorgiou, E. Automatic Diagnosis of Coronary Artery Disease in SPECT Myocardial Perfusion Imaging Employing Deep Learning. Appl. Sci. 2021, 11, 6362. [Google Scholar] [CrossRef]
  33. Pan, L.-S.; Li, C.-W.; Su, S.-F.; Tay, S.-Y.; Tran, Q.-V.; Chan, W.P. Coronary artery segmentation under class imbalance using a U-Net based architecture on computed tomography angiography images. Sci. Rep. 2021, 11, 14493. [Google Scholar] [CrossRef] [PubMed]
  34. Zeleznik, R.; Foldyna, B.; Eslami, P.; Weiss, J.; Alexander, I.; Taron, J.; Parmar, C.; Alvi, R.M.; Banerji, D.; Uno, M.; et al. Deep convolutional neural networks to predict cardiovascular risk from computed tomography. Nat. Commun. 2021, 12, 715. [Google Scholar] [CrossRef] [PubMed]
  35. Huang, Z.; Xiao, J.; Wang, X.; Li, Z.; Guo, N.; Hu, Y.; Li, X.; Wang, X. Clinical Evaluation of the Automatic Coronary Artery Disease Reporting and Data System (CAD-RADS) in Coronary Computed Tomography Angiography Using Convolutional Neural Networks. Acad. Radiol. 2023, 30, 698–706. [Google Scholar] [CrossRef] [PubMed]
  36. Moon, J.H.; Lee, D.Y.; Cha, W.C.; Chung, M.J.; Lee, K.-S.; Cho, B.H.; Choi, J.H. Automatic stenosis recognition from coronary angiography using convolutional neural networks. Comput. Methods Programs Biomed. 2021, 198, 105819. [Google Scholar] [CrossRef] [PubMed]
  37. Li, H.; Wang, X.; Liu, C.; Zeng, Q.; Zheng, Y.; Chu, X.; Yao, L.; Wang, J.; Jiao, Y.; Karmakar, C. A fusion framework based on multi-domain features and deep learning features of phonocardiogram for coronary artery disease detection. Comput. Biol. Med. 2020, 120, 103733. [Google Scholar] [CrossRef] [PubMed]
  38. Random Forest Classifier. Available online: https://gist.github.com/pb111/88545fa33780928694388779af23bf58 (accessed on 5 March 2023).
  39. CatBoost. Available online: https://github.com/catboost/catboost (accessed on 6 March 2023).
  40. LightGBM. Available online: https://github.com/microsoft/LightGBM (accessed on 7 March 2023).
  41. Zeng, A.; Wu, C.; Lin, G.; Xie, W.; Hong, J.; Huang, M.; Zhuang, J.; Bi, S.; Pan, D.; Ullah, N.; et al. ImageCAS: A Large-Scale Dataset and Benchmark for Coronary Artery Segmentation based on Computed Tomography Angiography Images. arXiv 2022, arXiv:2211.01607. [Google Scholar] [CrossRef]
  42. Demirer, M.; Gupta, V.; Bigelow, M.; Erdal, B.; Prevedello, L.; White, R. Image dataset for a CNN algorithm development to detect coronary atherosclerosis in coronary CT angiography. Mendeley Data 2019. [Google Scholar] [CrossRef]
  43. Candemir, S.; White, R.D.; Demirer, M.; Gupta, V.; Bigelow, M.T.; Prevedello, L.M.; Erdal, B.S. Automated coronary artery atherosclerosis detection and weakly supervised localization on coronary CT angiography with a deep 3-dimensional convo-lutional neural network. Comput. Med. Imaging Graph. 2020, 83, 101721. [Google Scholar] [CrossRef]
  44. Graham, S.; Epstein, D.; Rajpoot, N. Dense Steerable Filter CNNs for Exploiting Rotational Symmetry in Histology Images. IEEE Trans. Med. Imaging 2020, 39, 4124–4136. [Google Scholar] [CrossRef] [PubMed]
  45. Shin, Y.J.; Chang, W.; Ye, J.C.; Kang, E.; Oh, D.Y.; Lee, Y.J.; Park, J.H.; Kim, Y.H. Low-Dose Abdominal CT Using a Deep Learning-Based Denoising Algorithm: A Comparison with CT Reconstructed with Filtered Back Projection or Iterative Reconstruction Algorithm. Korean J. Radiol. 2020, 21, 356–364. [Google Scholar] [CrossRef]
  46. Disanto, A.; Pepe, A.; Petrelli, L.; Gsaxner, C.; Li, J.; Jin, Y.; Brunetti, A.; Buongiorno, D.; Egger, J.; Bevilacqua, V. Enhancement of aortic dissections in CT angiography: Are common filters robust enough? In Medical Imaging 2022: Biomedical Applications in Molecular, Structural, and Functional Imaging; SPIE: Bellingham, WA, USA, 2022; Volume 12036, pp. 617–623. [Google Scholar]
  47. Yunus, M.M.; Sabarudin, A.; Karim, M.K.A.; Nohuddin, P.N.E.; Zainal, I.A.; Shamsul, M.S.M.; Yusof, A.K.M. Reproducibility and Repeatability of Coronary Computed Tomography Angiography (CCTA) Image Segmentation in Detecting Atherosclerosis: A Radiomics Study. Diagnostics 2022, 12, 2007. [Google Scholar] [CrossRef] [PubMed]
  48. Baskaran, L.; Maliakal, G.; Al’Aref, S.J.; Singh, G.; Xu, Z.; Michalak, K.; Min, J.K. Identification and quantification of cardiovascular structures from CCTA: An end-to-end, rapid, pixel-wise, deep-learning method. Cardiovasc. Imaging 2020, 13, 1163–1171. [Google Scholar]
  49. Cui, H. Supervised Filter Learning for Coronary Artery Vesselness Enhancement Diffusion in Coronary CT Angiography Images. Int. J. Comput. Intell. Syst. 2020, 13, 488–495. [Google Scholar] [CrossRef]
  50. Sukanya, A.; Rajeswari, R. A modified Frangi’s vesselness measure based on gradient and grayscale values for coronary artery detection. J. Intell. Fuzzy Syst. 2019, 37, 2327–2336. [Google Scholar] [CrossRef]
  51. Muñoz-Gil, G.; Volpe, G.; Garcia-March, M.A.; Aghion, E.; Argun, A.; Hong, C.B.; Bland, T.; Bo, S.; Conejero, J.A.; Firbas, N.; et al. Objective comparison of methods to decode anomalous diffusion. Nat. Commun. 2021, 12, 6253. [Google Scholar] [CrossRef]
  52. Thapa, S.; Park, S.; Kim, Y.; Jeon, J.-H.; Metzler, R.; A Lomholt, M. Bayesian inference of scaled versus fractional Brownian motion. J. Phys. A Math. Theor. 2022, 55, 194003. [Google Scholar] [CrossRef]
  53. Muñoz-Gil, G.; Garcia-March, M.A.; Manzo, C.; Martín-Guerrero, J.D.; Lewenstein, M. Single tra-jectory characterization via machine learning. New J. Phys. 2020, 22, 013010. [Google Scholar] [CrossRef]
Figure 1. The proposed CAD detection model.
Applsci 14 01238 g001
Figure 2. The proposed straightened artery extraction technique.
Applsci 14 01238 g002
Figure 3. The suggested feature engineering model.
Applsci 14 01238 g003
Figure 4. The Suggested Meta-model Approach.
Applsci 14 01238 g004
Figure 5. Performance analysis at different epochs.
Applsci 14 01238 g005
Figure 6. Findings of performance analysis.
Applsci 14 01238 g006
Figure 7. Findings of comparative analysis—dataset 1 [28,29,35,36,37].
Applsci 14 01238 g007
Figure 8. Findings of comparative analysis—dataset 2 [28,29,35,36,37].
Applsci 14 01238 g008
Table 1. Attributes of the datasets.
DatasetNormalAbnormalTotal Number of Images
15034971000
2118211822364
Table 2. Findings of performance analysis.
Classes/
Metrics
AccPreRecF1Kap
Dataset 1
Normal99.898.999.199.095.6
Abnormal99.799.198.898.995.8
Average99.799.098.998.995.7
Dataset 2
Normal99.698.898.798.795.7
Abnormal99.798.998.698.795.8
Average99.698.898.698.795.7
Table 3. Outcome of comparative analysis—dataset 1.
Classes/MetricsAccPreRecF1Kap
Alothman et al. [28]98.698.298.198.195.1
Wahab Sait et al. [29]99.598.998.998.996.2
Huang et al. [35]98.397.297.097.194.1
Li et al. [37]97.497.597.897.693.4
Moon et al. [36]98.597.997.697.794.7
EfficientNet B797.896.997.297.091.5
MobileNet V398.197.497.697.592.1
Proposed Model99.799.098.998.995.7
Table 4. Outcome of comparative analysis—dataset 2.
Classes/MetricsAccPreRecF1Kap
Alothman et al. [28]98.698.297.897.994.2
Wahab Sait et al. [29]99.498.598.698.795.0
Huang et al. [35]97.597.197.597.293.2
Li et al. [37]98.497.597.997.892.8
Moon et al. [36]98.597.698.297.993.8
EfficientNet B796.897.297.697.491.8
MobileNet V397.296.997.397.492.2
Proposed Model99.698.898.698.795.7
Table 5. Findings of uncertainty analysis.
Classes/MetricsDataset 1Dataset 2
LossSDCILossSDCI
Alothman et al. [28]2.70.0021[96.62–96.71]2.30.0017[98.55–98.61]
Wahab Sait et al. [29]1.90.0019[97.41–97.49]1.80.0019[98.64–98.72]
Huang et al. [35]2.40.0026[96.57–97.23]1.60.0019[97.81–98.42]
Li et al. [37]2.70.0027[95.81–96.34]2.50.0023[98.52–98.69]
Moon et al. [36]3.20.0029[95.82–98.91]2.40.0016[97.32–97.42]
EfficientNet B71.90.0035[96.13–97.15]1.70.0018[97.56–98.21]
MobileNet V32.20.0029[97.21–96.23]2.50.0021[98.12–98.26]
Proposed Model1.20.0013[98.41–98.72]1.20.0011[98.57–98.89]
Table 6. Computational strategies.
Classes/MetricsDataset 1Dataset 2
Parameters
(in Millions (M))
FLOPs
(in Giga (G))
Learning RateParameters
(in Millions (M))
FLOPs
(in Giga (G))
Learning Rate
Alothman et al. [28]5.215.91 × 10 3 4.3 16.21 × 10 3
Wahab Sait et al. [29]3.617.51 × 10 4 3.615.81 × 10 4
Huang et al. [35]6.923.51 × 10 3 8.124.61 × 10 3
Li et al. [37]7.124.91 × 10 3 9.624.81 × 10 3
Moon et al. [36]7.423.71 × 10 3 7.423.91 × 10 3
EfficientNet B74.815.81 × 10 3 5.917.81 × 10 3
MobileNet V35.112.61 × 10 4 4.813.41 × 10 4
Proposed Model3.812.11 × 10 4 4.112.51 × 10 4
Disclaimer/Publisher’s Note: The statements, opinions and data contained in all publications are solely those of the individual author(s) and contributor(s) and not of MDPI and/or the editor(s). MDPI and/or the editor(s) disclaim responsibility for any injury to people or property resulting from any ideas, methods, instructions or products referred to in the content.

