
Atomic and Electronic Structure of Metal–Salen Complexes [M(Salen)], Their Polymers and Composites Based on Them with Carbon Nanostructures: Review of X-ray Spectroscopy Studies


Abstract
1. Introduction
2. [M(Salen)] Complexes, Their Polymers, and Composites Based Thereon
2.1. Structure and Methods for Preparing [M(Salen)] Complexes and Their Polymers
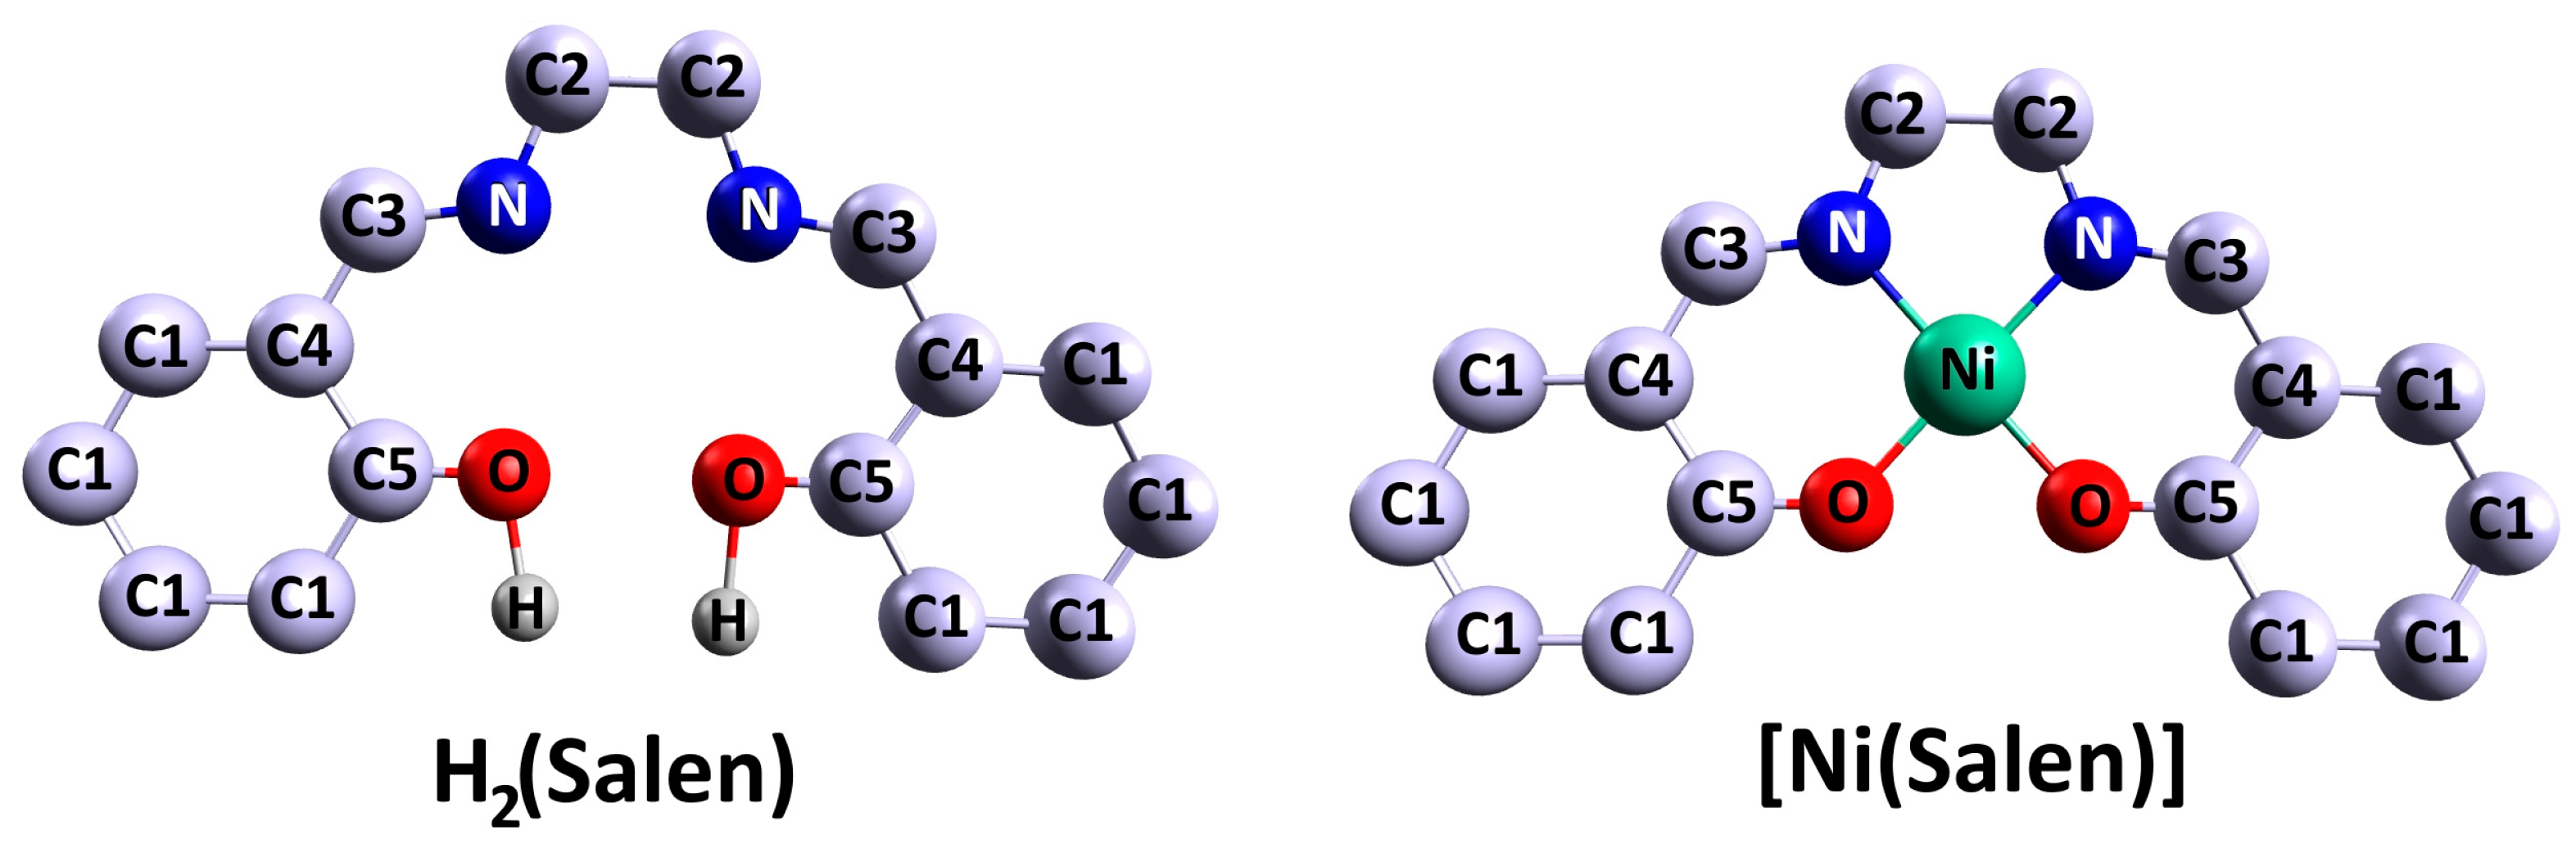
2.1.1. Monomeric Complexes
2.1.2. Polymers Prepared by Electropolymerization of [M(Salen)] Monomeric Molecules
2.2. Preparation of Composites Based on [M(Salen)] and Carbon Nanomaterials
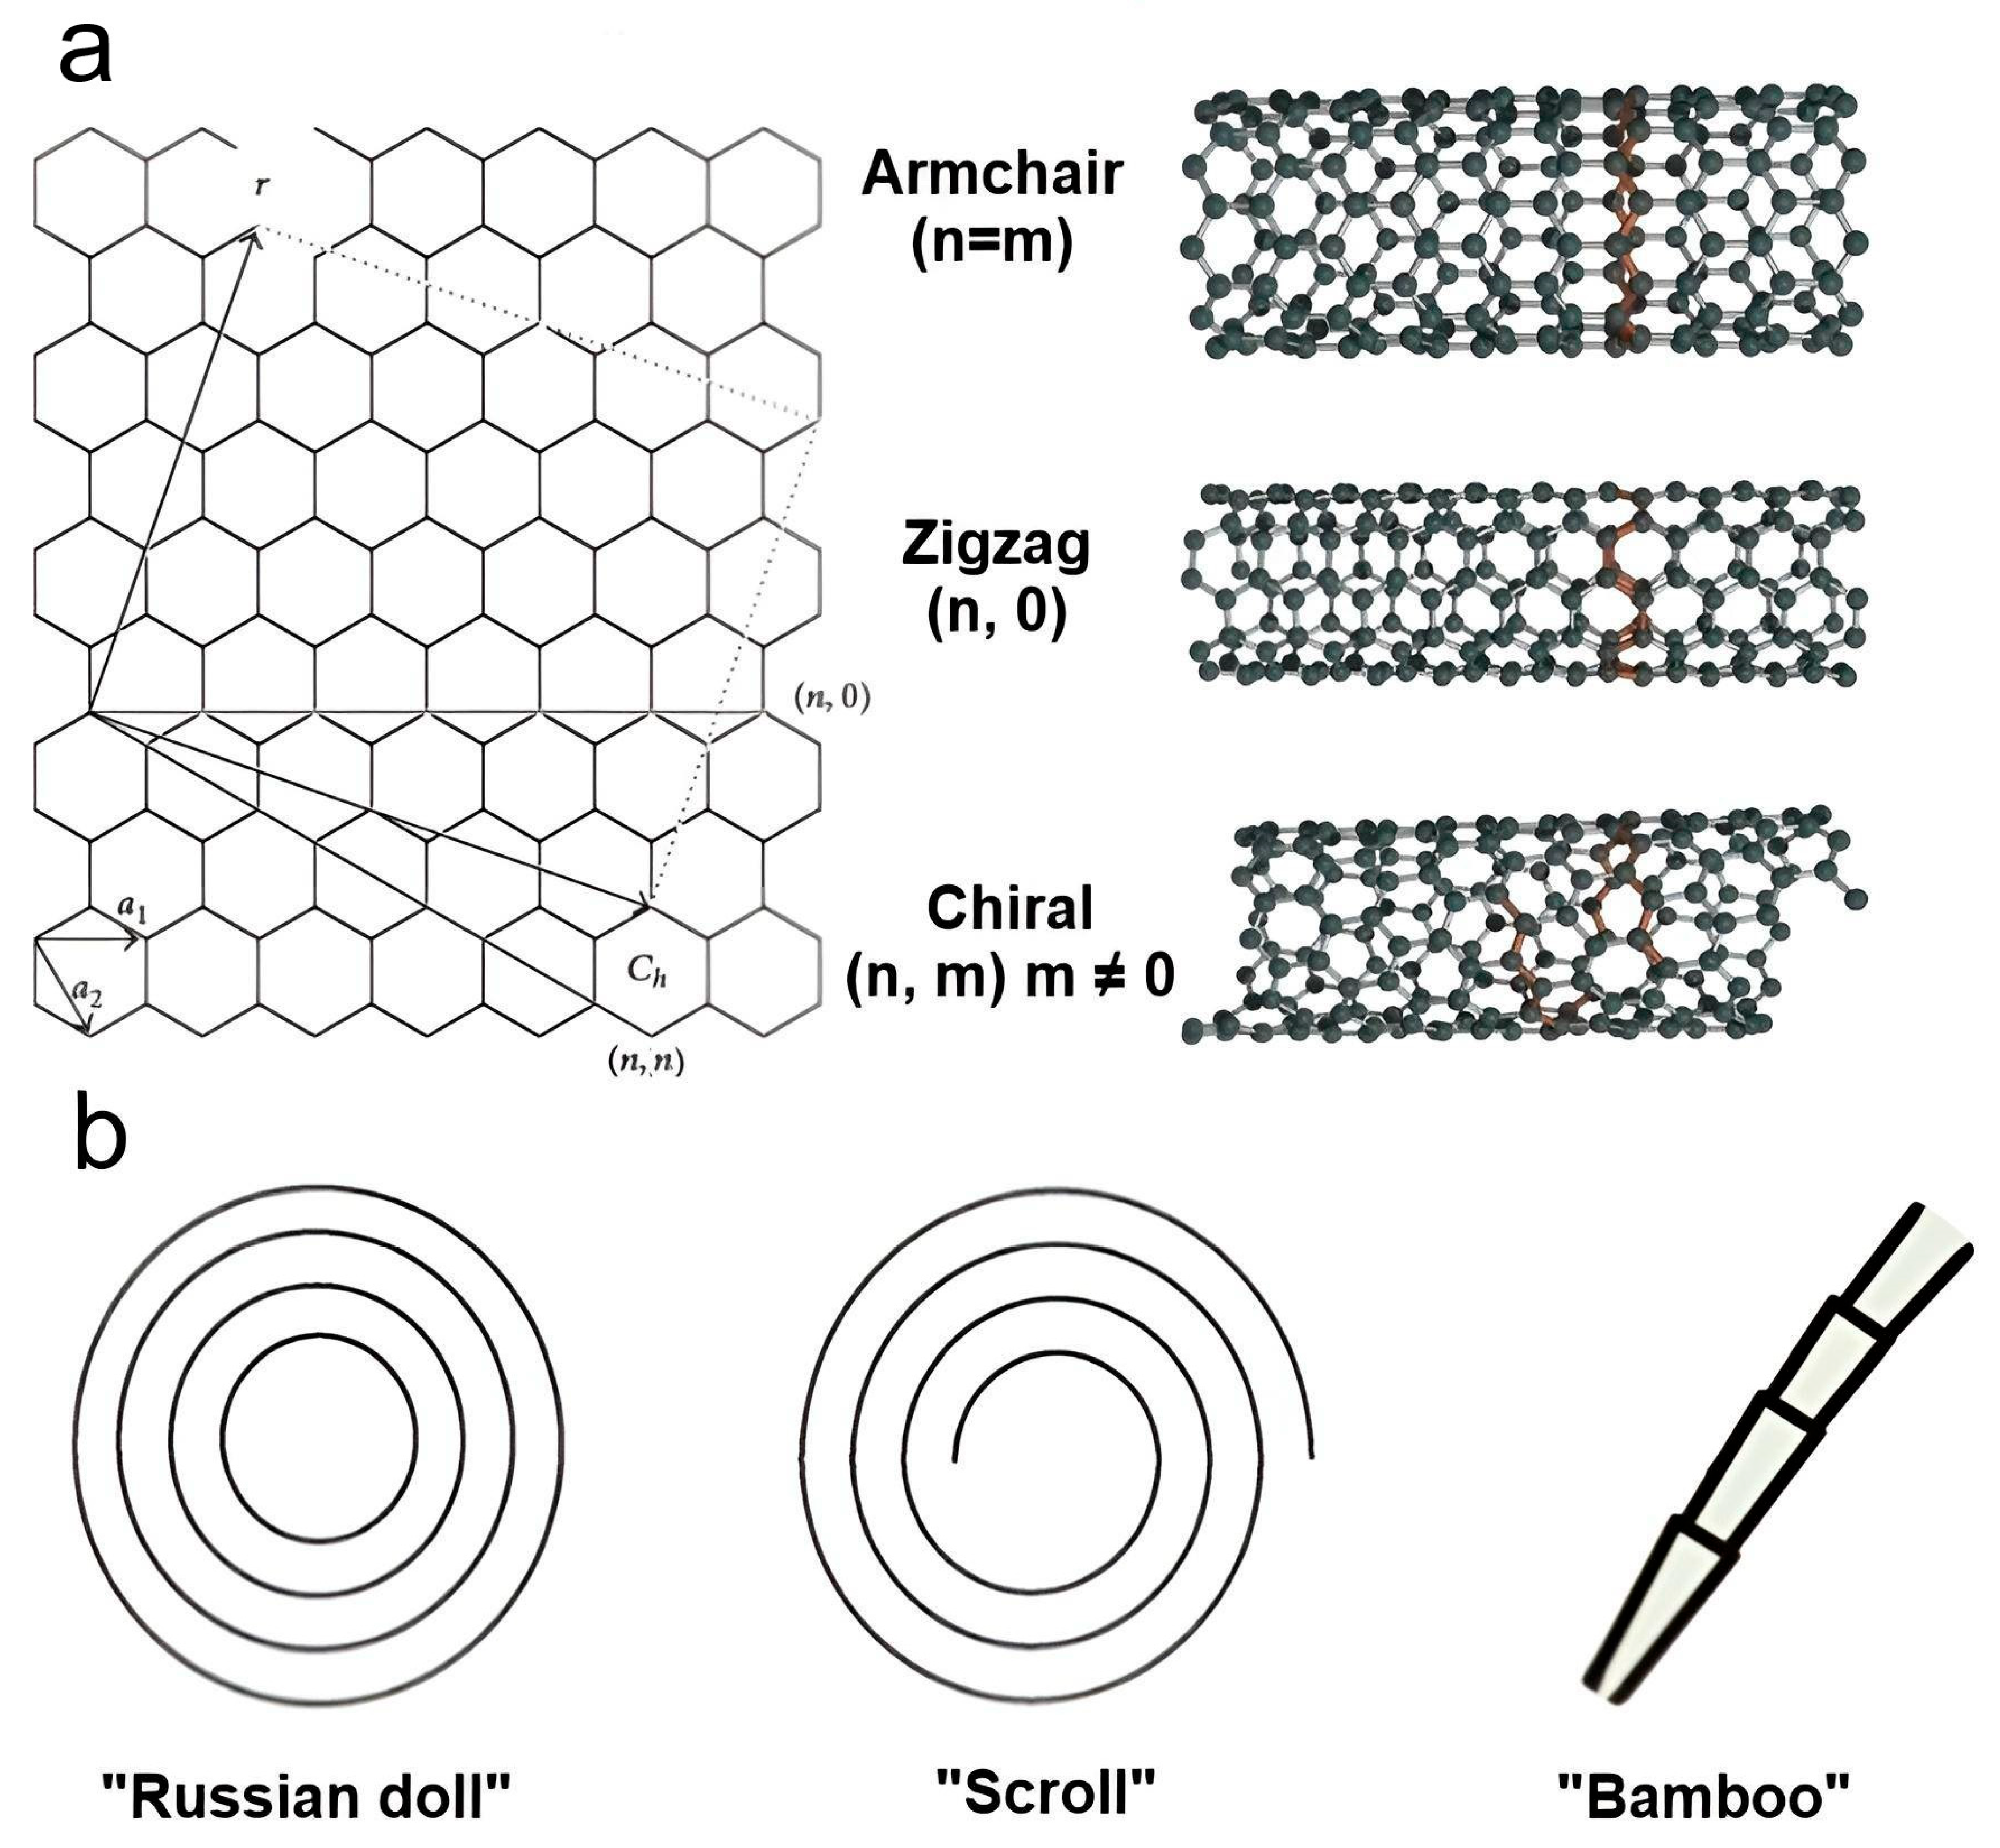
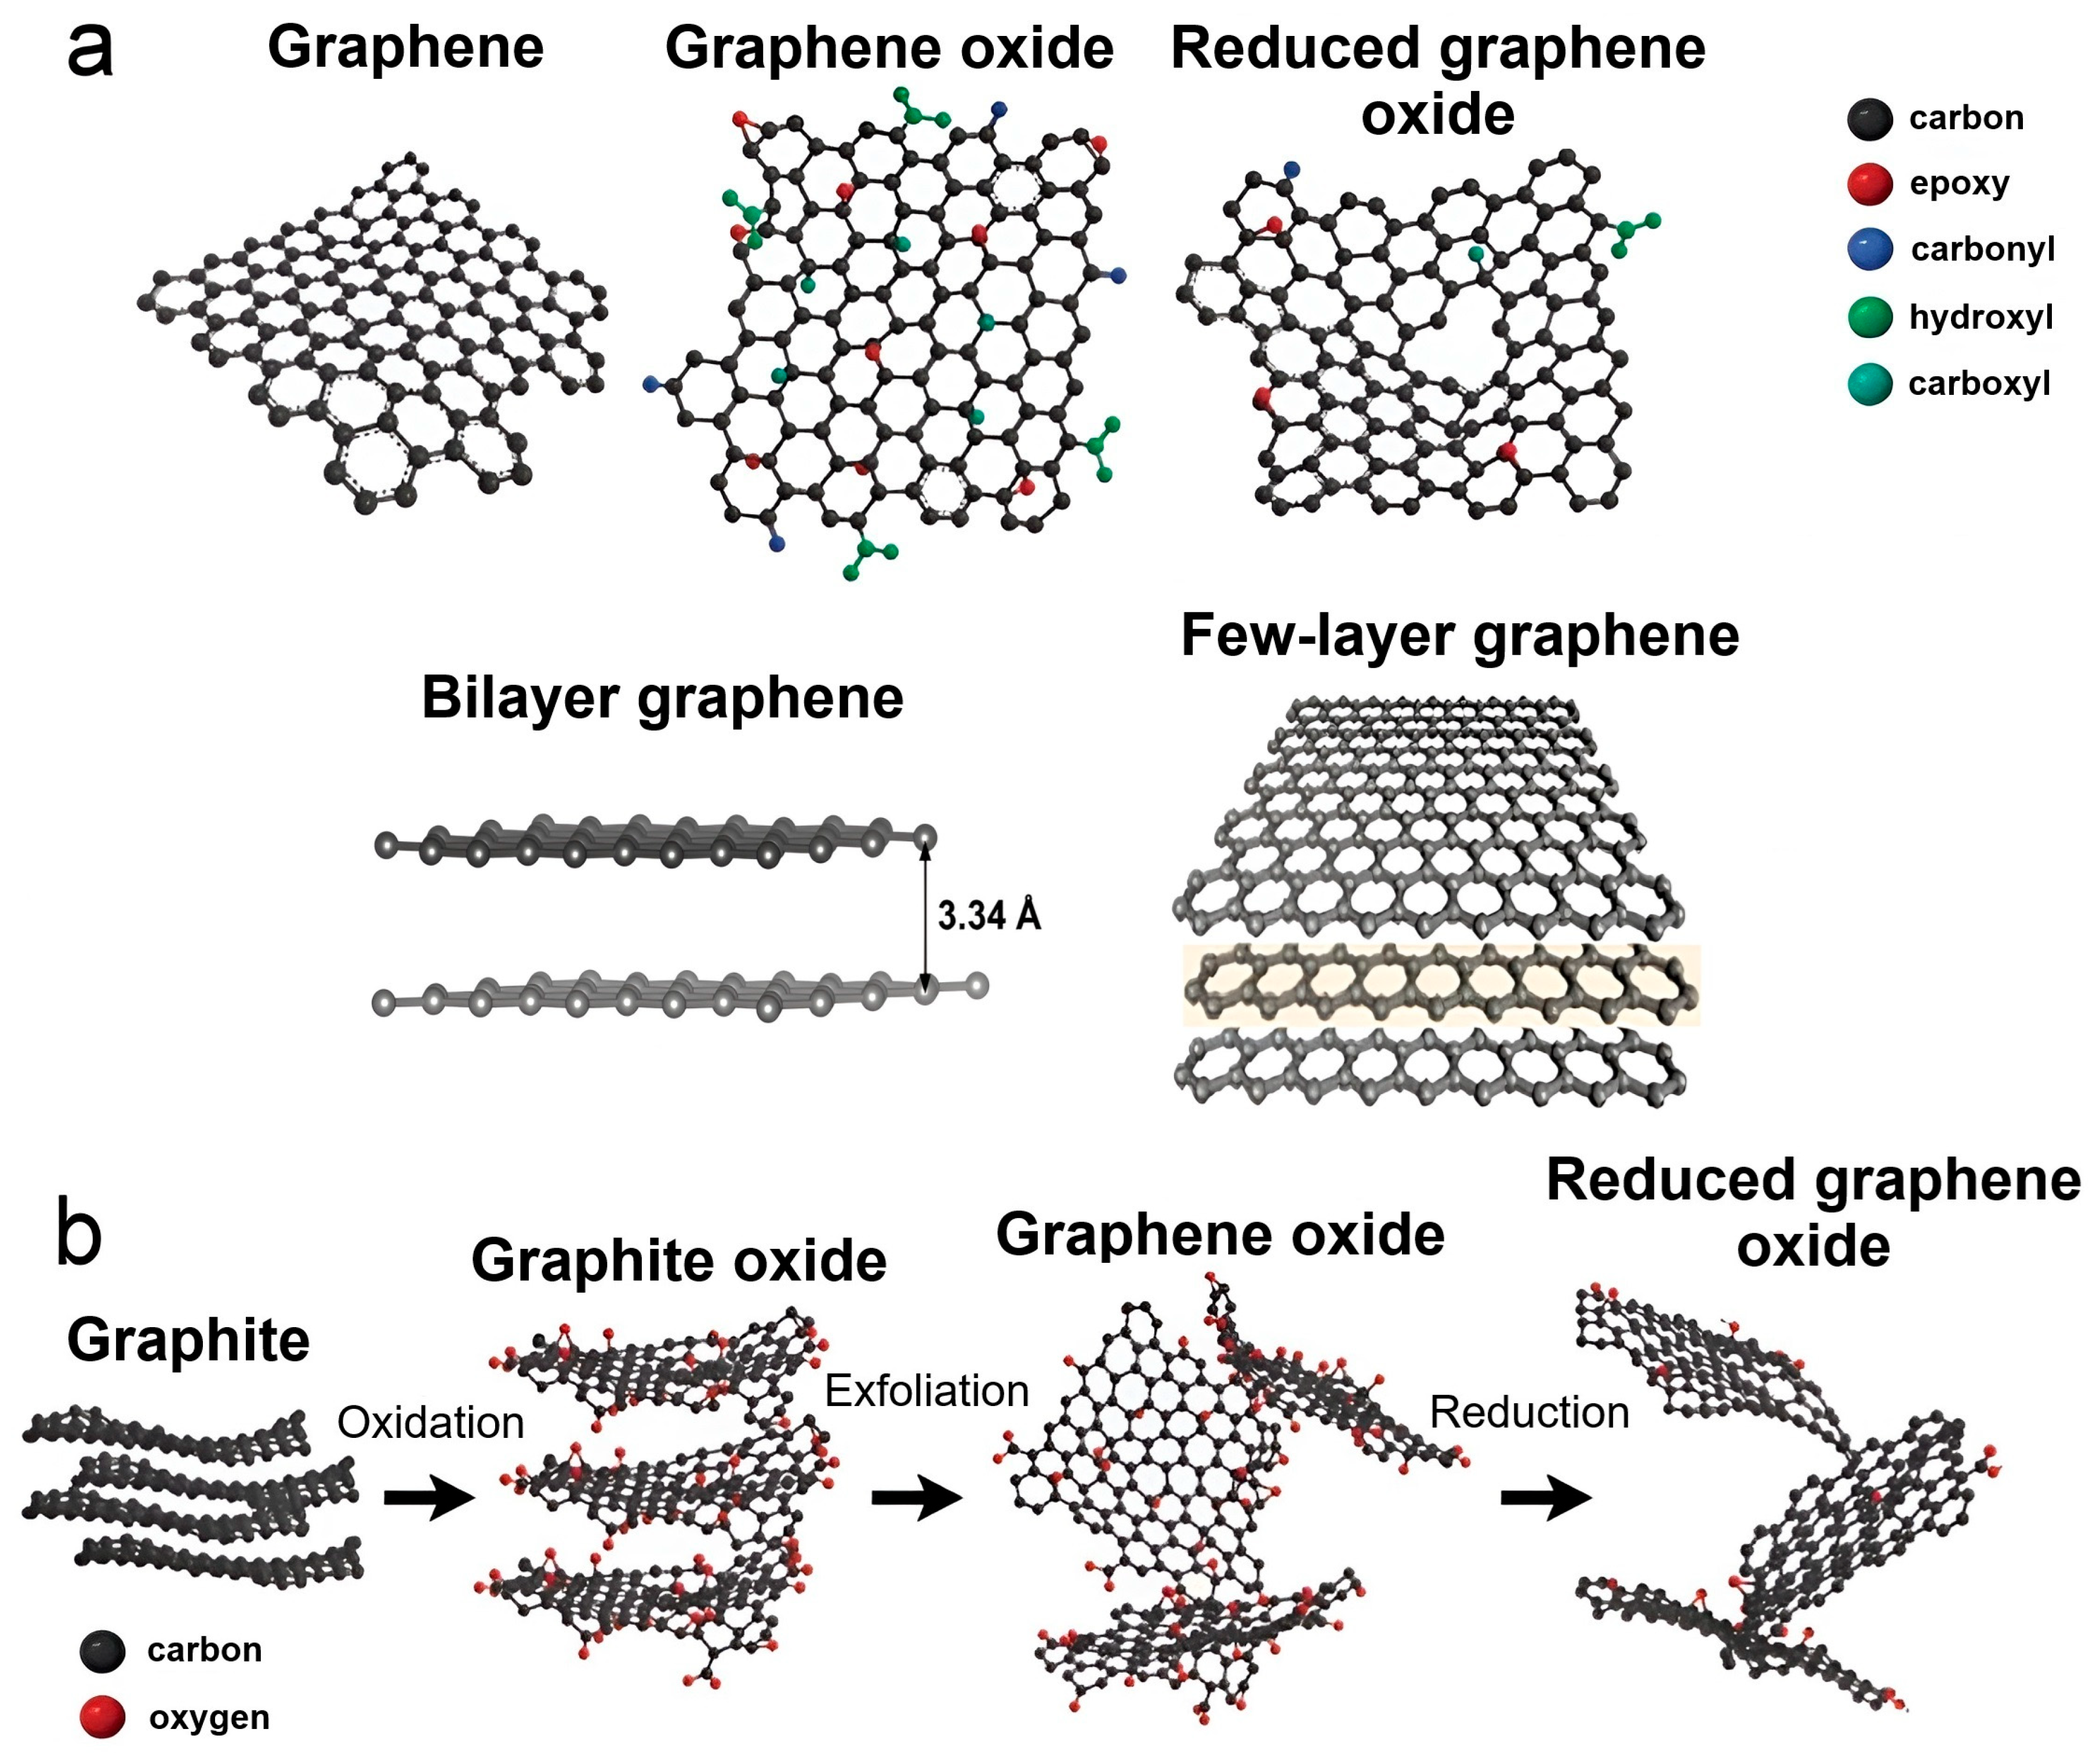
2.2.1. Nanotubes and Graphene as a Promising Basis for Composites
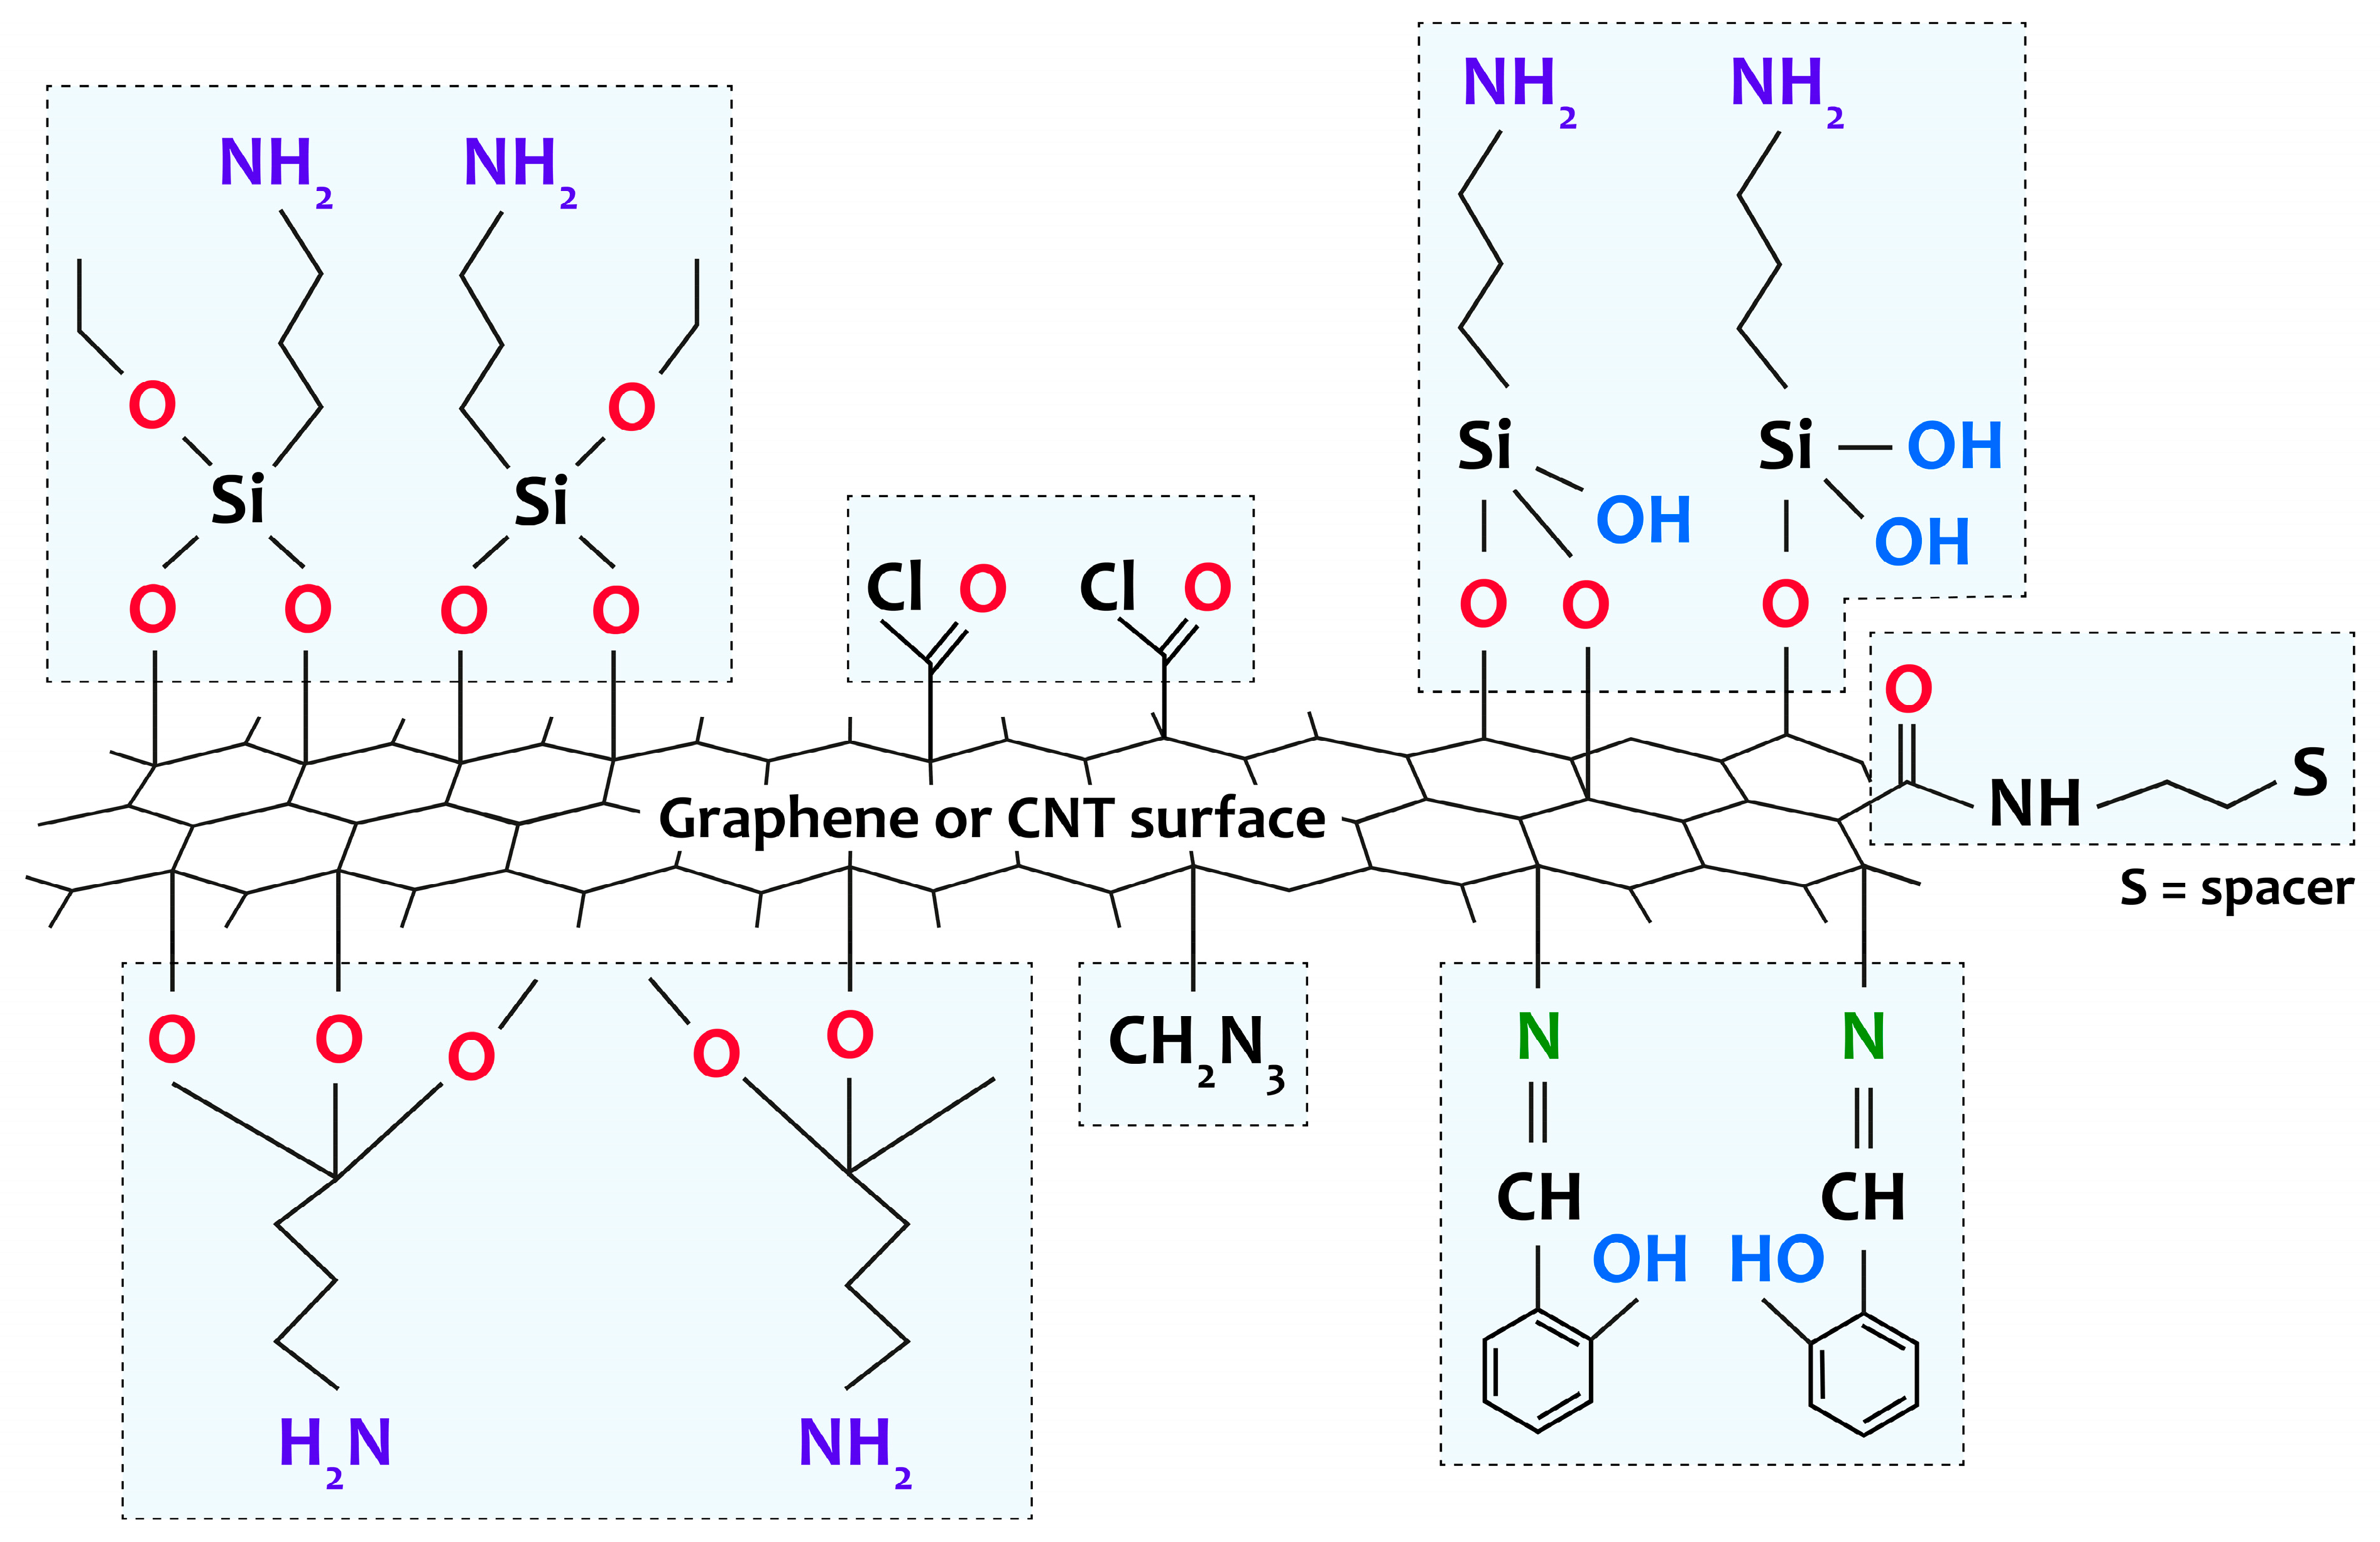
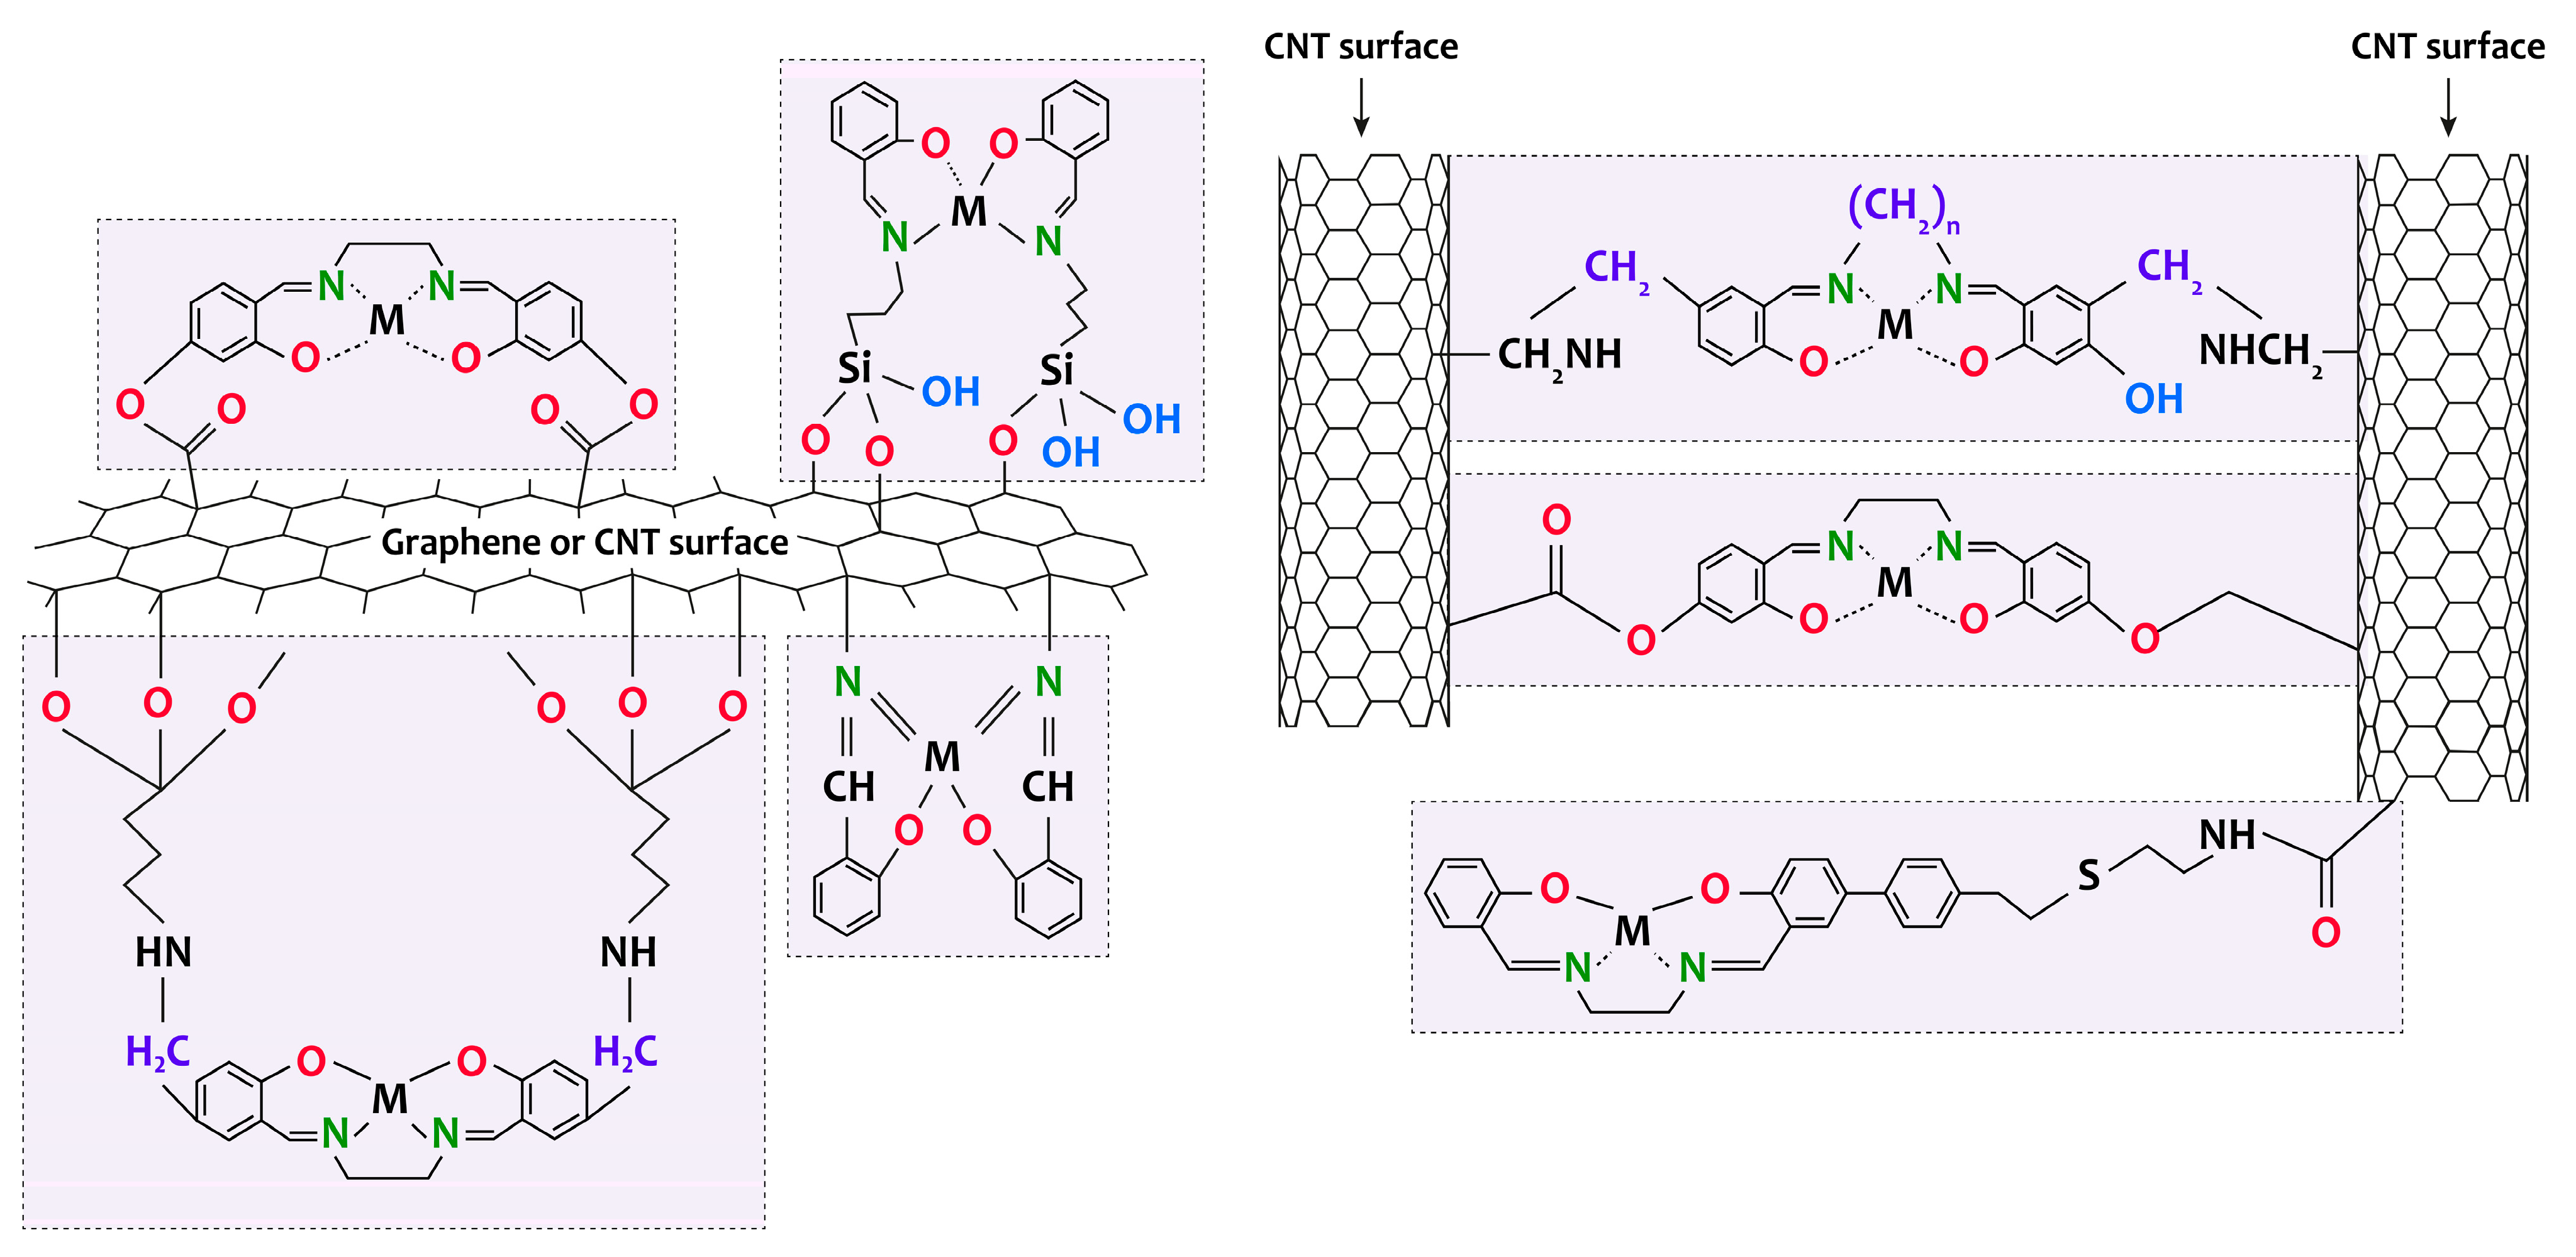
2.2.2. Features of the Formation of [M(Salen)]/Carbon Nanotubes and [M(Salen)]/Graphene Composites
3. Local Atomic and Electronic Structure of [M(Salen)] Complexes, Their Polymers, and Composites with Carbon Nanostructures: X-ray Spectroscopic Data
3.1. X-ray Spectroscopic Methods for Diagnosing Atomic and Electronic Structure
3.1.1. XPS
3.1.2. VB PES
3.1.3. NEXAFS and EXAFS
3.2. Atomic and Electronic Structure of [M(Salen)] Complexes and Their Polymers
3.2.1. XPS
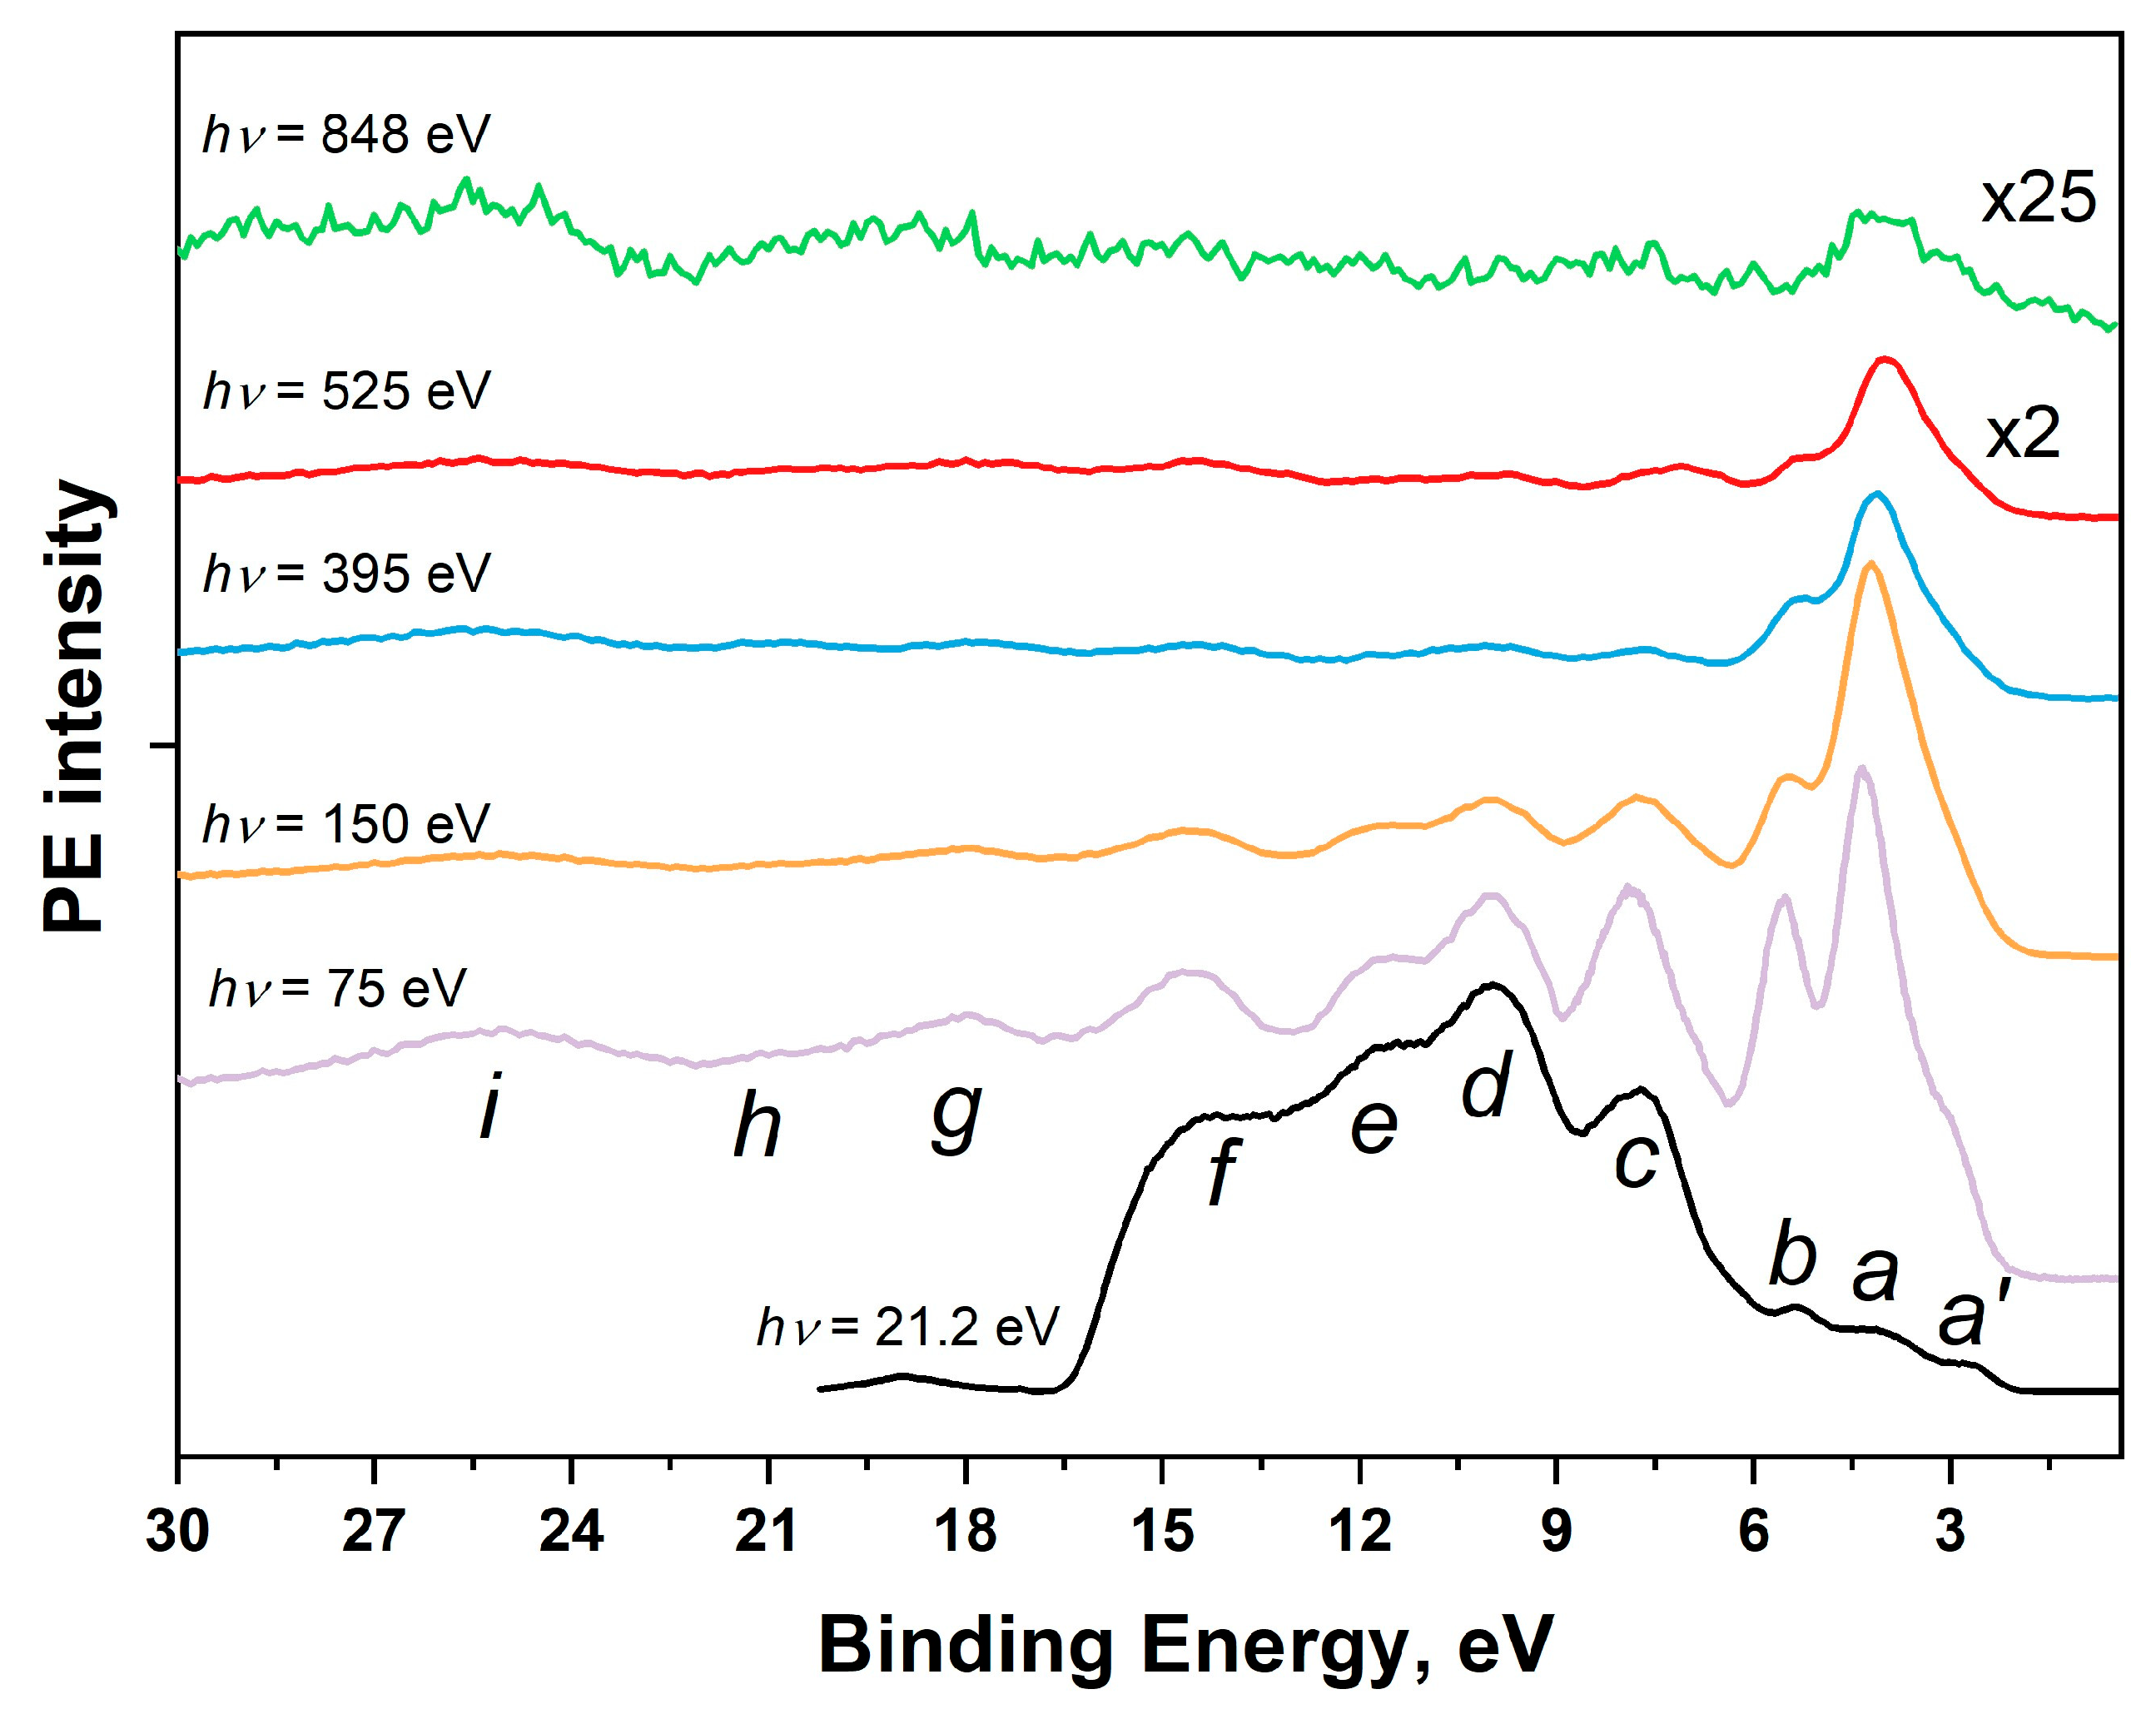
3.2.2. VB PES
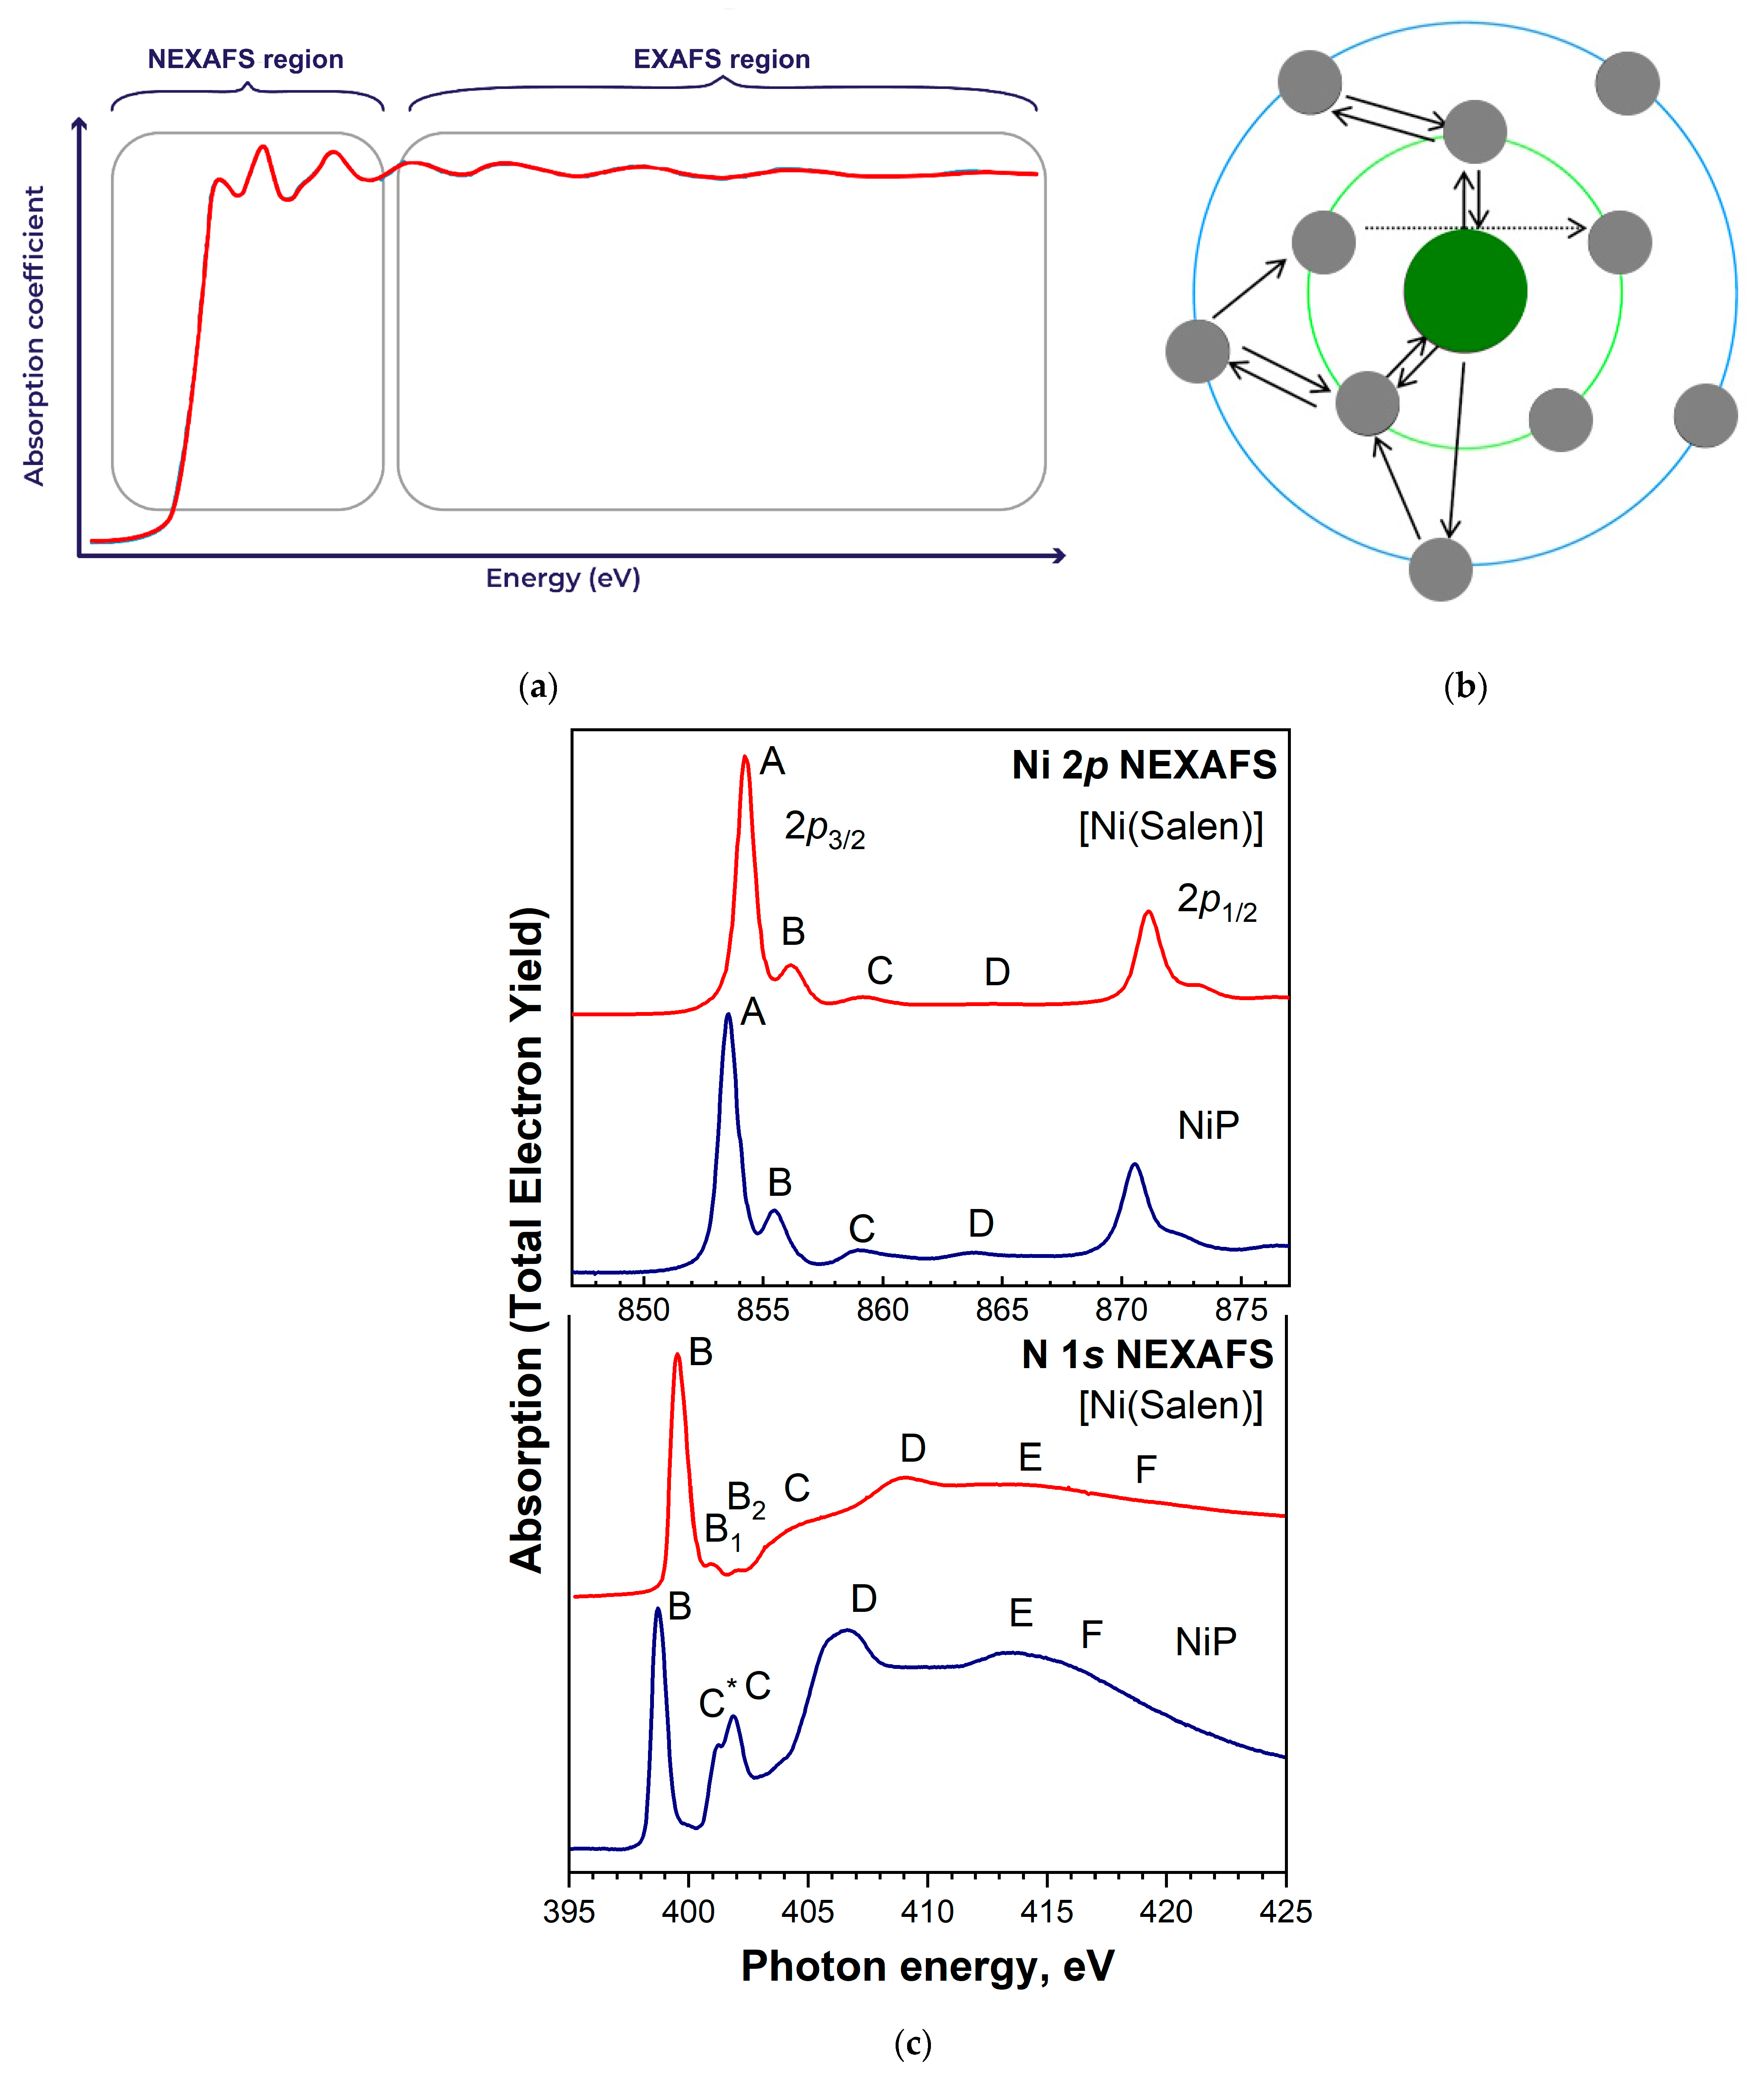
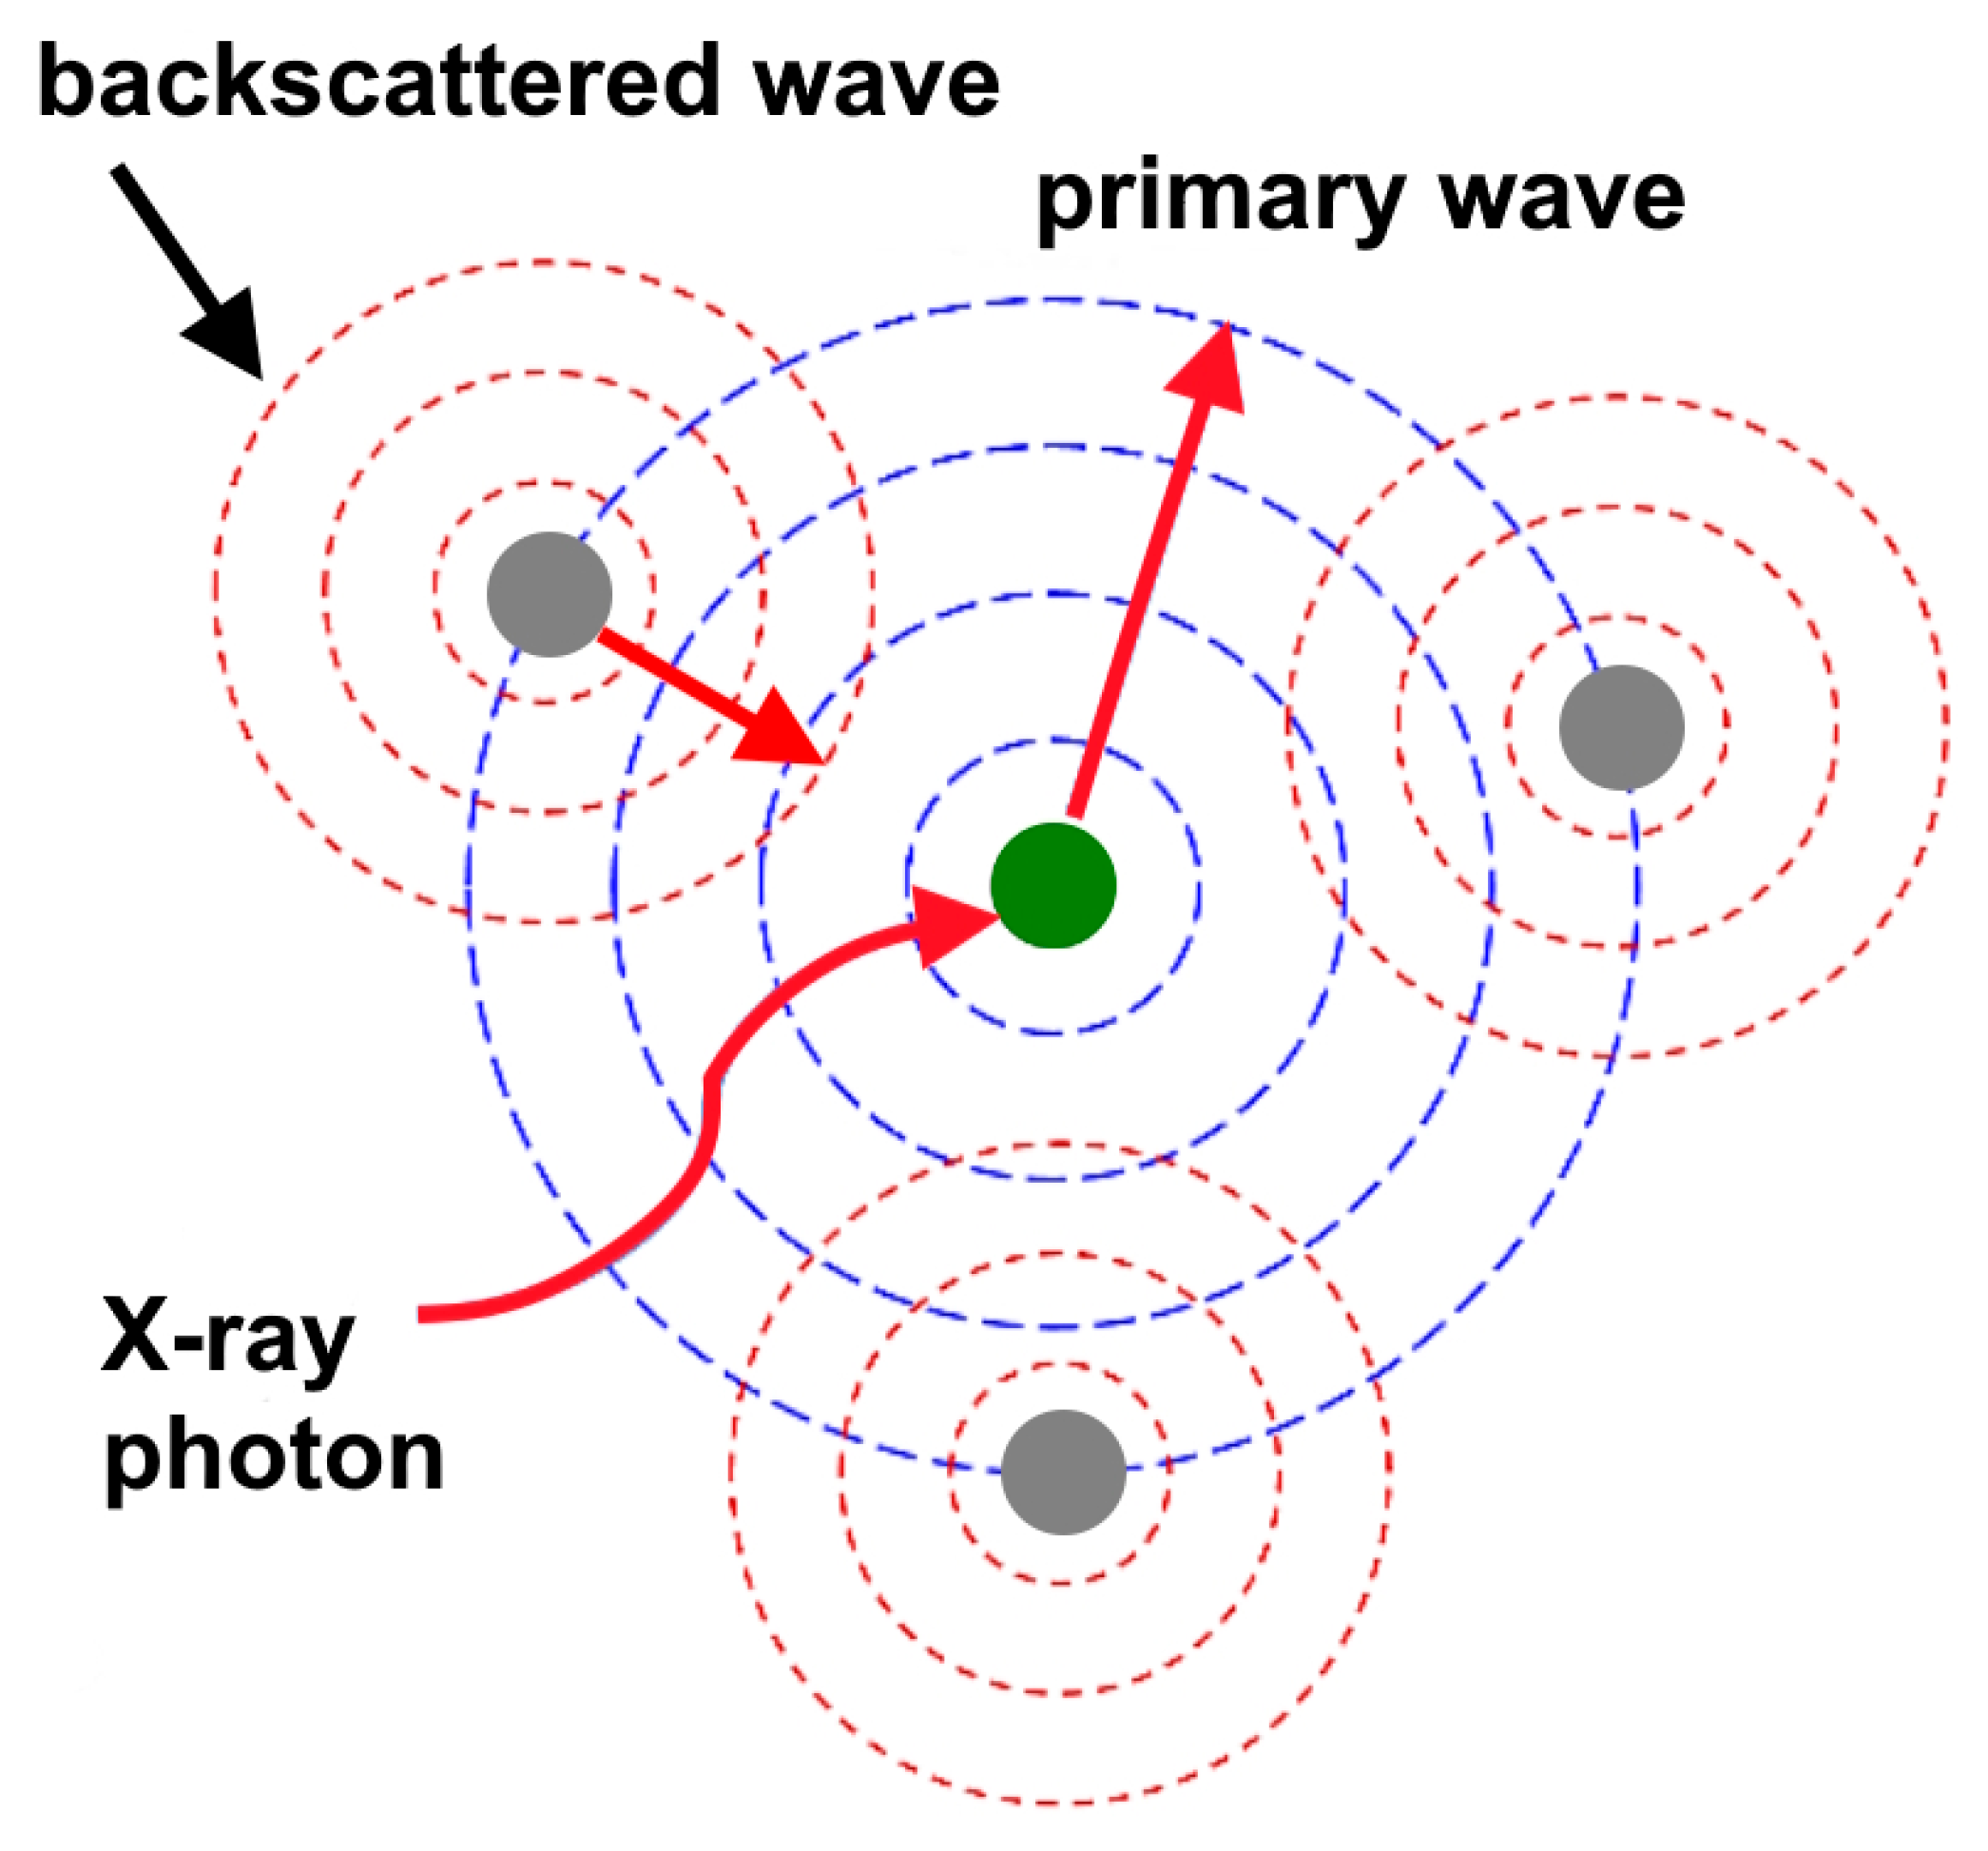
3.2.3. NEXAFS and EXAFS
3.3. Atomic and Electronic Structure of Composites Based on [M(Salen)] and Carbon Nanomaterials
4. Conclusions
Author Contributions
Funding
Data Availability Statement
Acknowledgments
Conflicts of Interest
References
- Soos, Z.; Mukhopadhyay, D.; Painelli, A.; Girlando, A. Handbook of Conducting Polymers, 2nd ed.; Revised and Expanded; CRC Press: Boca Raton, FL, USA, 1998; pp. 165–208. ISBN 0824700503. [Google Scholar]
- Leung, A.C.W.; MacLachlan, M.J. Schiff Base Complexes in Macromolecules. J. Inorg. Organomet. Polym. Mater. 2007, 17, 57–89. [Google Scholar] [CrossRef]
- Li, X.; Li, J.; Deng, F.; Kang, F. Enhanced Electrochemical Performance of Nitrogen-Doped Graphene and Poly[Ni(Salen)] Composite Electrodes for Supercapacitors. Ionics 2018, 24, 3143–3153. [Google Scholar] [CrossRef]
- Zhang, Y.; Li, J.; Gao, F.; Kang, F.; Wang, X.; Ye, F.; Yang, J. Electropolymerization and Electrochemical Performance of Salen-Type Redox Polymer on Different Carbon Supports for Supercapacitors. Electrochim. Acta 2012, 76, 1–7. [Google Scholar] [CrossRef]
- Zhu, Z.; Lu, J.; Li, X.; Xu, G.; Chen, C.; Li, J. Effects of Potential Modes on Performances of Electrodeposited Poly[Ni(Salen)]/MWCNTs Composite as Supercapacitor Electrode Material. Electrochemistry 2016, 84, 427–431. [Google Scholar] [CrossRef]
- Alekseeva, E.; Stelmashuk, T.; Ershov, V.; Levin, O. Low-Temperature Energy Storage Performance of NiSalen Type Polymer and It’s Composite with SWCNT. Electrochim. Acta 2021, 383, 138309:1–138309:10. [Google Scholar] [CrossRef]
- Li, J.L.; Gao, F.; Zhang, Y.K.; Kang, F.Y.; Wang, X.D.; Ye, F.; Yang, J. Electropolymerization of Ni(Salen) on Carbon Nanotube Carrier as a Capacitive Material by Pulse Potentiostatic Method. Sci. China Chem. 2012, 55, 1338–1344. [Google Scholar] [CrossRef]
- Chen, C.; Zhu, Z.; Li, X.; Li, J. Electropolymerization and Energy Storage of Poly[Ni(Salphen)]/MWCNT Composite Materials for Supercapacitors. J. Appl. Polym. Sci. 2017, 134, 44464:1–44464:8. [Google Scholar] [CrossRef]
- Tedim, J.; Gonçalves, F.; Pereira, M.F.R.; Figueiredo, J.L.; Moura, C.; Freire, C.; Hillman, A.R. Preparation and Characterization of Poly[Ni(Salen)(Crown Receptor)]/Multi-Walled Carbon Nanotube Composite Films. Electrochim. Acta 2008, 53, 6722–6731. [Google Scholar] [CrossRef]
- Moradi, L.; Rezaeei Bina, M.; Partovi, T. New Strategy for Chemically Attachment of Schiff Base Complexes on Multiwalled Carbon Nanotubes Surfaces. Curr. Chem. Lett. 2014, 3, 147–156. [Google Scholar] [CrossRef]
- Vasil’eva, S.V.; Balashev, K.P.; Timonov, A.M. Effects of the Nature of the Ligand and Solvent on the Electrooxidation of Complexes Formed by Nickel and Schiff’s Bases. Russ. J. Electrochem. 1998, 34, 978–983. [Google Scholar]
- Vilas-Boas, M.; Santos, I.C.; Henderson, M.J.; Freire, C.; Hillman, A.R.; Vieil, E. Electrochemical Behavior of a New Precursor for the Design of Poly[Ni(Salen)]-Based Modified Electrodes. Langmuir 2003, 19, 7460–7468. [Google Scholar] [CrossRef]
- Hamnett, A.; Abel, J.; Eameaim, J.; Christensen, P.; Timonov, A.; Vasilyeva, S. A Study of the Polymerisation and Electrochemical Cycling of Pd Methoxy- Salen Derivatives Using Fast Ellipsometry and FT-Infrared Spectroscopy. Phys. Chem. Chem. Phys. 1999, 1, 5147–5156. [Google Scholar] [CrossRef]
- Vilas-Boas, M.; Henderson, M.J.; Freire, C.; Hillman, A.R.; Vieil, E. A Combined Electrochemical Quartz-Crystal Microbalance Probe Beam Deflection (EQCM-PBD) Study of Solvent and Ion Transfers at a Poly[Ni(SaltMe)]-Modified Electrode during Redox Switching. Chem.-Eur. J. 2000, 6, 1160–1167. [Google Scholar] [CrossRef]
- Krasikova, S.A.; Besedina, M.A.; Karushev, M.P.; Dmitrieva, E.A.; Timonov, A.M. In Situ Electrochemical Microbalance Studies of Polymerization and Redox Processes in Polymeric Complexes of Transition Metals with Schiff Bases. Russ. J. Electrochem. 2010, 46, 218–226. [Google Scholar] [CrossRef]
- Dmitrieva, E.A.; Logvinov, S.A.; Kurdakova, V.V.; Kondrat’ev, V.V.; Malev, V.V.; Timonov, A.M. Redox Polymer Poly-N,N′-2,3-Dimethylbutane-2,3-Diyl-Bis(Salicylideniminato)Nickel: An Impedance Spectroscopy Study. Russ. J. Electrochem. 2005, 41, 381–387. [Google Scholar] [CrossRef]
- Yan, G.; Li, J.; Zhang, Y.; Gao, F.; Kang, F. Electrochemical Polymerization and Energy Storage for Poly[Ni(Salen)] as Supercapacitor Electrode Material. J. Phys. Chem. C 2014, 118, 9911–9917. [Google Scholar] [CrossRef]
- Girichev, G.V.; Giricheva, N.I.; Kuzmina, N.P.; Levina, Y.S.; Rogachev, A.Y. Molecular Structure of NiO2N2C16H14 from Gas-Phase Electron Diffraction and Quantum Chemical Data. J. Struct. Chem. 2005, 46, 813–823. [Google Scholar] [CrossRef]
- Goldsby, K.A.; Blaho, J.K.; Hoferkamp, L.A. Oxidation of Nickel(II) Bis(Salicylaldimine) Complexes: Solvent Control of the Ultimate Redox Site. Polyhedron 1989, 8, 113–115. [Google Scholar] [CrossRef]
- Hoferkamp, L.A.; Goldsby, K.A. Surface-Modified Electrodes Based on Nickel(II) and Copper(II) Bis(Salicylaldimine) Complexes. Chem. Mater. 1989, 1, 348–352. [Google Scholar] [CrossRef]
- Vasil’ev, V.; Popeko, I.E.; Timonov, A.; Shagisultanova, G.A. The Electrochemical Behavior of Palladium(II) Complexes with Schift Bases and the Synthesis of a Mixed-Valence Pd(II)-Pd(IV) Complex. Russ. J. Inorg. Chem. 1990, 35, 523–525. [Google Scholar]
- Dahm, C.E.; Peters, D.G.; Simonet, J. Electrochemical and Spectroscopic Characterization of Anodically Formed Nickel Salen Polymer Films on Glassy Carbon, Platinum, and Optically Transparent Tin Oxide Electrodes in Acetonitrile Containing Tetramethylammonium Tetrafluoroborate. J. Electroanal. Chem. 1996, 410, 163–171. [Google Scholar] [CrossRef]
- Audebert, P.; Capdevielle, P.; Maumy, M. Redox and Conducting Polymers Based on Salen-Type Metal Units; Electrochemical Study and Some Characteristics. New J. Chem. 1992, 16, 697–703. [Google Scholar]
- Vilas-Boas, M.; Freire, C.; De Castro, B.; Christensen, P.A.; Hillman, A.R. New Insights into the Structure and Properties of Electroactive Polymer Films Derived from [Ni(Salen)]. Inorg. Chem. 1997, 36, 4919–4929. [Google Scholar] [CrossRef]
- Vilas-Boas, M.; Freire, C.; de Castro, B.; Christensen, P.A.; Hillman, A.R. Spectroelectrochemical Characterisation of Poly[Ni(SaltMe)]-Modified Electrodes. Chemistry 2001, 7, 139–150. [Google Scholar] [CrossRef]
- Semenistaya, T.V.; Shagisultanova, G.A. Synthesis of New Cu(II), Ni(II), Pd(II), and Pt(II) Complexes and Conducting Photosensitive Polymers Based on Them. Russ. J. Inorg. Chem. 2003, 48, 520–527. [Google Scholar]
- Tedim, J.; Carneiro, A.; Bessada, R.; Patrício, S.; Magalhães, A.L.; Freire, C.; Gurman, S.J.; Hillman, A.R. Correlating Structure and Ion Recognition Properties of [Ni(Salen)]-Based Polymer Films. J. Electroanal. Chem. 2007, 610, 46–56. [Google Scholar] [CrossRef]
- Mukherjee, P.; Biswas, C.; Drew, M.G.B.; Ghosh, A. Structural Variations in Ni(II) Complexes of Salen Type Di-Schiff Base Ligands. Polyhedron 2007, 26, 3121–3128. [Google Scholar] [CrossRef]
- Storr, T.; Wasinger, E.C.; Pratt, R.C.; Stack, T.D.P. The Geometric and Electronic Structure of a One-Electron-Oxidized Nickel(II) Bis(Salicylidene)Diamine Complex. Angew. Chem.-Int. Ed. 2007, 46, 5198–5201. [Google Scholar] [CrossRef]
- Tedim, J.; Bessada, R.; Patrício, S.; Magalhães, A.L.; Freire, C.; Gorman, S.J.; Hillman, A.R. Unusual Coordination Environment for Barium Cations in Ion Recognition Conducting Poly[Ni(Salen)(Receptor)] Films. Langmuir 2008, 24, 8998–9005. [Google Scholar] [CrossRef]
- Shimazaki, Y.; Arai, N.; Dunn, T.J.; Yajima, T.; Tani, F.; Ramogida, C.F.; Storr, T. Influence of the Chelate Effect on the Electronic Structure of One-Electron Oxidized Group 10 Metal(Ii)-(Disalicylidene)Diamine Complexes. Dalton Trans. 2011, 40, 2469–2479. [Google Scholar] [CrossRef]
- Tedim, J.; Patrício, S.; Fonseca, J.; Magalhães, A.L.; Moura, C.; Hillman, A.R.; Freire, C. Modulating Spectroelectrochemical Properties of [Ni(Salen)] Polymeric Films at Molecular Level. Synth. Met. 2011, 161, 680–691. [Google Scholar] [CrossRef]
- Levin, O.V.; Karushev, M.P.; Timonov, A.M.; Alekseeva, E.V.; Zhang, S.; Malev, V.V. Charge Transfer Processes on Electrodes Modified by Polymer Films of Metal Complexes with Schiff Bases. Electrochim. Acta 2013, 109, 153–161. [Google Scholar] [CrossRef]
- Sizov, V.V.; Novozhilova, M.V.; Alekseeva, E.V.; Karushev, M.P.; Timonov, A.M.; Eliseeva, S.N.; Vanin, A.A.; Malev, V.V.; Levin, O.V. Redox Transformations in Electroactive Polymer Films Derived from Complexes of Nickel with SalEn-Type Ligands: Computational, EQCM, and Spectroelectrochemical Study. J. Solid State Electrochem. 2015, 19, 453–468. [Google Scholar] [CrossRef]
- Nunes, M.; Araújo, M.; Fonseca, J.; Moura, C.; Hillman, R.; Freire, C. High-Performance Electrochromic Devices Based on Poly[Ni(Salen)]-Type Polymer Films. ACS Appl. Mater. Interfaces 2016, 8, 14231–14243. [Google Scholar] [CrossRef]
- Vereshchagin, A.A.; Sizov, V.V.; Verjuzhskij, M.S.; Hrom, S.I.; Volkov, A.I.; Danilova, J.S.; Novozhilova, M.V.; Laaksonen, A.; Levin, O.V. Interaction of Amines with Electrodes Modified by Polymeric Complexes of Ni with Salen-Type Ligands. Electrochim. Acta 2016, 211, 726–734. [Google Scholar] [CrossRef]
- Nunes, M.; Araújo, M.; Bacsa, R.; Ferreira, R.V.; Castillejos, E.; Serp, P.; Hillman, A.R.; Freire, C. N-Doped Few-Layered Graphene-PolyNi Complex Nanocomposite with Excellent Electrochromic Properties. Carbon 2017, 120, 32–43. [Google Scholar] [CrossRef]
- Alekseeva, E.V.; Chepurnaya, I.A.; Malev, V.V.; Timonov, A.M.; Levin, O.V. Polymeric Nickel Complexes with Salen-Type Ligands for Modification of Supercapacitor Electrodes: Impedance Studies of Charge Transfer and Storage Properties. Electrochim. Acta 2017, 225, 378–391. [Google Scholar] [CrossRef]
- Shagisultanova, G.A.; Shchukarev, A.V.; Semenistaya, T.V. Possibilities of X-ray Photoelectron Spectroscopy in Studying the Structure and Properties of Polymers Based on Transition Metal Complexes with Schiff Bases. Russ. J. Inorg. Chem. 2005, 50, 912–924. [Google Scholar]
- Fonseca, J.; Tedim, J.; Biernacki, K.; Magalhães, A.L.; Gurman, S.J.; Freire, C.; Hillman, A.R. Structural and Electrochemical Characterisation of [Pd(Salen)]-Type Conducting Polymer Films. Electrochim. Acta 2010, 55, 7726–7736. [Google Scholar] [CrossRef]
- Dmitrieva, E.; Rosenkranz, M.; Danilova, J.S.; Smirnova, E.A.; Karushev, M.P.; Chepurnaya, I.A.; Timonov, A.M. Radical Formation in Polymeric Nickel Complexes with N2O2 Schiff Base Ligands: An in Situ ESR and UV–Vis–NIR Spectroelectrochemical Study. Electrochim. Acta 2018, 283, 1742–1752. [Google Scholar] [CrossRef]
- Chen, C.; Li, X.; Deng, F.; Li, J. Electropolymerization and Electrochemical Behavior of Nickel Schiff Base Complexes with Different Groups between Imine Linkages. RSC Adv. 2016, 6, 79894–79899. [Google Scholar] [CrossRef]
- Alekseeva, E.V.; Vereshchagin, A.A.; Novozhilova, M.V.; Panjwani, N.A.; Novoselova, J.V.; Lukyanov, D.A.; Beletskii, E.V.; Behrends, J.; Sizov, V.V.; Levin, O.V. Uncovering the Mechanism of Water-Promoted Electrochemical Degradation of NiSalen Polymers. J. Electroanal. Chem. 2023, 935, 117310:1–117310:16. [Google Scholar] [CrossRef]
- Vereschagin, A.A.; Sizov, V.V.; Vlasov, P.S.; Alekseeva, E.V.; Konev, A.S.; Levin, O.V. Water-Stable [Ni(Salen)]-Type Electrode Material Based on Phenylazosubstituted Salicylic Aldehyde Imine Ligand. New J. Chem. 2017, 41, 13918–13928. [Google Scholar] [CrossRef]
- Svirskiy, G.I.; Generalov, A.V.; Vinogradov, N.A.; Brykalova, X.O.; Vereshchagin, A.V.; Levin, O.V.; Lyalin, A.G.; Preobrajenski, A.B.; Vinogradov, A.S. Electronic Structure of the [Ni(Salen)] Complex Studied by Core-Level Spectroscopies. Phys. Chem. Chem. Phys. 2021, 23, 11015–11027. [Google Scholar] [CrossRef] [PubMed]
- Korusenko, P.M.; Petrova, O.V.; Vereshchagin, A.A.; Katin, K.P.; Levin, O.V.; Nekipelov, S.V.; Sivkov, D.V.; Sivkov, V.N.; Vinogradov, A.S. A Comparative XPS, UV PES, NEXAFS, and DFT Study of the Electronic Structure of the Salen Ligand in the H2(Salen) Molecule and the [Ni(Salen)] Complex. Int. J. Mol. Sci. 2023, 24, 9868. [Google Scholar] [CrossRef]
- Chepurnaya, I.A.; Logvinov, S.A.; Karushev, M.P.; Timonov, A.M.; Malev, V.V. Modification of Supercapacitor Electrodes with Polymer Metallocomplexes: Methods and Results. Russ. J. Electrochem. 2012, 48, 538–544. [Google Scholar] [CrossRef]
- Li, X.; Li, J.; Kang, F. Enhanced Electrochemical Performance of Salen-Type Transition Metal Polymer with Electron-Donating Substituents. Ionics 2019, 25, 1045–1055. [Google Scholar] [CrossRef]
- Deng, F.; Li, X.; Ding, F.; Niu, B.; Li, J. Pseudocapacitive Energy Storage in Schiff Base Polymer with Salphen-Type Ligands. J. Phys. Chem. C 2018, 122, 5325–5333. [Google Scholar] [CrossRef]
- Burness, J.H.; Dillard, J.G.; Taylor, L.T. An X-ray Photoelectron Spectroscopic Study of Cobalt(II) Schiff Base Complexes and Their Oxygenation Products. J. Am. Chem. Soc. 1975, 97, 6080–6088. [Google Scholar] [CrossRef]
- Dillard, J.G.; Taylor, L.T. X-ray Photoelectron Spectroscopic Study of Schiff Base Metal Complexes. J. Electron. Spectros Relat. Phenom. 1974, 3, 455–460. [Google Scholar] [CrossRef]
- Kshirsagar, V.S.; Garade, A.C.; Mane, R.B.; Patil, K.R.; Yamaguchi, A.; Shirai, M.; Rode, C.V. Characterization of Clay Intercalated Cobalt-Salen Catalysts for the Oxidation of p-Cresol. Appl. Catal. A Gen. 2009, 370, 16–23. [Google Scholar] [CrossRef]
- Korusenko, P.M.; Koroleva, A.V.; Vereshchagin, A.A.; Sivkov, D.V.; Petrova, O.V.; Levin, O.V.; Vinogradov, A.S. The Valence Band Structure of the [Ni(Salen)] Complex: An Ultraviolet, Soft X-ray and Resonant Photoemission Spectroscopy Study. Int. J. Mol. Sci. 2022, 23, 6207. [Google Scholar] [CrossRef]
- Gaur, A.; Shrivastava, B.D.; Srivastava, K.; Prasad, J.; Singh, S.K. XAFS Investigations of Copper(II) Complexes with Tetradentate Schiff Base Ligands. X-ray Spectrom. 2012, 41, 384–392. [Google Scholar] [CrossRef]
- Johnson, C.; Long, B.; Nguyen, J.G.; Day, V.W.; Borovik, A.S.; Subramaniam, B.; Guzman, J. Correlation between Active Center Structure and Enhanced Dioxygen Binding in Co(Salen) Nanoparticles: Characterization by in Situ Infrared, Raman, and X-ray Absorption Spectroscopies. J. Phys. Chem. C 2008, 112, 12272–12281. [Google Scholar] [CrossRef]
- Storr, T.; Verma, P.; Pratt, R.C.; Wasinger, E.C.; Shimazaki, Y.; Stack, T.D.P. Defining the Electronic and Geometric Structure of One-Electron Oxidized Copper-Bis-Phenoxide Complexes. J. Am. Chem. Soc. 2008, 130, 15448–15459. [Google Scholar] [CrossRef] [PubMed]
- Sliznev, V.V.; Girichev, G.V. A Theoretical Study of Keto-Enol Isomerism and Internal Rotation in the H2Salen Molecule, N,N′-Ethylene-Bis(Salicylidenimine)—Schiff Base. J. Struct. Chem. 2011, 52, 16–26. [Google Scholar] [CrossRef]
- Freire, C.; Nunes, M.; Pereira, C.; Fernandes, D.M.; Peixoto, A.F.; Rocha, M. Metallo(Salen) Complexes as Versatile Building Blocks for the Fabrication of Molecular Materials and Devices with Tuned Properties. Coord. Chem. Rev. 2019, 394, 104–134. [Google Scholar] [CrossRef]
- Clarke, R.M.; Herasymchuk, K.; Storr, T. Electronic Structure Elucidation in Oxidized Metal–Salen Complexes. Coord. Chem. Rev. 2017, 352, 67–82. [Google Scholar] [CrossRef]
- Sunday Nworie, F. Bis(Salicylidene)Ethylenediamine(Salen) and Bis(Salicylidene)Ethylenediamine-Metal Complexes: From Structure to Biological Activity. J. Anal. Pharm. Res. 2016, 3, 00076. [Google Scholar] [CrossRef]
- Chepurnaya, I.A.; Karushev, M.P.; Alekseeva, E.V.; Lukyanov, D.A.; Levin, O.V. Redox-Conducting Polymers Based on Metal- Salen Complexes for Energy Storage Applications. Pure Appl. Chem. 2020, 92, 1239–1258. [Google Scholar] [CrossRef]
- Shagisultanova, G.A.; Ardasheva, L.P. Electrochemical Synthesis of Thin Films of Polymers Derived from [NiSalen] and [NiSalphen]. Russ. J. Appl. Chem. 2003, 76, 1626–1630. [Google Scholar] [CrossRef]
- Egbedina, A.O.; Bolade, O.P.; Ewuzie, U.; Lima, E.C. Emerging Trends in the Application of Carbon-Based Materials: A Review. J. Environ. Chem. Eng. 2022, 10, 107260. [Google Scholar] [CrossRef]
- Ouyang, J. Applications of Carbon Nanotubes and Graphene for Third-Generation Solar Cells and Fuel Cells. Nano Mater. Sci. 2019, 1, 77–90. [Google Scholar] [CrossRef]
- Yuan, W.; Zhang, Y.; Cheng, L.; Wu, H.; Zheng, L.; Zhao, D. The Applications of Carbon Nanotubes and Graphene in Advanced Rechargeable Lithium Batteries. J. Mater. Chem. A Mater. 2016, 4, 8932–8951. [Google Scholar] [CrossRef]
- Gopiraman, M.; Soo Kim, I. Carbon Nanocomposites: Preparation and Its Application in Catalytic Organic Transformations. In Nanocomposites—Recent Evolutions; IntechOpen: Rijeka, Croatia, 2019; pp. 17–43. [Google Scholar]
- Zhu, Z. An Overview of Carbon Nanotubes and Graphene for Biosensing Applications. Nanomicro Lett. 2017, 9, 25. [Google Scholar] [CrossRef] [PubMed]
- Onyancha, R.B.; Aigbe, U.O.; Ukhurebor, K.E.; Muchiri, P.W. Facile Synthesis and Applications of Carbon Nanotubes in Heavy-Metal Remediation and Biomedical Fields: A Comprehensive Review. J. Mol. Struct. 2021, 1238, 130462. [Google Scholar] [CrossRef]
- Albers, P.W.; Leich, V.; Ramirez-Cuesta, A.J.; Cheng, Y.; Hönig, J.; Parker, S.F. The Characterisation of Commercial 2D Carbons: Graphene, Graphene Oxide and Reduced Graphene Oxide. Mater. Adv. 2022, 3, 2810–2826. [Google Scholar] [CrossRef]
- Kumar, A.; Sharma, K.; Dixit, A.R. A Review on the Mechanical Properties of Polymer Composites Reinforced by Carbon Nanotubes and Graphene. Carbon. Lett. 2021, 31, 149–165. [Google Scholar] [CrossRef]
- Onyancha, R.B.; Ukhurebor, K.E.; Aigbe, U.O.; Osibote, O.A.; Kusuma, H.S.; Darmokoesoemo, H. A Methodical Review on Carbon-Based Nanomaterials in Energy-Related Applications. Adsorpt. Sci. Technol. 2022, 2022, 1–21. [Google Scholar] [CrossRef]
- Zeng, Y.; Li, T.; Yao, Y.; Li, T.; Hu, L.; Marconnet, A. Thermally Conductive Reduced Graphene Oxide Thin Films for Extreme Temperature Sensors. Adv. Funct. Mater. 2019, 29, 1901388. [Google Scholar] [CrossRef]
- Chen, J.; Li, L. Thermal Conductivity of Graphene Oxide: A Molecular Dynamics Study. JETP Lett. 2020, 112, 117–121. [Google Scholar] [CrossRef]
- Iijima, S. Helical Microtubules of Graphitic Carbon. Nature 1991, 354, 56–58. [Google Scholar] [CrossRef]
- Rathinavel, S.; Priyadharshini, K.; Panda, D. A Review on Carbon Nanotube: An Overview of Synthesis, Properties, Functionalization, Characterization, and the Application. Mater. Sci. Eng. B 2021, 268, 115095:1–115095:28. [Google Scholar] [CrossRef]
- Salah, L.S.; Ouslimani, N.; Bousba, D.; Huynen, I.; Danlée, Y.; Aksas, H. Carbon Nanotubes (CNTs) from Synthesis to Functionalized (CNTs) Using Conventional and New Chemical Approaches. J. Nanomater. 2021, 2021, 4972770. [Google Scholar] [CrossRef]
- Moradi, O.; Yari, M.; Zare, K.; Mirza, B.; Najafi, F. Carbon Nanotubes: A Review of Chemistry Principles and Reactions. Fuller. Nanotub. Carbon Nanostructures 2012, 20, 138–151. [Google Scholar] [CrossRef]
- Zhang, L.; Zhao, X.S. Carbon-Based Materials as Supercapacitor Electrodes. Chem. Soc. Rev. 2009, 38, 2520–2531. [Google Scholar] [CrossRef] [PubMed]
- Kharissova, O.V.; Kharisov, B.I. Variations of Interlayer Spacing in Carbon Nanotubes. RSC Adv. 2014, 4, 30807–30815. [Google Scholar] [CrossRef]
- Kumar Jagadeesan, A.; Thangavelu, K.; Dhananjeyan, V. Carbon Nanotubes: Synthesis, Properties and Applications. In 21st Century Surface Science—A Handbook; IntechOpen: Rijeka, Croatia, 2020. [Google Scholar]
- Jang, J.W. Direct Curvature Measurement of the Compartments in Bamboo-Shaped Multi-Walled Carbon Nanotubes via Scanning Probe Microscopy. Sci. Rep. 2021, 11, 701. [Google Scholar] [CrossRef] [PubMed]
- Taib, N.-A.; Rahman, M.; Matin, M.; Uddin, J.; Bakri, M.K.; Khan, A. A Review on Carbon Nanotubes (CNT): Structure, Synthesis, Purification and Properties for Modern Day Applications. 2021. [Google Scholar] [CrossRef]
- Prasek, J.; Drbohlavova, J.; Chomoucka, J.; Hubalek, J.; Jasek, O.; Adam, V.; Kizek, R. Methods for Carbon Nanotubes Synthesis—Review. J. Mater. Chem. 2011, 21, 15872–15884. [Google Scholar] [CrossRef]
- Novoselov, K.S.; Geim, A.K.; Morozov, S.V.; Jiang, D.; Zhang, Y.; Dubonos, S.V.; Grigorieva, I.V.; Firsov, A.A. Electric Field Effect in Atomically Thin Carbon Films. Science 2004, 306, 666–669. [Google Scholar] [CrossRef] [PubMed]
- Purkait, T.; Singh, G.; Singh, M.; Kumar, D.; Dey, R.S. Large Area Few-Layer Graphene with Scalable Preparation from Waste Biomass for High-Performance Supercapacitor. Sci. Rep. 2017, 7, 15239:1–15239:14. [Google Scholar] [CrossRef]
- Zhang, J.; Liu, X.; Zhang, M.; Zhang, R.; Ta, H.Q.; Sun, J.; Wang, W.; Zhu, W.; Fang, T.; Jia, K.; et al. Fast Synthesis of Large-Area Bilayer Graphene Film on Cu. Nat. Commun. 2023, 14, 3199:1–3199:9. [Google Scholar] [CrossRef]
- Podlivaev, A.I.; Grishakov, K.S.; Katin, K.P.; Maslov, M.M. Stone–Wales Bilayer Graphene: Structure, Stability, and Interlayer Heat Transfer. JETP Lett. 2021, 114, 143–149. [Google Scholar] [CrossRef]
- Acik, M.; Chabal, Y.J. Nature of Graphene Edges: A Review. Jpn. J. Appl. Phys. 2011, 50, 070101. [Google Scholar] [CrossRef]
- Yan, J.A.; Chou, M.Y. Oxidation Functional Groups on Graphene: Structural and Electronic Properties. Phys. Rev. B Condens. Matter Mater. Phys. 2010, 82, 125403. [Google Scholar] [CrossRef]
- Suhaimin, N.S.; Hanifah, M.F.R.; wani Jusin, J.; Jaafar, J.; Aziz, M.; Ismail, A.F.; Othman, M.H.D.; Abd Rahman, M.; Aziz, F.; Yusof, N.; et al. Tuning the Oxygen Functional Groups in Graphene Oxide Nanosheets by Optimizing the Oxidation Time. Phys. E Low. Dimens. Syst. Nanostr. 2021, 131, 114727. [Google Scholar] [CrossRef]
- Khan, M.; Tahir, M.N.; Adil, S.F.; Khan, H.U.; Siddiqui, M.R.H.; Al-Warthan, A.A.; Tremel, W. Graphene Based Metal and Metal Oxide Nanocomposites: Synthesis, Properties and Their Applications. J. Mater. Chem. A Mater. 2015, 3, 18753–18808. [Google Scholar] [CrossRef]
- Ganesha, H.; Veeresh, S.; Nagaraju, Y.S.; Suresh, D.S.; Vijaykumar, S.P.; Sapna, S.; Khmis, A.; Devendrappa, H. Polymer Incorporated with Graphene Oxide Composite for High Electrochemical Performance. Mater. Today Proc. 2023. [Google Scholar] [CrossRef]
- Bai, H.; Li, C.; Shi, G. Functional Composite Materials Based on Chemically Converted Graphene. Adv. Mater. 2011, 23, 1089–1115. [Google Scholar] [CrossRef]
- Seok, D.; Jeong, Y.; Han, K.; Yoon, D.Y.; Sohn, H. Recent Progress of Electrochemical Energy Devices: Metal Oxide-Carbon Nanocomposites as Materials for next-Generation Chemical Storage for Renewable Energy. Sustainability 2019, 11, 3694. [Google Scholar] [CrossRef]
- Kochaev, A.I.; Efimov, V.V.; Kaya, S.; Flores-Moreno, R.; Katin, K.P.; Maslov, M.M. On Point Perforating Defects in Bilayer Structures. Phys. Chem. Chem. Phys. 2023, 25, 30477–30487. [Google Scholar] [CrossRef]
- Mbayachi, V.B.; Ndayiragije, E.; Sammani, T.; Taj, S.; Mbuta, E.R.; Ullah Khan, A. Graphene Synthesis, Characterization and Its Applications: A Review. Results Chem. 2021, 3, 100163. [Google Scholar] [CrossRef]
- Sun, X.; Sun, H.; Li, H.; Peng, H. Developing Polymer Composite Materials: Carbon Nanotubes or Graphene? Adv. Mater. 2013, 25, 5153–5176. [Google Scholar] [CrossRef]
- Saeed, K.; Khan, I.; Khan, I.; Ali, N.; Bilal, M.; Akhter, M.S. Graphene and Carbon Nanotubes-Based Polymer Nanocomposites. In Smart Polymer Nanocomposites; Elsevier: Amsterdam, The Netherlands, 2023; pp. 205–218. [Google Scholar]
- Wang, J.; Zhang, Y.; Liu, G.; Zhang, T.; Zhang, C.; Zhang, Y.; Feng, Y.; Chi, Q. Improvements in the Magnesium Ion Transport Properties of Graphene/CNT-Wrapped TiO2-B Nanoflowers by Nickel Doping. Small 2023, 2304969. [Google Scholar] [CrossRef]
- Sonkar, P.K.; Ganesan, V.; Sen Gupta, S.K.; Yadav, D.K.; Gupta, R.; Yadav, M. Highly Dispersed Multiwalled Carbon Nanotubes Coupled Manganese Salen Nanostructure for Simultaneous Electrochemical Sensing of Vitamin B2 and B6. J. Electroanal. Chem. 2017, 807, 235–243. [Google Scholar] [CrossRef]
- Lu, B.; Zhang, Z.; Hao, J.; Xu, G.; Zhang, B.; Tang, J. Electrochemical Sensing Platform Based on Schiff-Base Cobalt(Ii)/Single-Walled Carbon Nanohorns Complexes System. Anal. Methods 2012, 4, 3580–3585. [Google Scholar] [CrossRef]
- Rajarao, R.; Kim, T.H.; Bhat, B.R. Multi-Walled Carbon Nanotube Bound Nickel Schiff-Base Complexes as Reusable Catalysts for Oxidation of Alcohols. J. Coord. Chem. 2012, 65, 2671–2682. [Google Scholar] [CrossRef]
- Salavati-Niasari, M.; Bazarganipour, M. Covalent Functionalization of Multi-Wall Carbon Nanotubes (MWNTs) by Nickel(II) Schiff-Base Complex: Synthesis, Characterization and Liquid Phase Oxidation of Phenol with Hydrogen Peroxide. Appl. Surf. Sci. 2008, 255, 2963–2970. [Google Scholar] [CrossRef]
- Bai, L.; Li, M.; Guan, J. Co(II) or Cu(II) Schiff Base Complex Immobilized onto Carbon Nanotubes as a Synergistic Catalyst for the Oxygen Reduction Reaction. ChemistrySelect 2018, 3, 581–585. [Google Scholar] [CrossRef]
- Li, H.; Zhong, M.; Li, C.; Ren, Y.; Chen, J.; Yang, Q. Synthesis of CNTs@POP-Salen Core-Shell Nanostructures for Catalytic Epoxides Hydration. ChemCatChem 2019, 11, 3952–3958. [Google Scholar] [CrossRef]
- Zheng, W.; Tan, R.; Yin, S.; Zhang, Y.; Zhao, G.; Chen, Y.; Yin, D. Ionic Liquid-Functionalized Graphene Oxide as an Efficient Support for the Chiral Salen Mn(iii) Complex in Asymmetric Epoxidation of Unfunctionalized Olefins. Catal. Sci. Technol. 2015, 5, 2092–2102. [Google Scholar] [CrossRef]
- Zhou, X.; Lu, X. Co(Salen) Supported on Graphene Oxide for Oxidation of Lignin. J. Appl. Polym. Sci. 2016, 133, 44133. [Google Scholar] [CrossRef]
- Li, Z.; Wu, S.; Ding, H.; Lu, H.; Liu, J.; Huo, Q.; Guan, J.; Kan, Q. Oxovanadium(Iv) and Iron(Iii) Salen Complexes Immobilized on Amino-Functionalized Graphene Oxide for the Aerobic Epoxidation of Styrene. New J. Chem. 2013, 37, 4220–4229. [Google Scholar] [CrossRef]
- Wei, W.-C.; Deng, C.; Huang, S.-C.; Wei, Y.-X.; Wang, Y.-Z. Nickel-Schiff Base Decorated Graphene for Simultaneously Enhancing the Electroconductivity, Fire Resistance, and Mechanical Properties of a Polyurethane Elastomer. J. Mater. Chem. A Mater. 2018, 6, 8643–8654. [Google Scholar] [CrossRef]
- Li, Z.; Wu, S.; Ding, H.; Zheng, D.; Hu, J.; Wang, X.; Huo, Q.; Guan, J.; Kan, Q. Immobilized Cu(Ii) and Co(Ii) Salen Complexes on Graphene Oxide and Their Catalytic Activity for Aerobic Epoxidation of Styrene. New J. Chem. 2013, 37, 1561–1568. [Google Scholar] [CrossRef]
- Zhao, Q.; Bai, C.; Zhang, W.; Li, Y.; Zhang, G.; Zhang, F.; Fan, X. Catalytic Epoxidation of Olefins with Graphene Oxide Supported Copper (Salen) Complex. Ind. Eng. Chem. Res. 2014, 53, 4232–4238. [Google Scholar] [CrossRef]
- Ghabdian, M.; Nasseri, M.A.; Allahresani, A.; Motavallizadehkakhky, A. Heterogenized Cu (II) Salen Complex Grafted on Graphene Oxide Nanosheets as a Precursing Catalyst for the Pd-free Sonogashira Coupling. Appl. Organomet. Chem. 2018, 32, 4545:1–4545:9. [Google Scholar] [CrossRef]
- Li, X.; Xu, G.; Deng, F.; Chen, C.; Li, J.; Kang, F. Understanding the Charge Storage Mechanism and Electrochemical Performance on the Poly[Ni(Salen)]-Modified Electrode Electropolymerized with Different Sweep Rate. Electrochemistry 2017, 85, 461–468. [Google Scholar] [CrossRef][Green Version]
- Araújo, M.P.; Nunes, M.; Fonseca, J.; Moura, C.; Hillman, R.; Freire, C. Graphene-Poly(Nickel Complex) as Novel Electrochromic Nanocomposite for the Fabrication of a Robust Solid-State Device. J. Colloid. Interface Sci. 2017, 504, 790–799. [Google Scholar] [CrossRef]
- Karushev, M.P.; Timonov, A.M. Adsorption-Electrochemical Modification of Nanoporous Carbon Materials by Nickel Complexes with Schiff Bases. Russ. J. Appl. Chem. 2012, 85, 914–920. [Google Scholar] [CrossRef]
- Gao, F.; Li, J.; Kang, F.; Zhang, Y.; Wang, X.; Ye, F.; Yang, J. Preparation and Characterization of a Poly[Ni(Salen)]/Multiwalled Carbon Nanotube Composite by in situ Electropolymerization as a Capacitive Material. J. Phys. Chem. C 2011, 115, 11822–11829. [Google Scholar] [CrossRef]
- Hüfner, S. Photoelectron Spectroscopy; Springer Series in Solid-State Sciences; Springer: Berlin/Heidelberg, Germany, 1995; Volume 82, ISBN 978-3-662-03152-0. [Google Scholar]
- Korusenko, P.; Kharisova, K.; Knyazev, E.; Levin, O.; Vinogradov, A.; Alekseeva, E. Surface Engineering of Multi-Walled Carbon Nanotubes via Ion-Beam Doping: Pyridinic and Pyrrolic Nitrogen Defect Formation. Appl. Sci. 2023, 13, 11057. [Google Scholar] [CrossRef]
- Shunaev, V.V.; Bobenko, N.G.; Korusenko, P.M.; Egorushkin, V.E.; Glukhova, O.E. Carboxyl Functionalization of N-MWCNTs with Stone–Wales Defects and Possibility of HIF-1α Wave-Diffusive Delivery. Int. J. Mol. Sci. 2023, 24, 1296. [Google Scholar] [CrossRef]
- Tanuma, S.; Powell, C.J.; Penn, D.R. Calculations of Electron Inelastic Mean Free Paths. IX. Data for 41 Elemental Solids over the 50 EV to 30 KeV Range. Surf. Interface Anal. 2011, 43, 689–713. [Google Scholar] [CrossRef]
- Fairley, N.; Fernandez, V.; Richard-Plouet, M.; Guillot-Deudon, C.; Walton, J.; Smith, E.; Flahaut, D.; Greiner, M.; Biesinger, M.; Tougaard, S.; et al. Systematic and Collaborative Approach to Problem Solving Using X-ray Photoelectron Spectroscopy. Appl. Surf. Sci. Adv. 2021, 5, 100112. [Google Scholar] [CrossRef]
- Yeh, J.J.; Lindau, I. Atomic Subshell Photoionization Cross Sections and Asymmetry Parameters: 1 ≤ Z ≤ 103. At. Data Nucl. Data Tables 1985, 32, 1–155. [Google Scholar] [CrossRef]
- Yan, M.; Jin, Y.; Wu, Z.; Tsaturyan, A.; Makarova, A.; Smirnov, D.; Voloshina, E.; Dedkov, Y. Correlations in the Electronic Structure of van Der Waals NiPS3 Crystals: An X-ray Absorption and Resonant Photoelectron Spectroscopy Study. J. Phys. Chem. Lett. 2021, 12, 2400–2405. [Google Scholar] [CrossRef] [PubMed]
- Jin, Y.; Yan, M.; Kremer, T.; Voloshina, E.; Dedkov, Y. Mott–Hubbard Insulating State for the Layered van Der Waals FePX3 (X: S, Se) as Revealed by NEXAFS and Resonant Photoelectron Spectroscopy. Sci. Rep. 2022, 12, 735. [Google Scholar] [CrossRef] [PubMed]
- Dedkov, Y.S.; Vinogradov, A.S.; Fonin, M.; König, C.; Vyalikh, D.V.; Preobrajenski, A.B.; Krasnikov, S.A.; Kleimenov, E.Y.; Nesterov, M.A.; Rüdiger, U.; et al. Correlations in the Electronic Structure of Half-Metallic Ferromagnetic CrO2 Films: An X-ray Absorption and Resonant Photoemission Spectroscopy Study. Phys. Rev. B 2005, 72, 060401. [Google Scholar] [CrossRef]
- Stöhr, J. NEXAFS Spectroscopy; Springer Series in Surface Sciences; Springer: Berlin/Heidelberg, Germany, 1992; Volume 25, ISBN 978-3-642-08113-2. [Google Scholar]
- Vinogradov, A.S.; Fedoseenko, S.I.; Krasnikov, S.A.; Preobrajenski, A.B.; Sivkov, V.N.; Vyalikh, D.V.; Molodtsov, S.L.; Adamchuk, V.K.; Laubschat, C.; Kaindl, G. Low-Lying Unoccupied Electronic States in 3d Transition-Metal Fluorides Probed by NEXAFS at the F1s Threshold. Phys. Rev. B 2005, 71, 045127:1–045127:11. [Google Scholar] [CrossRef]
- Newville, M. Fundamentals of XAFS. Rev. Miner. Geochem. 2014, 78, 33–74. [Google Scholar] [CrossRef]
- Zubavichus, Y.V.; Slovokhotov, Y.L. X-ray Synchrotron Radiation in Physicochemical Studies. Russ. Chem. Rev. 2001, 70, 373–403. [Google Scholar] [CrossRef]
- Borovskiĭ, I.B.; Vedrinskiĭ, R.V.; Kraĭzman, V.L.; Sachenko, V.P. EXAFS Spectroscopy: A New Method for Structural Investigation. Sov. Phys. Uspekhi 1986, 29, 539–569. [Google Scholar] [CrossRef]
- Sanson, A. EXAFS Spectroscopy: A Powerful Tool for the Study of Local Vibrational Dynamics. Microstructures 2021, 1, 2021004. [Google Scholar] [CrossRef]
- Penner-Hahn, J.E. X-ray Absorption Spectroscopy. In Comprehensive Coordination Chemistry II; Elsevier: Amsterdam, The Netherlands, 2003; pp. 159–186. [Google Scholar]
- Newville, M. IFEFFIT: Interactive XAFS Analysis and FEFF Fitting. J. Synchrotron Radiat. 2001, 8, 322–324. [Google Scholar] [CrossRef] [PubMed]
- Salavati-Niasari, M.; Mirsattari, S.N.; Bazarganipour, M. Synthesis, Characterization and Catalytic Oxyfunctionalization of Cyclohexene with Tert-Butylhydroperoxide over a Manganese(II) Complex Covalently Anchored to Multi-Wall Carbon Nanotubes (MWNTs). Polyhedron 2008, 27, 3653–3661. [Google Scholar] [CrossRef]
- Salavati-Niasari, M.; Bazarganipour, M. Synthesis, Characterization and Alcohol Oxidation Properties of Multi-Wall Carbon Nanotubes Functionalized with a Cobalt(II) Schiff Base Complex. Transit. Metal. Chem. 2009, 34, 605–612. [Google Scholar] [CrossRef]
- Ghadamyari, Z.; Khojastehnezhad, A.; Seyedi, S.M.; Taghavi, F.; Shiri, A. Graphene Oxide Functionalized Zn(II) Salen Complex: An Efficient and New Route for the Synthesis of 1,2,3-Triazole Derivatives. ChemistrySelect 2020, 5, 10233–10242. [Google Scholar] [CrossRef]
- Salavati-Niasari, M.; Bazarganipour, M. Synthesis, Characterization and Catalytic Oxidation Properties of Multi-Wall Carbon Nanotubes with a Covalently Attached Copper(II) Salen Complex. Appl. Surf. Sci. 2009, 255, 7610–7617. [Google Scholar] [CrossRef]
- Salavati-Niasari, M.; Bazarganipour, M. Synthesis, Characterization and Liquid Phase Oxidation of Cyclohexane with Hydrogen Peroxide over Oxovanadium(IV) Schiff-Base Tetradendate Complex Covalently Anchored to Multi-Wall Carbon Nanotubes (MWNTs). Bull. Korean Chem. Soc. 2009, 30, 355–362. [Google Scholar] [CrossRef][Green Version]
- Zhang, M.; Zhao, F.; Li, H.; Yuan, Z.; Dong, S.; Wang, Y.; Chen, X.; Yang, Y.; Song, X.; Jiang, Z. Insight into Graphene-Salen Metal Nanocomposites on Combustion Performance and Mechanism of HMX-CMDB Propellant. Chem. Eng. J. 2022, 429, 132175. [Google Scholar] [CrossRef]


| Material | Specific Surface Area, m2g−1 | Young’s Modulus, TPa | Thermal Conductivity (at Room Temperature), Wm−1K−1 | Refs. |
|---|---|---|---|---|
| SWCNTs | 400–900 | ~1 | 3000 | [68] |
| MWCNTs | 200–400 | 0.3–1 | 3000 | [68] |
| Monolayer graphene | up to 2630 | 1 | 5000 | [69,70,71] |
| rGO sheet | up to 713 | 0.25 | 46.1 to 118.7 | [69,70,72] |
| Freestanding GO | up to 456 | 0.7 ± 0.015 | 72 (oxidation degree of 0.35); 670 (oxidation degree of 0.05) | [69,70,73] |
| Compound | Ebin, eV | Calibration | Ref. | |||
|---|---|---|---|---|---|---|
| C 1s | N 1s | O 1s | M 2p, 3d, 4f | |||
| H2(Salen) | 285.0 285.5 286.5 | 399.0 ± 0.1 | 532.9 ± 0.1 | - | C 1s 285.0 eV | [39] |
| [Cu(Salen)] | 285.0 286.6 | 399.5 ± 0.1 | 531.3 ± 0.1 | Cu 2p3/2 936.4 | ||
| [Ni(Salen)] | 285.0 286.15 | 399.6 ± 0.1 | 531.3 ± 0.1 | Ni 2p3/2 855.2 | ||
| [Pd(Salen)] | 285.0 285.9 286.6 | 399.9 ± 0.1 | 531.4 ± 0.1 | Pd 3d5/2 338.5 | ||
| [Pt(Salen)] | 285.0 286.4 | 400.1 ± 0.1 | 531.6 ± 0.1 | Pt 4f7/2 73.4 | ||
| H2(Salen) | not specified | 398.4 | not specified | - | C 1s 285.0 eV | [52] |
| [Co(Salen)] | not specified | 399.0 | not specified | Co 2p3/2 780.4 | ||
| H2(Salen) | not specified | 398.3 ± 0.1 | 532.2 ± 0.1 | - | Au 4f7/2 83.4 eV | [51] |
| [Cu(Salen)] | not specified | 389.9 ± 0.1 | 530.8± 0.1 | Cu 2p3/2 934.5 ± 0.1 | ||
| [Ni(Salen)] | not specified | 399.4 ± 0.1 | 531.2± 0.1 | Ni 2p3/2 855.0 ± 0.2 | ||
| [Co(Salen)] | not specified | 398.9 ± 0.2 | 530.9 ± 0.2 | Co 2p3/2 779.9 ± 0.1 | [50] | |
| H2(Salen) | 284.8 286.2 | 398.65 | 532.5 | - | Pt 4f7/2 71.1 eV | [46] |
| [Ni(Salen)] | 285.75 287.25 | 400.55 | 532.1 | no information | ||
| [Ni(Salen)] | 285.5 287.0 | 400.3 | 532.0 | Ni 2p3/2 856.3 | Pt 4f7/2 71.1 eV | [45] |
| [Ni(Salen)] | not specified | 398.4 | 530.2 | Ni 2p3/2 854.3 | C 1s 284.8 eV | [44] |
| poly-[Ni(Salen)] | not specified | 399.1 | 530.2 | Ni 2p3/2 854.9 | C 1s 284.8 eV | [44] |
| poly-[Ni(CH3O-Salen)] ox | not specified | 399.8 | 531.5, 533.3, 534.6 | Ni 2p3/2 854.9 | C 1s 284.8 eV | [48] |
| poly-[Ni(CH3O-Salen)] red | not specified | 399.8 | 531.5, 533.3, 534.6 | Ni 2p3/2 854.9 | ||
| poly-[Cu(Salen)] ox | not specified | 399.5 ± 0.1 | 531.2 ± 0.1 | not specified | C 1s 285.0 eV | [39] |
| poly-[Cu(Salen)] red | 399.4 ± 0.1 | 531.2 ± 0.1 | ||||
| poly-[Ni(Salen)] ox | 399.7 ± 0.1 | 531.3 ± 0.1 | ||||
| poly-[Ni(Salen)] red | 399.6 ± 0.1 | 531.2 ± 0.1 | ||||
| poly-[Pd(Salen)] ox | 399.8 ± 0.1 | 531.3 ± 0.1 | ||||
| poly-[Pd(Salen)] red | 399.8 ± 0.1 | 531.2 ± 0.1 | ||||
| poly-[Pt(Salen)] ox | 400.4 ± 0.1 | 532.4 ± 0.1 | ||||
| poly-[Pt(Salen)] red | 400.3 ± 0.1 | 531.9 ± 0.1 | ||||
| [Pd(3-CH3Salen)] | 285.0 286.4 291.1 | 400.0 | 531.6 | Pd 3d5/2 338.7 | C 1s 285.0 eV | [40] |
| poly-[Pd(3-CH3Salen)] ox | 284.2 285.6 287.2 289.1 | 399.2 401.3 403.1 | 531.7 | Pd 3d5/2 337.9 | ||
| poly-[Pd(3-CH3Salen)] red | 284.6 285.9 287.1 289.6 | 399.6 402.9 | 531.3 | Pd 3d5/2 338.2 | ||
| Compound | Atomic Pair | N a | R b, Å | Ref. |
|---|---|---|---|---|
| [Cu(Salen)] | Cu–O2 | 1 | 1.86 ± 0.04 | [54] |
| Cu–O1 | 1 | 1.90 ± 0.04 | ||
| Cu–N2 | 1 | 1.95 ± 0.002 | ||
| Cu–N1 | 1 | 1.95 ± 0.002 | ||
| Cu–Cu | 1 | 3.22 ± 0.03 | ||
| [Co(Salen)] | Co–Os c | 2.0 | 1.91 ± 0.02 | [55] |
| Co–Ol d | 1.1 | 2.20 ± 0.02 | ||
| Co–N | 2.1 | 1.83 ± 0.02 | ||
| Co–Co | 0.5 | 2.92 ± 0.02 | ||
| [Co(Salen)] nanoparticles | Co–Os | 1.8 | 1.90 ± 0.02 | |
| Co–Ol | 1.1 | 2.20 ± 0.02 | ||
| Co–N | 1.5 | 1.81 ± 0.02 | ||
| Co–Co | 0.5 | 2.92 ± 0.02 | ||
| [Co(Salen)] | Co–N | 2.0 | 1.90 | [52] |
| Co–O | 2.0 | 1.86 | ||
| [Co(Salen)] in montmorillonite clay | Co–N | 2.0 | 1.90 | |
| Co–O | 2.0 | 1.86 | ||
| Co–O | 1.6 | 1.99 | ||
| [Ni(3-CH3saltMe)] in powder | Ni–N(O) | 3.5 | 1.83 ± 0.02 | [27] |
| Ni–C | 4.2 | 2.82 ± 0.02 | ||
| Ni–C | 2.2 | 3.20 ± 0.02 | ||
| [Ni(3-CH3saltMe)] in CH3CN solution | Ni–N(O) | 3.2 | 1.83 ± 0.02 | |
| Ni–C | 4.7 | 2.82 ± 0.02 | ||
| Ni–C | 2.2 | 3.20 ± 0.02 | ||
| poly-[Ni(3-CH3saltMe)] ox | Ni–N(O) | 3.8 | 1.84 ± 0.02 | |
| Ni–C | 4.3 | 2.82 ± 0.02 | ||
| Ni–C | 1.5 | 3.21 ± 0.02 | ||
| poly-[Ni(3-CH3saltMe)] red | Ni–N(O) | 3.8 | 1.84 ± 0.02 | |
| Ni–C | 4.5 | 2.81 ± 0.02 | ||
| Ni–C | 2.0 | 3.19 ± 0.02 | ||
| [Pd(3-CH3Salen)] powder | Pd–O(N) | 4 | 1.97 ± 0.002 | [40] |
| Pd–C | 6 | 3.00 ± 0.006 | ||
| Pd–C | 2 | 3.24 ± 0.004 | ||
| poly-[Pd(3-CH3Salen)] ox | Pd–O(N) | 4 | 1.98 ± 0.002 | |
| Pd–C | 6 | 3.00 ± 0.008 | ||
| Pd–C | 2 | 3.28 ± 0.009 | ||
| poly-[Pd(3-CH3Salen)] red | Pd–O(N) | 4 | 1.97 ± 0.002 | |
| Pd–C | 6 | 3.0 ± 0.007 | ||
| Pd–C | 2 | 3.24 ± 0.005 |
| Sample | Measured Photoelectron Region | Photon Source, Spectrometer | Spectra Calibration | Functionalization Method of Carbon Surface | Ref. |
|---|---|---|---|---|---|
| [Mn((OH)2-salen)]/MWCNTs | Survey, O 1s, Mn 2p | Mg Kα PHI-5702 | not specified | chlorination | [134] |
| [Co((OH)2-salen)]/MWCNTs | Survey, O 1s, Co 2p | [135] | |||
| [Ni((OH)2-salen)]/MWCNTs | Survey, O 1s, Ni 2p | [103] | |||
| [Cu((OH)2-salen)]/MWCNTs | Survey, O 1s, Cu 2p | [137] | |||
| [VO((OH)2-salen)]/MWCNTs | Survey, O 1s, V 2p | [138] | |||
| [Co(Salen)]/MWCNTs | Survey, N 1s, Co 2p | Al Kα ESCALAB 250Xi | C 1s-284.6 | functionalization with amino (NH2-CNT)) | [104] |
| [Cu(Salen)]/MWCNTs | Survey, Cu 2p | ||||
| poly-[Ni(salphen)]/MWCNTs | Survey, Ni 2p | not specified | not specified | homogeneous suspension of MWCNTs and N-methyl-2-pyrrolidone | [8] |
| poly-[Co-Tos-(Salen)]/CNTs | Survey, Co 2p | not specified | not specified | ethylene diamine treatment | [105] |
| [Co(Salen)]/SWNHs | Survey, N 1s, Co 2p | Al Kα ESCALAB MKII | not specified | sonicating and stirring a toluene solution of Co-Salen and SWNHs | [101] |
| [Co(Salen)]/GO | Survey | Al Kα ESCALAB 250 | not specified | functionalization with amino NH2 (NH2–GO) | [110] |
| [Cu(Salen)]/GO | Survey | ||||
| [VO(Salen)]/GO | C 1s, V 2p | Al Kα Kratos AXIS Ultra HSA | [108] | ||
| [Fe(Salen)]/GO | C 1s, Fe 2p | ||||
| [Ni(Salen)]/GO | C 1s, N 1s | not specified | [109] | ||
| [Cu(Salen)]/GO | Survey, N 1s, Cu 2p | functionalization with 3-(Aminopropyl) trimethoxysilane (APTMS) | [111] | ||
| poly-[Ni(3-CH3-Salen)]/N-FLG | C 1s, O 1s, N 1s, Ni 2p, Cl 2p | Al Kα CEMUP | not specified | nitrogen doping using CVD method with additional ammonia precursor | [37] |
| Sample | Peaks Position, eV | Ref. | ||||||||
|---|---|---|---|---|---|---|---|---|---|---|
| C 1s | N 1s | O 1s | M 2p | |||||||
| H1 Peak | L2 Peak | H1 Peak | L2 Peak | –CO– | –C–O–C– or –C–O–N– | –C–O–M– | 2p3/2 | dE3 | ||
| [Mn((OH)2-salen)]/MWCNTs | – | – | – | – | 532.7 | 531.2 | 529.9 | 640.0 | 11.4 | [134] |
| [Co((OH)2-salen)]/MWCNTs | – | – | – | – | 532.3 | 531.2 | 529.7 | 780.4 | 14.7 | [135] |
| [Ni((OH)2-salen)]/MWCNTs | – | – | – | – | 532.8 | 531.4 | 529.9 | 854.1 | 21.2 | [103] |
| [Cu((OH)2-salen)]/MWCNTs | – | – | – | – | 532.5 | 531.4 | 529.9 | 934.2 | 20 | [137] |
| [VO((OH)2-salen)]/MWCNTs | – | – | – | – | 532.6 | 531.5 | 530.0 | 515 | – | [138] |
| [Co(Salen)]/MWCNTs | – | – | 402 | 399.5 | – | – | – | ~781.5 | 14.7 | [104] |
| [Cu(Salen)]/MWCNTs | – | – | – | – | – | – | – | ~934.4 | 19.9 | [104] |
| Poly-[Ni(salphen)]/MWCNTs | – | – | – | – | – | – | – | ~855 | ~18 | [8] |
| Poly-[Co-Tos-(Salen)]/CNTs, | – | – | – | – | – | – | – | ~780.7 | ~15.2 | [105] |
| [Co(Salen)]/SWNHs | – | – | ~400 | – | – | – | – | ~780.9 | ~15 | [101] |
| [VO(Salen)]/GO | 284.7 | 286.7 | – | – | – | – | – | 517.1 | ~7 | [108] |
| [Fe(Salen)]/GO | 284.8 | 286.6 | – | – | – | – | – | 711.8 | 13.5 | |
| [Ni(Salen)]/GO | 284.6 | 286.6 | 401.8 | 399.5 | – | – | – | – | – | [109] |
| [Ni(Salen)]/rGO | 284.6 | 286.5 | 401.8 | 399.5 | – | – | – | – | – | [109] |
| [Cu(Salen)]/GO | – | – | ~401 | ~399.2 | – | – | – | ~954 | ~19.9 | [111] |
| Poly-[Ni(3-CH3-Salen)]/N-FLG | 284.6 | 285.9 286.9 | 401.3 400.4 | 399.4 | 533.1 | 531.5 | 872.5 | 17.2 | [37] | |
Disclaimer/Publisher’s Note: The statements, opinions and data contained in all publications are solely those of the individual author(s) and contributor(s) and not of MDPI and/or the editor(s). MDPI and/or the editor(s) disclaim responsibility for any injury to people or property resulting from any ideas, methods, instructions or products referred to in the content. |
© 2024 by the authors. Licensee MDPI, Basel, Switzerland. This article is an open access article distributed under the terms and conditions of the Creative Commons Attribution (CC BY) license (https://creativecommons.org/licenses/by/4.0/).
Share and Cite
Korusenko, P.M.; Petrova, O.V.; Vinogradov, A.S. Atomic and Electronic Structure of Metal–Salen Complexes [M(Salen)], Their Polymers and Composites Based on Them with Carbon Nanostructures: Review of X-ray Spectroscopy Studies. Appl. Sci. 2024, 14, 1178. https://doi.org/10.3390/app14031178
Korusenko PM, Petrova OV, Vinogradov AS. Atomic and Electronic Structure of Metal–Salen Complexes [M(Salen)], Their Polymers and Composites Based on Them with Carbon Nanostructures: Review of X-ray Spectroscopy Studies. Applied Sciences. 2024; 14(3):1178. https://doi.org/10.3390/app14031178
Chicago/Turabian StyleKorusenko, Petr M., Olga V. Petrova, and Alexander S. Vinogradov. 2024. "Atomic and Electronic Structure of Metal–Salen Complexes [M(Salen)], Their Polymers and Composites Based on Them with Carbon Nanostructures: Review of X-ray Spectroscopy Studies" Applied Sciences 14, no. 3: 1178. https://doi.org/10.3390/app14031178
APA StyleKorusenko, P. M., Petrova, O. V., & Vinogradov, A. S. (2024). Atomic and Electronic Structure of Metal–Salen Complexes [M(Salen)], Their Polymers and Composites Based on Them with Carbon Nanostructures: Review of X-ray Spectroscopy Studies. Applied Sciences, 14(3), 1178. https://doi.org/10.3390/app14031178