Article

Temperature Effects on the Natural Frequencies of Composite Girders

1
Department of Civil Engineering, Kangwon National University, Samcheock 25913, Republic of Korea
2
Department of Civil Engineering, Sangmyung University, Cheonan 31066, Republic of Korea
*
Authors to whom correspondence should be addressed.
Appl. Sci. 2024, 14(3), 1175; https://doi.org/10.3390/app14031175
Submission received: 7 January 2024 / Revised: 23 January 2024 / Accepted: 28 January 2024 / Published: 30 January 2024

Abstract

:
Composite bridges are typically exposed to temperature variations due to heat radiation, conduction, and convection. Temperature affects the modal parameters of bridges, hindering the application of damage detection methods based on the dynamic properties of bridges. In this study, the effects of temperature on the natural frequencies of composite bridges were investigated experimentally and numerically to derive a basis for separating temperature effects from the natural frequencies. A temperature-controllable girder specimen was developed for modal testing. Additionally, finite element (FE) analysis was conducted to analyze the effects of temperature. The FE analysis results were validated by comparing them to the static response results of the test specimen. The results of the experiments and FE simulations verified that temperature variation can affect the material properties, particularly the modulus of elasticity, of a composite girder, consequently influencing its natural frequency. Based on the tests and simulations, a linear relationship between the temperature and the natural frequency was proposed to remove the temperature effects from the natural frequency.

1. Introduction

Over the past several decades, various studies have been conducted to monitor the health conditions of bridges based on modal parameters such as natural frequencies and mode shapes [1,2,3]. However, modal parameters can be affected by environmental factors, which limits their application as health monitoring indicators. Temperature, humidity, and wind speed have been considered as potential environmental factors influencing modal parameters [4]. Among these, temperature has been reported to be the primary factor affecting the modal parameters of bridges. Bridges are typically exposed to temperature variations caused by solar radiation, heat conduction, and convection. Temperature changes can influence the elastic modulus of materials and size of structural members. In the case of a statically indeterminate structure, secondary stress can also be induced by temperature [5]. These factors can affect the stiffness of bridges. In other words, modal parameters can be changed by temperature effects.
Many studies have indicated that natural frequencies decrease as temperature increases [1,6,7,8]. For example, experimental tests conducted on a simply supported beam to investigate the impact of temperature variations on its natural frequency in a temperature range from −40 to 60 °C demonstrated that the natural frequency decreased by up to 0.148% as the temperature increased [5]. Ding and Li [9] observed the daily correlations between temperature and the frequencies of steel girders in a cable-stayed bridge and found that modal frequencies decreased with increasing temperature. A similar tendency has also been observed in laboratory tests on steel and concrete beam specimens [10].
Composite bridges composed of reinforced concrete decks and steel girders are commonly used in bridge construction based on their structural efficiency. In this type of bridge, a temperature gradient, which refers to an uneven distribution of heat, can occur as a result of the different heat properties of concrete and steel. Such temperature gradients have been considered as important factors affecting modal parameter variations in bridges [6,11]. Various studies have been conducted to interpret the temperature gradient effects of bridges based on in situ data measured over long periods of time [12,13,14]. However, long-term data from bridges in service include the effects of traffic loads, which may not be negligible. Therefore, for accurate interpretation, temperature gradient effects have to be investigated based on data measured under controlled conditions.
In this study, we investigated the effects of temperature gradients on the natural frequencies of composite bridges. A laboratory setup was developed using a composite girder specimen composed of a concrete deck and a steel beam. The investigated temperature range on the top of the specimen was 20–50 °C. Modal tests were conducted to obtain natural frequencies and mode shapes at different temperatures. Additionally, finite element analysis (FEA) was conducted to verify the test results and analyze temperature effects.

2. Temperature Effects on a Composite Bridge

Bridges are exposed to various temperature conditions generated by environmental factors such as solar radiation, air temperature, and irregular winds. These environmental factors induce heat transfer in bridges, resulting in a temperature field. Heat transfer is also affected by thermal properties such as specific heat and thermal conductivity. Three main mechanisms contribute to heat transfer within and between a bridge and its surrounding environment. These mechanisms include the following ones: (1) thermal conduction through the sections of a bridge, which occurs as a result of temperature differences between materials; (2) convection, which is involved in the exchange of heat between the bridge and the surrounding air; and (3) radiation, which encompasses both incoming and outgoing radiation, including solar radiation, longwave radiation from the atmosphere and surrounding surfaces, and radiation emitted by the bridge itself [15].
The temperature field in a bridge section can be uniform or non-uniform, depending on environmental conditions. Furthermore, a non-uniform distribution or temperature gradient can vary, depending on the thermal properties of bridge members in addition to environmental conditions [16,17]. Variations in temperature along temperature fields can influence the dynamic properties of bridges in two main ways, namely by changing the elastic moduli and sizes of members [5,7]. Therefore, it is necessary not only to evaluate temperature fields accurately, but also to account for changes in elastic moduli and member sizes to investigate the effects of temperature on the natural frequencies of bridges. The following subsections discuss thermal properties, elastic moduli, and size variations of members to elucidate the effects of temperature on composite bridges.

2.1. Thermal Properties and Elastic Moduli

Elastic moduli and some thermal properties are affected by temperature, depending on the material. Therefore, these quantities are typically expressed as functions of temperature [18,19,20]. The elastic modulus of concrete tends to decrease with increasing temperature and can be calculated using Equation (1) proposed in Model Code 2010 [21]. In contrast to the elastic modulus, the specific heat and thermal conductivity are less affected by concrete temperature [22,23,24,25]. The specific heat of concrete remains relatively constant up to 400 °C [22], and the thermal conductivity is not affected by temperature unless it exceeds 100 °C [23,24,26].
E c i ( T ) = E c i ( 1.06 0.003 T )
where
  • Eci(T) is the modulus of elasticity of concrete at temperature T;
  • Eci is the elastic modulus of concrete at 20 °C (MPa);
  • T is the temperature of concrete (°C).
The modulus of elasticity of steel decreases with temperature and can be evaluated using Equation (2) proposed by Chen and Young [27].
E c ( T ) = E c 20 ° C [ 1 ( T 22 ) 978 ]
where
  • Ec(T) is the modulus of elasticity of steel at temperature T,
  • Ec20°C is the elastic modulus of steel at 20 °C (MPa), and
  • T is the temperature of steel (°C).
The specific heat (Ca) and the thermal conductivity (λa) of steel are affected by temperature. The thermal properties of steel deteriorate with increasing temperature [25,28,29]. These properties can be evaluated using Equations (3) and (4) proposed in Eurocode (EN 1993-1-2) [30].
For 20 °C ≤ θa < 600 °C,
C a = 425 + 0.733 θ a 1.69 × 10 3 θ a 2 + 2.22 × 10 6 θ a 3 J / kgk
and for 20 °C ≤ θa < 800 °C,
λ a = 54 3.33 × 10 2 θ a W / mk ;
where θa is the temperature of steel (°C).

2.2. Impact of Temperature on the Size of Structures

A temperature change in a composite bridge affects the size of its members as a result of thermal expansion, which results in variations in the moment of inertia. The change in length of a rectangular beam with temperature can be calculated using Equation (5) [5] as follows:
L 1 = ( 1 + α Δ T ) L
where
  • L1 is the beam length after temperature change,
  • α is the linear expansion coefficient,
  • ΔT is the temperature change, and
  • L is the initial beam length.

3. Experiments on Temperature Effects

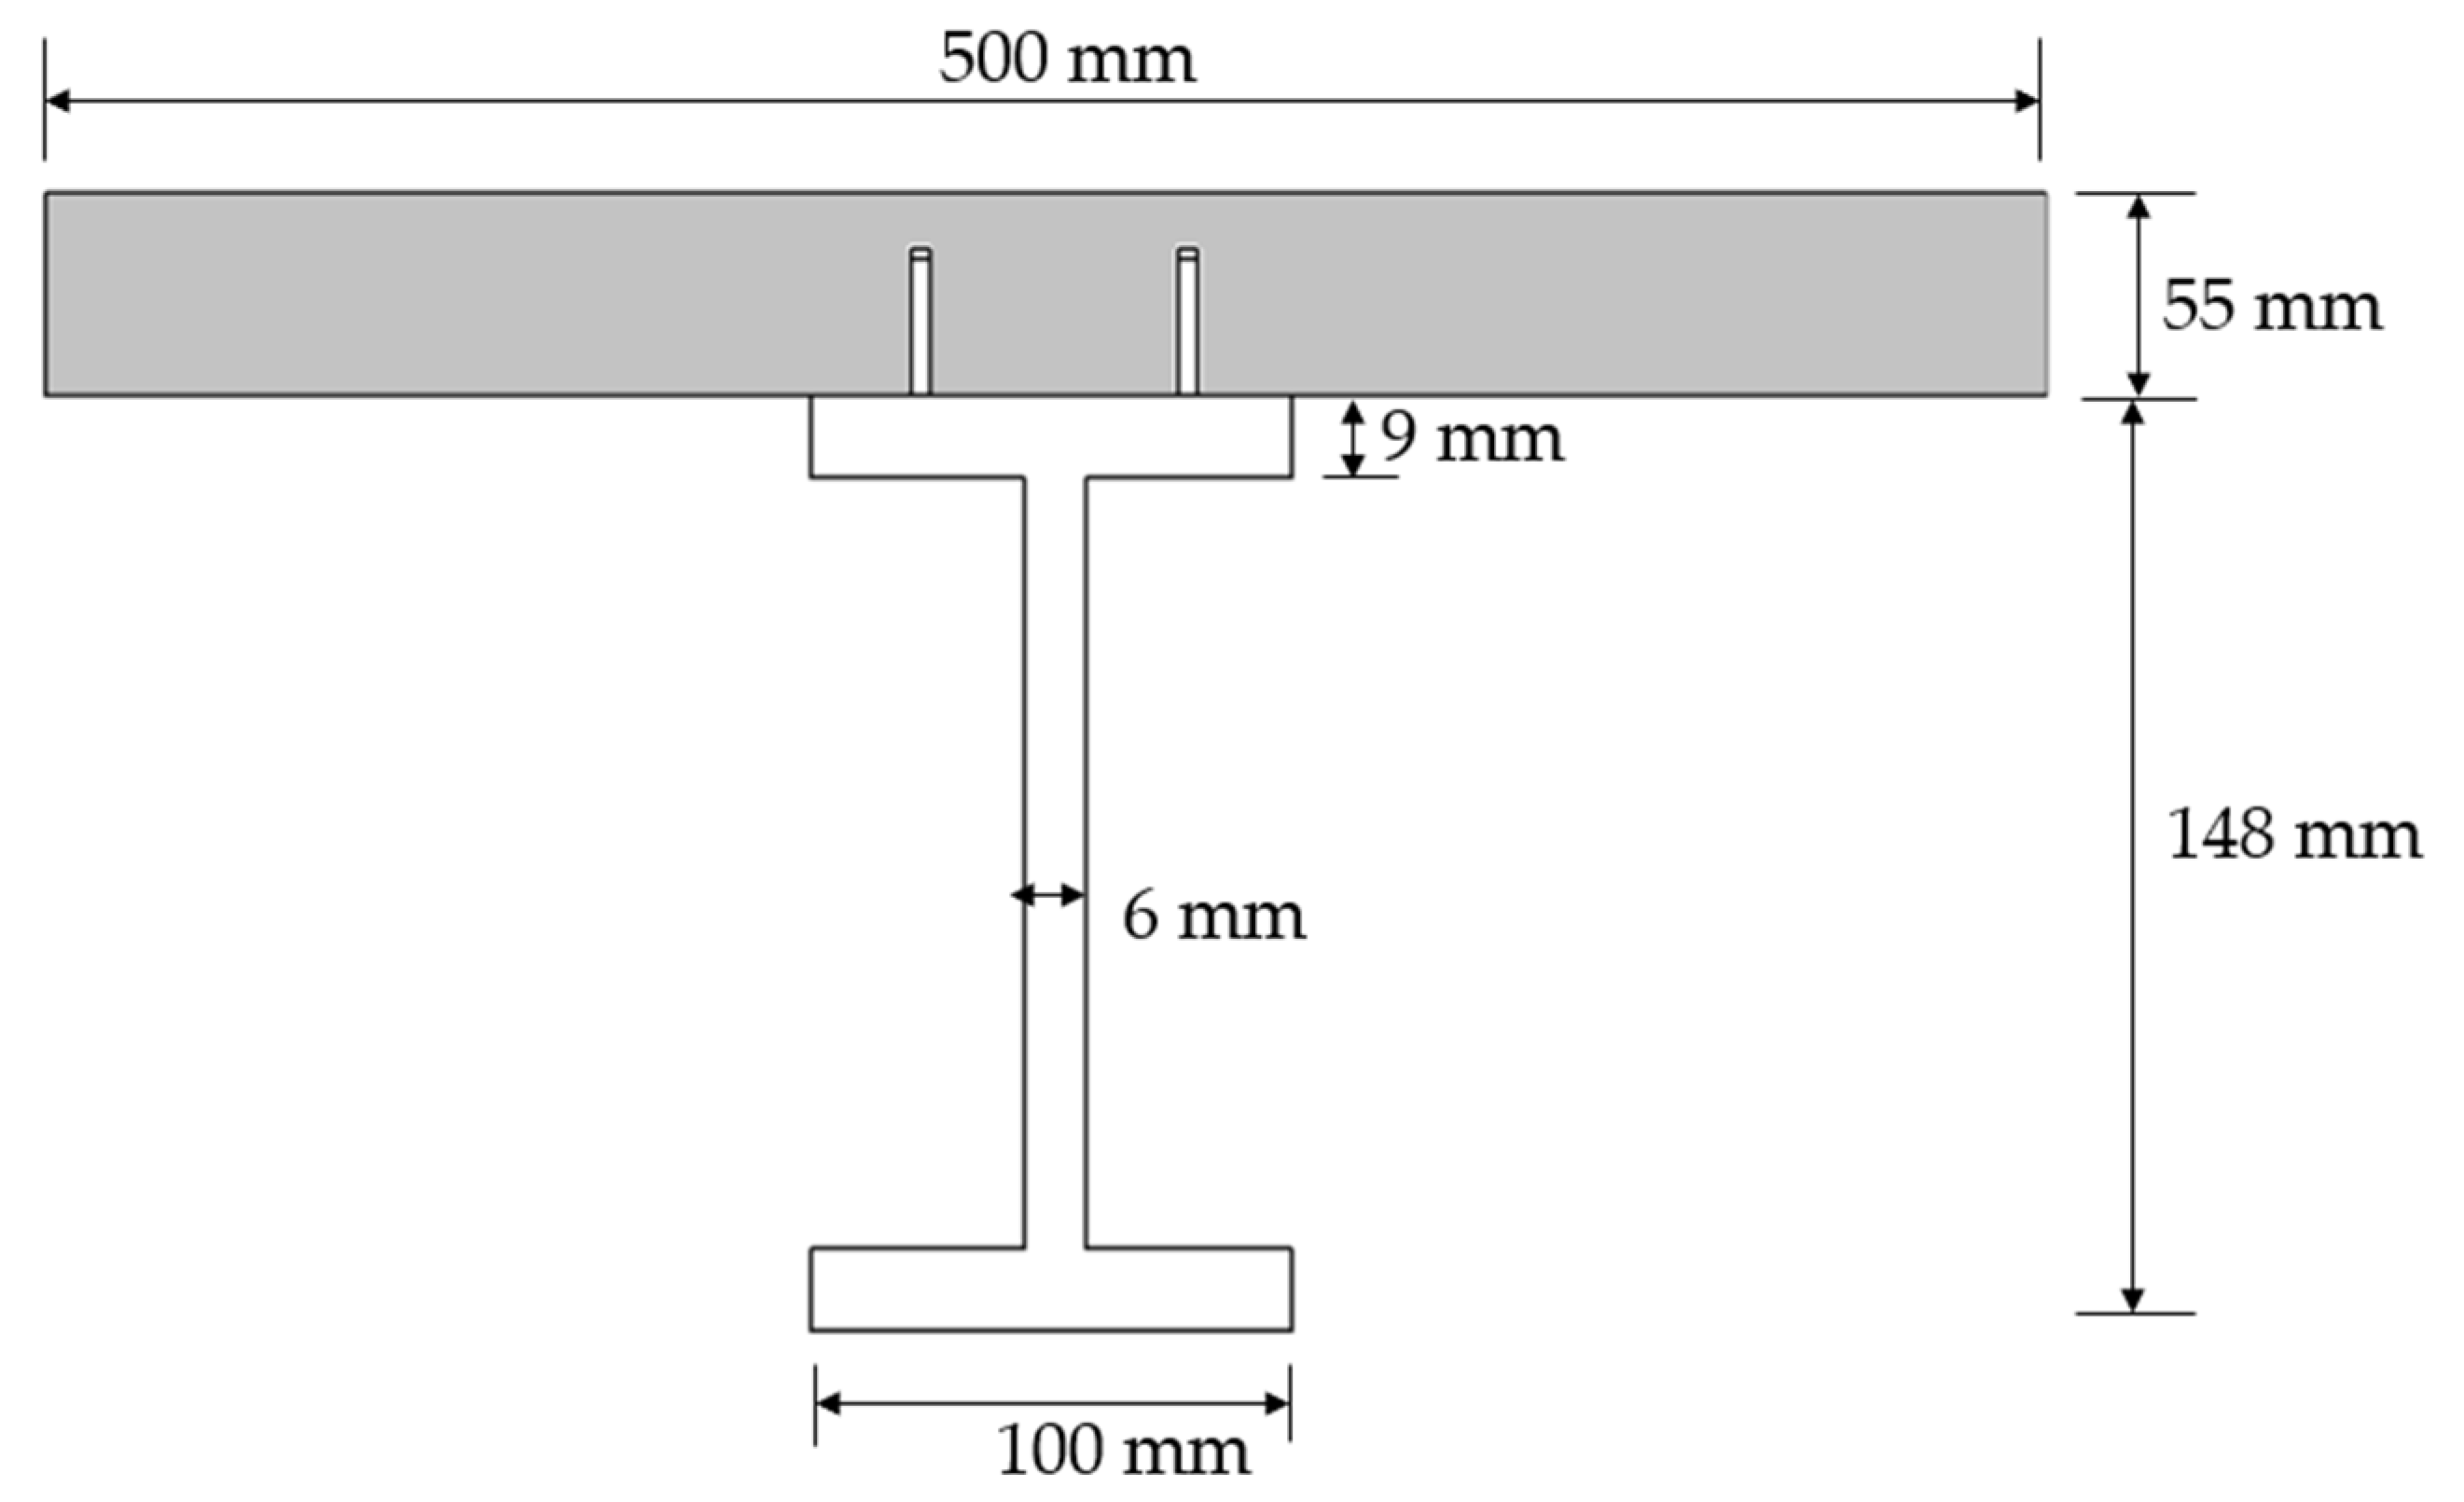
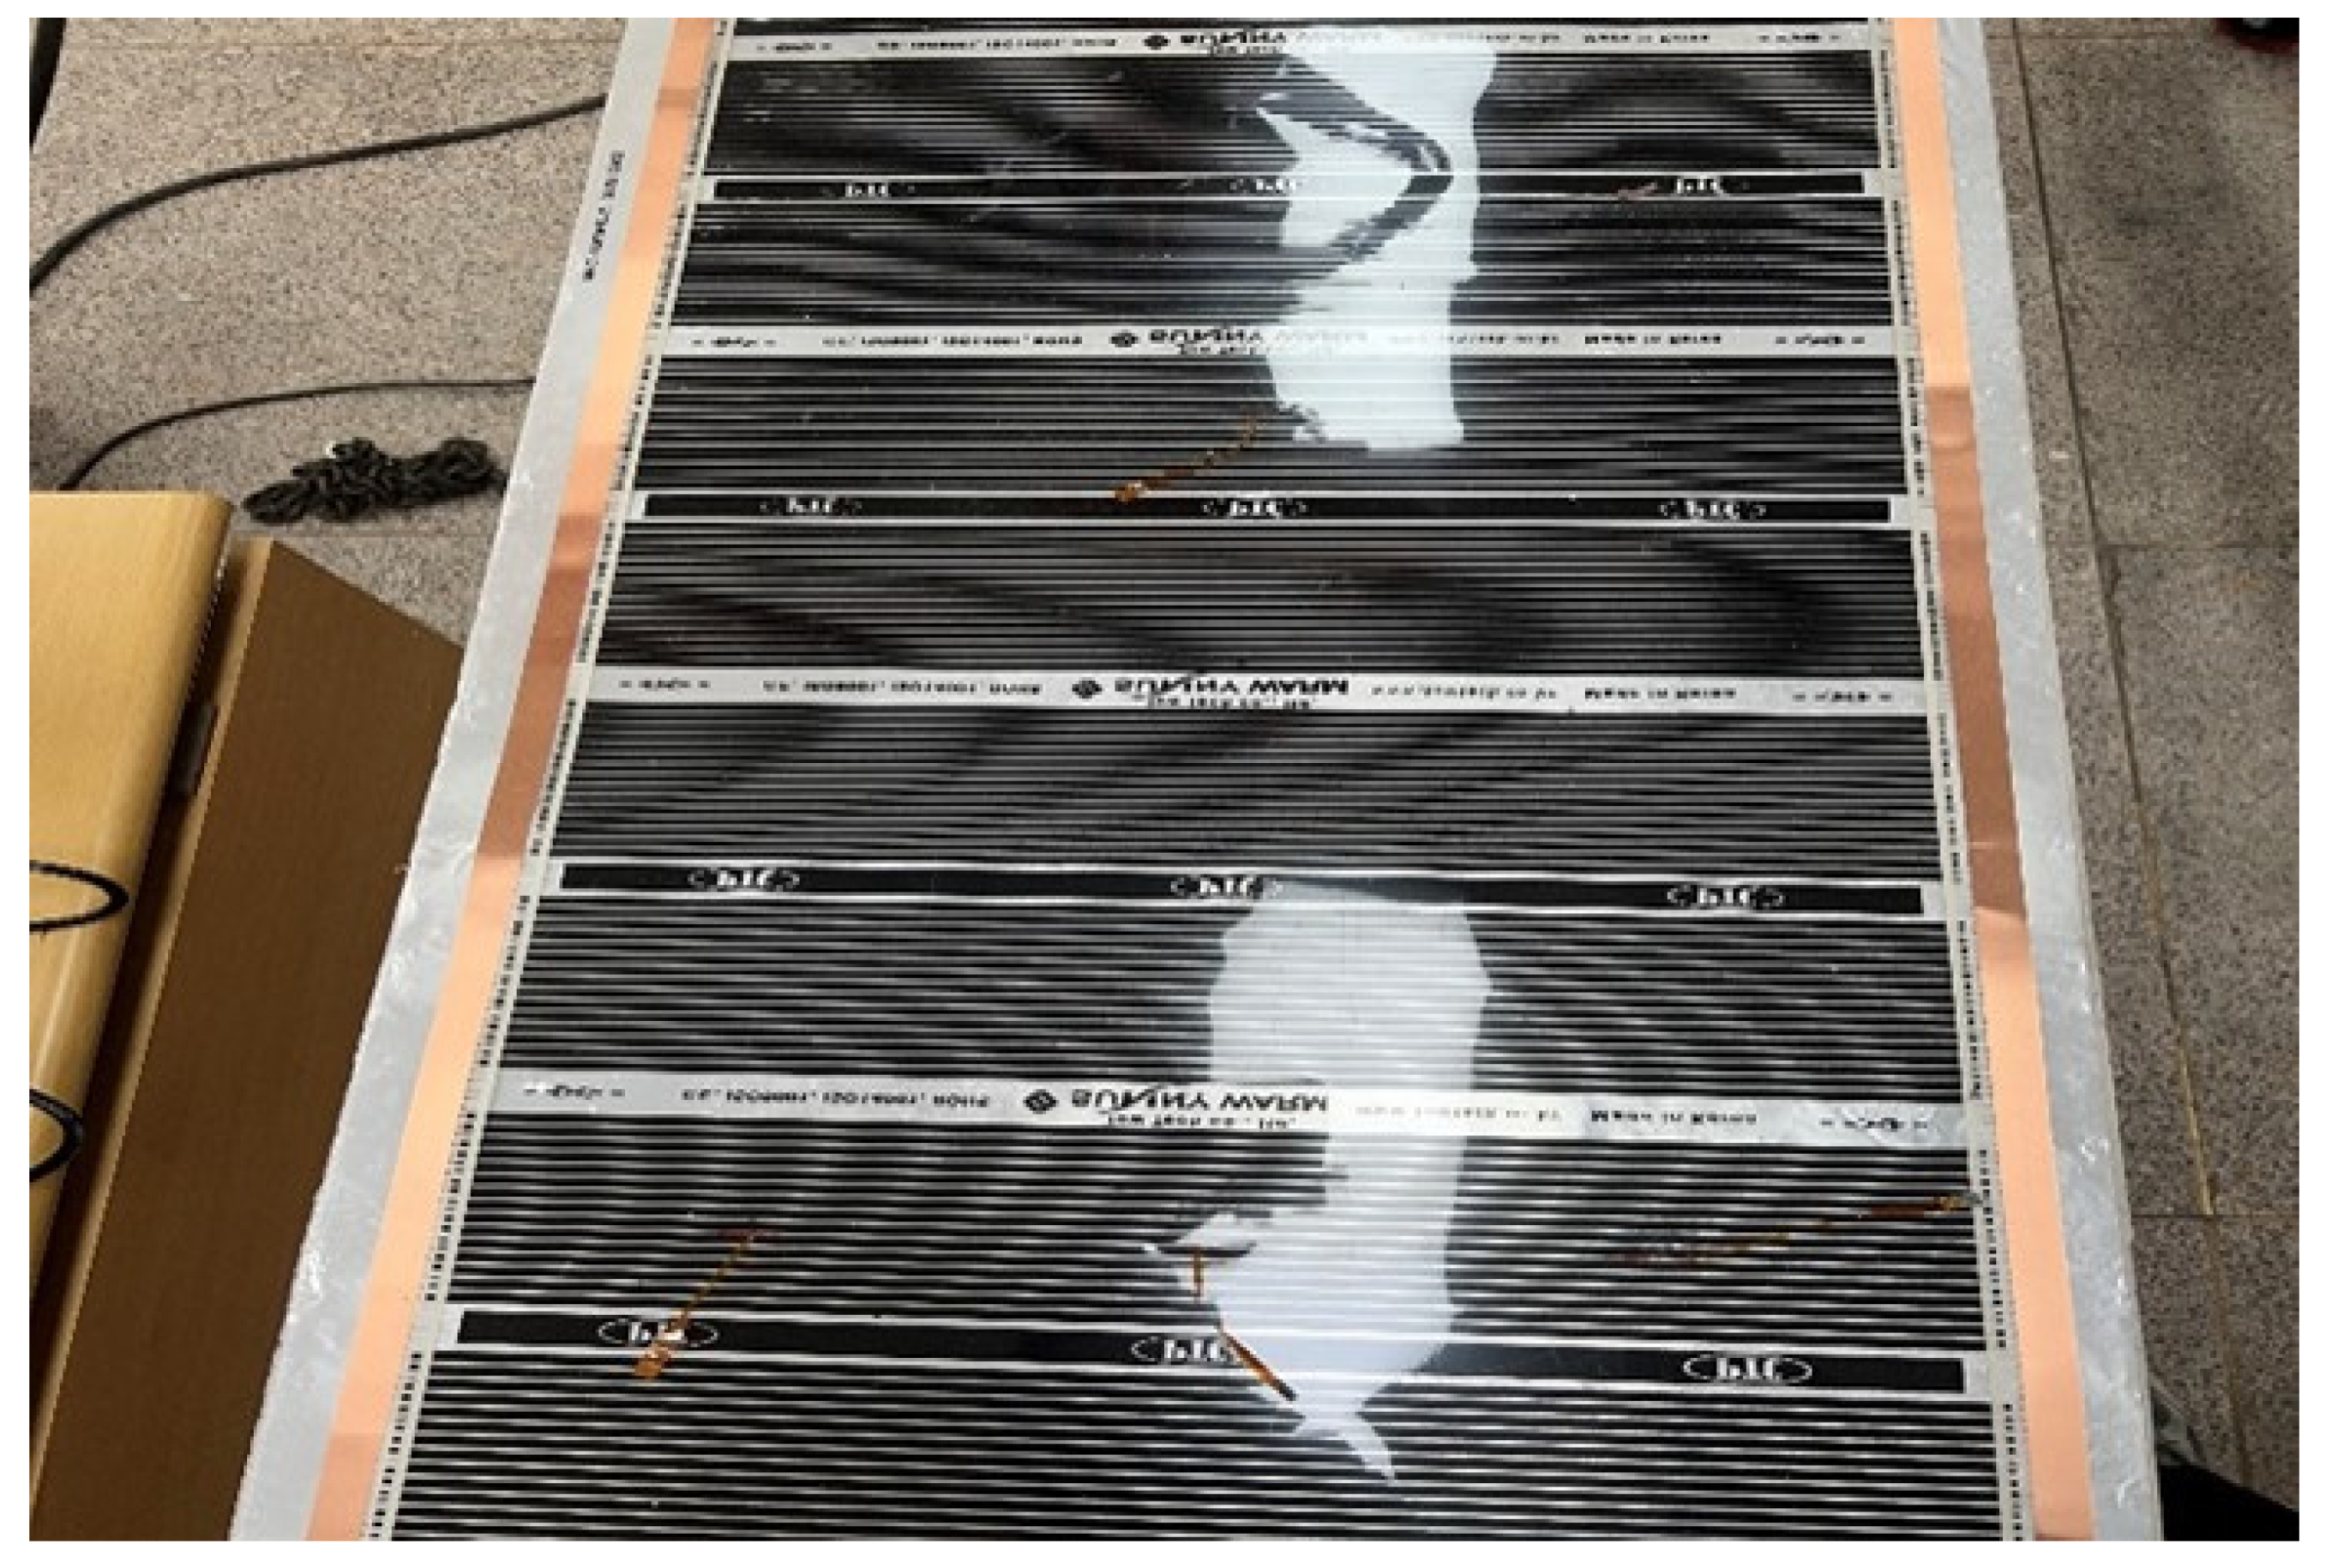
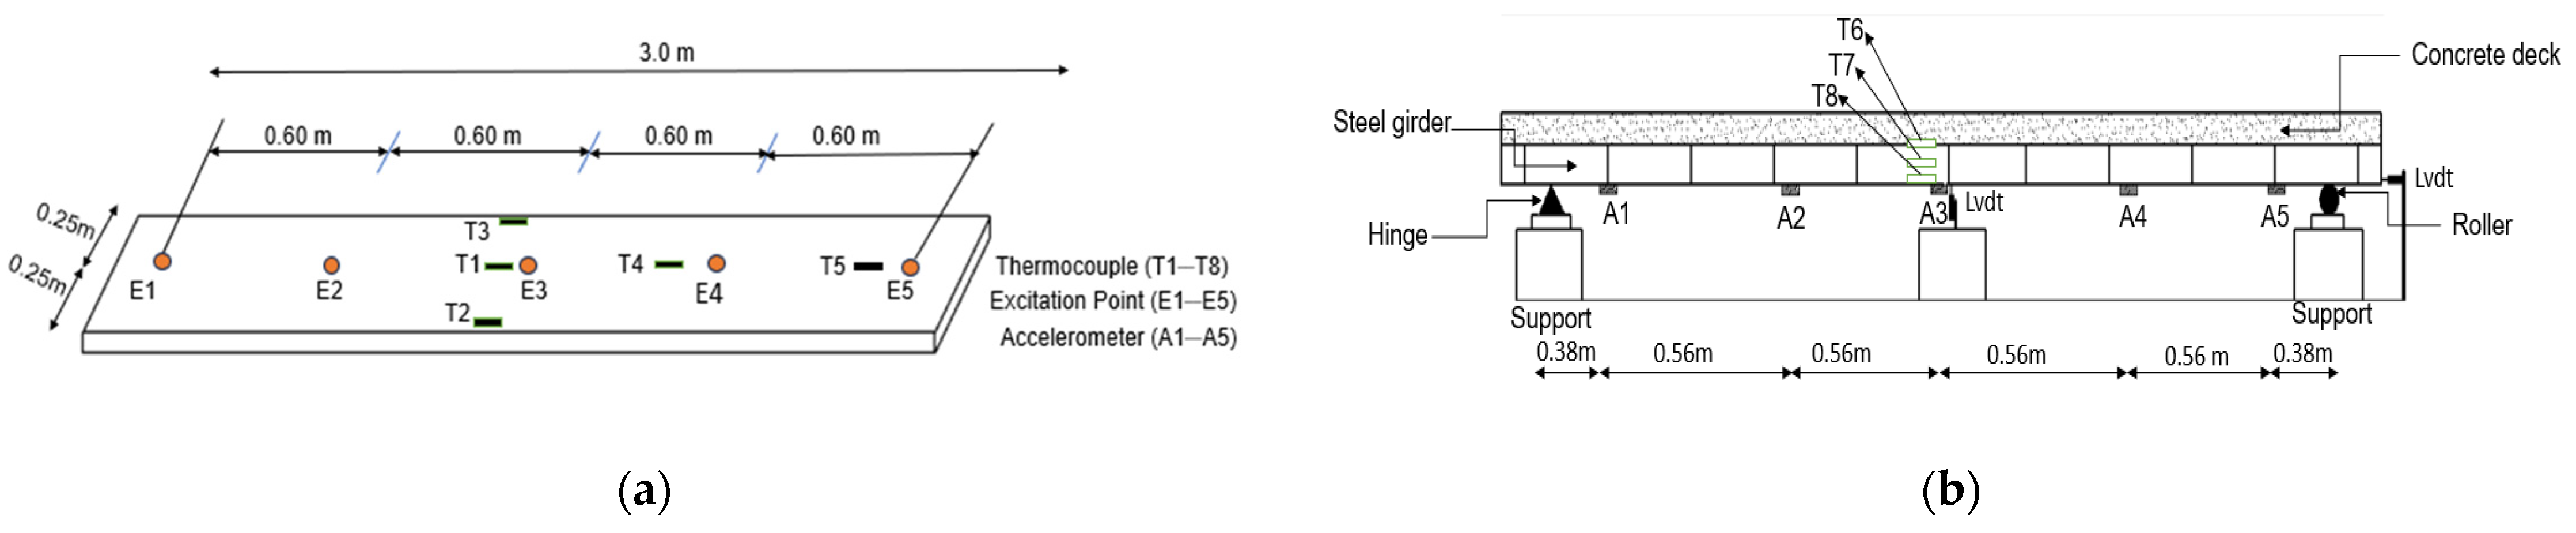
3.1. Test Specimen and Measurement Setup
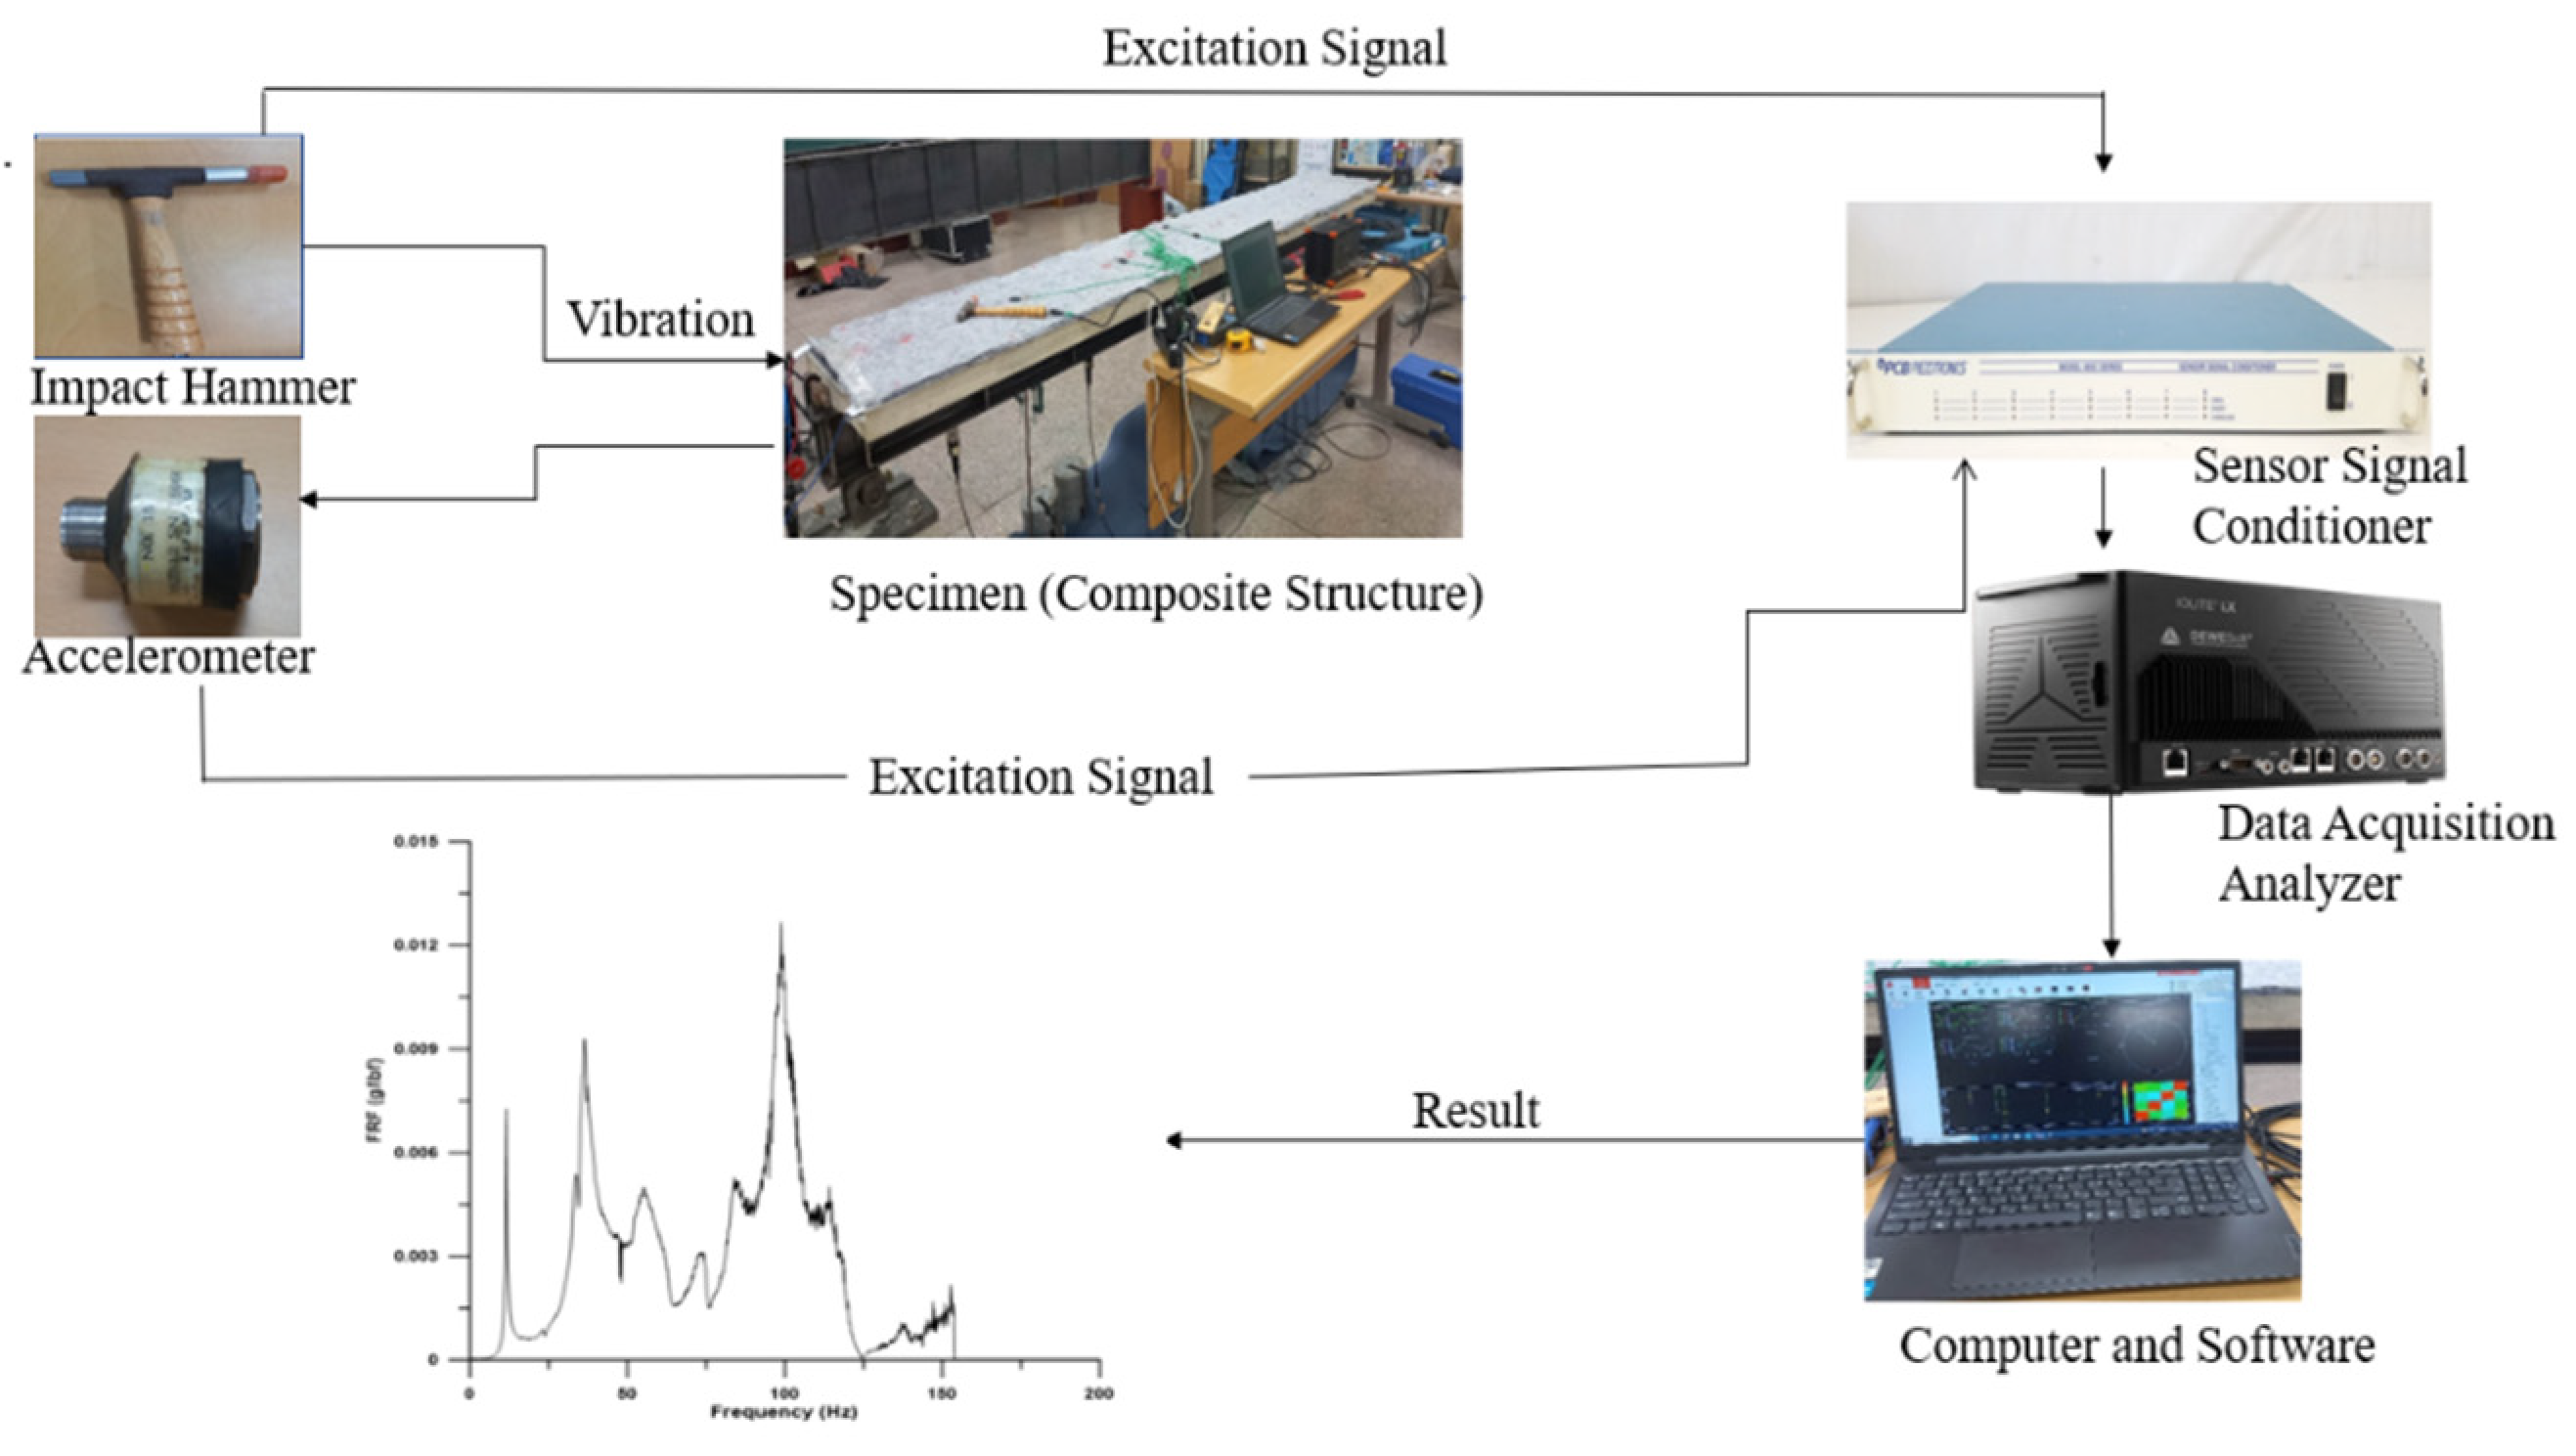
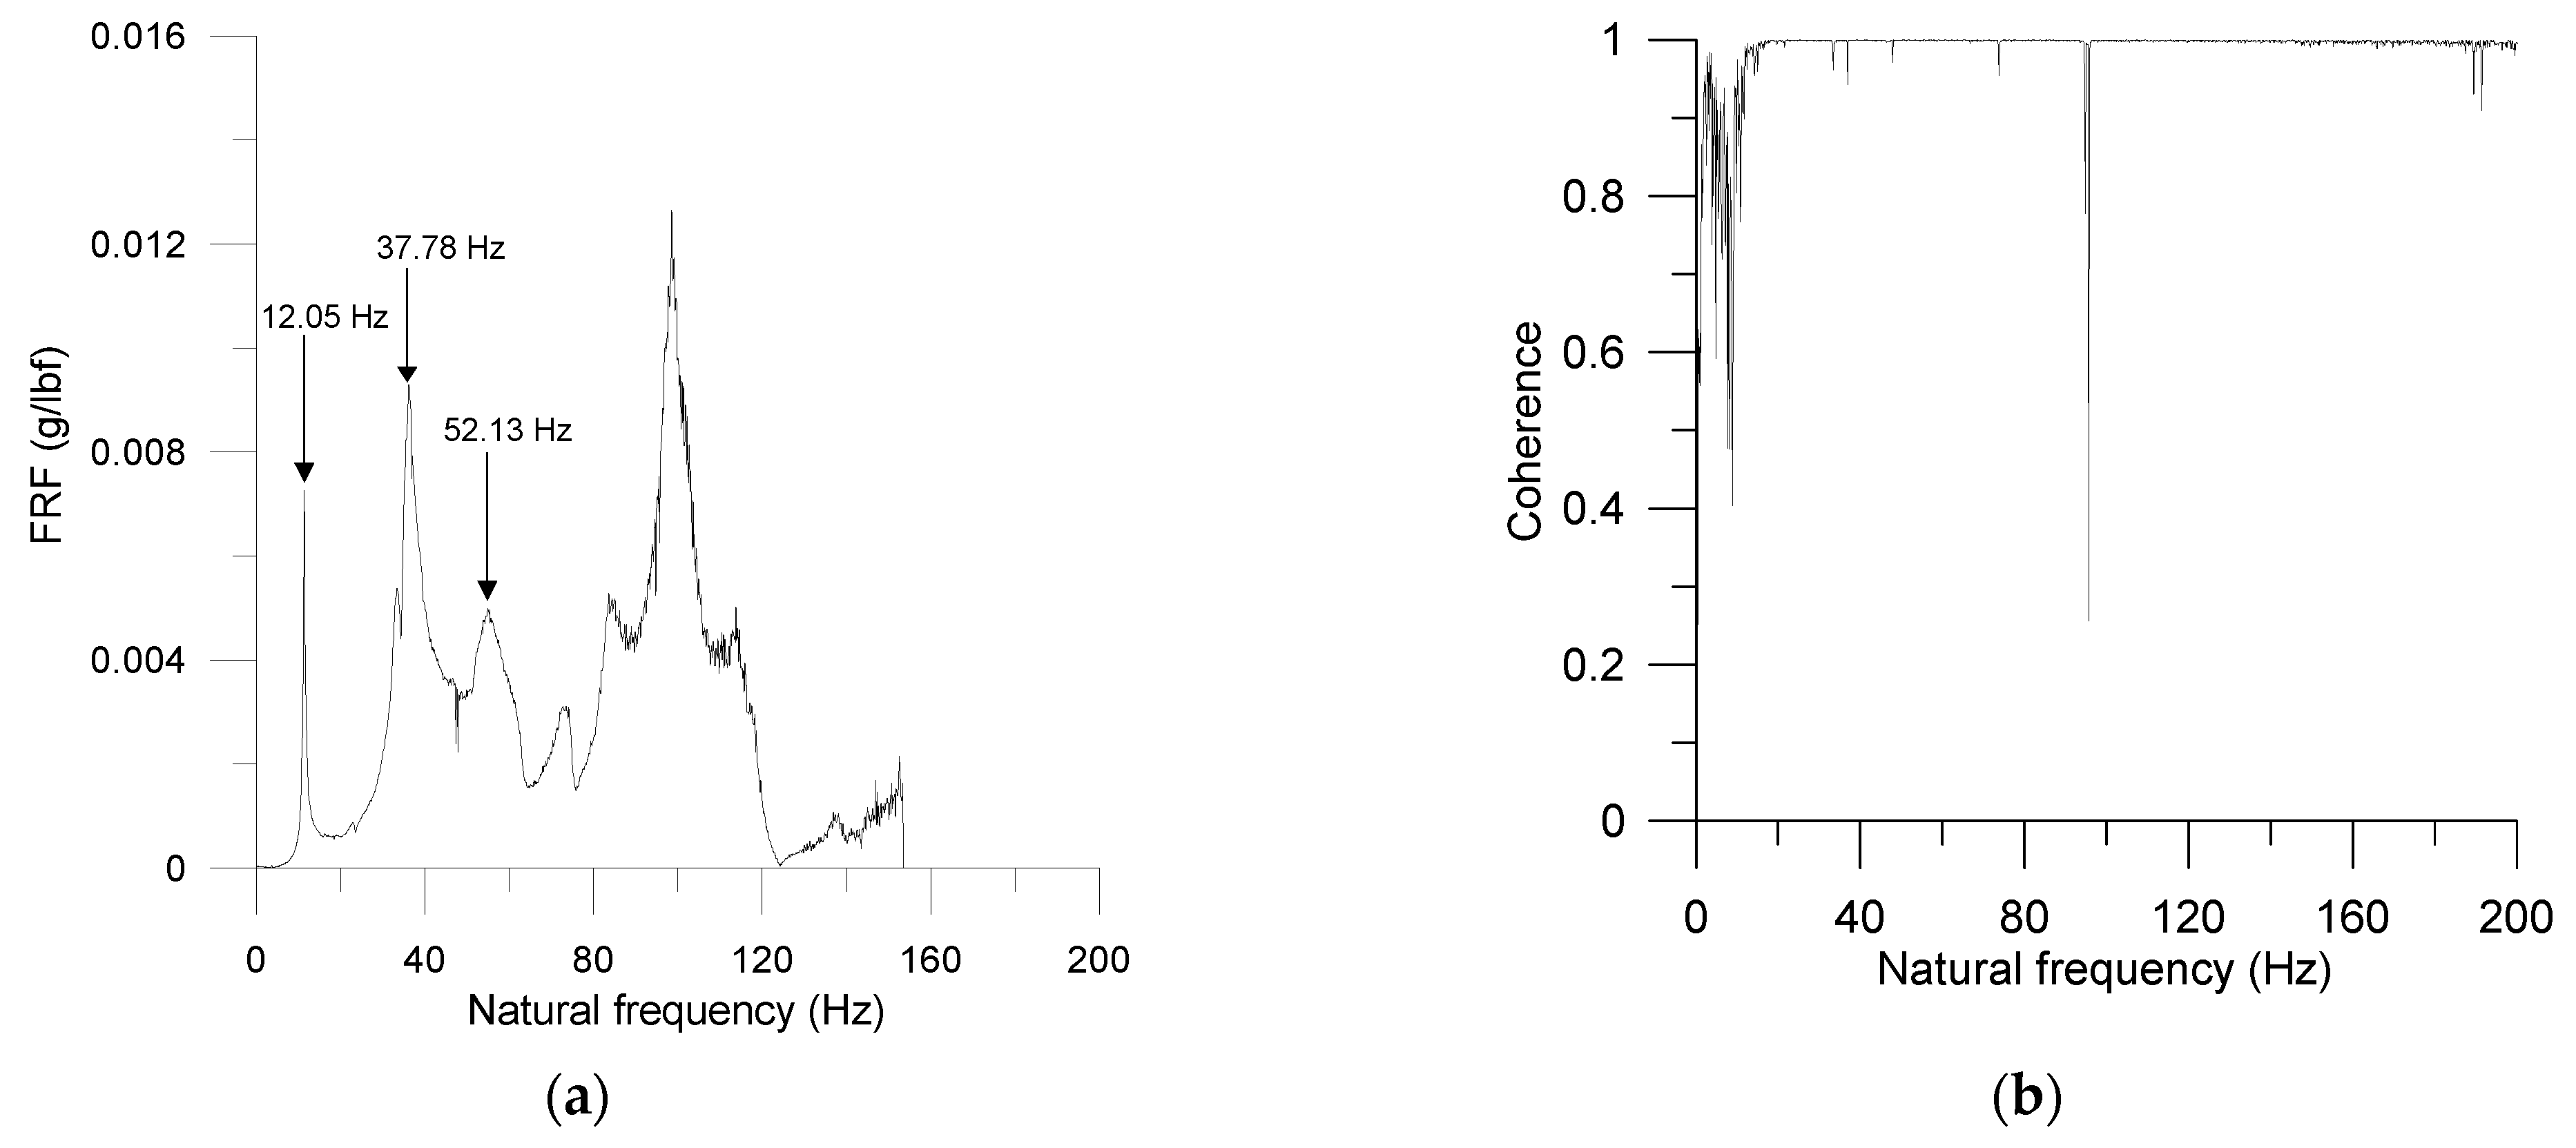
A composite steel plate girder (Figure 1) was constructed for modal tests to investigate the effects of temperature on its natural frequencies. The girder consisted of an SM355 steel I-beam and a concrete deck. An H150 × 100 × 6 × 9 rolled section was used for the beam, and shear stiffeners were installed every 375 mm. The stiffeners were 6 mm thick and welded to the web and flange of the beam. The beam span length was 3000 mm. The width and the thickness of the deck were 500 mm and 55 mm, respectively. The concrete compressive strength was 27.8 MPa as evaluated through six cylindrical compressive tests conducted at 28 days. Thirty-six welded headed studs were used to attach the steel beam and the concrete deck for composite action.
A bearing device was designed to provide simply supported boundary conditions for the composite girder. The bearing device consisted of lug plates and cylindrical bars, as shown in Figure 2. Two types of lug plates were machined to simulate hinge and roller conditions. Circular holes were created in the lug plates for the hinge, and slotted holes were created for the roller.
To control the temperature at the top of the deck, a positive temperature coefficient (PTC) film was attached as shown in Figure 3. A PTC film was a planar element that generated heat using electrodes; it was formed by fixing a copper foil on a film coated with a carbon heating element. A temperature controller was attached to the PTC film, and the PTC film was covered with a curing cloth to maintain a constant temperature. The temperature of the top deck could be increased up to 50 °C using the PTC film.
In this study, accelerations and static displacements were measured in addition to temperature changes. Eight (T1 to T8) adhesive-type thermocouples (RKC ST-50 (RKC Instrument Inc., South Bend, IN, USA)) were used to measure the temperature distribution of the specimen. Three thermocouples were attached at the midspan, and one thermocouple was attached at one-sixth and one-third of the span on the top deck. Along the depth direction, three thermocouples were attached underneath the top flange, midweb, and above the bottom flange separately. The thermocouples were connected to a data logger (Hioki Memory Hilogger LR8431, (Hioki, Seoul, Republic of Korea)). Additionally, a thermometer was installed near the specimen to measure the room temperature. Two displacement transducers (CDP-25 (TML, Tokyo, Japan)) were installed to measure the static responses of the specimen with temperature variations. For the vertical response, one displacement transducer was installed under the steel beam at the midspan. The other transducer was installed horizontally at the end of the roller support to measure its movement. Five (A1 to A5) accelerometers (PCB 393 B12 (PCB Piezotronics, Depew, NY, USA)) with a sensitivity of 10 V/g, a resolution of 8 × 10⁻⁶ g rms, and a frequency range of 0.15–1000 Hz were installed under the bottom flange using magnets to measure the vertical acceleration of the specimen. The accelerometers were positioned at uniform intervals of 0.56 m with the first accelerometer (A1) and the final accelerometer (A5) located 0.38 m away from the supports, as shown in Figure 4a,b.

3.2. Modal Tests

Modal tests were conducted to examine the natural frequencies of the specimen in response to temperature variations. Figure 5 schematically illustrates the modal testing process adopted in this study. The specimens were excited using an impact hammer (PCB 086C03). The excitation force was applied perpendicular to the concrete deck. Five excitation points (E1 to E5) were used to excite the specimen. Accelerations were measured using five accelerometers (A1 to A5) that were installed along the bottom flange of the steel beam, as shown in Figure 4. The acceleration signals were amplified using a signal conditioner (PCB 483C05) and acquired using a dynamic data logger (IOLITE 6 × STG). The acquired data were analyzed using the Dewesoft X software to calculate the frequency response functions (FRFs) and natural frequencies. The five FRFs obtained by changing the impact point along the span were averaged to determine the modal frequencies under specific temperature conditions.
To investigate the effects of temperature variation, modal tests were conducted by varying the top deck temperature from 20 to 50 °C. The room temperature was controlled at 20 °C. The FRFs were calculated using the fast Fourier transform algorithm. The frequency range was 0–200 Hz. As shown in Figure 6a, the second peak response of the FRFs, which corresponded to the bending mode, appeared between 35 and 40 Hz. The coherences in this frequency range were between 0.98 and 1, as shown in Figure 6b; hence, the FRFs were presumed to be reliable.
Figure 7 presents the results obtained from the modal tests conducted at various temperatures. The frequency exhibited an inverse relationship with the temperature, which conforms to the results of previous studies [5,6,31,32,33,34]. This phenomenon can be attributed to the reduction in the stiffness of the materials with increasing temperature. Kim and Park [35] investigated a steel plate girder bridge model and observed that the frequency of the second bending mode decreased by approximately 0.44% when the temperature rose by one degree. Liu et al. [6] investigated the natural frequencies of concrete slabs and the modal frequencies decreased by 0.226% per degree relative to the modal frequencies at a temperature of 0 °C. Xia et al. [36] conducted a two-year dynamic test on a reinforced concrete slab in a laboratory and observed a reduction in the natural frequency of the bending mode of 0.13% to 0.23% per degree. In this study, linear regression analysis revealed that the frequency decreased at a rate of 0.36% per degree as the temperature increased, as indicated Equation (6).
F = 0.0036 T + 37.82
Here, F is the natural frequency and T is the temperature (°C).
When comparing the test results to those of other studies, it became apparent that the frequency decreased with increasing temperature. The variation in rates among studies can be attributed to differences in materials and testing conditions. In general, the observed consistency in the decreasing trend underscores the impact of temperature on structural dynamics while recognizing diverse factors influencing these outcomes across different research contexts.

4. Numerical Simulations for Modal Testing

The effects of temperature on the natural frequencies of the specimen with were evaluated through FE simulations. To account for thermal effects on materials, the temperature dependencies of the elastic modulus and thermal coefficients were incorporated into the FE model. To simulate realistic heat distribution and thermal expansion effects in the specimen, heat transfer and thermal expansion analyses were conducted consecutively prior to modal analysis. The thermal displacements obtained from the heat expansion analysis were incorporated into the modal analysis as initial displacement fields. Additional details on our numerical simulations are provided in the following subsections.

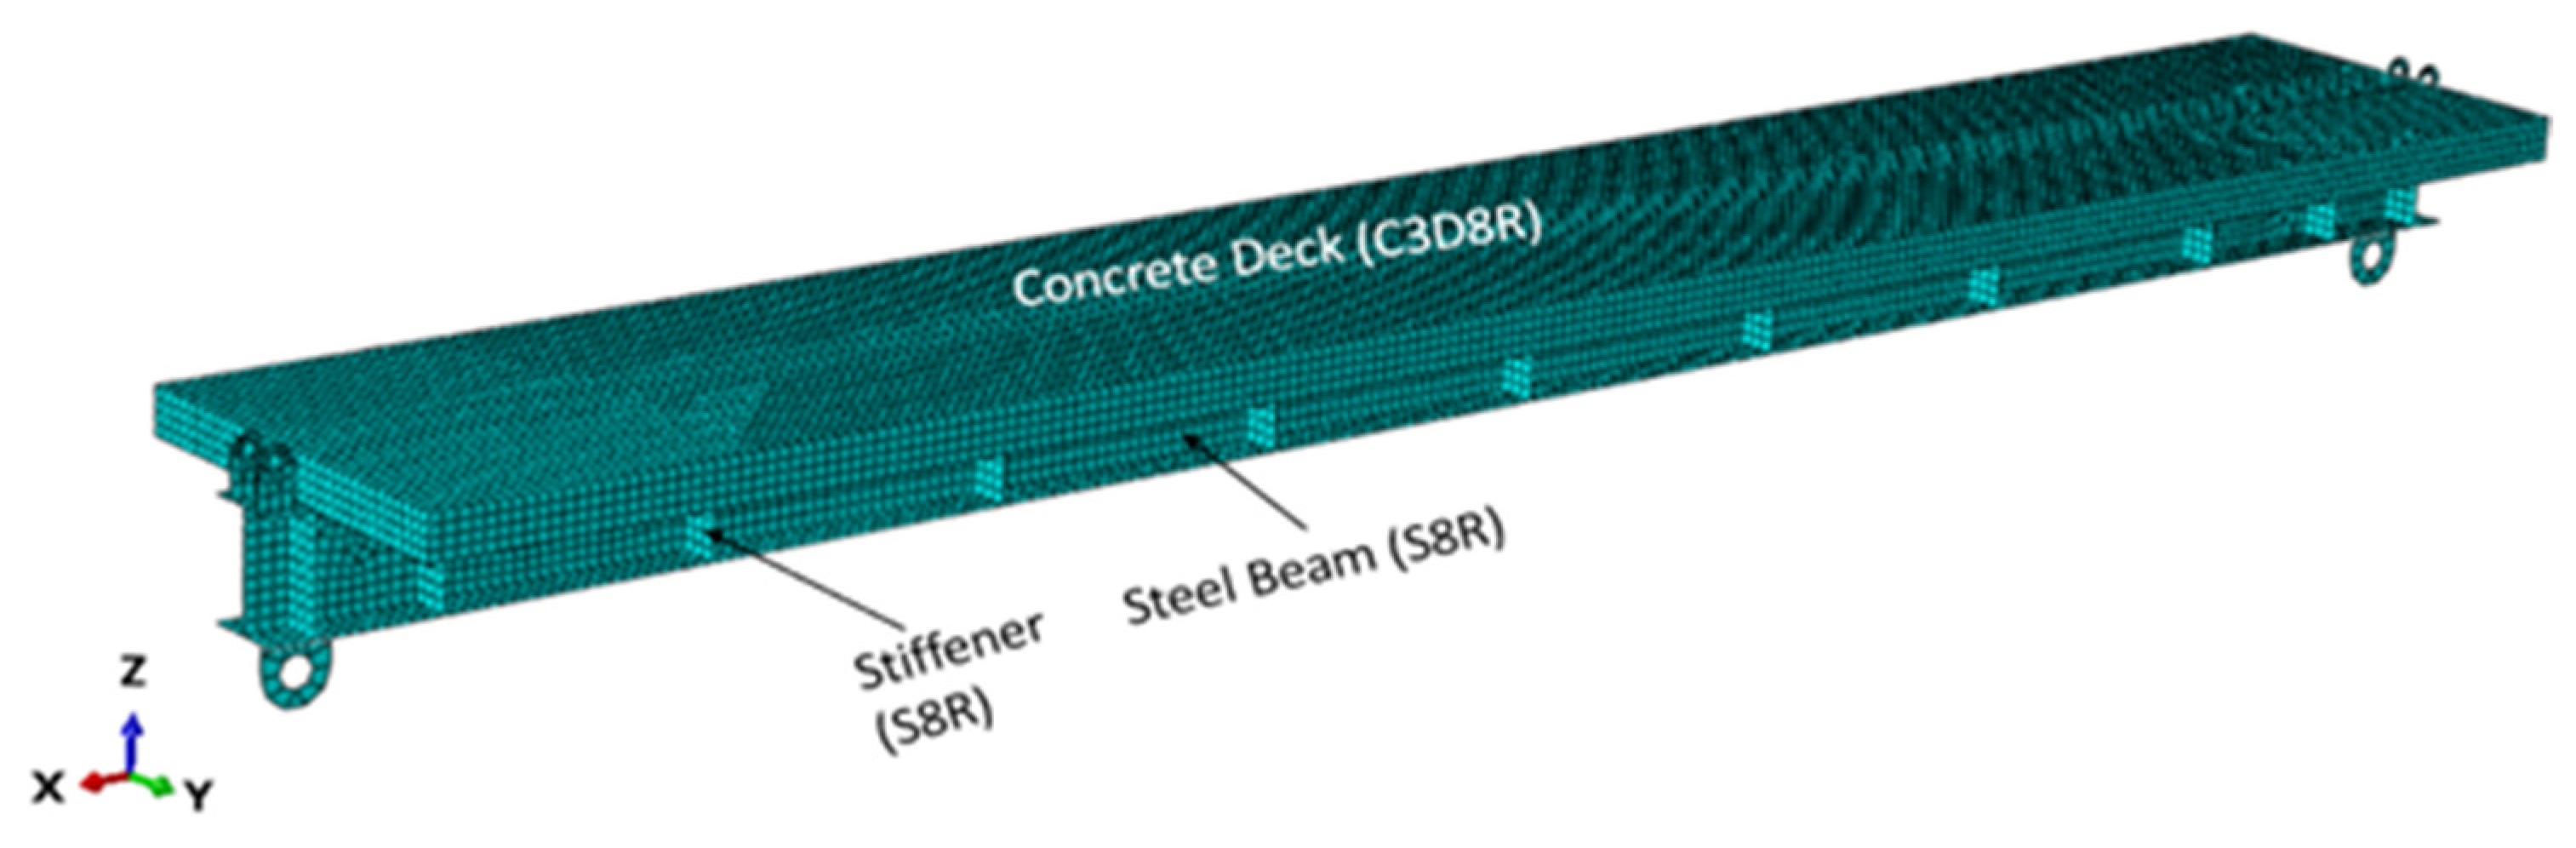
4.1. Numerical Model

An FE model of the specimen was constructed using ABAQUS/Standard 2021 (Figure 8). The concrete deck was modeled with eight nodes of solid elements (C3D8R) and a steel girder with eight nodes of shell elements (S8R). The reinforcement of the deck was modeled with two nodes of truss elements (T32D) embedded into the deck elements. A surface constraint (tie condition) was used to bond the top flange of the steel beam and the bottom surface of the concrete slab to obtain a composite action. Support conditions were simulated using a hinge at one end and a roller at the other.
Linear elastic material models were utilized in the FE analysis. Table 1 lists the elastic moduli of the concrete and steel used in our analysis. The elastic modulus of the concrete deck was determined using Equation (1) from Section 2.1 to account for temperature dependency. Equation (2) was used to calculate the elastic moduli of the steel beams and reinforcing bars. The other material properties used in the FE model are summarized in Table 2. Notably, the specific heat and thermal conductivity of steel are also temperature-dependent. Therefore, Equations (3) and (4) were used to determine these properties, as shown in Table 3.
Concrete is a heterogeneous material composed of mortar and aggregate. The tensile strength of the mortar is lower than that of the aggregate. Therefore, concrete is susceptible to cracking between the mortar and the aggregate. The development of cracks in the concrete deck resulted in a reduction in the moment of inertia of the section. To account for this phenomenon, 70% of the flexural rigidity of the un-cracked condition was applied in the FEA according to the ACI318-19 standard [37].

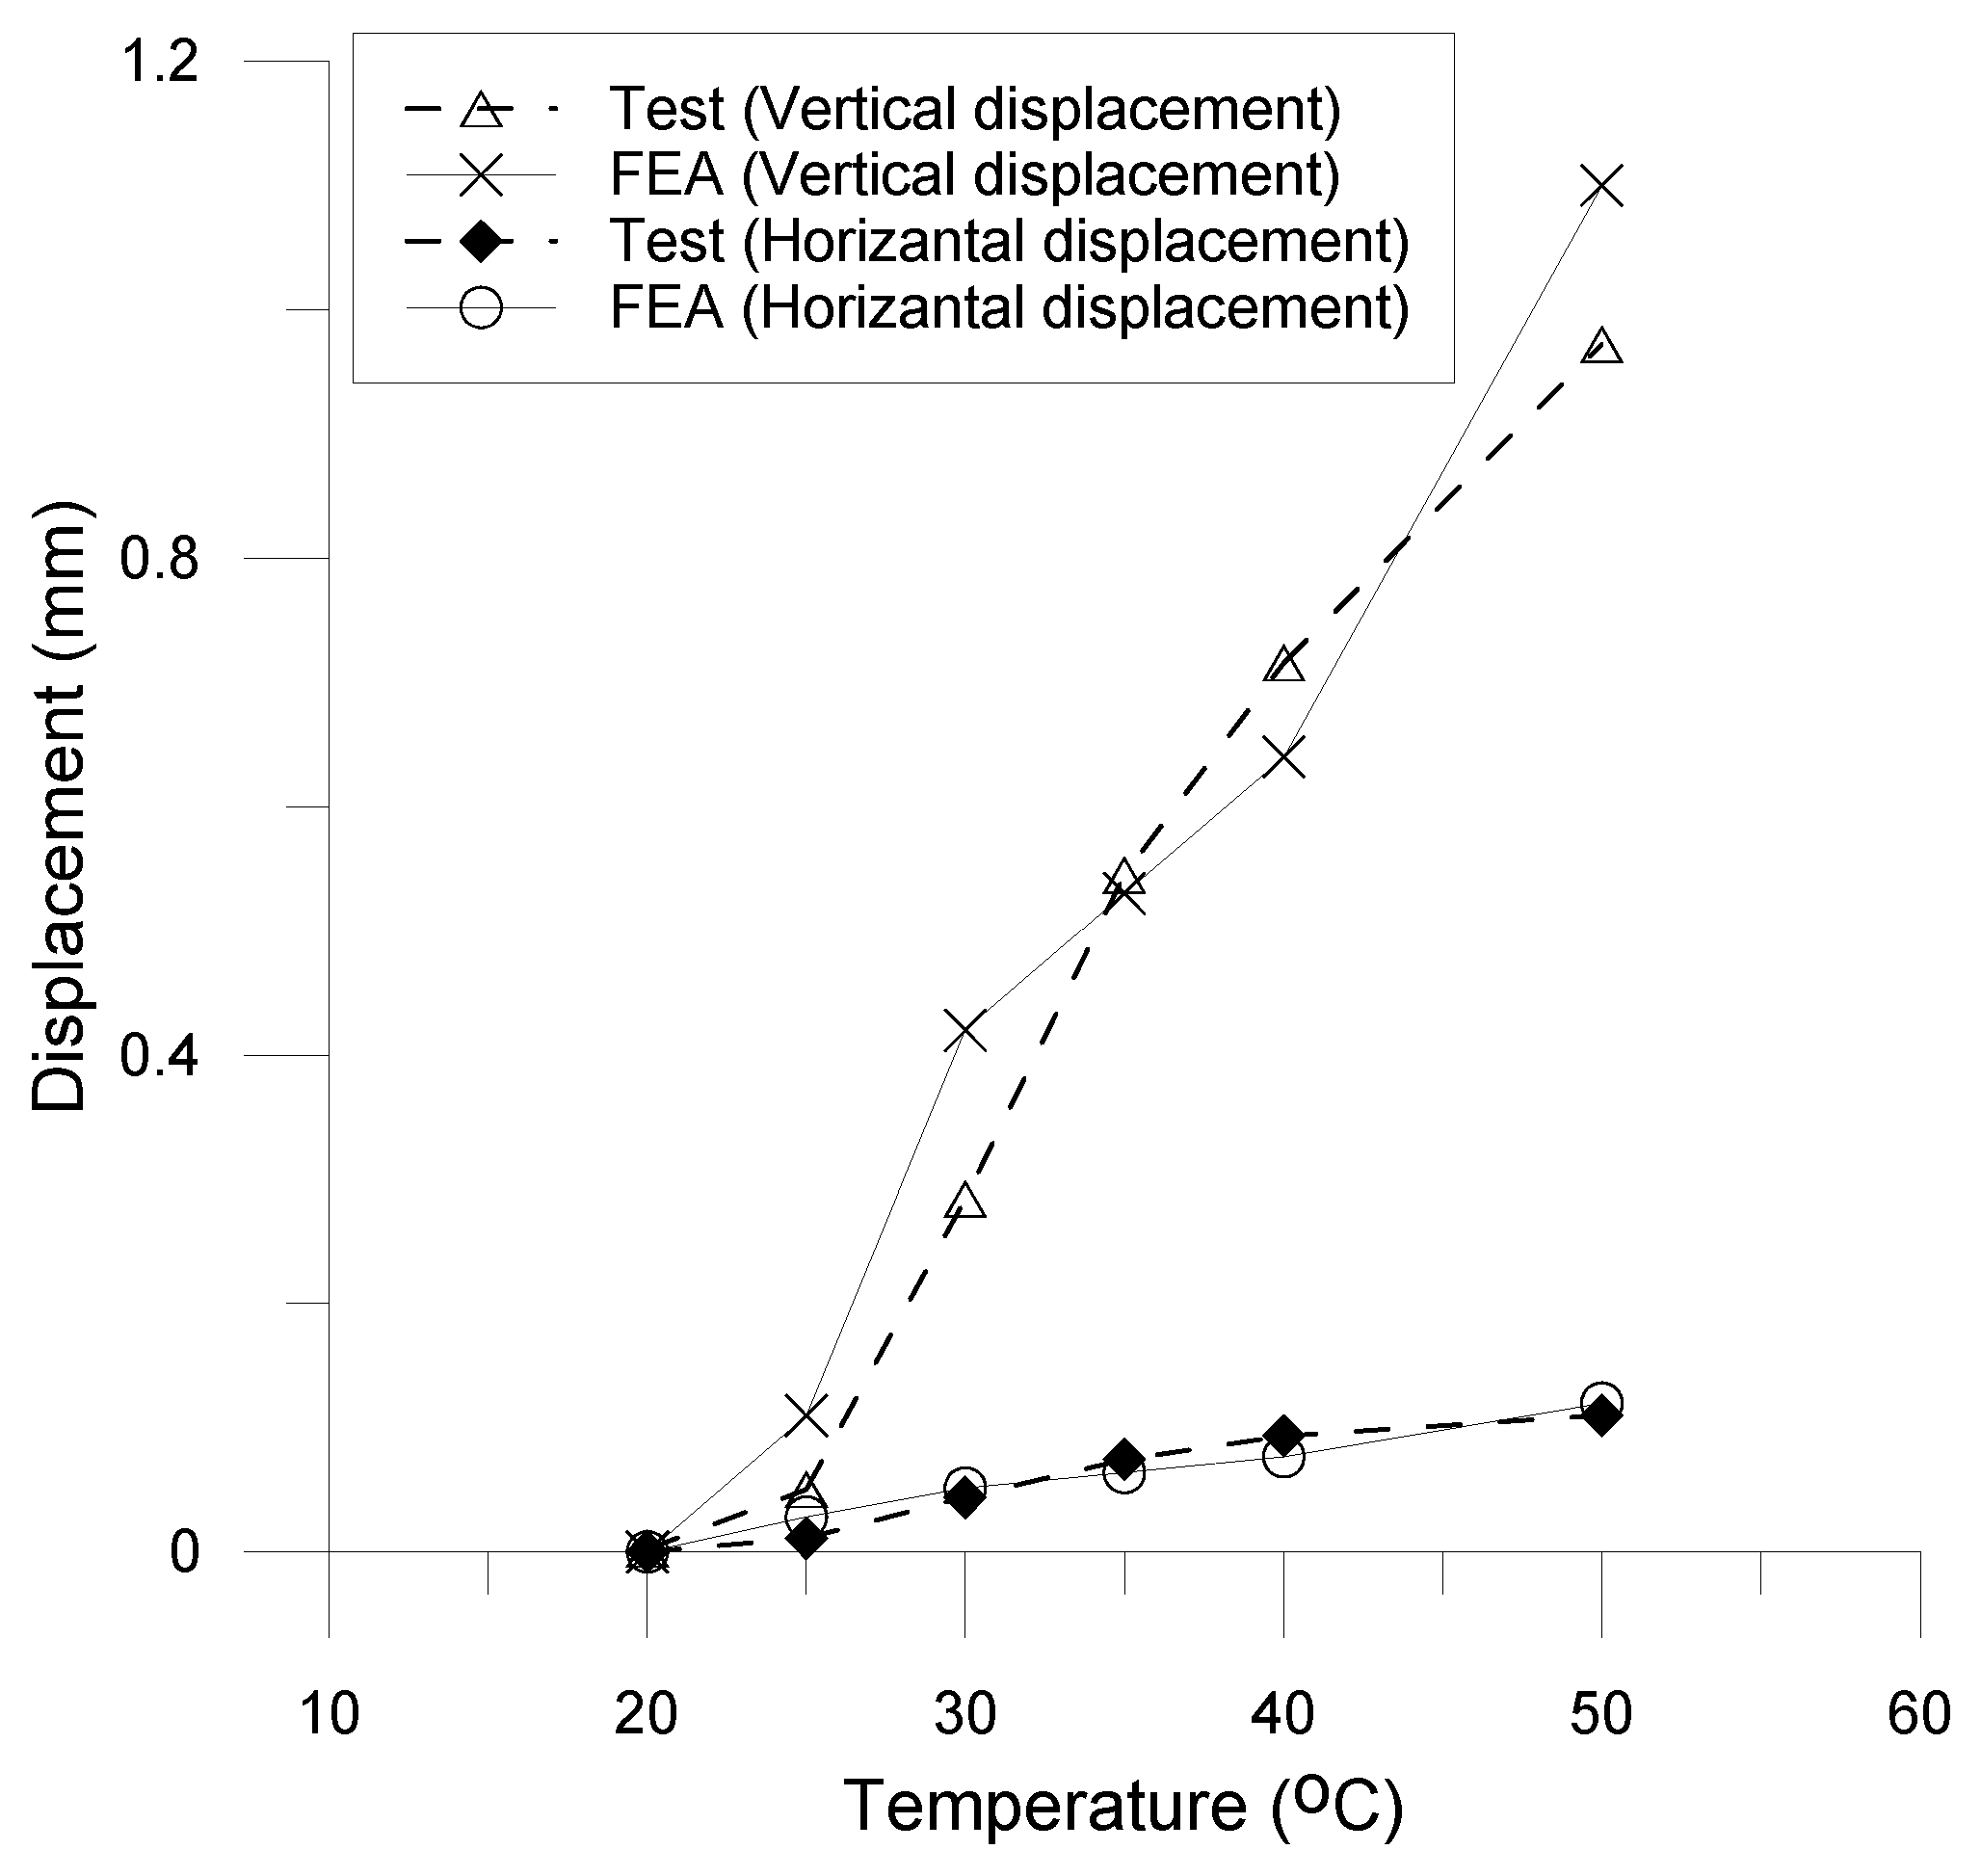
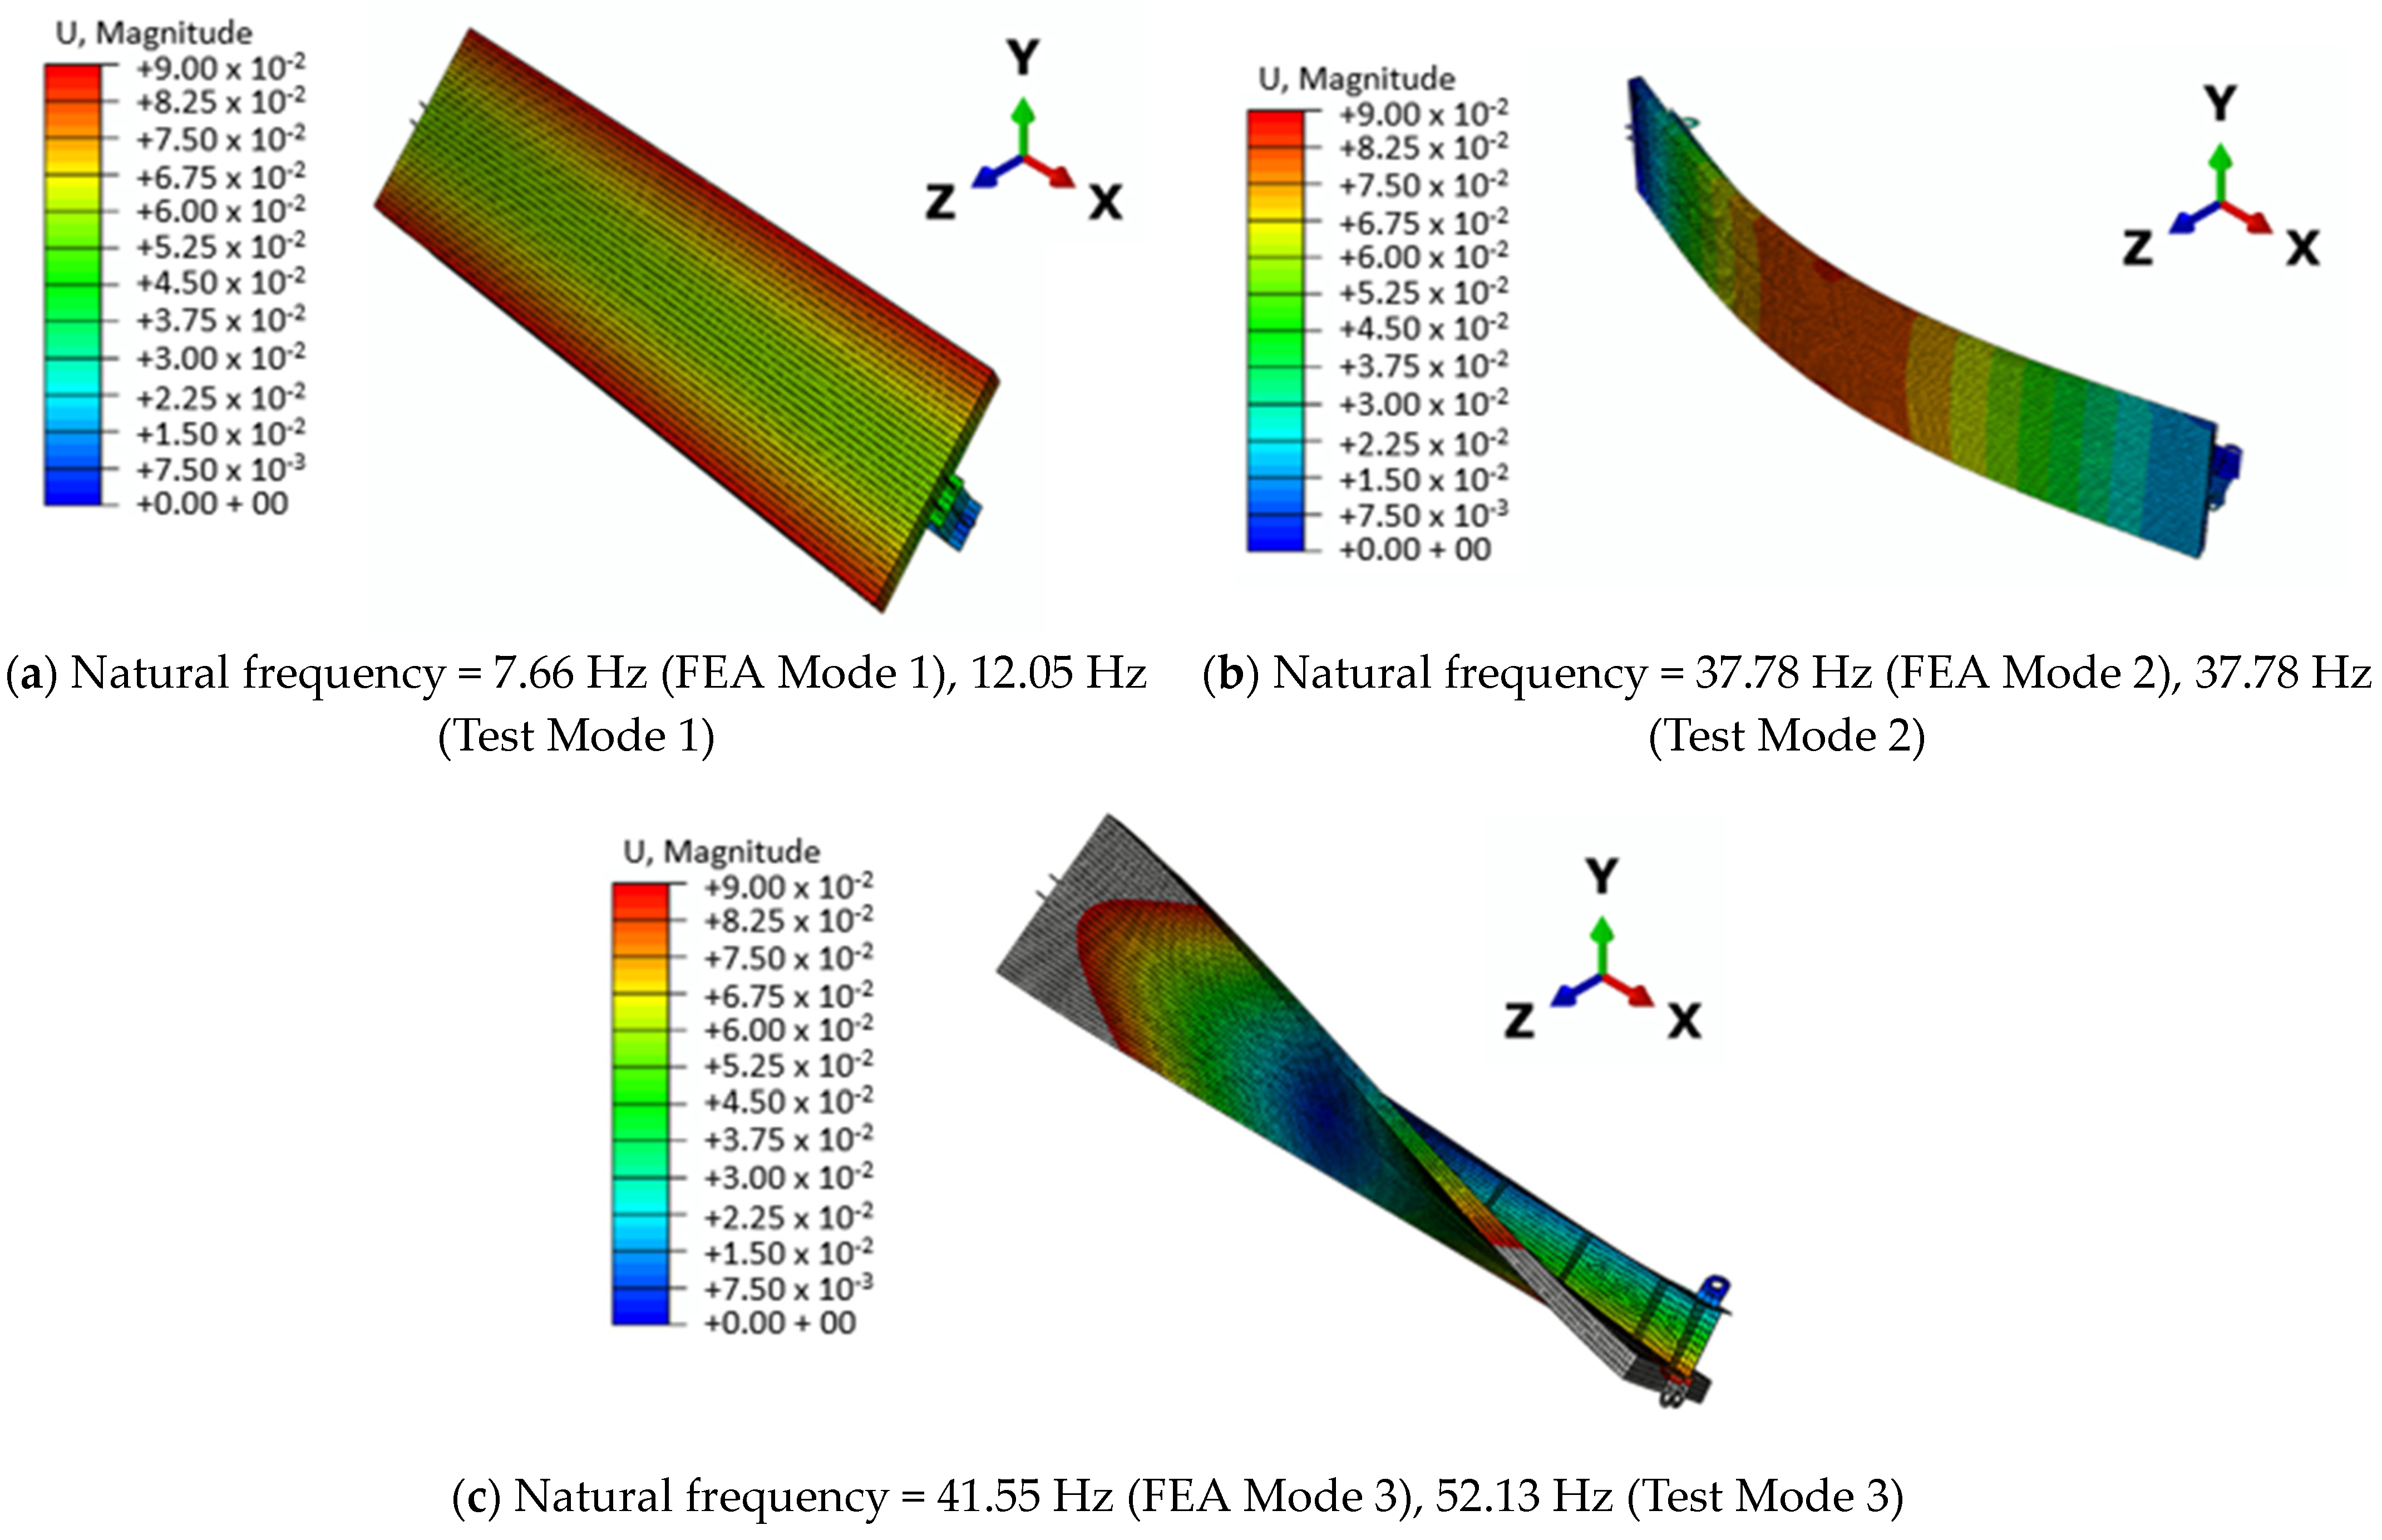
4.2. Simulation Procedure and Results

To account for thermal effects, the natural frequencies of the specimens were determined through three consecutive analyses: heat transfer, heat expansion, and frequency. Heat transfer analysis was conducted to obtain the temperature field in the specimen. For the heat transfer analysis, the sink condition was assumed to be 20 °C, simulating the room temperature in the test. The temperature of the top deck was increased from 20 to 50 °C. The temperature distribution was measured and compared with the test data along the depth of the specimen. As shown in Figure 9, the temperature gradient obtained from the heat transfer analysis matches well with the test data. Evidently, the temperature decreased with depth and converged to room temperature. This phenomenon could be caused by heat conduction and emission processes. The heat flux generated by the PTC film from the deck to the steel beam was measured. Considering the large surface area of the beam compared to its volume, its heat emission was greater than that of the deck. Therefore, the temperature at the bottom of the beam was close to room temperature.
A temperature change in the specimen induces thermal expansion. Thermal stress can also occur, depending on the boundary conditions. To account for these factors, heat expansion analysis was conducted using the temperature field obtained from the heat transfer analysis. Hinge−roller boundary conditions were adopted for the analysis to match with that of the test specimen. Figure 10 presents the displacement variations measured at the bottom of the midspan and the end of the roller support. The analysis results match well with the test and show the same tendency along the top deck temperature. The displacement at the midspan deflected upward, as the top temperature increased. This phenomenon can be attributed to the uneven temperature distribution along the depth and the different thermal expansion coefficients between concrete and steel. As a result of the temperature gradient along the depth, the concrete deck expanded more than the steel beam. Therefore, a convex-shaped displacement of the specimen occurred, which agrees with the displacement results presented in Figure 10. The temperature gradient and discrepancy in the expansion rates resulted in convex deformation of the girder. Such deformation can change the bending stiffness of the specimen, thereby affecting its natural frequencies under bent conditions.
The deformed field obtained from the heat expansion analysis was used as the initial condition for the frequency analysis. Three distinct modes were computed from the frequency analysis: the first mode corresponds to the torsional mode, the second mode corresponds to the bending mode, and the third mode corresponds to the torsional bending mode. These results are consistent with those of the modal tests. To investigate the effects of temperature on the natural frequency corresponding to the bending mode, the temperature of the top deck was varied from 20 to 50 °C. Figure 11 presents the natural frequencies and the corresponding mode shapes determined from the FEA. The specimen was based on a girder structure, rendering it vulnerable to torsion. A plate girder bridge consists of multiple girders, and its torsional rigidity is considerably higher than that of the specimen. Therefore, the bending model is typically fundamental; hence, we focused on the natural frequency corresponding to the bending mode.
Figure 12 presents the FE results, which were compared to the test results corresponding to the bending mode. The circular markers with solid lines indicate the FEA results, where the temperature dependence of the elastic modulus and thermal properties are incorporated in the FE model. The FE model with the temperature dependencies predicted the natural frequency as 37.78 Hz at 20 °C. As the temperature rose, the natural frequency exhibited a decreasing tendency conforming to the test results with a predicted value of 37.66 Hz at 50 °C. The difference between the FE results and the linear regression of the test results varied from −0.05% to 0.06%, demonstrating that the FE simulation results generally matched well with the test results.
The diamond shapes with solid lines represent the FE results without considering the temperature dependency of the elastic modulus. In contrast to the temperature-dependent model, the FE model without the temperature dependence of the elastic modulus yielded an increase in natural frequency with temperature. This can be attributed to the convex deformation at the midspan induced by the temperature gradient. The convex deformation increased with temperature, thereby increasing the geometrical stiffness of bending (Figure 10). Therefore, the frequency increased with temperature. Otherwise, the frequency would be steady along the temperature direction for the FE model without any temperature dependency. In Figure 12, the triangular markers with a solid line represent the results of the FEA without considering the temperature dependencies of the specific heat and the thermal conductivity of the steel. This model yielded a decrease in the natural frequency, similar to the model incorporating the temperature dependencies of the specific heat and the thermal conductivity. The maximum frequency difference between the two models was only 0.03%, indicating that the temperature effects of the specific heat and the thermal conductivity were not comparable to those of the elastic modulus. This suggests the importance of considering the temperature-dependent nature of materials, particularly their moduli of elasticity, for achieving a comprehensive understanding of their dynamic responses to temperature variations.
Figure 13 presents the variation in the frequency differences between the linear regression, the FE model with an independent modulus, and the FE model with independent thermal properties, and the FE model with a temperature-dependent elastic modulus and thermal properties. Evidently, the maximum difference was 0.03% for the FE model with the independent thermal properties in the temperature range of 20–50 °C. The maximum difference was 0.06% for the linear regression model and fluctuated with temperature, which could be attributed to the nonlinear relationship between specific heat and temperature, as indicated in Equation (3). As mentioned previously, the natural frequency of the FE model with an independent modulus of elasticity tended to increase with temperature, which caused the frequency difference to increase, as indicated by the square markers in Figure 13. The maximum difference was 0.42% for the FE model with an independent modulus.

5. Summary and Conclusions

In this study, the effects of temperature on the natural frequencies of composite girders were investigated. For this purpose, a specimen simulating a composite girder was fabricated, and modal tests were conducted by varying the temperature of the top deck. FE simulations were conducted to verify the test results and analyze temperature effects. Based on the test and simulation results, the following conclusions were drawn:
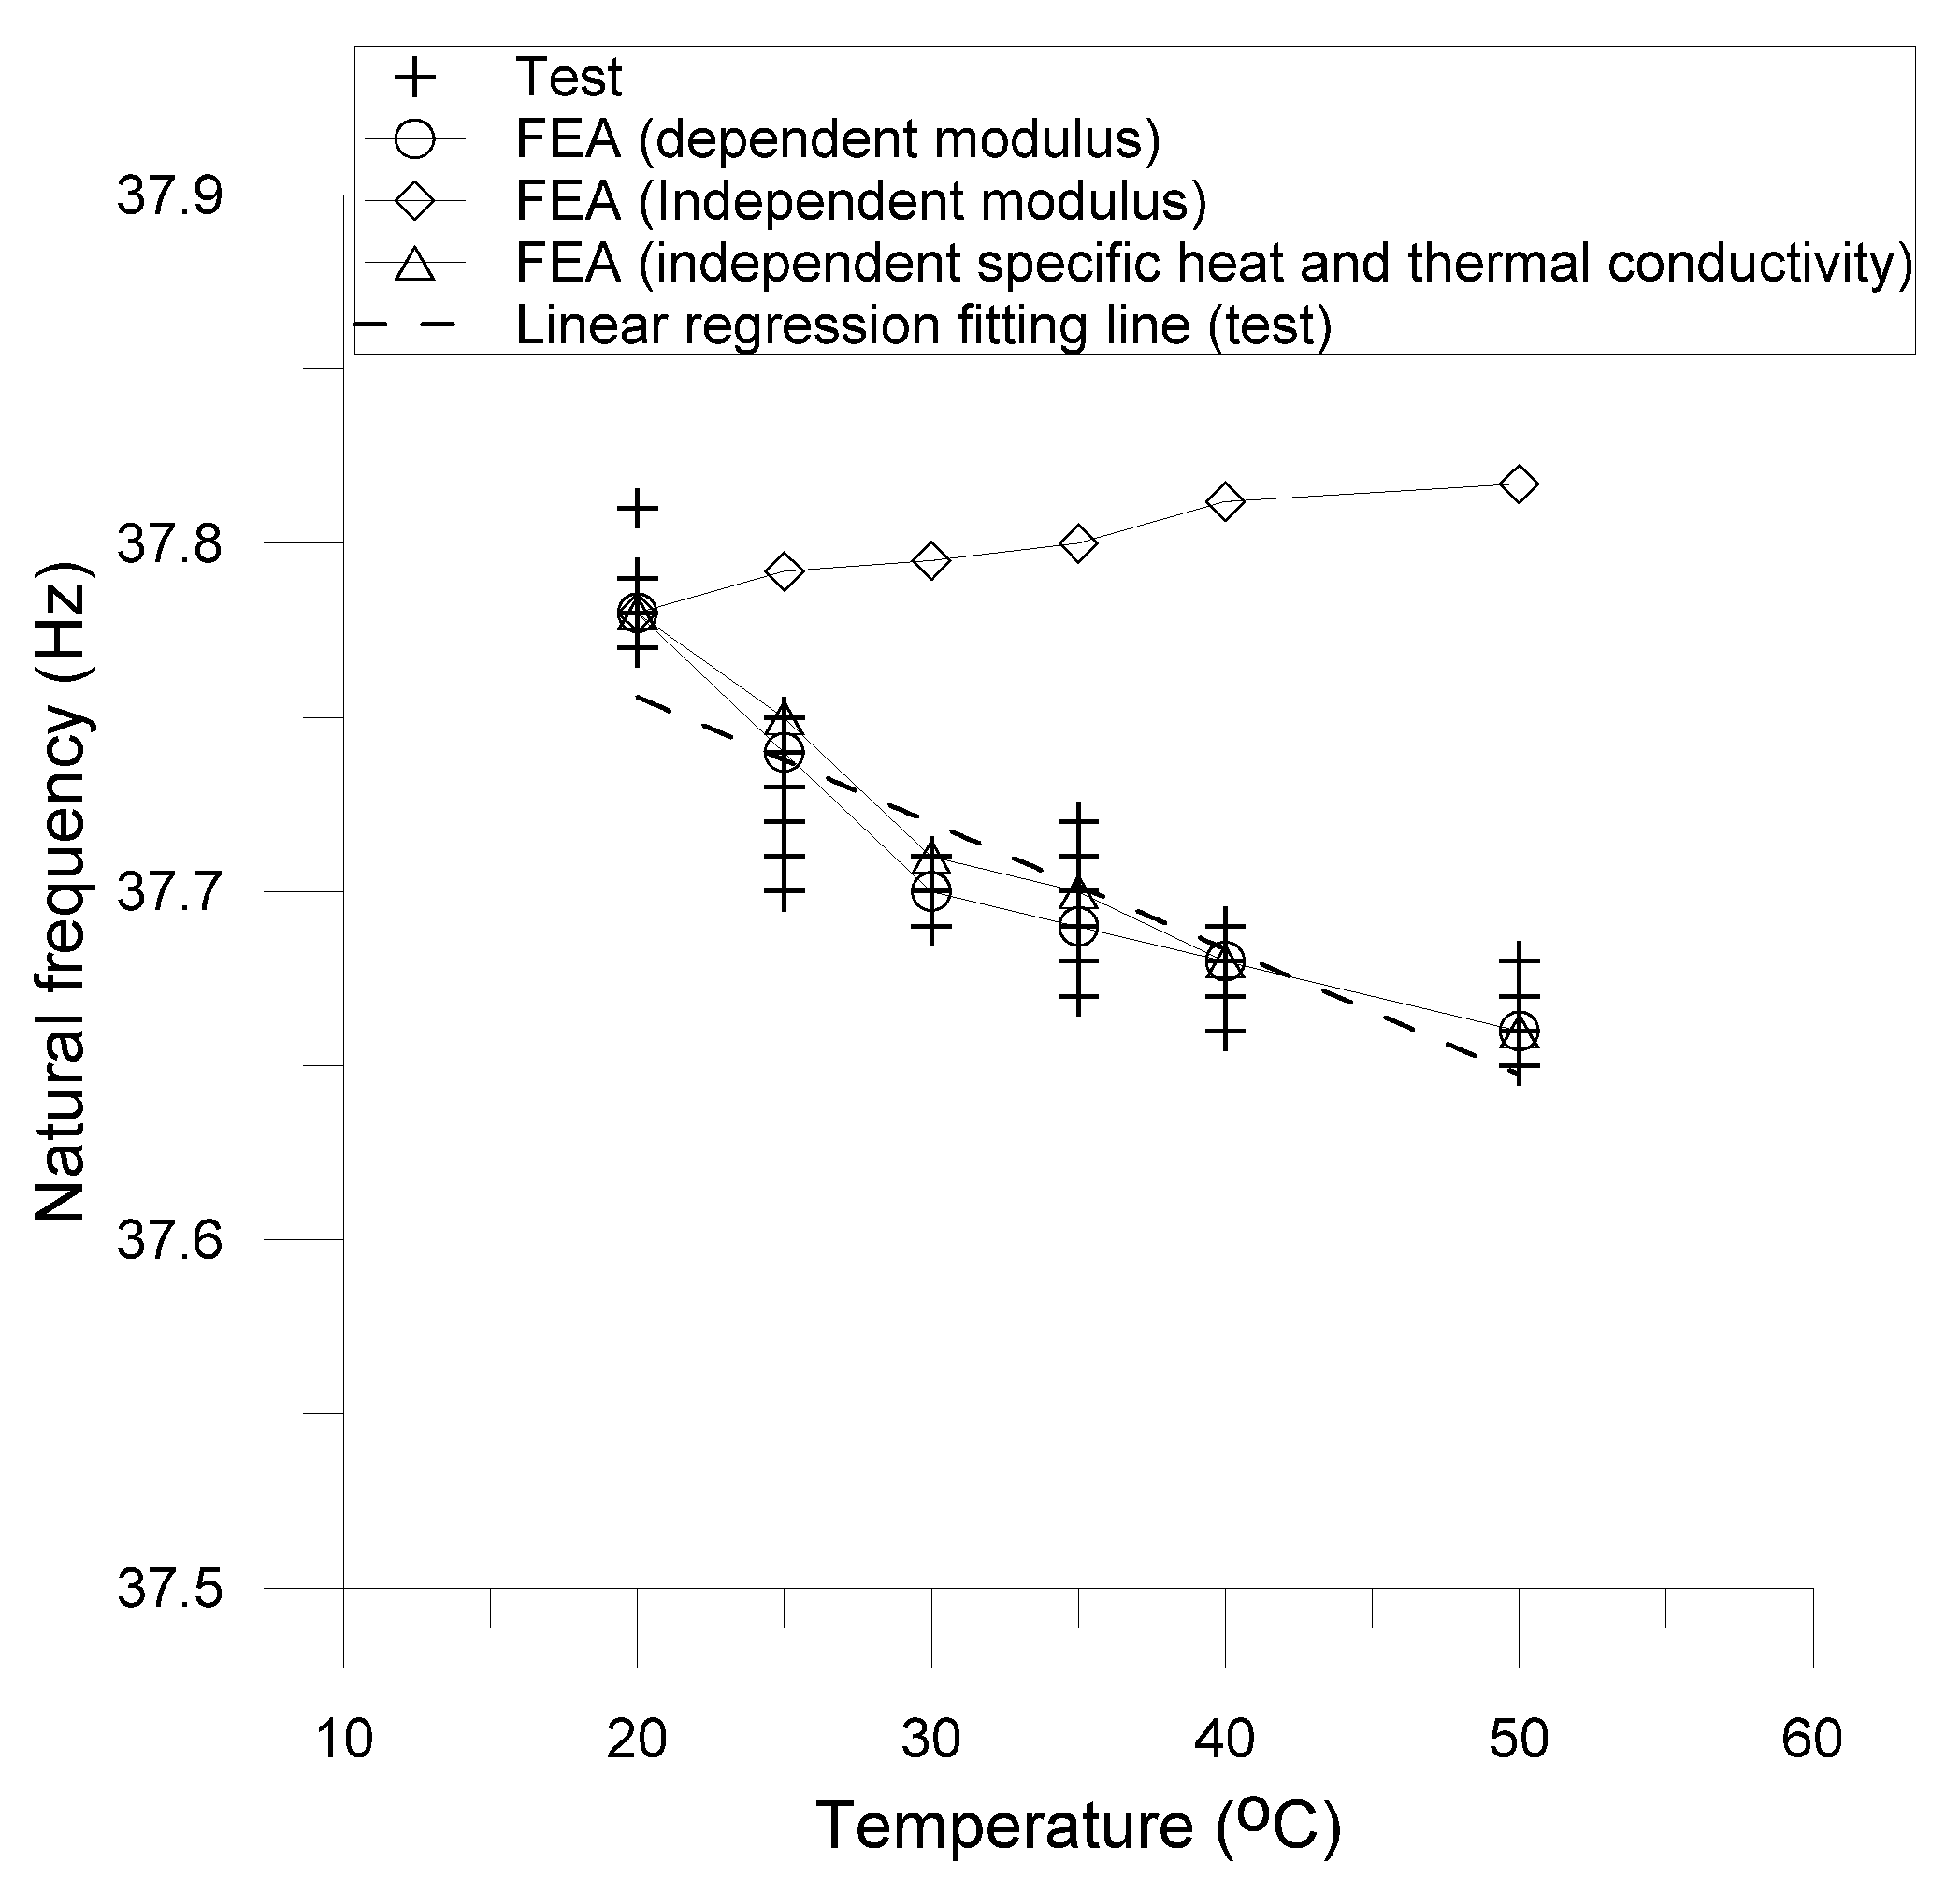
  • The natural frequency of the composite girder tended to decrease, as the temperature of the top deck increased. The frequency decreased at a rate of 0.36% per degree according to the linear regression analysis of the test data in a range of 20–50 °C. The standard deviation of the linear model was 0.038 Hz.
  • The decreasing tendency of the frequency was primarily caused by the temperature dependency of the elastic modulus. Without this dependency, the frequency increases with temperature. It was presumed that the convex-shaped deformation induced by the temperature gradient increased the flexural stiffness of the composite girder such that the natural frequency increased. The frequency increased by up to 0.1%, as the temperature increased from 20 to 50 °C with a simply supported boundary condition. Considering the fact that the frequency decrease rate was 0.36% per degree, the effect of increased stiffness was negligible in the simply supported composite girder.
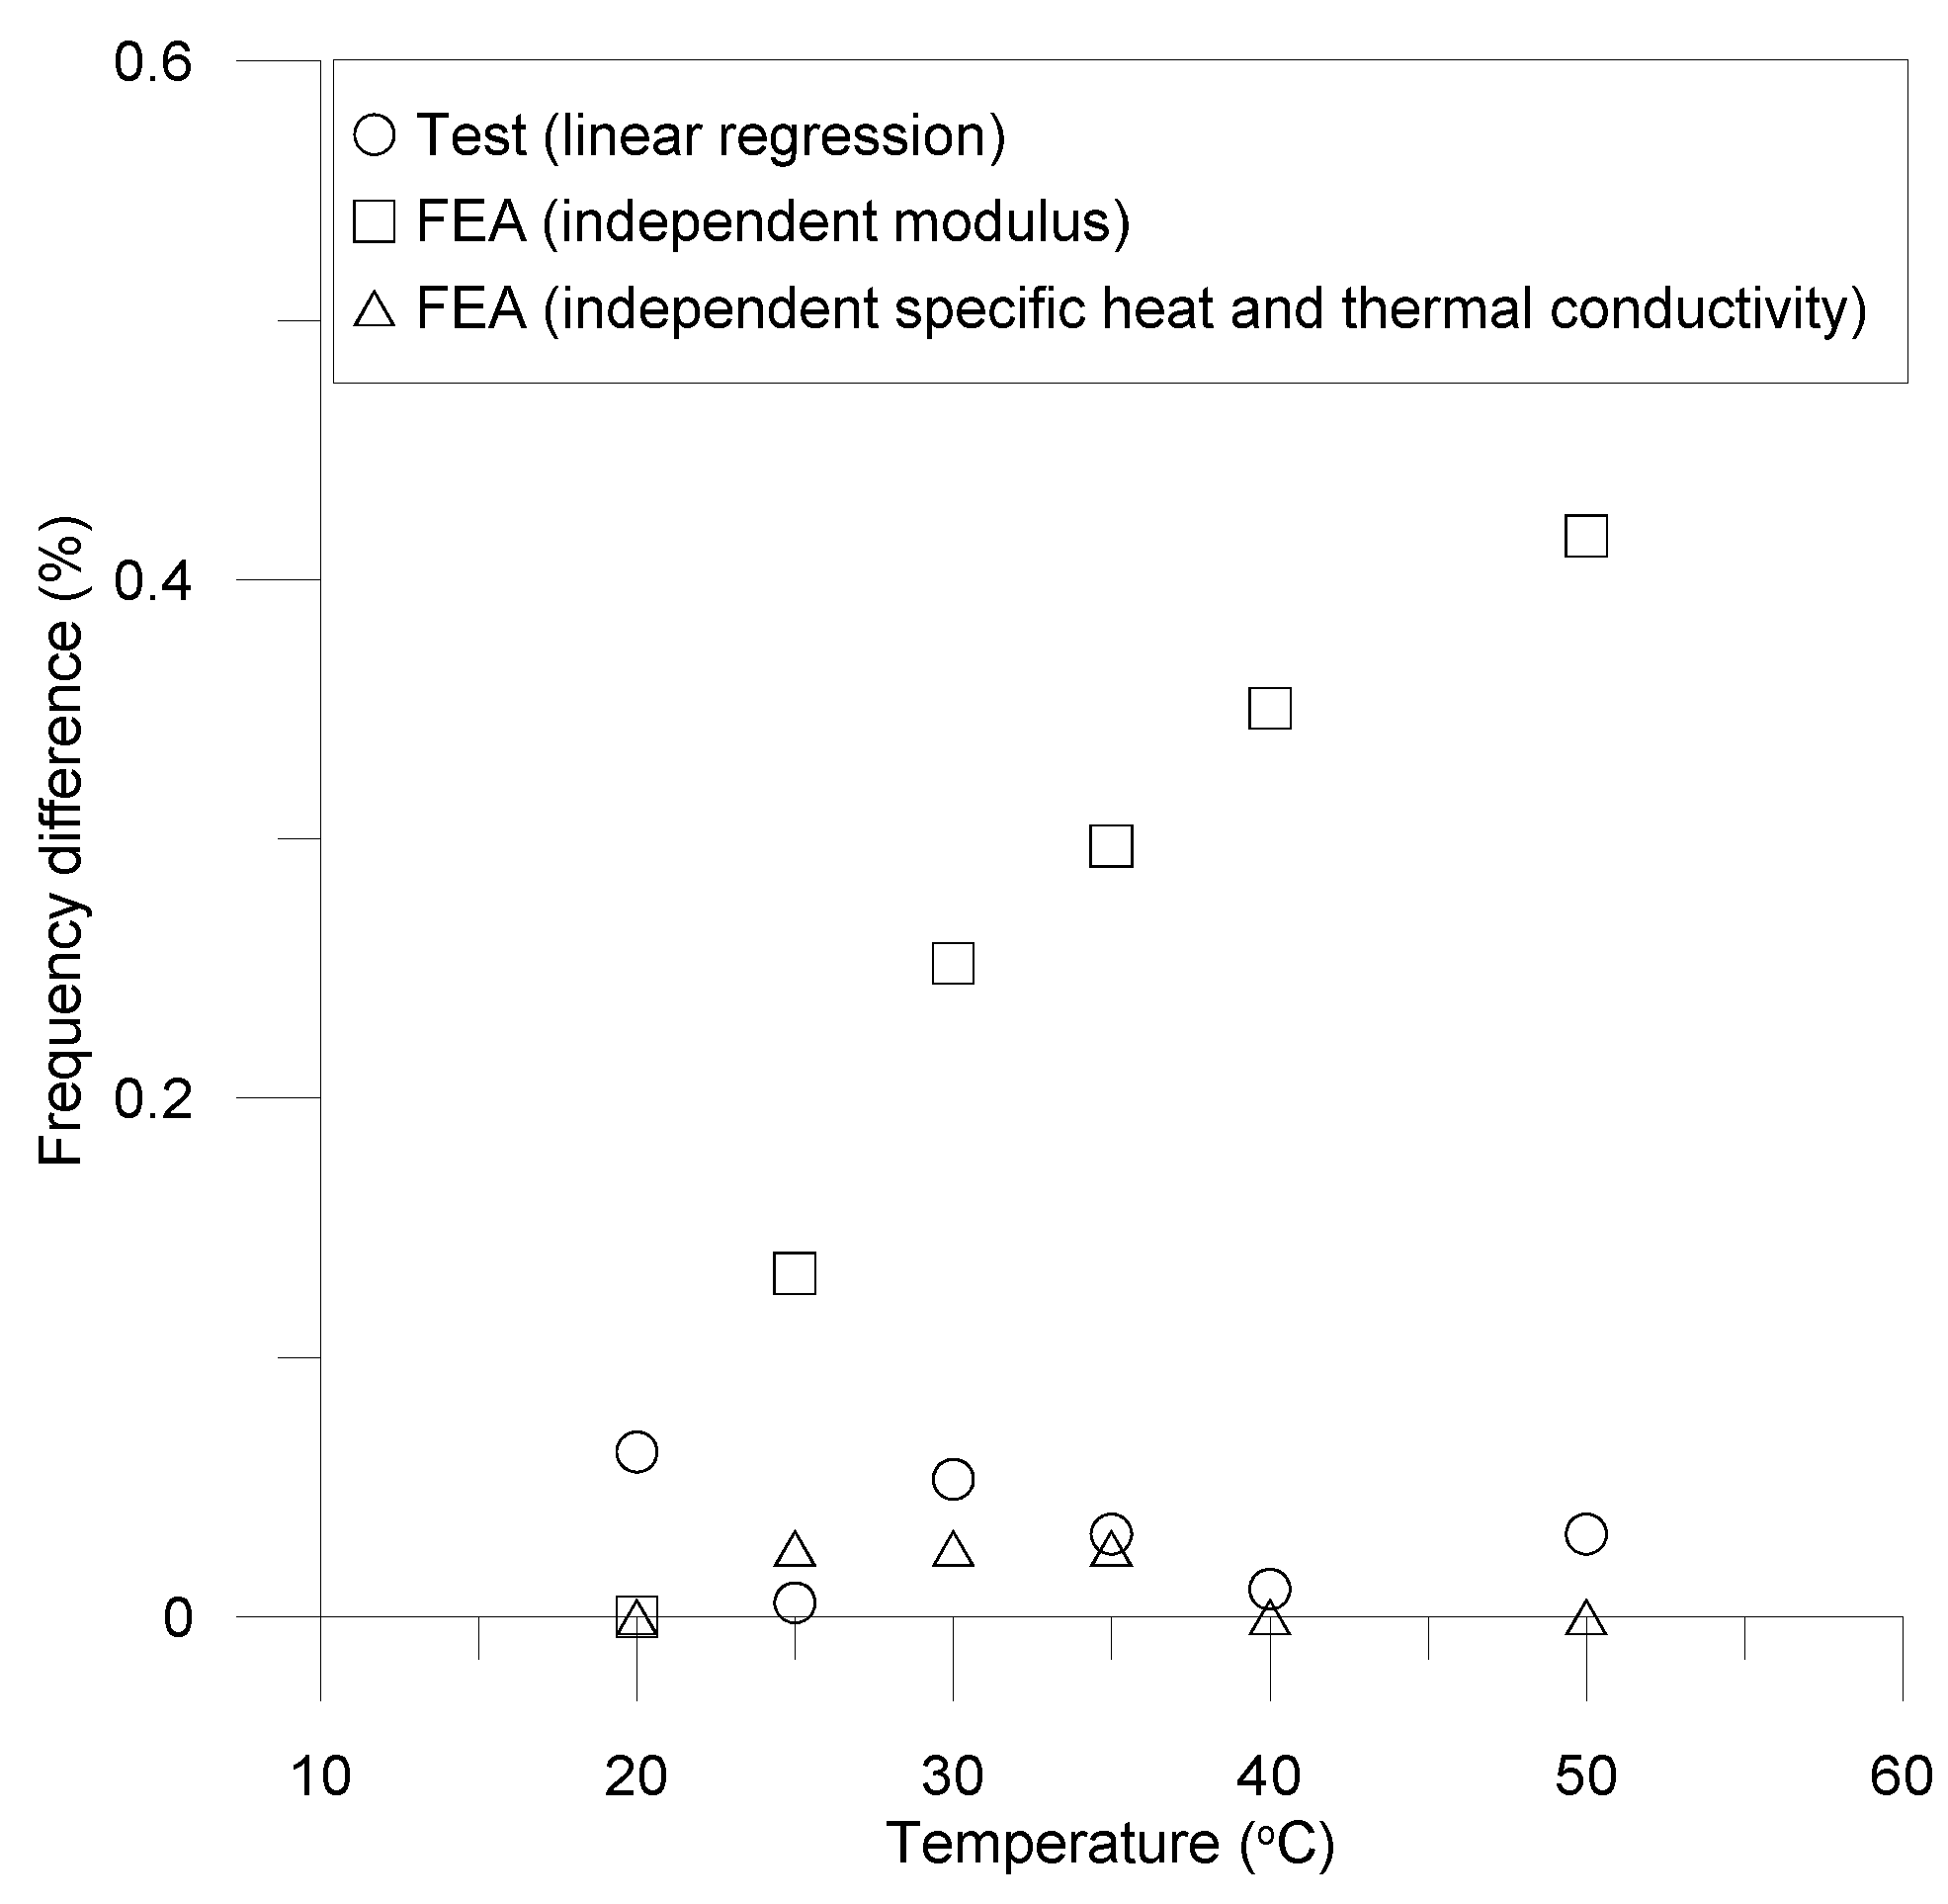
  • The specific heat and the thermal conductivity of steel are also dependent on temperature. They affect the natural frequency with temperature changes; however, the maximum difference in the case considering these temperature dependencies was only 0.03%. Therefore, they are not comparable to the elastic modulus effect.
  • The linear regression model exhibited a maximum frequency difference of 0.06% compared to the detailed FE simulation results at 20 °C, which decreased as the temperature increased. The difference fluctuated with temperature, which can be attributed to the nonlinear nature of the changes in specific heat with temperature.
The proposed linear regression model is an initial model designed to exclude the effects of temperature on composite girders. The model is based on simply supported boundary conditions and only covers a temperature range of 20–50 °C. Therefore, further research is required to develop a generally applicable model.

Author Contributions

J.K. and B.H.C. conceptualized the test set up and procedures; A.P. performed tests and simulations; A.P. wrote the draft for the article; S.K. and B.H.C. gave advices on the tests and simulations; J.K. supervised this research program and finalized the article. All authors have read and agreed to the published version of the manuscript.

Funding

This research was supported by Basic Science Research Program of the National Research Foundation of Korea (NRF) funded by the Ministry of Education (NRF-2021R1I1A3049510).

Institutional Review Board Statement

Not applicable.

Informed Consent Statement

Not applicable.

Data Availability Statement

Data are available from the authors upon reasonable request.

Conflicts of Interest

The authors declare no conflicts of interest.

References

  1. Al-Hababi, T.; Alkayem, N.F.; Cui, L.; Zhang, S.; Liu, C.; Cao, M. The Coupled Effect of Temperature Changes and Damage Depth on Natural Frequencies in Beam-Like Structures. SDHM Struct. Durab. Health Monit. 2022, 16, 15–35. [Google Scholar] [CrossRef]
  2. Luo, J.; Huang, M.; Lei, Y. Temperature Effect on Vibration Properties and Vibration-Based Damage Identification of Bridge Structures: A Literature Review. Buildings 2022, 12, 1209. [Google Scholar] [CrossRef]
  3. Review, L.; Studies, C. This Is the Pre-Published Version. Temperature Effect on Vibration Properties of Civil Structures: A Literature Review and Case Studies. J. Civ. Struct. Health Monit. 2012, 2, 29–46. [Google Scholar]
  4. Zhou, H.F.; Ni, Y.Q.; Ko, J.M.; Wong, K.Y. Modeling of Wind and Temperature Effects on Modal Frequencies and Analysis of Relative Strength of Effect. Wind Struct. An Int. J. 2008, 11, 35–50. [Google Scholar] [CrossRef]
  5. Cai, Y.; Zhang, K.; Ye, Z.; Liu, C.; Lu, K.; Wang, L. Influence of Temperature on the Natural Vibration Characteristics of Simply Supported Reinforced Concrete Beam. Sensors 2021, 21, 4242. [Google Scholar] [CrossRef]
  6. Liu, H.; Wang, X.; Jiao, Y. Effect of Temperature Variation on Modal Frequency of Reinforced Concrete Slab and Beam in Cold Regions. Shock Vib. 2016, 2016, 4792786. [Google Scholar] [CrossRef]
  7. Cho, K.; Cho, J.R. Effect of Temperature on the Modal Variability in Short-Span Concrete Bridges. Appl. Sci. 2022, 12, 9757. [Google Scholar] [CrossRef]
  8. Zhou, G.D.; Yi, T.H. A Summary Review of Correlations between Temperatures and Vibration Properties of Long-Span Bridges. Math. Probl. Eng. 2014, 2014, 638209. [Google Scholar] [CrossRef]
  9. Ding, Y.L.; Li, A.Q. Temperature-Induced Variations of Measured Modal Frequencies of Steel Box Girder for a Long-Span Suspension Bridge. Int. J. Steel Struct. 2011, 11, 145–155. [Google Scholar] [CrossRef]
  10. Sun, L.; Zhou, Y.; Min, Z. Experimental Study on the Effect of Temperature on Modal Frequencies of Bridges. Int. J. Struct. Stab. Dyn. 2018, 18, 1850155. [Google Scholar] [CrossRef]
  11. Cheng, Y.C.; Shi, Y.P.; Tan, G.J. The Natural Frequency Calculation Method of Simply-Supported Beam in the Sunshine Temperature Field. Appl. Mech. Mater. 2013, 394, 364–367. [Google Scholar] [CrossRef]
  12. Peeters, B.; Roeck, G.D. One-Year Monitoring of the Z24-Bridge: Environmental Effects versus Damage Events. Earthq. Eng. Struct. Dyn. 2015, 30, 149–171. [Google Scholar] [CrossRef]
  13. Beskhyroun, S.; Wegner, L.D.; Sparling, B.F. Integral Resonant Control Scheme for Cancelling Human-Induced Vibrations in Light-Weight Pedestrian Structures. Struct. Control Health Monit. 2011, 19, 55–69. [Google Scholar] [CrossRef]
  14. Tan, H.; Qian, D.; Xu, Y.; Yuan, M.; Zhao, H. Analysis of Vertical Temperature Gradients and Their Effects on Hybrid Girder Cable-Stayed Bridges. Sustainability 2023, 15, 1053. [Google Scholar] [CrossRef]
  15. Xiao, S.; Neti, S.; Suleiman, M.T.; Naito, C. A Modeling Approach of Heat Transfer of Bridges Considering Vehicle-Induced Thermal Effects. J. Appl. Meteorol. Climatol. 2018, 57, 2851–2869. [Google Scholar] [CrossRef]
  16. Peng, G.; Nakamura, S.; Zhu, X.; Wu, Q.; Wang, H. An Experimental and Numerical Study on Temperature Gradient and Thermal Stress of CFST Truss Girders under Solar Radiation. Comput. Concr. 2017, 20, 605–616. [Google Scholar] [CrossRef]
  17. Liu, J.; Liu, Y.; Zhang, G. Experimental Analysis of Temperature Gradient Patterns of Concrete-Filled Steel Tubular Members. J. Bridg. Eng. 2019, 24, 04019109. [Google Scholar] [CrossRef]
  18. Hager, I.; Krzemień, M. An overview of concrete modulus of elasticity evolution with temperature and comments to European code provisions. In Proceedings of the IFireSS—International Fire Safety Symposium, Coimbra, Portugal, 20–22 April 2015. [Google Scholar]
  19. Shoukry, S.N.; William, G.W.; Downie, B.; Riad, M.Y. Effect of Moisture and Temperature on the Mechanical Properties of Concrete. Constr. Build. Mater. 2011, 25, 688–696. [Google Scholar] [CrossRef]
  20. Naus, D.J.; Graves, H.L. A Review of the Effects of Elevated Temperature on Concrete Materials and Structures. Int. Conf. Nucl. Eng. 2006, 42428, 615–624. [Google Scholar] [CrossRef]
  21. fib Bulletin 65: Model Code 2010—First Complete Draft; fib Bulletin: Lausanne, Switzerland, 2010; Volume 1, ISBN 9782883940956.
  22. Pettersson, O. Structural Fire Protection. Fire Mater. 1980, 4, 1–16. [Google Scholar] [CrossRef]
  23. Khoylou, N. Modelling of Moisture Migration and Spalling Behaviour in Non-Uniformly Heated Concrete. Ph.D. Thesis, University of London, London, UK, 1997. [Google Scholar]
  24. Jansson, R. Measurement of Concrete Thermal Properties at High Temperature. In Proceedings of the Proceedings from the fib Task Group 4.3 Workshop “Fire Design of Concrete Structures: What Now? What Next?”, Milan, Italy, 2–3 December 2004. [Google Scholar]
  25. Mike, J.; Kodur, V.; Marrion, C. A Overview of Fire Protection in Buildings; FEMA 403, World Trade Center Building Performance Study; Federal Emergency Management Agency: Washington, DC, USA, 2013; pp. 1–28. [Google Scholar]
  26. Lucio-Martin, T.; Roig-Flores, M.; Izquierdo, M.; Alonso, M.C. Thermal Conductivity of Concrete at High Temperatures for Thermal Energy Storage Applications: Experimental Analysis. Sol. Energy 2021, 214, 430–442. [Google Scholar] [CrossRef]
  27. Chen, J.; Young, B. Design of High Strength Steel Columns at Elevated Temperatures. J. Constr. Steel Res. 2008, 64, 689–703. [Google Scholar] [CrossRef]
  28. Choi, I.R.; Chung, K.S.; Lee, H. Thermal and Mechanical Properties of Structural Steel SN400 at Elevated Temperatures. Int. J. Steel Struct. 2017, 17, 999–1007. [Google Scholar] [CrossRef]
  29. Chen, J.; Young, B.; Uy, B. Behavior of High Strength Structural Steel at Elevated Temperatures. J. Struct. Eng. 2006, 132, 1948–1954. [Google Scholar] [CrossRef]
  30. EN 1993-1-2; Eurocode 3: Design of Composite Steel Structure-Part 1-2: General Rules-Structural Fire Design. The European per Regulation: Ljubljana, Slovenia, 2011.
  31. Shan, W.; Wang, X.; Jiao, Y. Modeling of Temperature Effect on Modal Frequency of Concrete Beam Based on Field Monitoring Data. Shock Vib. 2018, 2018, 8072843. [Google Scholar] [CrossRef]
  32. Ruan, Z.; Chen, L.; Fang, Q. Numerical Investigation into Dynamic Responses of RC Columns Subjected for Fire and Blast. J. Loss Prev. Process Ind. 2015, 34, 10–21. [Google Scholar] [CrossRef]
  33. Teng, J.; Tang, D.H.; Hu, W.H.; Lu, W.; Feng, Z.W.; Ao, C.F.; Liao, M.H. Mechanism of the Effect of Temperature on Frequency Based on Long-Term Monitoring of an Arch Bridge. Struct. Health Monit. 2021, 20, 1716–1737. [Google Scholar] [CrossRef]
  34. Tan, G.; Kong, Q.; He, X.; Liu, H.; Wang, H. Effects of Temperature on Modal Characteristics of Non-Uniform Rigid-Frame Bridges. Adv. Struct. Eng. 2023, 26, 1011–1026. [Google Scholar] [CrossRef]
  35. Kim, J.T.; Park, J.H.; Lee, B.J. Vibration-Based Damage Monitoring in Model Plate-Girder Bridges under Uncertain Temperature Conditions. Eng. Struct. 2007, 29, 1354–1365. [Google Scholar] [CrossRef]
  36. Xia, Y.; Hao, H.; Zanardo, G.; Deeks, A. Long Term Vibration Monitoring of an RC Slab: Temperature and Humidity Effect. Eng. Struct. 2006, 28, 441–452. [Google Scholar] [CrossRef]
  37. ACI318-19; Requirements for Structural Concrete. American Concrete Institute: Farmington Hills, MI, USA, 2019; ISBN 9781641950565.
Figure 1. Dimensions of the specimen.
Applsci 14 01175 g001
Figure 2. Bearing devices: (a) hinge support; and (b) roller support.
Applsci 14 01175 g002
Figure 3. PTC film on the top deck of the concrete.
Applsci 14 01175 g003
Figure 4. Schematic views of the measurement setup: (a) top view of the concrete; and (b) side view of the specimen.
Applsci 14 01175 g004
Figure 5. Modal testing procedure.
Applsci 14 01175 g005
Figure 6. Example modal test results obtained from the fifth accelerometer at 20 °C: (a) magnitude of FRFs; and (b) coherence.
Applsci 14 01175 g006
Figure 7. Natural frequency–temperature relationship.
Applsci 14 01175 g007
Figure 8. FE model of the specimen.
Applsci 14 01175 g008
Figure 9. Vertical temperature distributions at 25 and 30 °C.
Applsci 14 01175 g009
Figure 10. Vertical and horizontal displacements with temperature at the midspan (vertical) and the roller support (horizontal).
Applsci 14 01175 g010
Figure 11. Natural frequencies and corresponding mode shapes at a deck temperature of 20 °C: (a) torsional mode; (b) bending mode; (c) torsional bending mode.
Applsci 14 01175 g011
Figure 12. Relationship between temperature and natural frequency.
Applsci 14 01175 g012
Figure 13. Differences in frequency compared to the FE model incorporating the temperature dependencies of the elastic modulus, the specific heat, and the thermal conductivity.
Applsci 14 01175 g013
Table 1. Moduli of elasticity of concrete and steel/rebar in the model (Equation (1) for concrete and Equation (2) for steel/rebar).
Temperature (°C)Concrete (MPa)
(Equation (1))
Steel/rebar (MPa)
(Equation (2))
2019,188205,420
2518,900204,370
3018,612203,320
3518,324202,280
4018,037201,230
5017,461199,130
Table 2. Material parameters used in the model.
MaterialMass Density (kg/m3)Poisson’s RatioExpansion Coefficient (/°C)Specific Heat
Capacity (J/kg·°C)
Thermal Conductivity
Concrete24000.181 × 10−58801.5
Steel and rebar78500.31 × 10−5Table 1Table 3
Table 3. Specific heat capacity and thermal conductivity values of steel and rebar.
Temperature (°C)Specific Heat Capacity (J/kg·°C)
(Equation (3))
Thermal Conductivity (W/m·°C)
(Equation (4))
20439.853.33
25443.353.16
30446.753.00
35450.152.83
40453.452.66
50459.752.33
Disclaimer/Publisher’s Note: The statements, opinions and data contained in all publications are solely those of the individual author(s) and contributor(s) and not of MDPI and/or the editor(s). MDPI and/or the editor(s) disclaim responsibility for any injury to people or property resulting from any ideas, methods, instructions or products referred to in the content.

