1. Introduction
Social Media (SM) encompasses a range of online platforms where individuals can connect, share, and interact with each other. Popular SM platforms, including Facebook (
https://www.facebook.com/), Twitter (
https://twitter.com/), TikTok (
https://www.tiktok.com/), Instagram (
https://www.instagram.com/), and others, have become integral parts of daily life, enabling users to post multimedia content, share updates, interact with others, and participate in communities with shared interests [
1,
2]. These platforms serve as hubs for entertainment, information sharing, and connection, facilitating activities like sharing short videos, showcasing their talents, and engaging in humorous or creative endeavors. However, while SM fosters communication and creativity, it also introduces challenges, such as cyberbullying, which can significantly harm individuals [
3,
4].
Cyberbullying, defined as the use of digital platforms to harm or intimidate others, has emerged as a major concern in the SM landscape. This includes behaviors like posting harmful comments, spreading rumors, or sharing private information without consent. The anonymity and rapid dissemination capabilities of SM often embolden bullies, making it easier to target victims [
5]. The repercussions of cyberbullying are severe, leading to emotional distress, anxiety, and even self-harm among victims. Notably, the
EU-Kids Online Report [
6] from 2014 revealed that 20% of young people aged 11 to 16 years experience cyberbullying. Similarly, a quantitative study conducted by researchers [
7] reported that cyber victimization rates range from 20% to 40%, underscoring the urgency of addressing this issue.
As SM platforms continue to grow and short-form video content gains prominence, the need for effective tools to detect and prevent cyberbullying becomes increasingly critical. The automated identification and classification of cyberbullying incidents offers a promising approach to mitigate this problem. Various researchers [
8,
9] have explored techniques for detecting and classifying bullying behaviors and supporting victims. However, existing methods often focus on binary classification or multi-class textual analysis, leaving gaps in the multi-class classification of multi-modal data.
Deep learning (DL) technologies have shown remarkable success in numerous domains, including spam SMS detection [
10], healthcare diagnosis [
11], disaster management [
12], and stock prediction [
13]. In the context of cyberbullying, DL methods offer the potential to analyze complex and previously unseen datasets, identifying patterns and behaviors indicative of bullying [
14,
15,
16,
17]. Existing studies have applied DL for binary and multi-class textual classification, yet comprehensive analysis for multi-modal data remains underexplored [
18,
19,
20,
21]. This research aims to bridge this gap by leveraging advanced DL models for multi-class classification of cyberbullying in multi-modal datasets sourced from SM platforms, with a focus on comments related to short videos.
The primary objective of this study is to develop and evaluate a hybrid DL model, particularly transformer architectures, to improve the accuracy of cyberbullying multi-class classification using multi-modal data and contribute to safer online environments. To achieve this objective, the following research questions will be addressed:
Overall, this study presents a comprehensive approach to detect and classify cyberbullying by applying multiple hybrid deep learning models. The proposed method is rigorously evaluated against state-of-the-art models to demonstrate its efficacy. The remainder of this paper is structured as follows.
Section 2 reviews the related literature on cyberbullying multi-class classification in SM.
Section 3 outlines the proposed research methodology, including the data acquisition and preprocessing processes, the model architecture, and descriptions of the public and private datasets.
Section 4 presents and analyzes the experimental results, followed by a discussion in
Section 5. Finally,
Section 6 concludes this study and highlights future research directions.
2. Related Works
Significant research has explored the application of deep learning (DL) algorithms for cyberbullying classification. This section presents existing studies that focus on multi-class cyberbullying classification, examining the DL models employed, the methods used for data collection and labeling, and the effectiveness of these approaches in handling multi-modal datasets.
Ahmadinejad et al. [
20] proposed DL-based methods for cyberbullying identification on Twitter. They created a textual dataset of 99,991 tweets and conducted both binary and multi-class classification. For multi-class classification (e.g., religion, ethnicity/race, gender/sexual), their RoBERTa model achieved an accuracy of 99.80%.
Maity et al. [
21] introduced a multitask DL framework for the identification of cyberbullying, such as sentiment, sarcasm, and emotion-aware cyberbullying from multi-modal memes. In their study, the authors collected images and memes from
Twitter and
Reddit. To scrape the images, they used hashtags like MeToo, KathuaRapeCase, Nirbhya, Rendi, Chuthiya, and Kamini on Twitter, as well as subreddits like Desimemes, HindiMemes, and Bakchodi on Reddit, resulting in around 5854 images and memes. Various DL models, such as BERT, ResNET-Feedback, and CLIP-CentralNet, were developed and trained using textual and visual data. The task of the sentiment–emotion–sarcasm-aware multi-modal cyberbullying identification in a code-mixed scenario was introduced for the first time in their paper. To tackle this challenge, they developed a novel multi-modal meme dataset called MultiBully, annotated with labels for bullies, attitude, emotion, and sarcasm. The purpose of this annotation was to determine whether this information could aid in more accurate cyberbullying identification. An attention-based multi-task multi-modal framework, CLIP-CentralNet, was developed as a new architecture for sentiment, emotion, and sarcasm-assisted cyberbullying identification. The proposed model included ResNet, mBERT, and CLIP for effective representations of many modalities and support in learning generic features across several tasks. The newly created CLIP-CentralNet framework performed noticeably better than all single-task and uni-modal models in their task. For the purpose of identifying cyberbullying, they achieved an accuracy of 61.14% for textual data using BERT, GRU, and a fully connected layer, and 63.36% for image data using ResNet and a fully connected layer.
Titli et al. [
22] developed a DL model named Bengali BERT for classifying different categories of cyberbullying in Bengali-language text data. They utilized a dataset of YouTube textual comments from [
23,
24]. This dataset included classes such as religious, sexual, linguistic, political, personal, and crime-related content. Offensive categories such as personal, geographical, and religious content were also included, alongside data related to entertainment, sports, memes, and TikTok. Their Bengali BERT model achieved an accuracy of 0.706 and a weighted F1-score of 0.705.
Haque et al. [
25] analyzed Bengali social media comments, focusing on textual data from Facebook. They collected a text dataset of approximately 42,036 comments, categorized into classes like political, religious, sexual, acceptable, and combined. They implemented CNN and LSTM models for classification. Their proposed CLSTM architecture achieved an accuracy of 85.8% and an F1-score of 0.86.
Kumari et al. [
26] proposed a model that employed a Convolutional Neural Network (CNN) and Binary Particle Swarm Optimization (BPSO) to classify SM posts from platforms like Facebook, Twitter, and Instagram. The model categorized posts containing both images and written comments into three classes: non-aggressive, medium-aggressive, and high-aggressive. The dataset, comprising symbolic images and their corresponding textual comments, was created to validate the proposed model. The researchers employed a pre-trained VGG-16 model to extract the visual features of the images, while also utilizing a three-layered CNN to extract the textual data. The hybrid feature set, consisting of both image and text features, was optimized using the BPSO algorithm to extract the most pertinent characteristics. The enhanced model, incorporating advanced features and utilizing the Random Forest classifier, achieved a weighted F1-score of 0.74.
Barse et al. [
27] explored cyber-trolling identification using text data from YouTube, Twitter, and other sources. They applied machine learning and DL techniques, including logistic regression, multinomial Naive Bayes, Random Forest, and Bidirectional LSTM. Their Random Forest model achieved the highest accuracy of 96.50%, outperforming other models. The dataset included topic-specific categories such as misogyny, racism, and xenophobia.
Mollas et al. [
28] introduced the “ETHOS” dataset, designed for multi-label hate speech detection. This textual dataset, sourced from comments on Reddit and YouTube, was validated using the FigureEight crowdsourcing platform. The dataset is available in two formats: binary classification and multi-label classification. For the multi-label classification task, the BiLSTM model achieved the following accuracy rates: violence (50.86%), directed vs. generalized (55.28%), gender (70.34%), race (75.97%), national origin (67.88%), disability (69.64%), religion (71.65%), and sexual orientation (89.83%).
Tabassum et al. [
29] introduced a deep learning-based approach to identify cyberbullying on social media platforms for text and image data. Nine deep learning models were trained, including ResNet-50, CNN, and ViT for image data, as well as LSTM-2, GRU, RoBERTa, BERT, DistilBERT, and a hybrid (CNN+LSTM) model for textual data. For multi-class classification of public image data, the ViT model achieved the highest accuracy (99.5%) and an F1-score of 0.995. Similarly, the RoBERTa model outperformed other textual models, achieving an accuracy of 99.2% and an F1-score of 0.992 on public data. On the private dataset, the RoBERTa model achieved an F1-score of 0.986 and an accuracy of 98.6% for textual data, while the ViT model attained an F1-score of 0.9319 and an accuracy of 93.20% for image classification. These results highlight the effectiveness of RoBERTa for text classification and vision transformer (ViT) for image-based classification in identifying cyberbullying.
Hossain et al. [
30] introduced a framework that employed the weighted ensemble technique to allocate weights to the visual, textual, and multi-modal models involved. The framework utilized advanced visual models such as VGG19, VGG16, and ResNet50, as well as textual models like multilingual-BERT, multilingual-DistilBERT, and XLM-R. Additionally, two fusion methodologies, namely early fusion and late fusion, were employed to integrate the visual and textual characteristics in order to construct the multi-modal models. The results demonstrated that the proposed method achieved better performance on two multilingual benchmark datasets (MultiOFF and TamilMemes), with weighted F1-scores of 66.73% and 58.59%, by applying the best visual (VGG19), textual (m-DistilBERT), decision fusion (VGG19+m-DistilBERT), and feature fusion (VGG19+m-DistilBERT) models.
Yue et al. [
31] introduced KnowleNet, a novel model that uses the ConceptNet knowledge base to integrate prior knowledge and assess the relationship between images and text through cross-modal semantic similarity detection at the sample and word levels. They also applied contrastive learning to enhance the spatial distribution of sarcastic (positive) and non-sarcastic (negative) samples from the dataset of Maity et al [
21]. The model demonstrated state-of-the-art performance on publicly available benchmark datasets using BERT and ResNet-50 and achieved an accuracy of 64.35%. The limitation of the research is that it focused on binary classification.
Aggarwal et al. [
32] proposed a novel multi-modal sarcasm detection framework that processes input triplets consisting of text, an associated image, and descriptive image captions. The framework aims to capture the discrepancies between textual and visual content, which are essential for detecting sarcasm. Key contributions include a robust textual feature extraction branch using a cross-lingual language model, a visual feature extraction branch incorporating a self-regulated residual ConvNet with a spatially aware attention module, and the use of image captions generated by an encoder–decoder architecture. The model also employs attention modules to identify incongruities between text and image representations, achieving multi-level semantic incongruity representation through feature fusion. The model outperforms existing baselines, achieving accuracies of 92.89% on the Twitter multi-modal sarcasm dataset and 64.48% on the MultiBully dataset [
21].
In
Table 1, we can observe that several studies [
20,
22,
25,
26,
27,
28,
29] have focused on multi-class classification, while most have focused on single-modality data. In contrast, Refs. [
21,
32] investigated multi-label classification using multi-modal data. However, their studies did not yield highly satisfactory results. Additionally, Ref. [
30] presented multi-class classification results using multi-modal data, but their research was restricted to different levels of aggression. While numerous studies have focused on cyberbullying classification on social media using multi-modal data, most research has emphasized either identification or binary classification. However, no study has implemented multi-class cyberbullying classification using multi-modal data. To address this gap, this paper explores the application of transformer-based deep learning models for multi-class classification of social media cyberbullying using multi-modal data.
3. Materials and Methods
This section outlines the methodology, beginning with an overview of the proposed solution (
Section 3.1), which comprises several stages. The first stage involves data collection (
Section 3.2), and the second stage involves data preprocessing (
Section 3.3). The third stage focuses on splitting the data for model training (
Section 3.5). The network architectures employed are then described (
Section 3.6). Finally, the evaluation metrics used to assess the model’s performance are presented (
Section 3.9).
3.1. Proposed Solution
To classify different cyberbullying types, a generic solution was considered, which is illustrated in
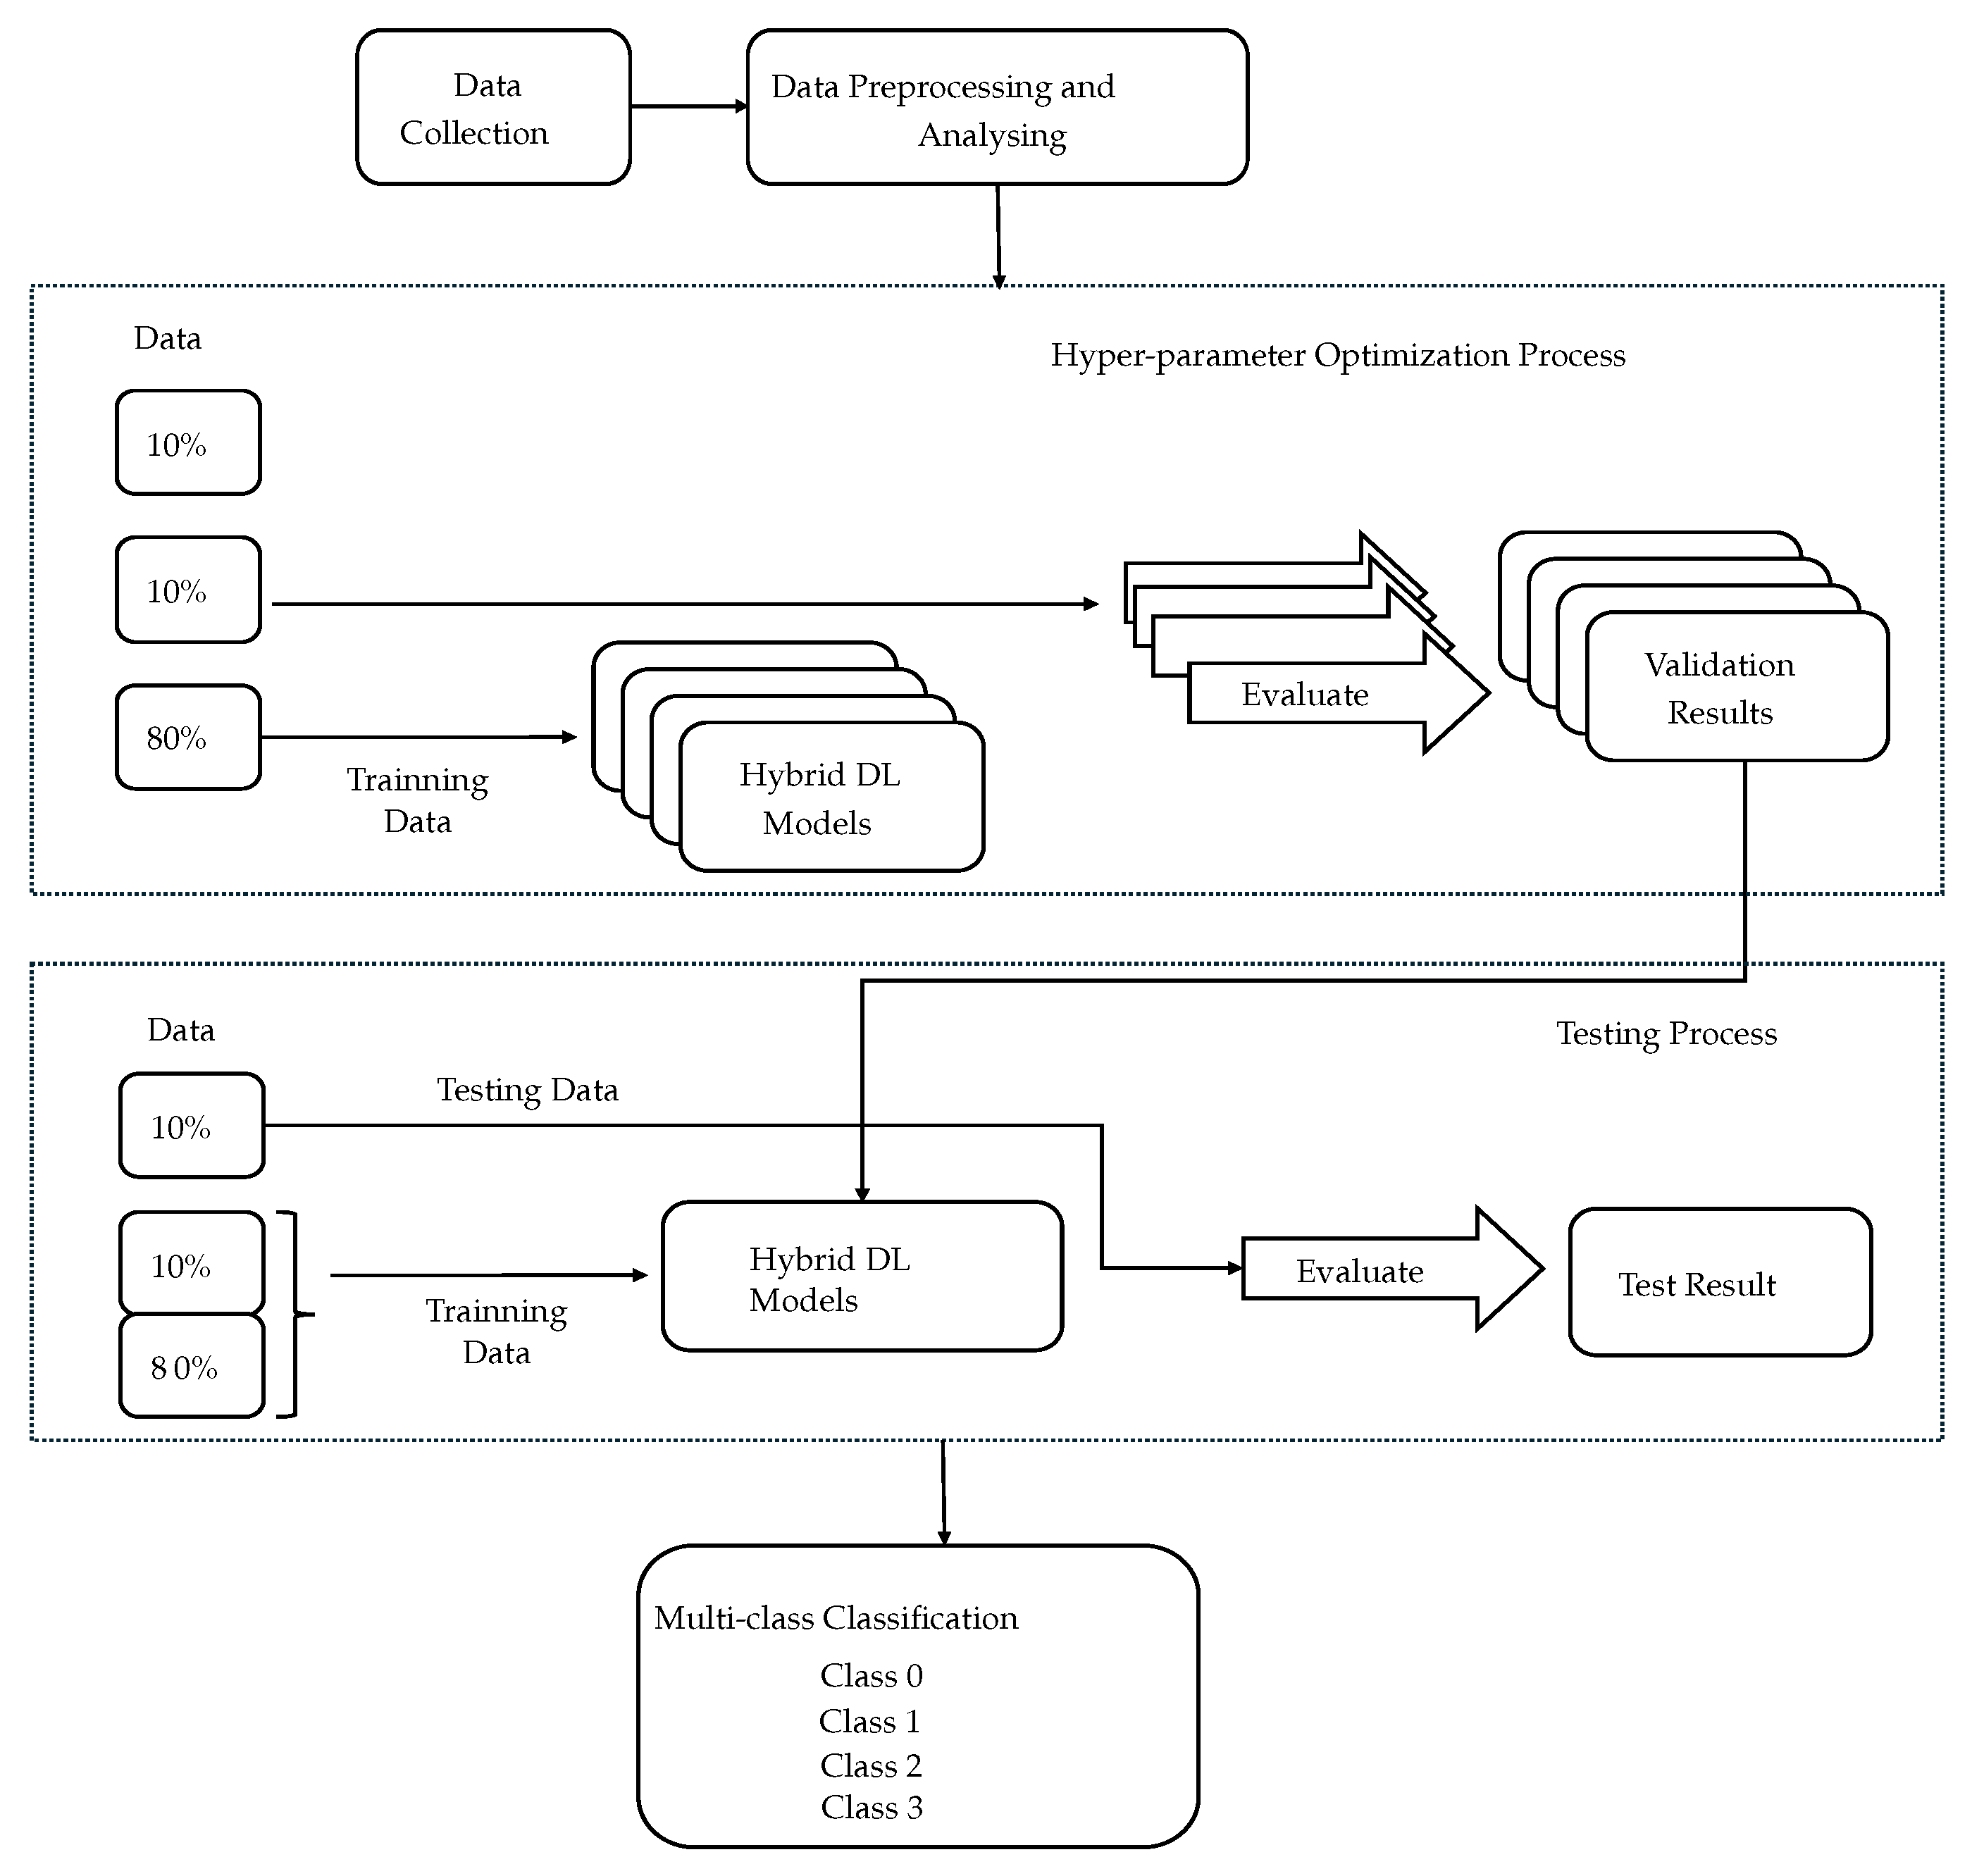
Figure 1. The first step in the proposed solution is multi-modal data collection, where two datasets were collected. This was followed by a comprehensive workflow that included data preprocessing, which was performed on both datasets. Then, the data were split into training (80%), testing (10%), and validation (10%) datasets.
The
Figure 1 illustrates a two-stage process for developing and testing a hybrid deep learning (DL) model. In the first stage, the “Hyperparameter Optimization Process”, the data are split into three parts: 80% for training, 10% for validation, and 10% for testing. Multiple versions of the hybrid DL model, including LSTM+ResNet, LSTM+CNN, LSTM+ViT, GRU+ResNet, GRU+CNN, GRU+ViT, BERT+ResNet, BERT+CNN, BERT+ViT, DistilBERT+ResNet, DistilBERT+CNN, DistilBERT+ViT, RoBERTa+ResNet, RoBERTa+CNN, and RoBERTa+ViT, are trained using the training data, and their performance is evaluated using the validation data. The goal is to optimize the hyperparameters and select the best-performing model based on the validation results. In the second stage, the “Testing Process”, the optimized hybrid DL model is tested on the previously unseen testing data. This step evaluates how well the final model generalizes to new data, resulting in the final test results using various model performance metrics, including accuracy, F1-score, precision, and recall. We also computed a confusion matrix to evaluate the performance of the classification models. This approach ensures that the model is both well tuned and capable of making accurate predictions on new datasets. A detailed explanation of each step is given in the sections below.
3.2. Data Collection
In the proposed solution, the first step was data collection, which can be seen in
Figure 1. In this research, two datasets were used. The first dataset was the
public dataset, and the second dataset was the
private dataset.
The public dataset was created by combining datasets from previous studies on cyberbullying classification [
19,
21]. The authors of [
19] named their dataset the “Religiously Hateful Memes Dataset”. This dataset comprises approximately two thousand memes, annotated to identify religiously abusive content. The dataset is characterized by multi-modal data, incorporating both textual and visual components, and was collected from social media platforms, including Twitter, Instagram, Facebook, and Reddit. Hereafter, it is referred to as Dataset-1. The authors of [
21] named their dataset “MultiBully”. This dataset contains multi-modal meme data related to sentiment, sarcasm, and emotion awareness. Hereafter, it is referred to as Dataset-2. This dataset comprises 5854 labeled samples, annotated as bullying, attitude, emotion, and sarcasm. This dataset was collected from open-source platforms, specifically
Twitter and
Reddit, using hashtags such as #MeToo, #KathuaRapeCase, #Nirbhaya, #Rendi, #Chuthiya, and #Kamini on Twitter, and subreddits like Desimemes, HindiMemes, and Bakchodi on Reddit. Finally, Dataset-1 and Dataset-2 were merged into a single dataset, renamed the “public dataset”, to increase the size of the data.
Along with the public dataset, another dataset was created and named the “private dataset”. This dataset contains one thousand multi-modal data collected from various social media platforms, including Facebook, Instagram, YouTube, and TikTok. This dataset contains text and meme data extracted from comments posted under short videos on the aforementioned platforms. Text data were collected using a tool called APIFY (
https://apify.com/), while meme data were downloaded manually from the comment sections.
3.3. Data Preprocessing and Analysis
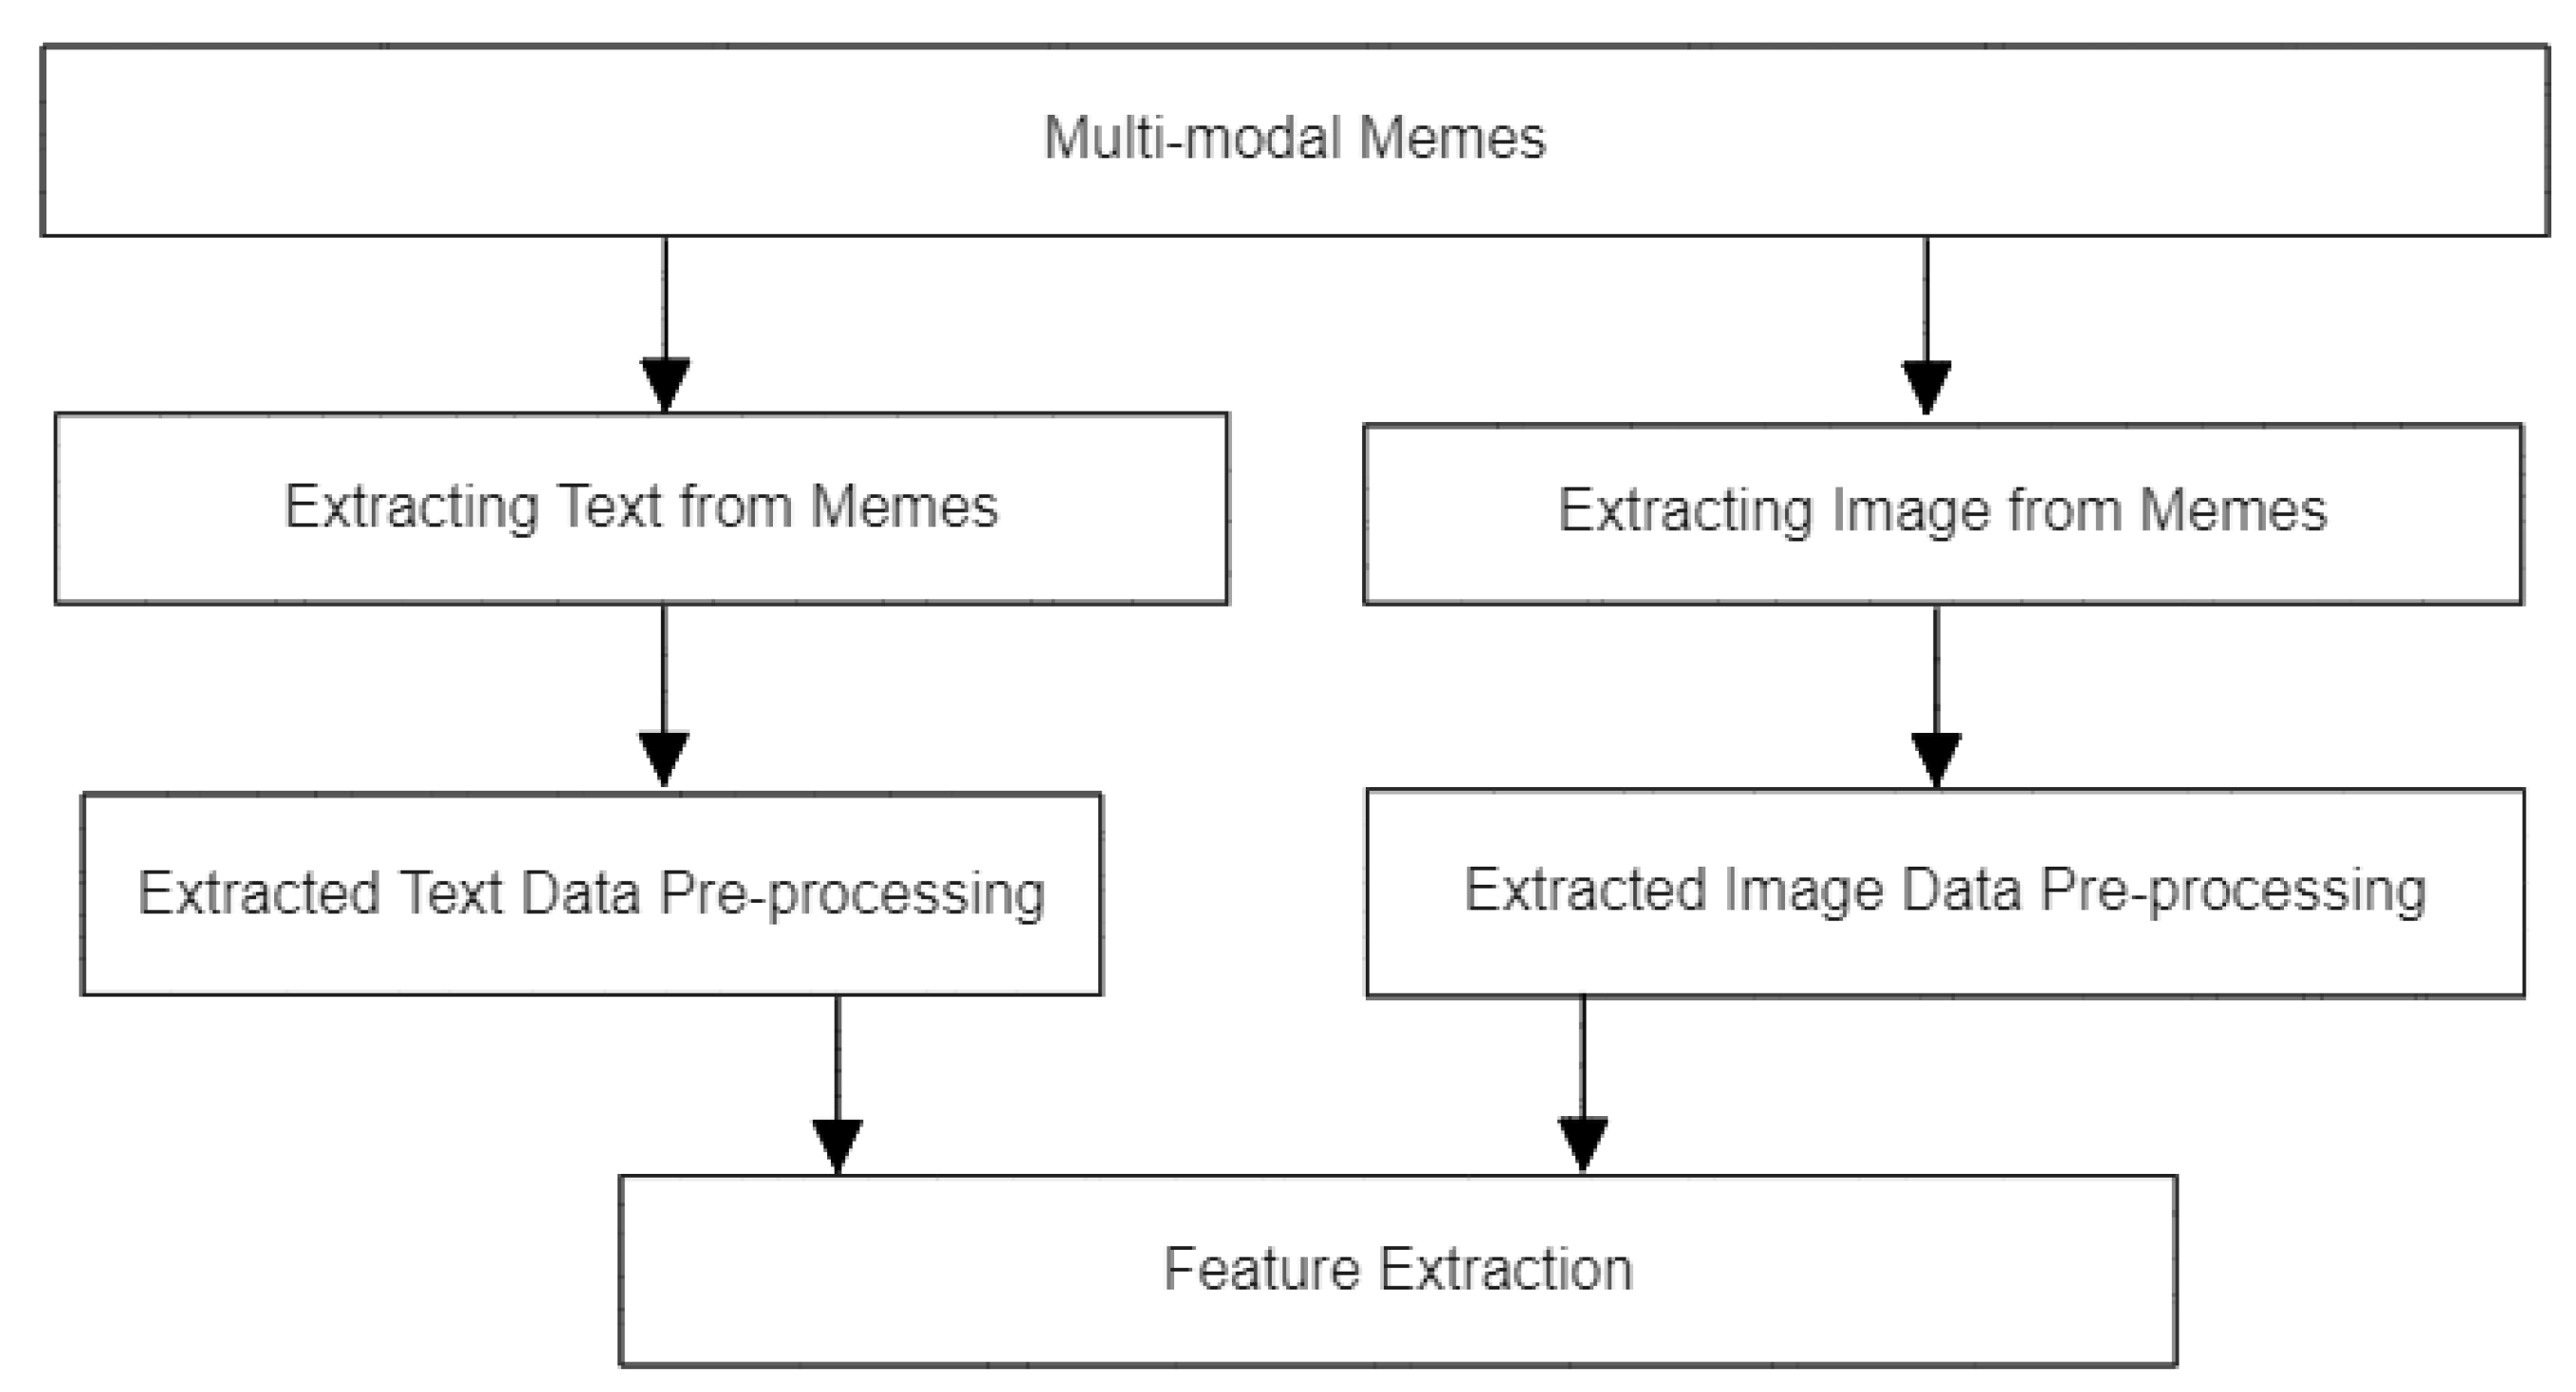
After creating the datasets, data preprocessing was the next step.
Figure 2 depicts the data preprocessing pipeline employed. In this pipeline, the first step involved extracting text and images from memes and then preprocessing the extracted text and image data.
3.3.1. Extracting Text and Image Data from Memes
The first step in data preprocessing involved extracting text and images from memes. To do so, a tool called Optical Character Recognition (OCR), integrated into Python [
33] using the
Pytesseract package, was used to extract text from memes. Before extracting the text, the quality of the images in memes was enhanced using the
OpenCV library. To enhance the quality of memes for text extraction, three key techniques were used. The first one was
bilateral filtering, inspired by [
34], to minimize noise while preserving edges. The second technique was
grayscale conversion, used to convert image format into grayscale, and the third technique was
thresholding, used to make the text more distinct from the background. Once the text was extracted, it was saved in a structured format in a folder named “text_data”, separate from the original memes in both the public and private datasets.
For extracting images from memes, we resized and standardized the images using techniques from the OpenCV library, including cv2.imread(), cv2.resize(), cv2.cvtColor(), and cv2.bilateralFilter(). After the images were processed, they were saved in a folder called “image_data”, separate from the original memes in both the public and private datasets. Finally, both the public and private dataset folders each contained two sub-folders: “text_data” and “image_data”. These sub-folders were used for further preprocessing.
3.3.2. Data Labeling
To classify cyberbullying, the extracted text and image data needed to be labeled. Hence, the text data were then categorized into four cyberbullying classes. This was done based on the knowledge acquired from prior studies such as [
35,
36,
37,
38]. The identified categories were as follows:
Non-bullying (class 0): This category contains text data related to no insulting, defamatory, offensive, or aggressive language.
Defamatory (class 1): This category contains data related to defamatory language-based cyberbullying, which involves actions where individuals insult or damage another person’s reputation. This includes spreading false information about someone or engaging in character defamation, such as sexual harassment or body shaming.
Offensive (class 2): This category includes offensive language-based cyberbullying. It occurs when individuals use derogatory terms or insults, such as “f*cker”, “bi*ch”, or “you are a dog, dumb, or stupid”, to attack or demean another person.
Aggressive (class 3): This category includes data related to threats, violent behavior, and abusive actions aimed at someone, such as “I will kill you” or “You should die”.
When it comes to labeling extracted image data, knowledge acquired from prior studies, such as [
39,
40,
41], was considered. The identified categories were as follows:
Non-bullying (class 0): This category includes images that do not feature any defamatory, sexual, offensive, or aggressive content.
Defamatory (class 1): This category includes images that contain sexual or nudity-related content.
Offensive (class 2): This category includes images that show a middle finger or combine human faces with animal faces.
Aggressive (class 3): This category includes images that depict violence, such as beating someone or brandishing weapons.
Table 2 shows the number of samples in each class for both the public and private datasets after data labeling. In the beginning, the public dataset contained 7854 multi-modal samples. We removed all samples that were either not in English or not relevant to our research and data labeling.
3.3.3. Data Cleaning
After labeling the text data, the next step was data cleaning. Text data preprocessing began with converting all the text to lowercase, trimming leading or trailing spaces, and replacing newline characters with spaces. Non-alphabetic and non-ASCII characters, as well as URLs, were removed. The text was tokenized into individual words using a regular expression tokenizer. Common stopwords were filtered out, with a custom list used to exclude specific terms from the default English stopword set and to remove single-character words. The processed words were then recombined into a single string, and each word was lemmatized to its base form. Additionally, numerical values were handled, and duplicate, missing, noisy, and irrelevant data entries were cleaned to ensure a refined and comprehensive dataset.
After labeling the image data, image data preprocessing began with bilateral filtering to reduce noise and enhance clarity. The images were then scaled and normalized to standardize their dimensions and pixel intensity values, improving computational efficiency and model training performance. All images were resized to 224 × 224 pixels using a transformation pipeline, ensuring uniformity and consistency. To simplify processing, images were converted to RGB format and subsequently to grayscale. Key features were accentuated using thresholding, and duplicate entries, as well as irrelevant images, were manually excluded.
3.3.4. Data Augmentation and Sampling
To increase the size of the extracted datasets, several techniques were used on both extracted text and image data. The sampling process for the datasets involved a careful strategy known as “oversampling the minority class”. In this approach, we began by identifying the class with the highest number of data and used that number as the target for the other classes. For the extracted text data, new samples were created by replacing words with their synonyms and rephrasing sentences while keeping the original meaning.
For the extracted image data, various image augmentation techniques were used such as “rotation” to rotate at different angles, “flipping” to flip horizontally or vertically, and “cropping” to crop specific areas. These techniques were used to generate new samples until every class had the same number of samples of extracted image data. This step not only balanced the dataset but also increased its variety, which helped build a stronger model.
Table 3 shows the number of data in each class for both the public and private datasets after augmentation and sampling the text, image, and multi-modal data. After preprocessing, each class in the public text and image data contained 1755 and 1742 samples, respectively, whereas each class in the private text and image data contained 324 and 315 samples, respectively.
3.4. Feature Extraction from Final Multi-Modal Data
To extract features from the final multi-modal data, tokenization and word embedding were performed using the Word2Vec technique. This technique captures semantic links between words, enhancing the performance of hybrid deep learning (DL) models on the extracted text data. For the image data, multiple feature extraction approaches were employed, including CNN features, DL pre-trained models using transfer learning, and the patch-embedding approach. Transfer learning allows the use of knowledge from previously trained models to improve categorization, while the patch-embedding approach divides images into smaller patches for sequential processing.
3.5. Splitting Data into Training, Validation, and Testing Datasets
To build a fair and effective cyberbullying classification model, both the text and image datasets needed to be split into different sets for training, validation, and testing. A common approach involves setting aside 80% of the data for training the model, allowing it to learn and identify patterns in text data related to cyberbullying. The remaining 20% of the data was split equally, with 10% used for validation to adjust the model’s parameters and prevent overfitting, and 10% reserved for testing to evaluate the model’s performance on unseen data. The splitting process was performed randomly to ensure diversity in all sets and to prevent any bias that could affect the model’s learning.
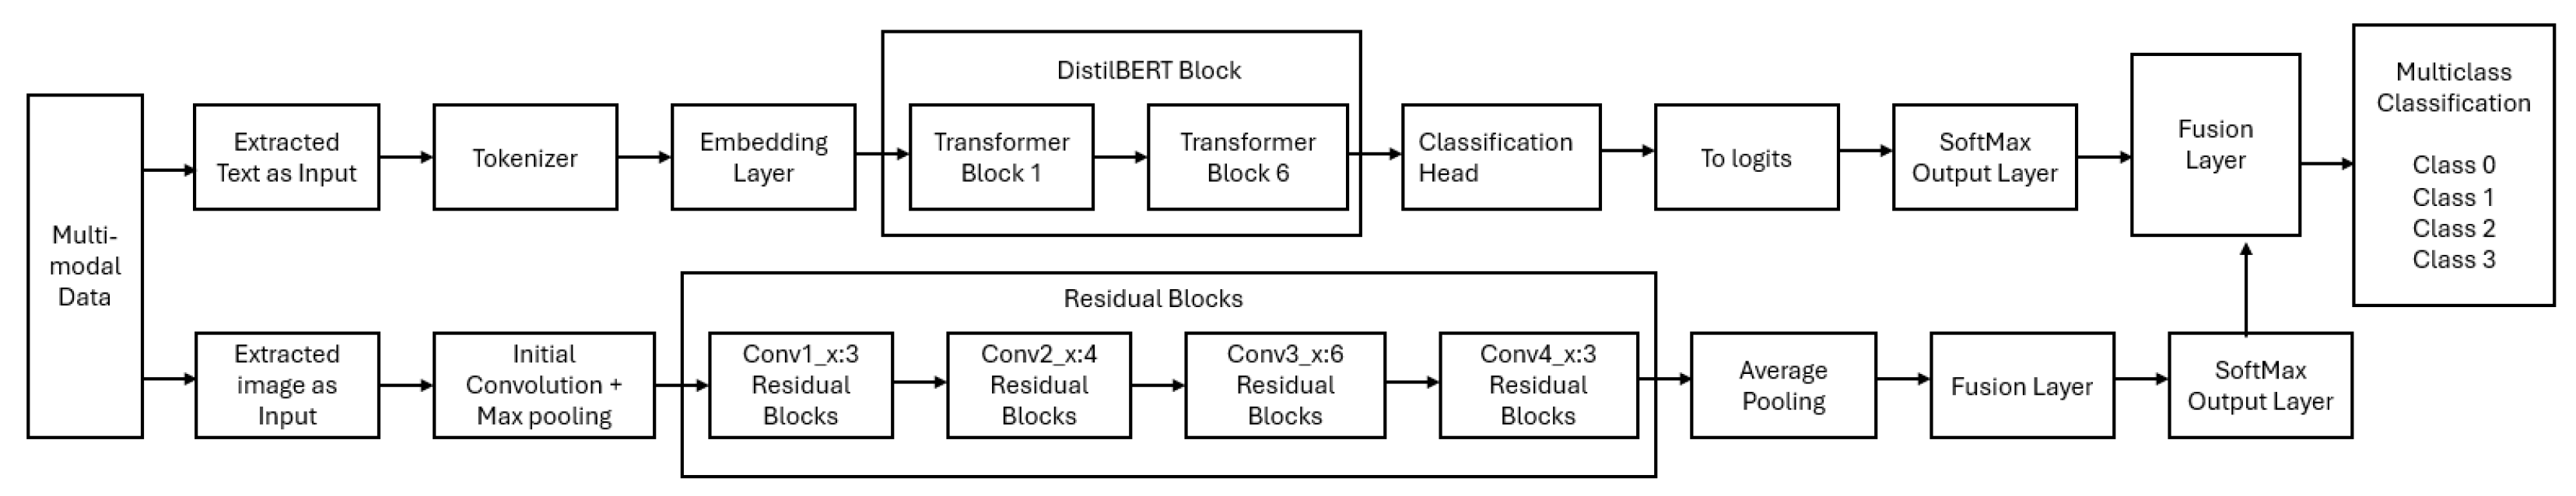
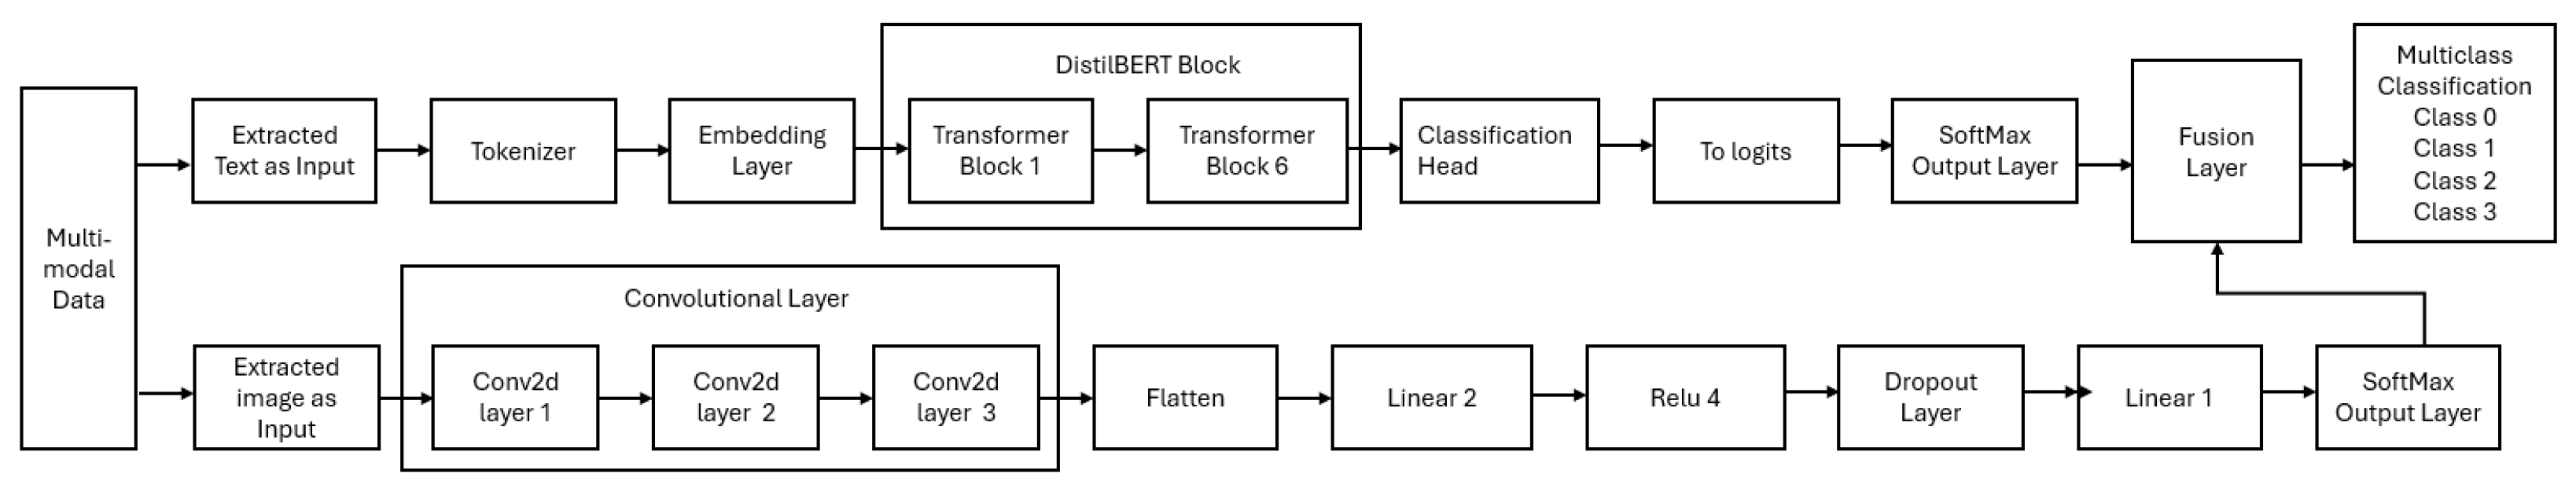
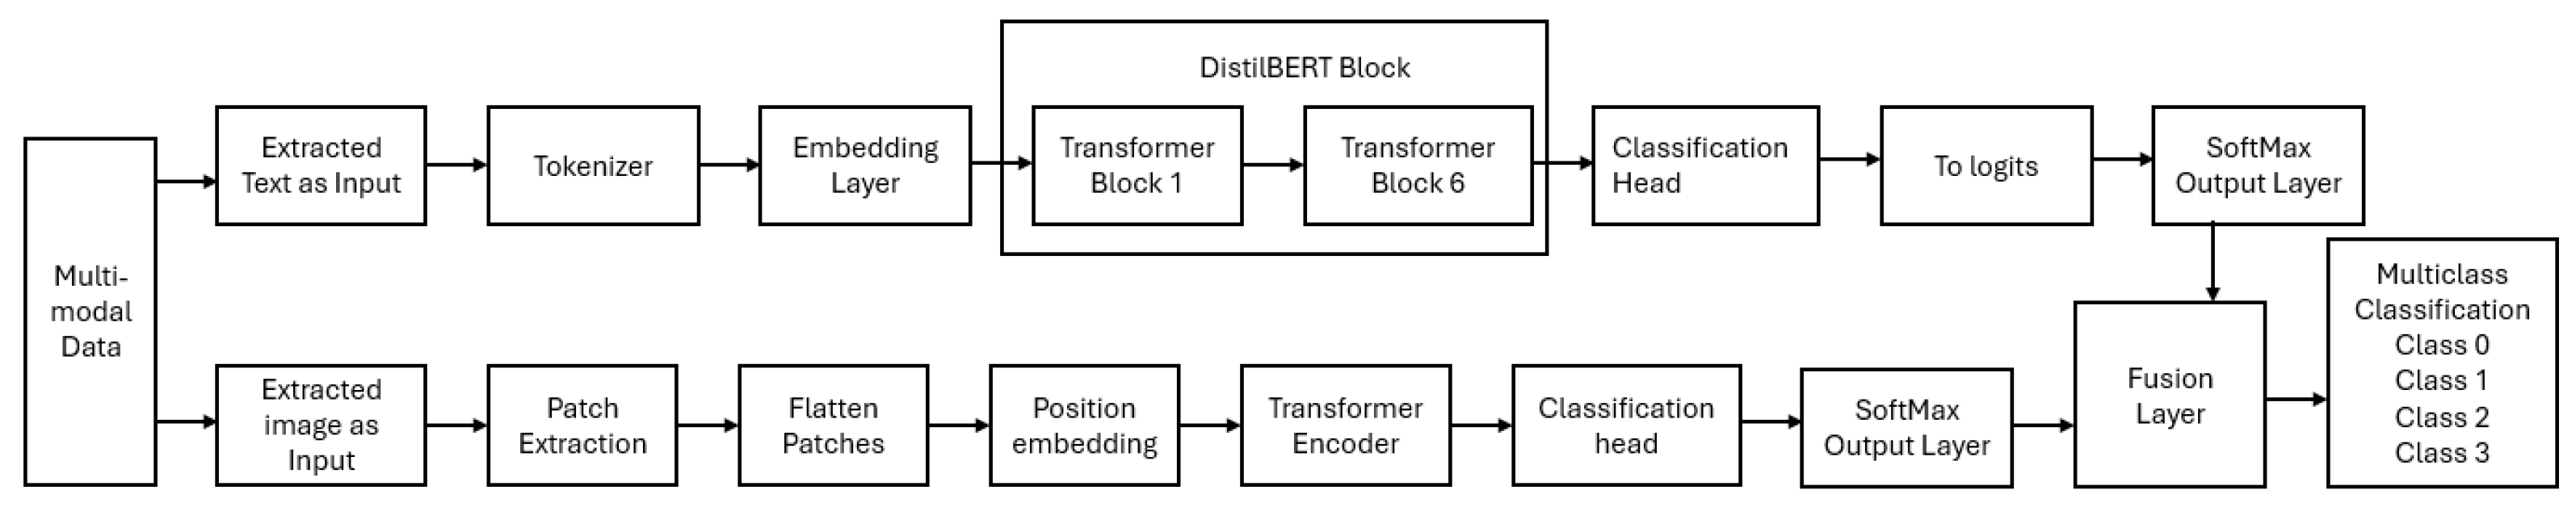
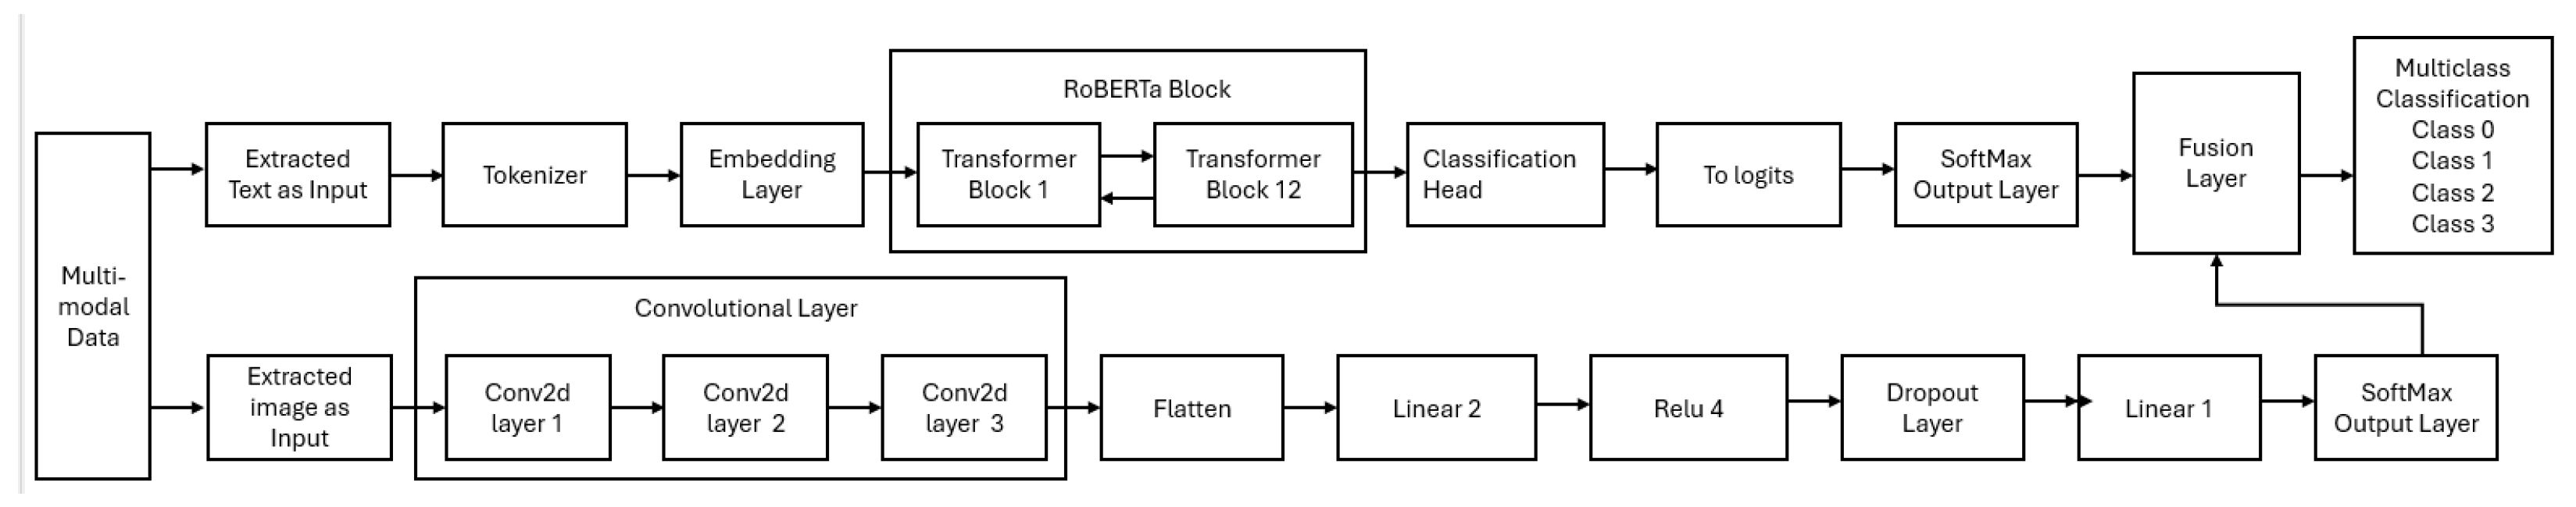
3.6. Network Architecture
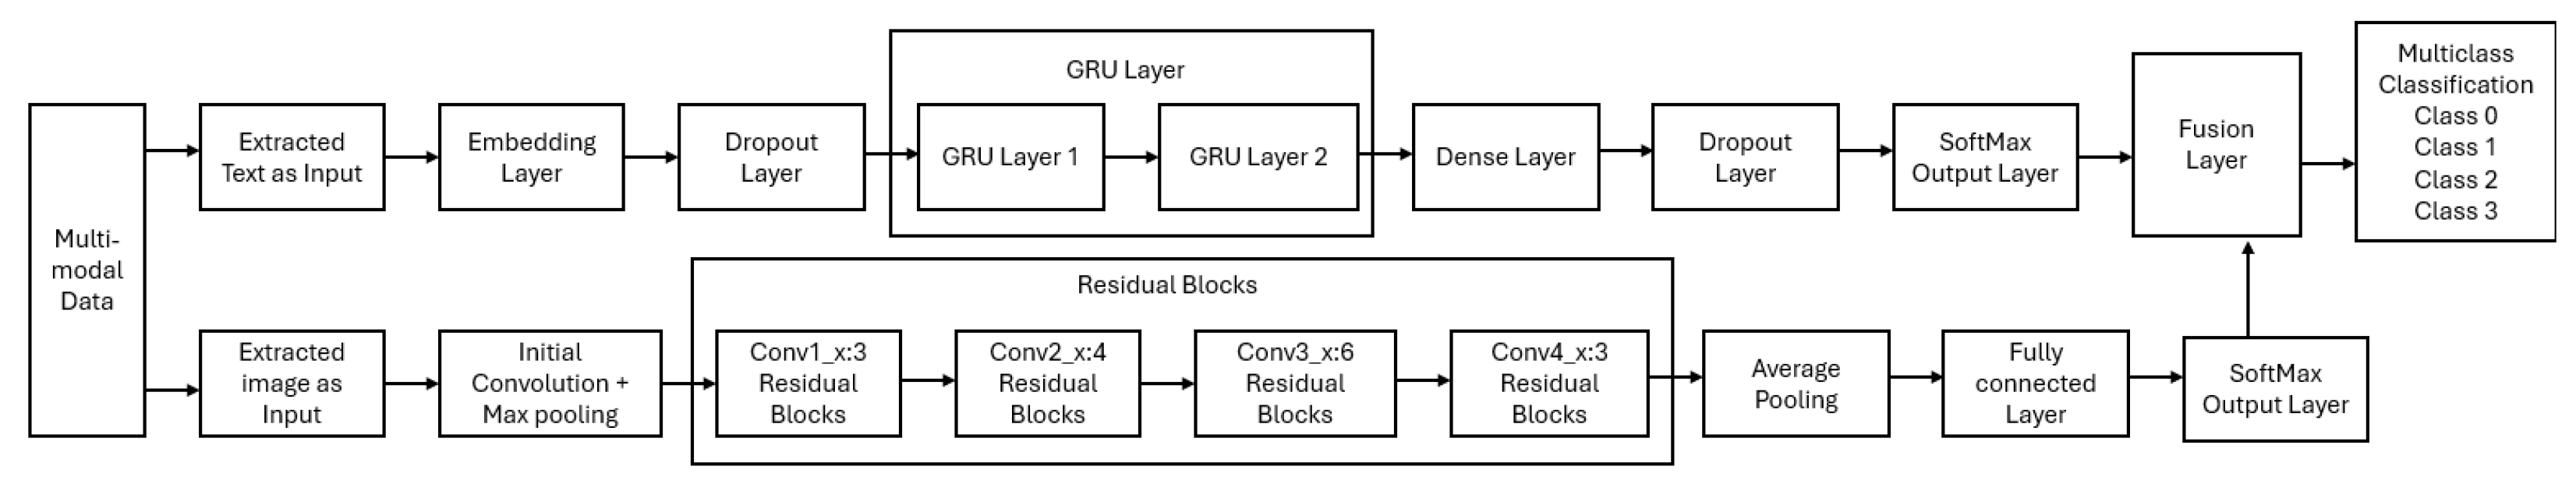
Figure 3 depicts the network architecture used for multi-class cyberbullying classification. The architecture starts by taking meme data as input, which is then passed to the deep learning (DL) models module to extract both text data and image data separately. The outputs from this DL module are then combined in the late fusion module to classify the multi-class cyberbullying. More details about the late fusion module can be found in
Section 3.7.
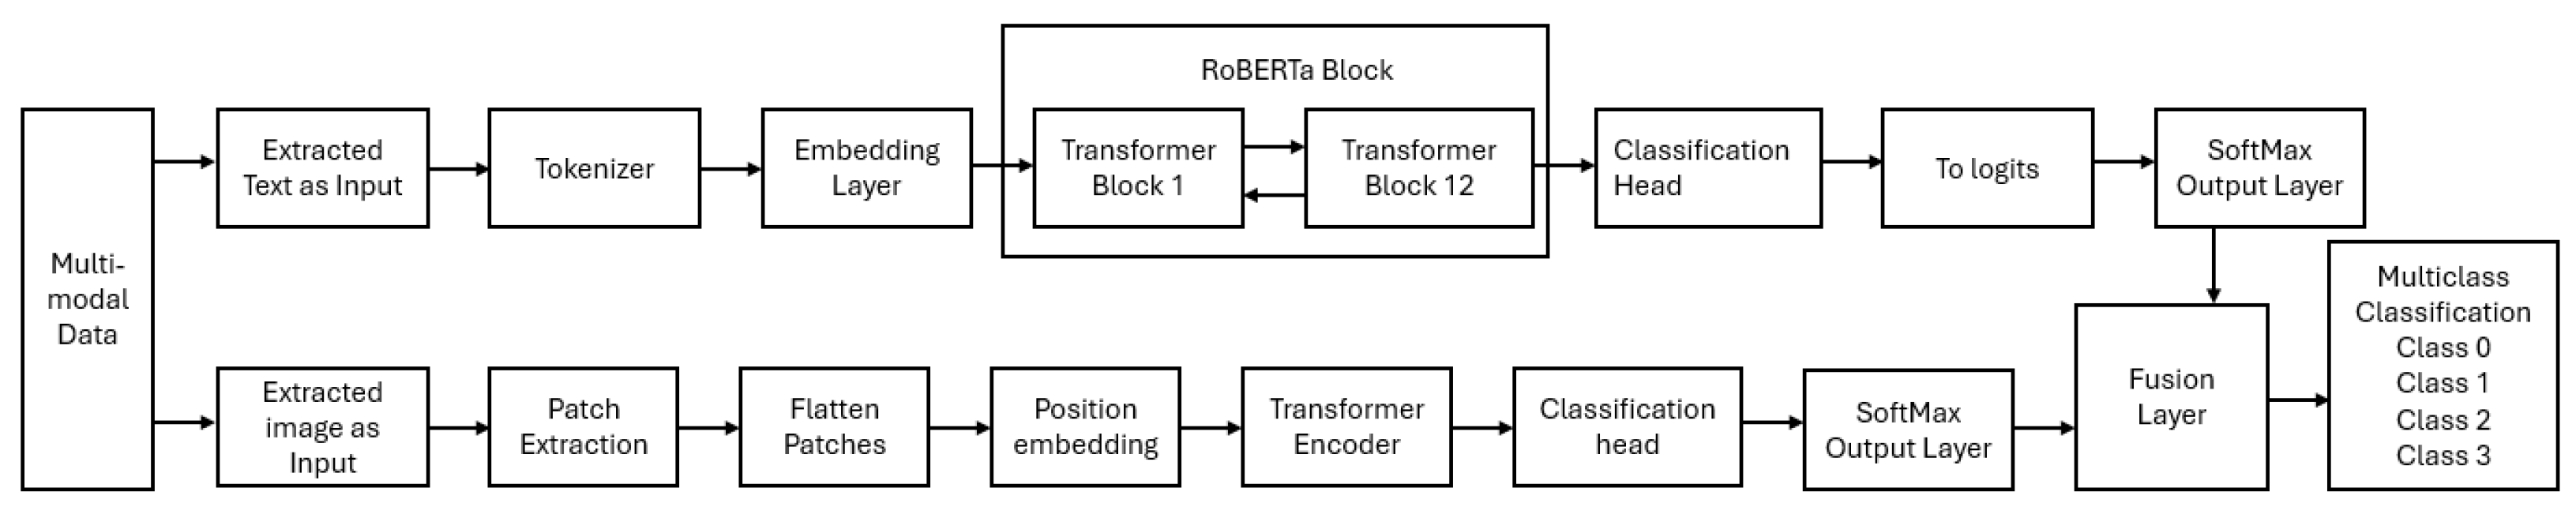
As shown in
Figure 3, various deep learning (DL) models, including LSTM, GRU, BERT, DistilBERT, and RoBERTa, were applied to extract text data from the public dataset. For the private dataset, only the RoBERTa model was used due to its superior performance on the public text data. All the developed DL models used text tokens as input.
To extract image data from the public dataset, the ResNet, ViT, and CNN models were employed. For the private dataset, only the ViT model was used due to its superior performance on the public image data. The input to the DL models typically consisted of RGB images resized to dimensions of 224 × 224 pixels. The architecture of the DL models’ intermediate layers varied depending on the specific model employed. Subsequently, a late fusion module technique, inspired by Pandeya et al. [
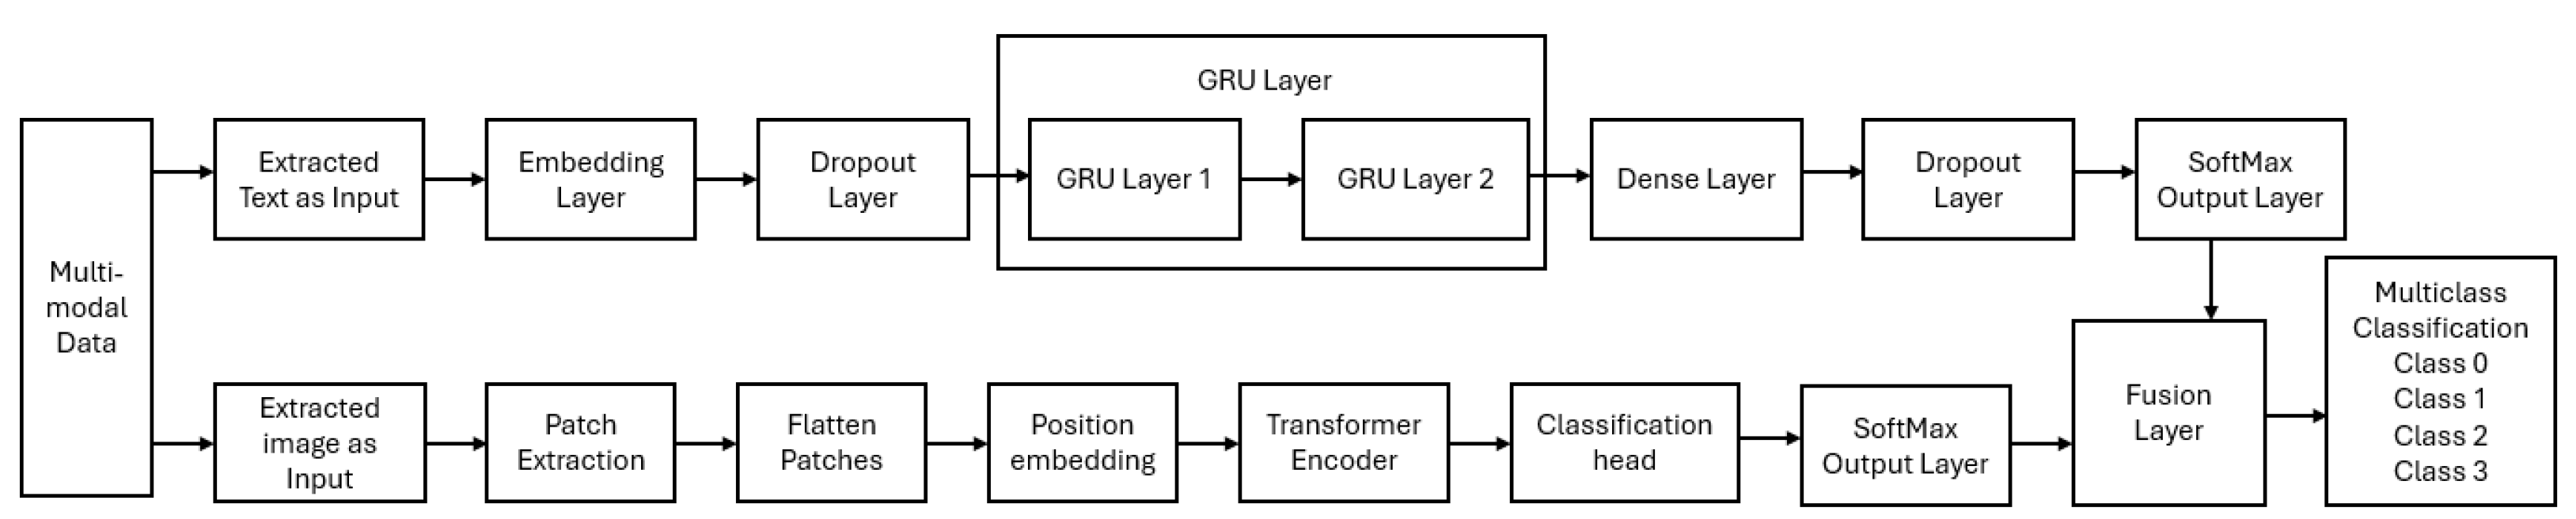
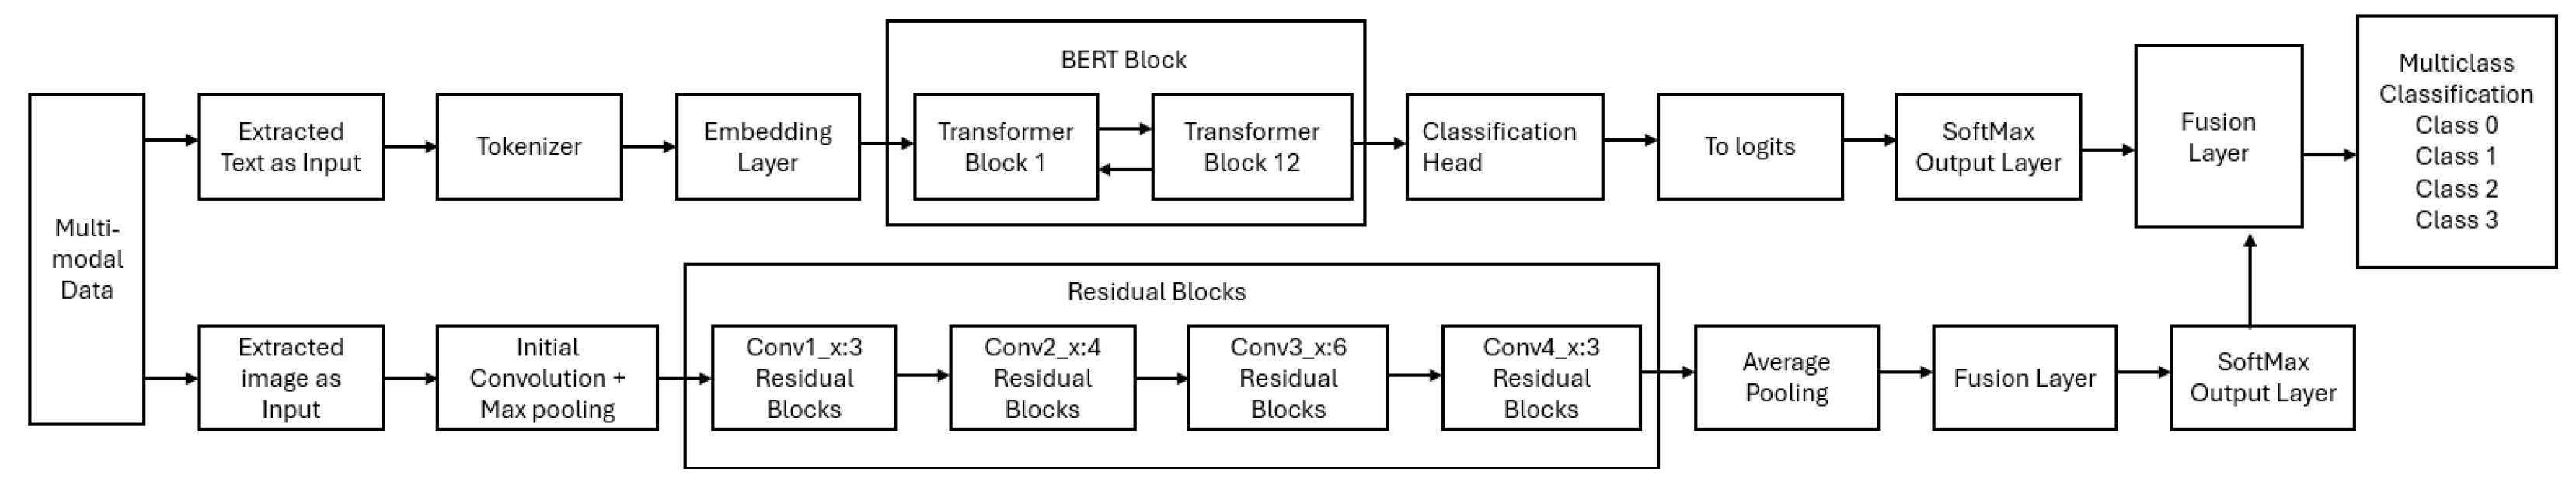
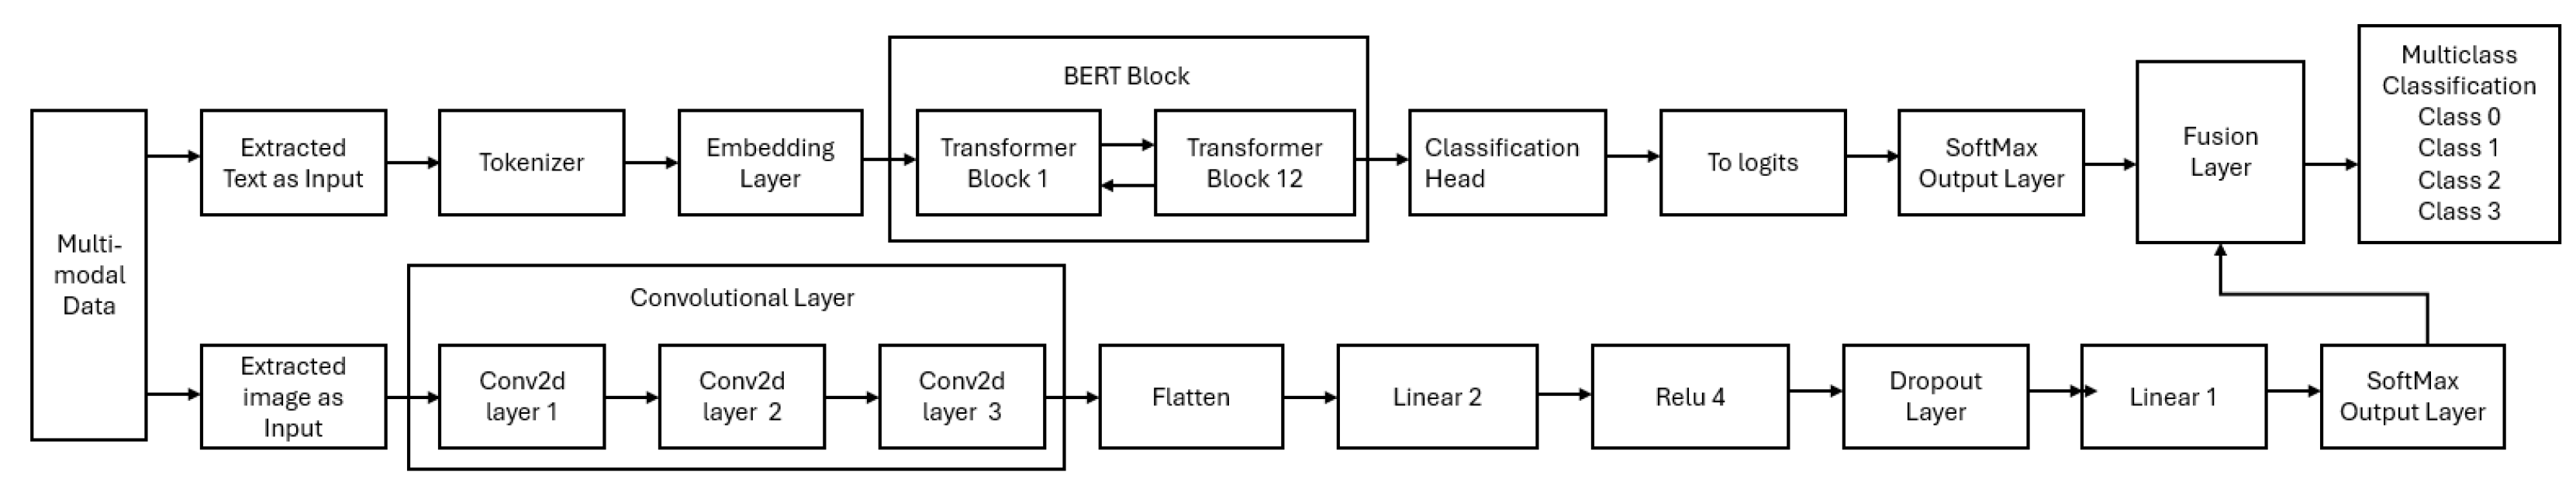
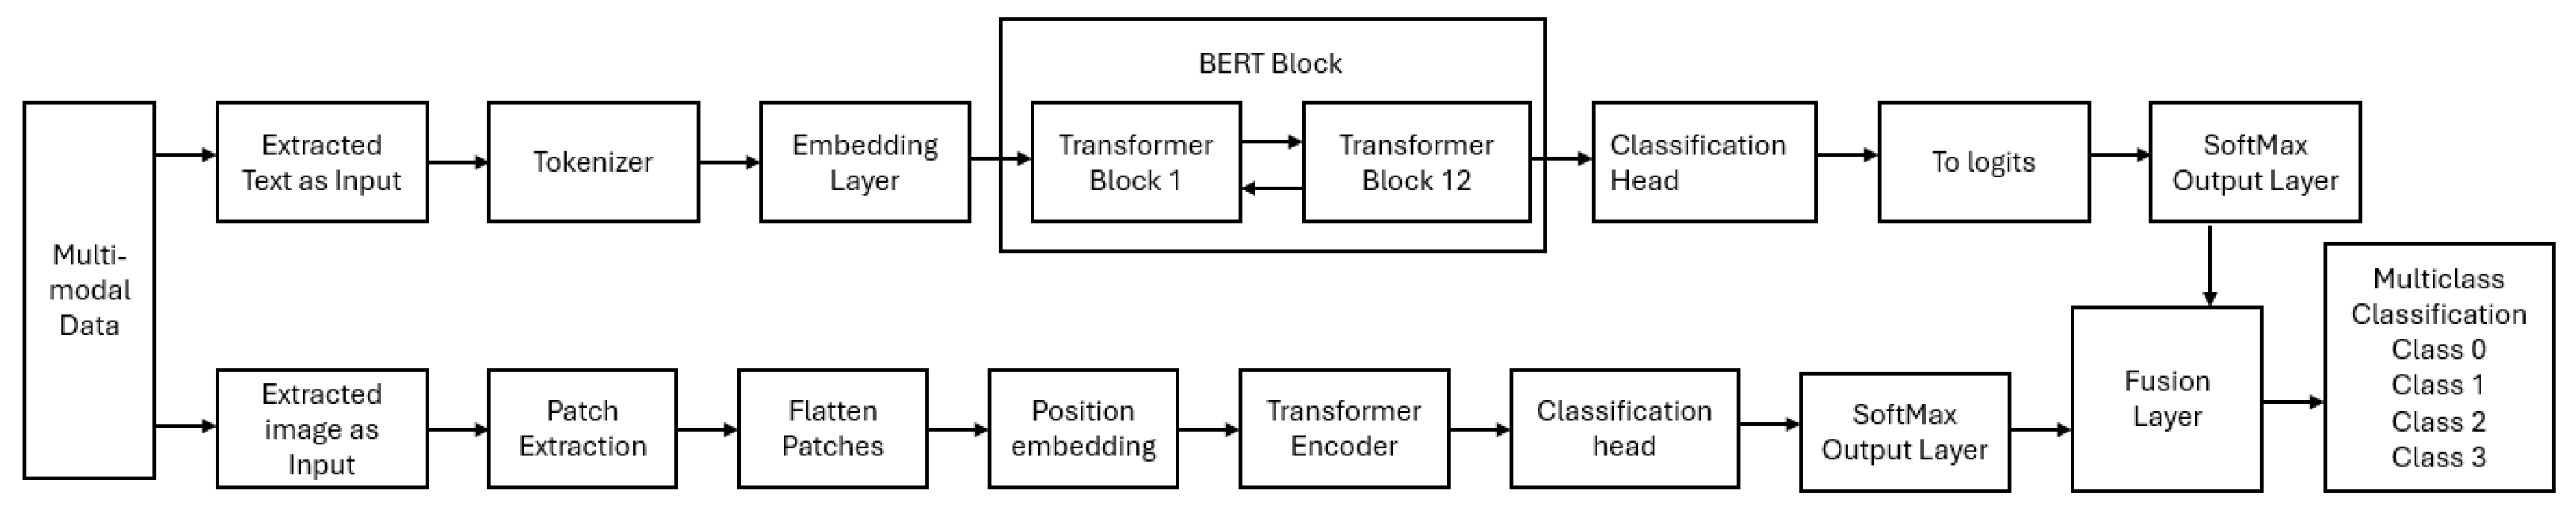
42], was implemented to combine the developed DL models for both the extracted text and image data. This approach resulted in a series of multi-modal models, including LSTM+ResNet, LSTM+CNN, LSTM+ViT, GRU+ResNet, GRU+CNN, GRU+ViT, BERT+ResNet, BERT+CNN, BERT+ViT, DistilBERT+ResNet, DistilBERT+CNN, DistilBERT+ViT, RoBERTa+ResNet, RoBERTa+CNN, and RoBERTa+ViT. These models were designed to classify multi-modal data.
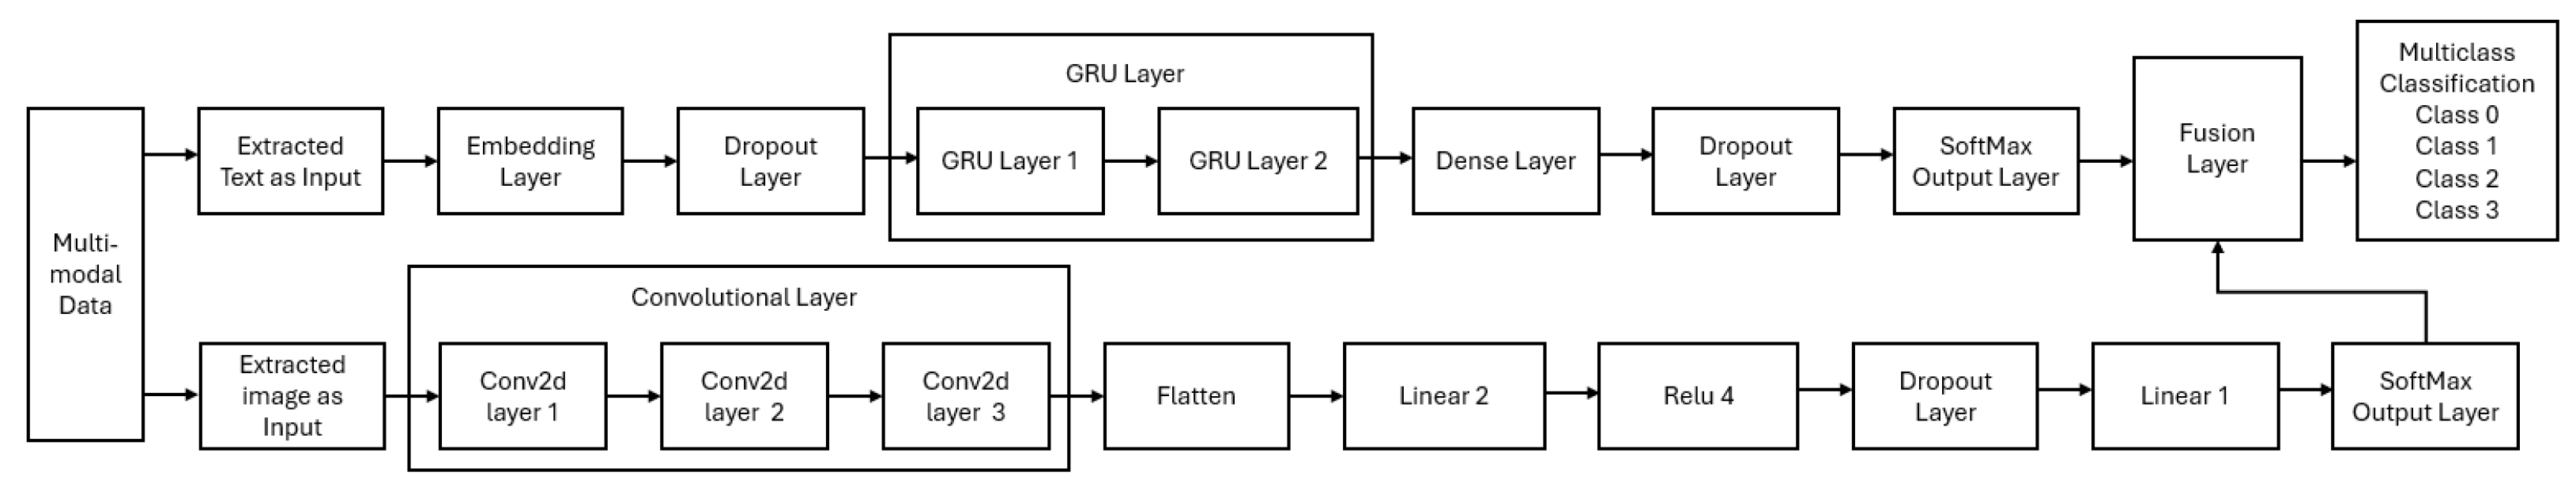
Figure 4,
Figure 5,
Figure 6,
Figure 7,
Figure 8,
Figure 9,
Figure 10,
Figure 11,
Figure 12,
Figure 13,
Figure 14,
Figure 15,
Figure 16,
Figure 17 and
Figure 18 present the architectures of the employed models. Each model concludes with a multi-class classification output layer to classify the input features into four classes.
3.7. Fusion Module
As shown in
Figure 3, to combine both extracted text and image modalities, a late fusion module approach was utilized, enabling each modality to be handled individually. This approach is particularly effective for memes, which inherently include both text and image components [
43]. The late fusion module operates by integrating the results from the independent classifications of the extracted text and image data. This integration ensures that both text and image analyses are considered in decision-making processes. The decision-making process, as detailed in Algorithm 1, outlines the steps for determining the final classification by integrating the results of the extracted text and image analyses, thus ensuring accurate handling of multi-modal data.
| Algorithm 1 Fusion logic for decision making on multi-modal data. |
- 1:
Begin - 2:
if text_class is not None and image_class is not None then - 3:
if text_class == image_class then - 4:
if text_class == 0 then - 5:
fusion_message ← “Input does not contain any cyberbullying.” - 6:
else - 7:
fusion_message ← “Input contains this class {text_class} of cyberbullying.” - 8:
end if - 9:
else - 10:
fusion_message ← “Input contains cyberbullying. Text label is: {text_label_number} and Image label is: {image_label_number}” - 11:
end if - 12:
else - 13:
fusion_message ← “This is not Multi-Modal Data!” - 14:
end if - 15:
End
|
The decision-making process, as detailed in Algorithm 1, first determines whether both extracted text and image classifications are available, signifying the presence of multi-modal data. If both analyses agree that there is “no cyberbullying”, the system outputs a message indicating the absence of cyberbullying. Conversely, if both analyses classify the input as the “same type of cyberbullying”, the system assigns a specific class to the input. In cases where the text and image classifications disagree, the module acknowledges the presence of cyberbullying but notes that the classifications differ. When either classification is missing, the system identifies the input as non-multi-modal data and provides an appropriate message. Ultimately, the process concludes by synthesizing the final output message. This cohesive response is effectively communicated to the user, providing clear and concise results of the cyberbullying classification process.
3.8. Experimental Setup and Hyperparameter Tuning
To enhance the performance of our models for the extracted text and image data on the public and private datasets, a common hyperparameter tuning strategy was considered. The Adam [
44] optimizer was used to adjust the hyperparameters based on the validation dataset, which ran for twenty epochs with a batch size of 20 and a learning rate of 0.00002. To prevent overfitting, an early stopping mechanism was implemented if there was no improvement after three consecutive epochs. For the public dataset’s text classification, the SparseCategoricalCrossentropy loss function was used. For the public dataset’s image classification, CrossEntropyLoss was applied.
For the private dataset’s image data, ten random search trials were conducted to fine-tune the hyperparameters and test different batch sizes (8, 16, 20, 32, and 64) and learning rates (0.00001, 0.00005, 0.0001, 0.0005, and 0.001). The best model configuration was chosen based on the validation loss and accuracy results. We used nn.CrossEntropyLoss along with early stopping (with a patience of three epochs) to avoid overfitting.
3.9. Model Performance Metrics
To evaluate the models’ performances, ten percent of the entire dataset was reserved for testing. To mitigate overfitting during training, early stopping was implemented with a patience threshold of three epochs. This approach allowed the models to stop training if no improvement in validation performance was observed over three consecutive epochs, ensuring a more generalized learning process. Once the training phase was completed, the reserved test set was used to evaluate the effectiveness of the models. The final models’ performances were evaluated using key performance metrics, including a confusion matrix, accuracy, precision, recall, and F1-score [
45], to provide a comprehensive analysis of the predictive capabilities of the models.
3.9.1. Confusion Matrix
The confusion matrix in
Table 4 provides a structured representation of the performance of a multi-class classification model. In this study, the matrix extends to four classes, denoted as class 1, class 2, class 3, and class 4, which correspond to distinct categories within the dataset.
3.9.2. Accuracy
In the context of multi-class classification, accuracy quantifies the proportion of correctly predicted instances relative to the total number of instances in the dataset. The following formula is used to calculate accuracy, where
i represents the number of classes:
3.9.3. Precision
For multi-class classification, the macro-averaged precision is calculated by averaging the precision values across all classes. This metric helps identify how well the classifier avoids false positives across all categories. The precision for class
i for multi-class classification is defined as the ratio of true positives to the total number of predicted positives for class
i (sum of true positives and false positives):
For the macro-averaged precision, the average of precision across all classes is calculated as follows:
3.9.4. Recall
In multi-class classification, the macro-averaged recall is calculated by averaging the recall values across all classes. The recall for class
i is defined as the ratio of true positives to the total number of actual positives for class
i (sum of true positives and false negatives):
For the macro-averaged recall, the average of recall across all classes is calculated as follows:
3.9.5. F1-Score
For multi-class classification, the macro-averaged F1-score is calculated by averaging the F1-scores across all classes. This metric provides a clear overall evaluation of a model’s performance. The F1-score for class
i is the harmonic mean of precision and recall for that class:
For the macro-averaged F1-score, the average F1-score across all classes is computed as follows:
3.10. Model Deployment
After developing the deep learning (DL) models, they were deployed on a graphical user interface (GUI) utilizing the Flask Python Web Framework. This GUI served as the front-end interface, allowing users to input multi-modal data and output their final classes. Once deployed, the GUI provided an option for users to select between the public dataset and the private dataset for classification.
Algorithm 2 outlines the complete process of the model deployment and how the employed DL models process the given multi-modal data and output the classification. The algorithm works as follows: it starts upon receiving user inputs. The application preprocesses the data to ensure proper formatting for the DL models. The hybrid (RoBERTa+ViT) model is then employed to classify the multi-modal data. After generating the classification results, the program compiles the outputs and presents them to the user on a dedicated results page.
| Algorithm 2 Processing input through a GUI. |
- 1:
Start - 2:
Accept input data through the GUI (e.g., memes). - 3:
Perform Text Extraction to retrieve textual content from the input. - 4:
Perform Image Extraction to retrieve visual content from the input. - 5:
Process the extracted text and image using the hybrid DL model. - 6:
Generate a fusion-based output based on the processed data. - 7:
Render the classification results on the GUI using a template. - 8:
End
|
The GUI was designed using technologies HyperText Markup Language (HTML), Cascading Style Sheets (CSS), and JavaScript. The Flask application (
https://flask.palletsprojects.com/) acts as the back end, handling incoming requests and facilitating model predictions through Python-based workflows.
4. Results
This section presents the results obtained from various experiments using both the public and private datasets.
4.1. Experimental Results on the Public Dataset
Table 5 presents the results obtained from a series of experiments conducted on the public dataset. In the Table, it can be observed that the results varied, which may be due to the combination of models used.
As shown in
Table 5, the LSTM+ResNet hybrid model achieved an accuracy of 0.709, a recall of 0.715, an F1-score of 0.665, and a precision of 0.665. The LSTM+CNN hybrid model outperformed LSTM+ResNet, achieving an accuracy of 0.729, a recall of 0.734, an F1-score of 0.685, and a precision of 0.685. Further improvements were observed with the LSTM+ViT hybrid model, which achieved an accuracy of 0.734 and an F1-score of 0.691. The GRU+ResNet model, which achieved an accuracy of 0.723, a recall of 0.715, an F1-score of 0.655, and a precision of 0.632, was outperformed by the GRU+CNN model, with an accuracy of 0.743, a recall of 0.735, an F1-score of 0.675, and a precision of 0.654. Further improvements were observed with the GRU+ViT hybrid model, which obtained an accuracy of 0.748, a recall of 0.748, an F1-score of 0.685, and a precision of 0.655.
In addition, the BERT+ResNet hybrid model achieved an accuracy of 0.959 and identical recall, F1-score, and precision values of 0.959. The BERT+CNN hybrid model performed even better, obtaining an accuracy of 0.979 and identical recall, F1-score, and precision values of 0.979. The BERT+ViT hybrid model achieved an accuracy of 0.984 and identical recall, F1-score, and precision values of 0.984.
The DistilBERT+ResNet hybrid model attained an accuracy of 0.966, with recall, F1-score, and precision values all being 0.966. Further, the DistilBERT+CNN model improved on this, achieving an accuracy of 0.986, along with strong recall, F1-score, and precision values. The DistilBERT+ViT model achieved an accuracy of 0.991, with recall, F1-score, and precision values of 0.991. Similarly, the RoBERTa+ResNet achieved an accuracy of 0.966, with matching recall, F1-score, and precision values of 0.966. The RoBERTa+CNN model performed better when compared to previous models, achieving an accuracy of 0.986. Finally, the RoBERTa+ViT model demonstrated the best overall performance, achieving an accuracy of 0.992, with recall, F1-score, and precision values all reaching 0.992, demonstrating not only exceptional accuracy but also a high degree of reliability and balance in correctly identifying both positive and negative cases.
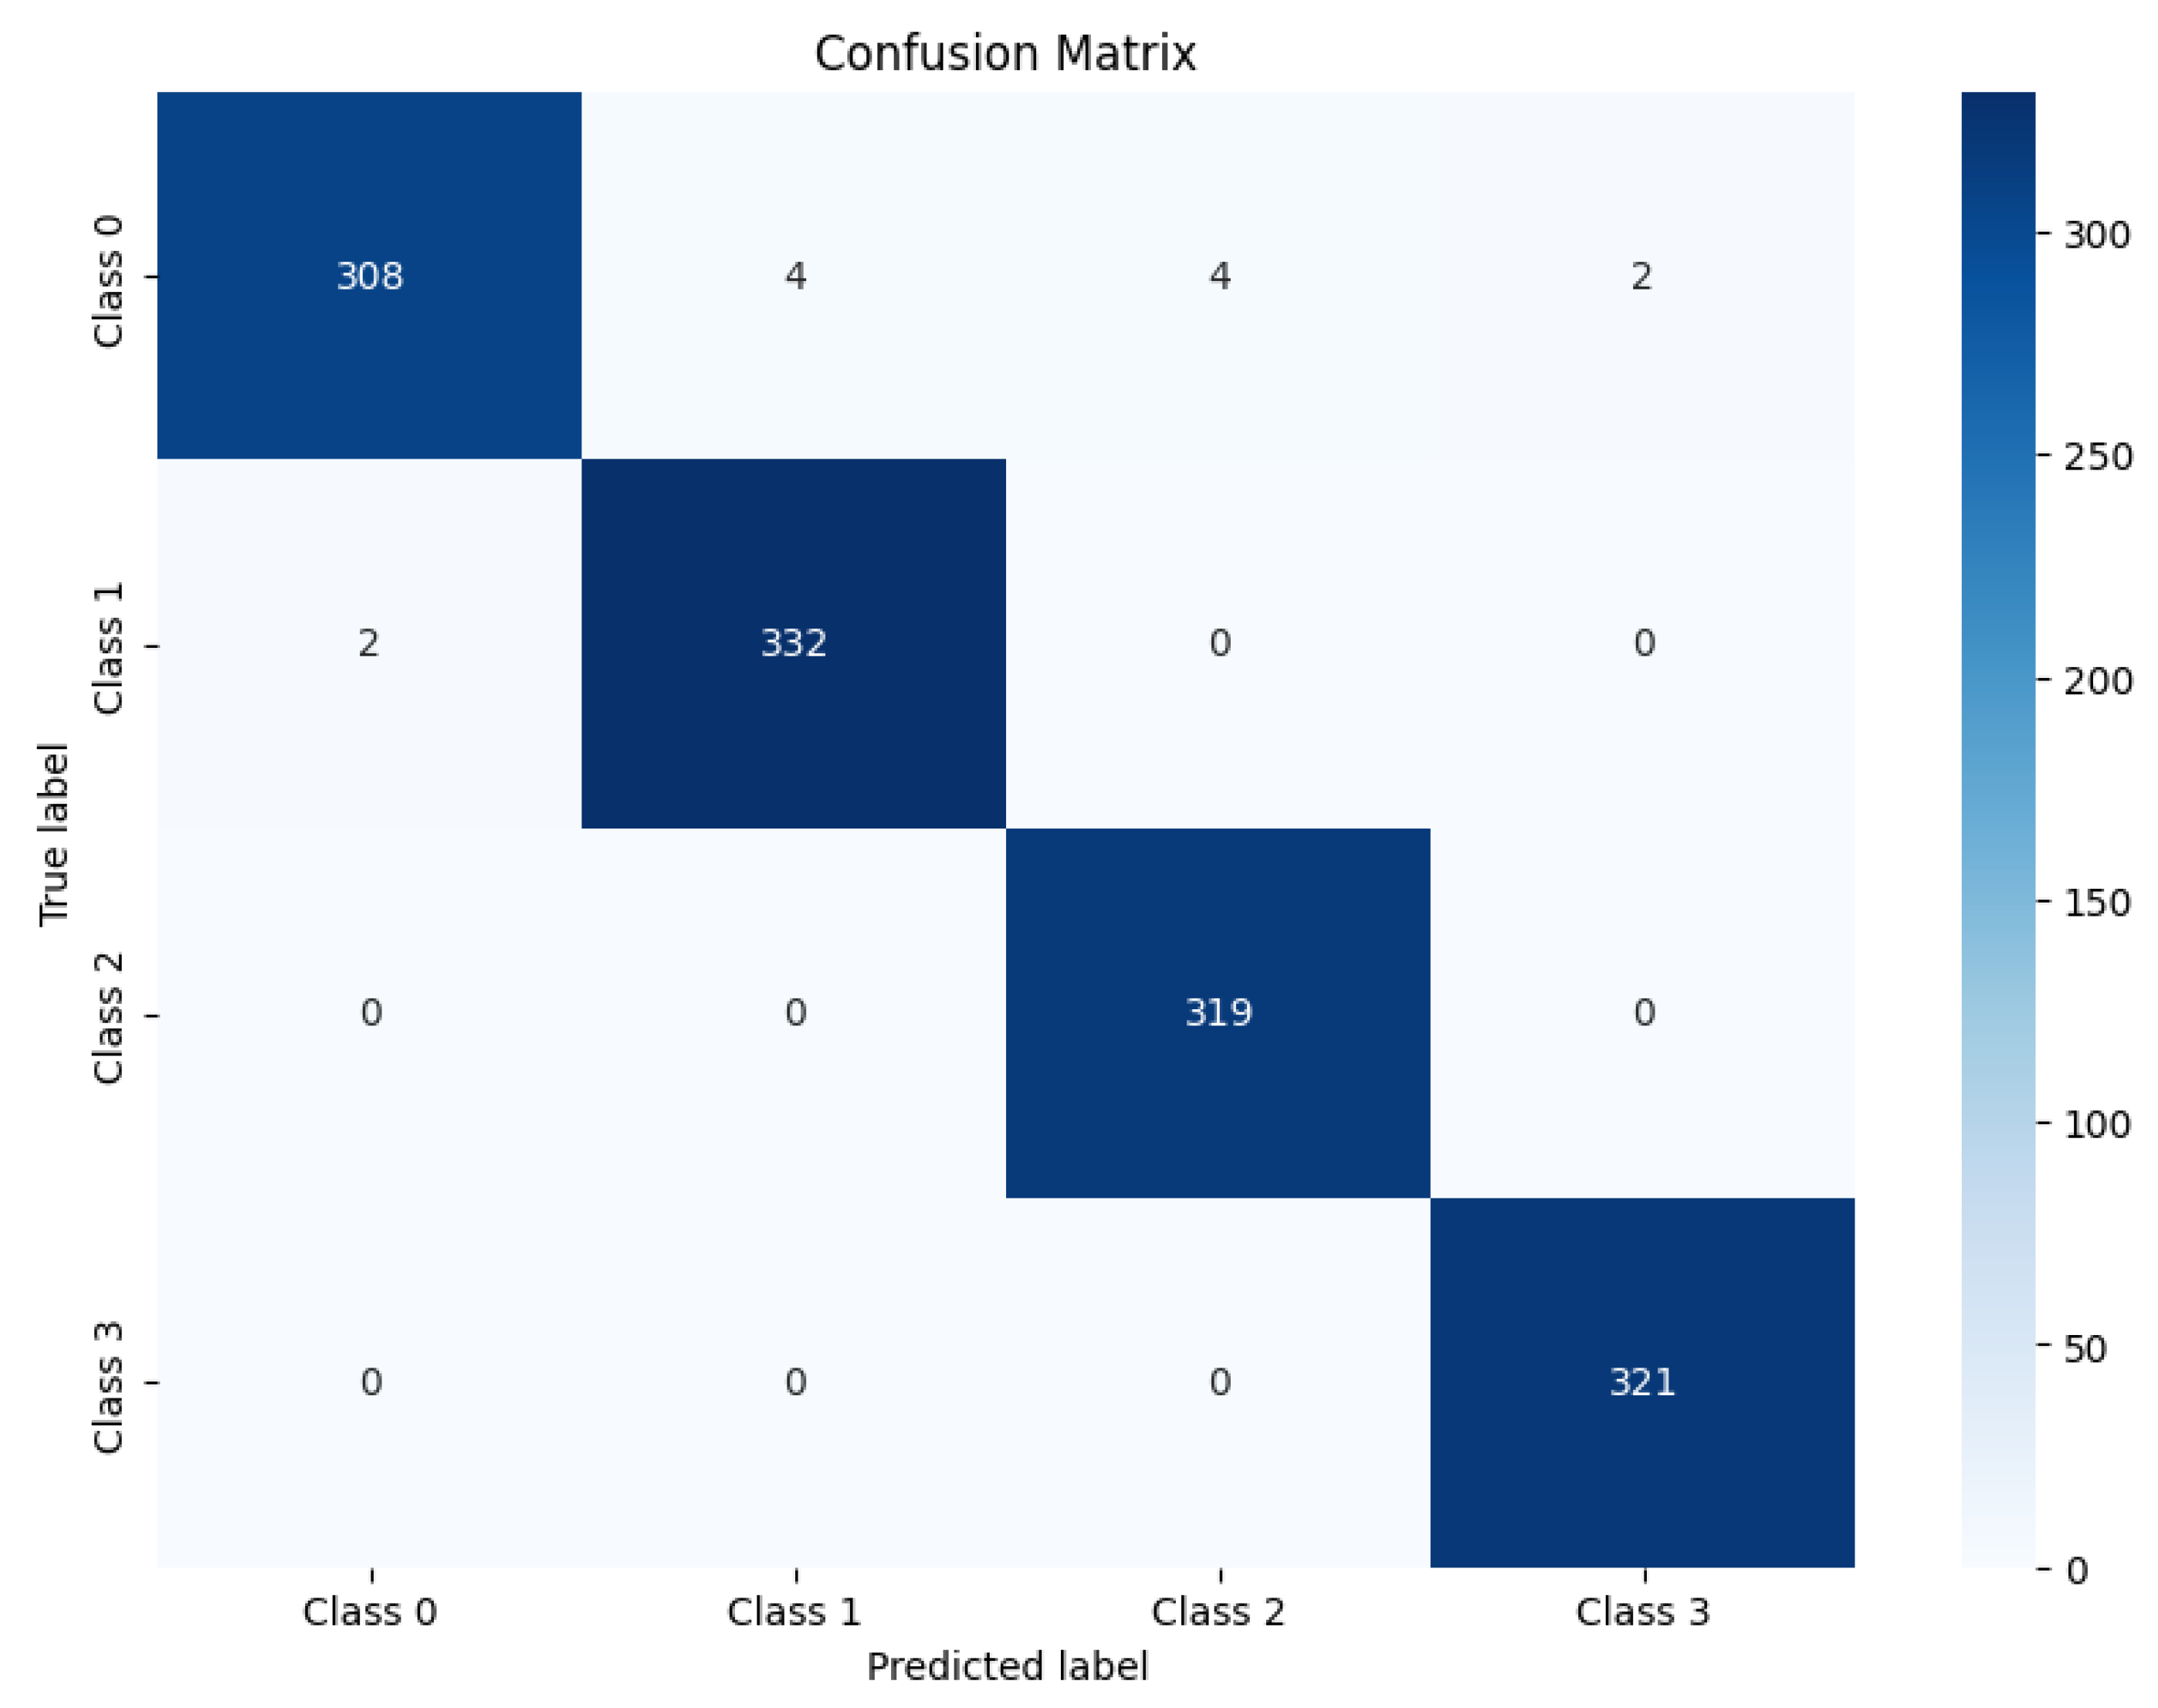
The confusion matrix analysis, as shown in
Figure 19, highlights the reliability of the RoBERTa+ViT hybrid model, showing a strong dominance of the diagonal elements, which represent correct classifications, over the off-diagonal elements, which indicate misclassifications. Notably, the employed RoBERTa+ViT model correctly classified 308 instances as class 0 (non-bullying), and 332 instances were correctly classified as class 1 (defamatory). For class 2, 319 instances were correctly classified (offensive). For class 3 (aggressive), the model correctly classified 321 instances. However, the model misclassified four instances of class 0 as class 1 and four instances of class 0 as class 3. Furthermore, the model misclassified two instances of class 0 as class 3, and two instances were misclassified as class 0. From these classifications, it can be said that the model performed exceptionally well for classes 2 and 3, with no misclassifications into other classes. Also, it can be concluded that the misclassifications were minimal, with only a few cases of confusion between closely related classes, particularly between class 0 and class 1. Overall, the dominance of the diagonal elements indicates high accuracy and strong performance.
4.2. Results on the Private Dataset
The experimental results obtained on the public dataset (see
Table 5) show that the RoBERTa+ViT hybrid model outperformed other hybrid deep learning models. Based on this, the hybrid model was chosen to classify multi-modal data on the private dataset. As above, the hybrid model’s performance was evaluated by integrating the individual performances of RoBERTa and ViT and averaging their results using a late fusion module. The RoBERTa+ViT model was evaluated using various performance metrics, and the results are presented in
Table 6. In the table, it can be seen that the model performed exceptionally well on the private dataset as well, achieving an accuracy of 96.10%, indicating that the model correctly predicted most of the test data. The F1-score of 95.90% highlights the model’s balance in correctly identifying both positive and negative classes. The precision of 96.00% shows that the model’s positive predictions were highly reliable, while the recall of 95.90% indicates that the model successfully classified nearly all positive cases. Finally, the impressive ROC-AUC value of 0.999 reflects the model’s outstanding ability to distinguish between different classes, making it highly effective for classification tasks.
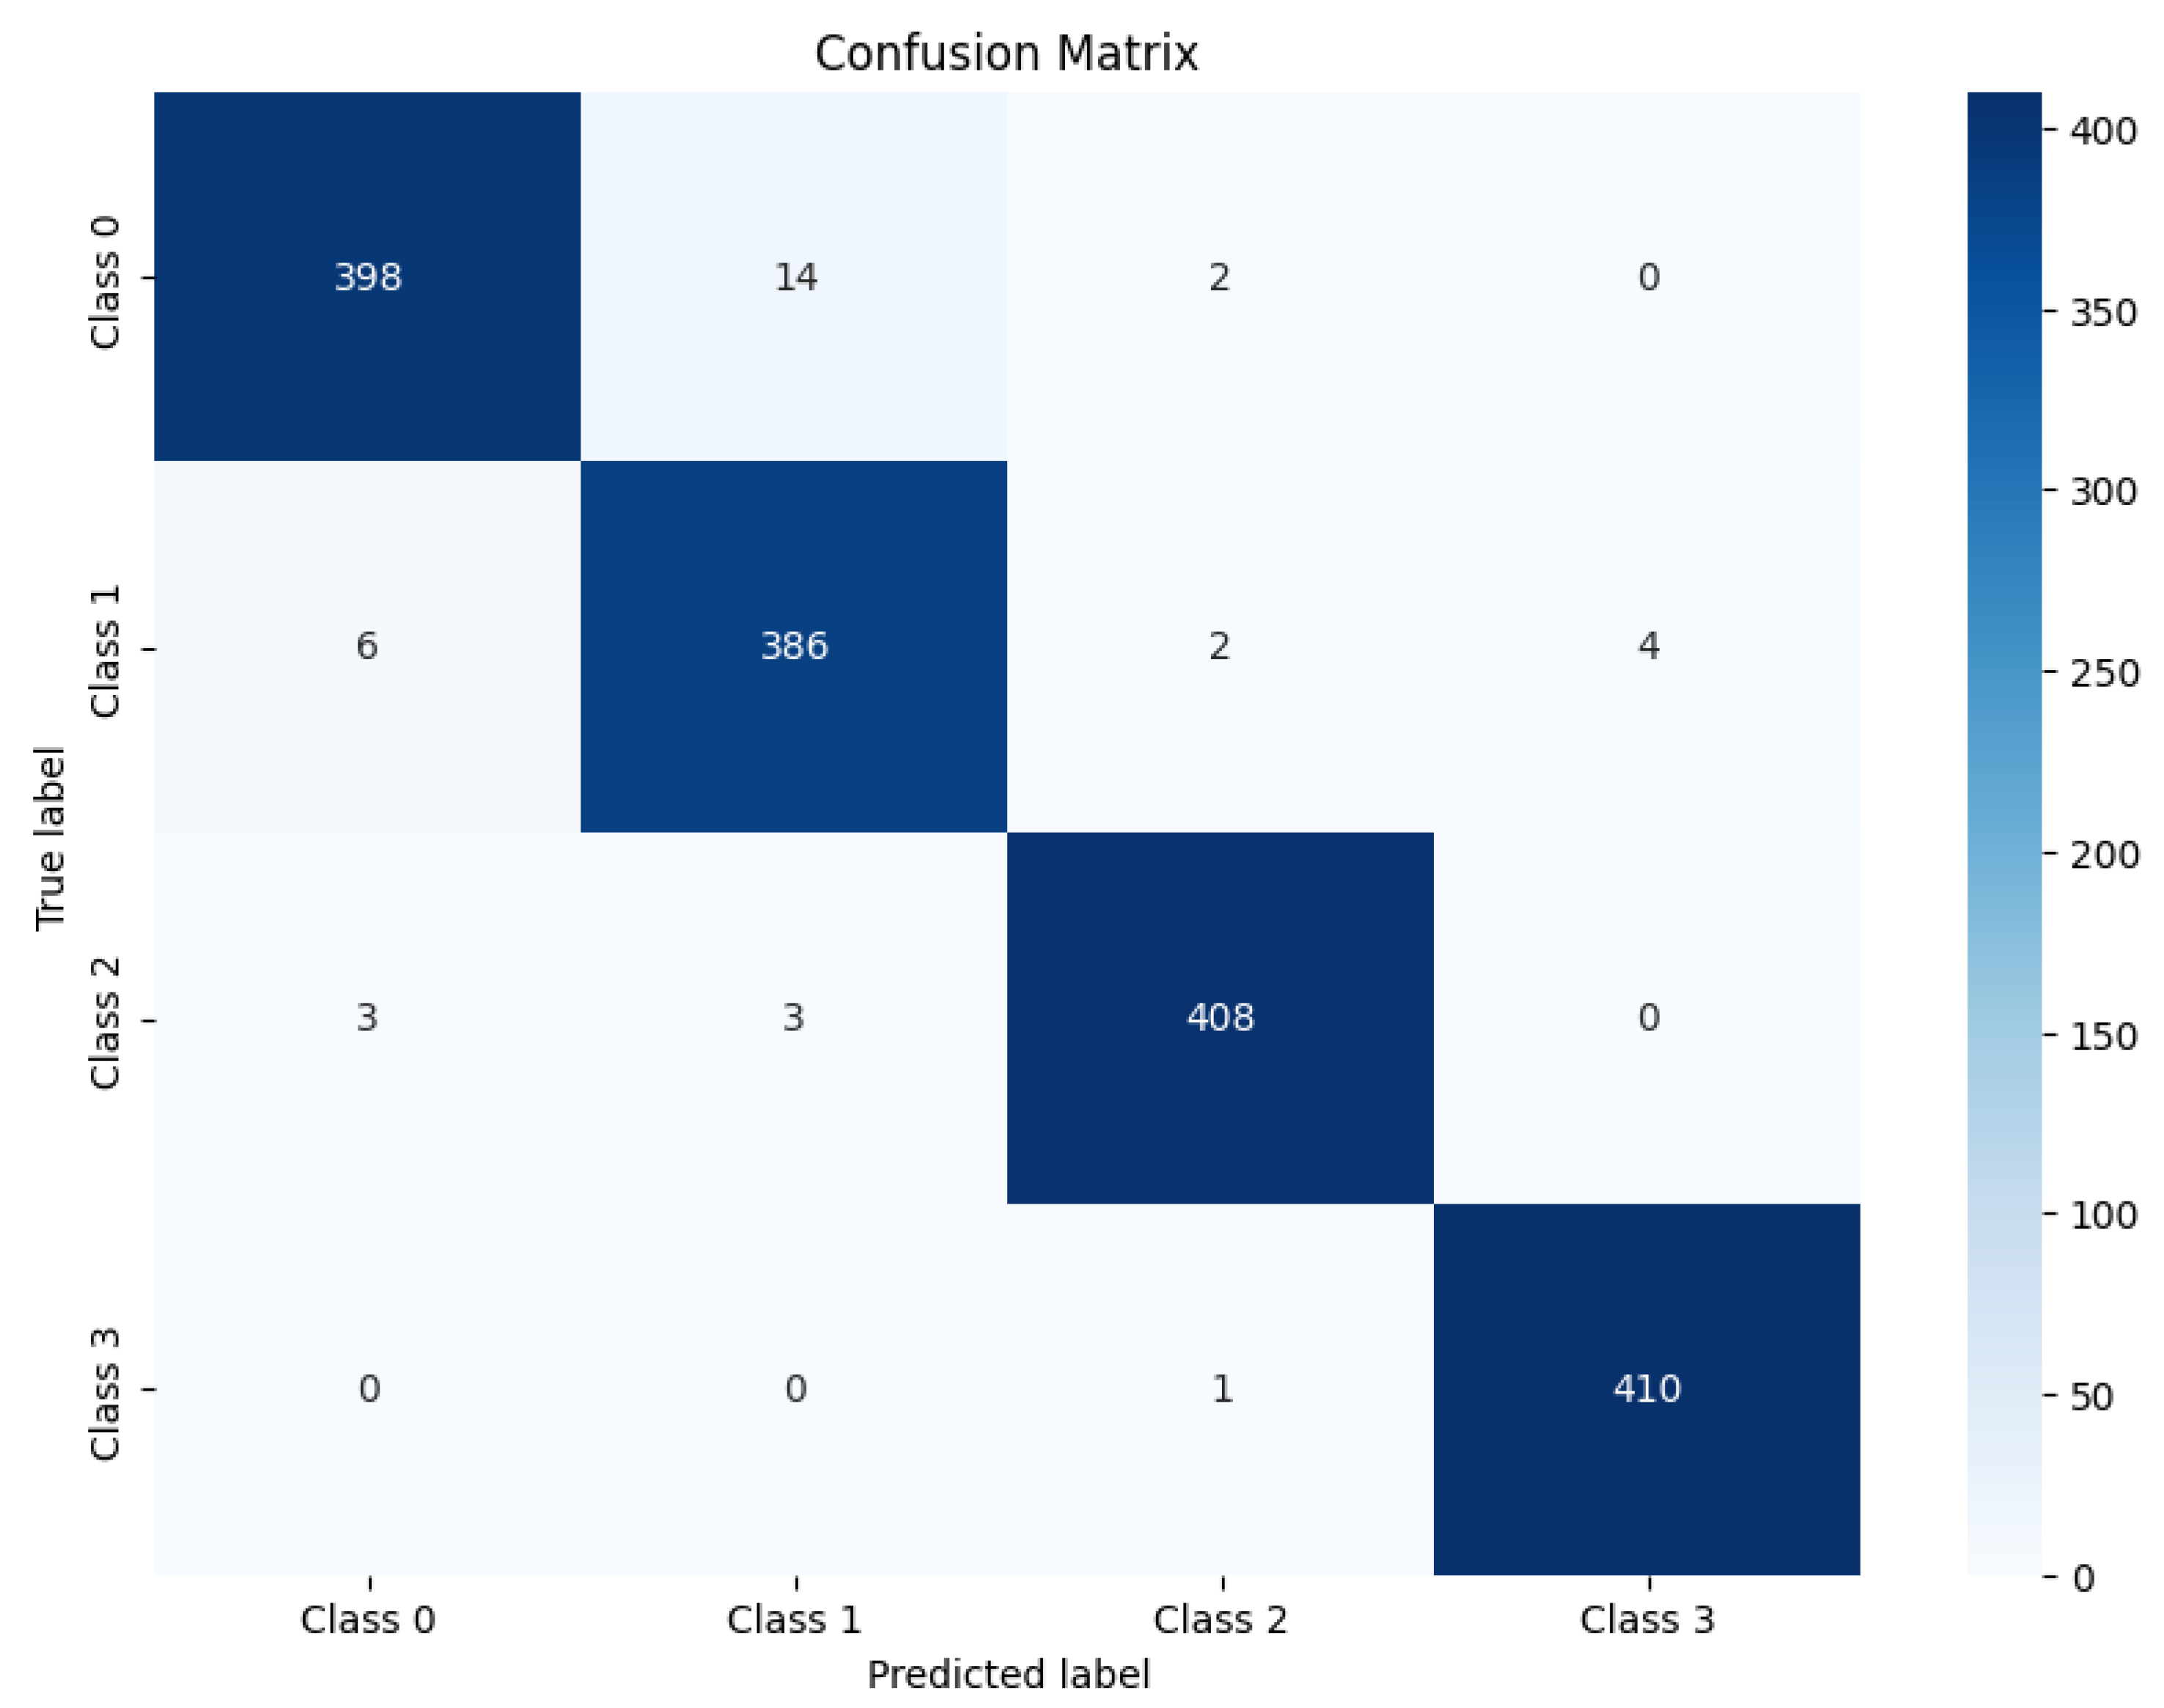
Figure 20 illustrates the computed confusion matrix using the RoBERTa+ViT model, highlighting its classification performance across various classes. The model successfully classified 398 instances of class 0 as class 0. For class 1, the model correctly classified 386 instances Similarly, 408 instances were correctly classified as class 2, and 410 instances were correctly classified as class 3. However, the model misclassified 14 instances of class 0 as class 1 and 2 instances of class 0 as class 2.
Furthermore, six instances of class 1 were misclassified as class 0, two instances of class 1 were misclassified as class 2, and four instances of class 1 were misclassified as class 3. For class 2, three instances were misclassified as class 0, and three instances were misclassified as class 1. Finally, one instance of class 3 was misclassified as class 2. The confusion matrix analysis shows that the diagonal elements are large, indicating that the model performed very well in classifying most of the samples correctly, particularly for class 3, which had only one misclassification. Moreover, there were only a few misclassifications between adjacent classes (e.g., class 0 was misclassified as class 1, and class 1 was misclassified as class 0), suggesting that the model has high discriminative power between different classes.
4.3. Validating Results Through Model Deployment
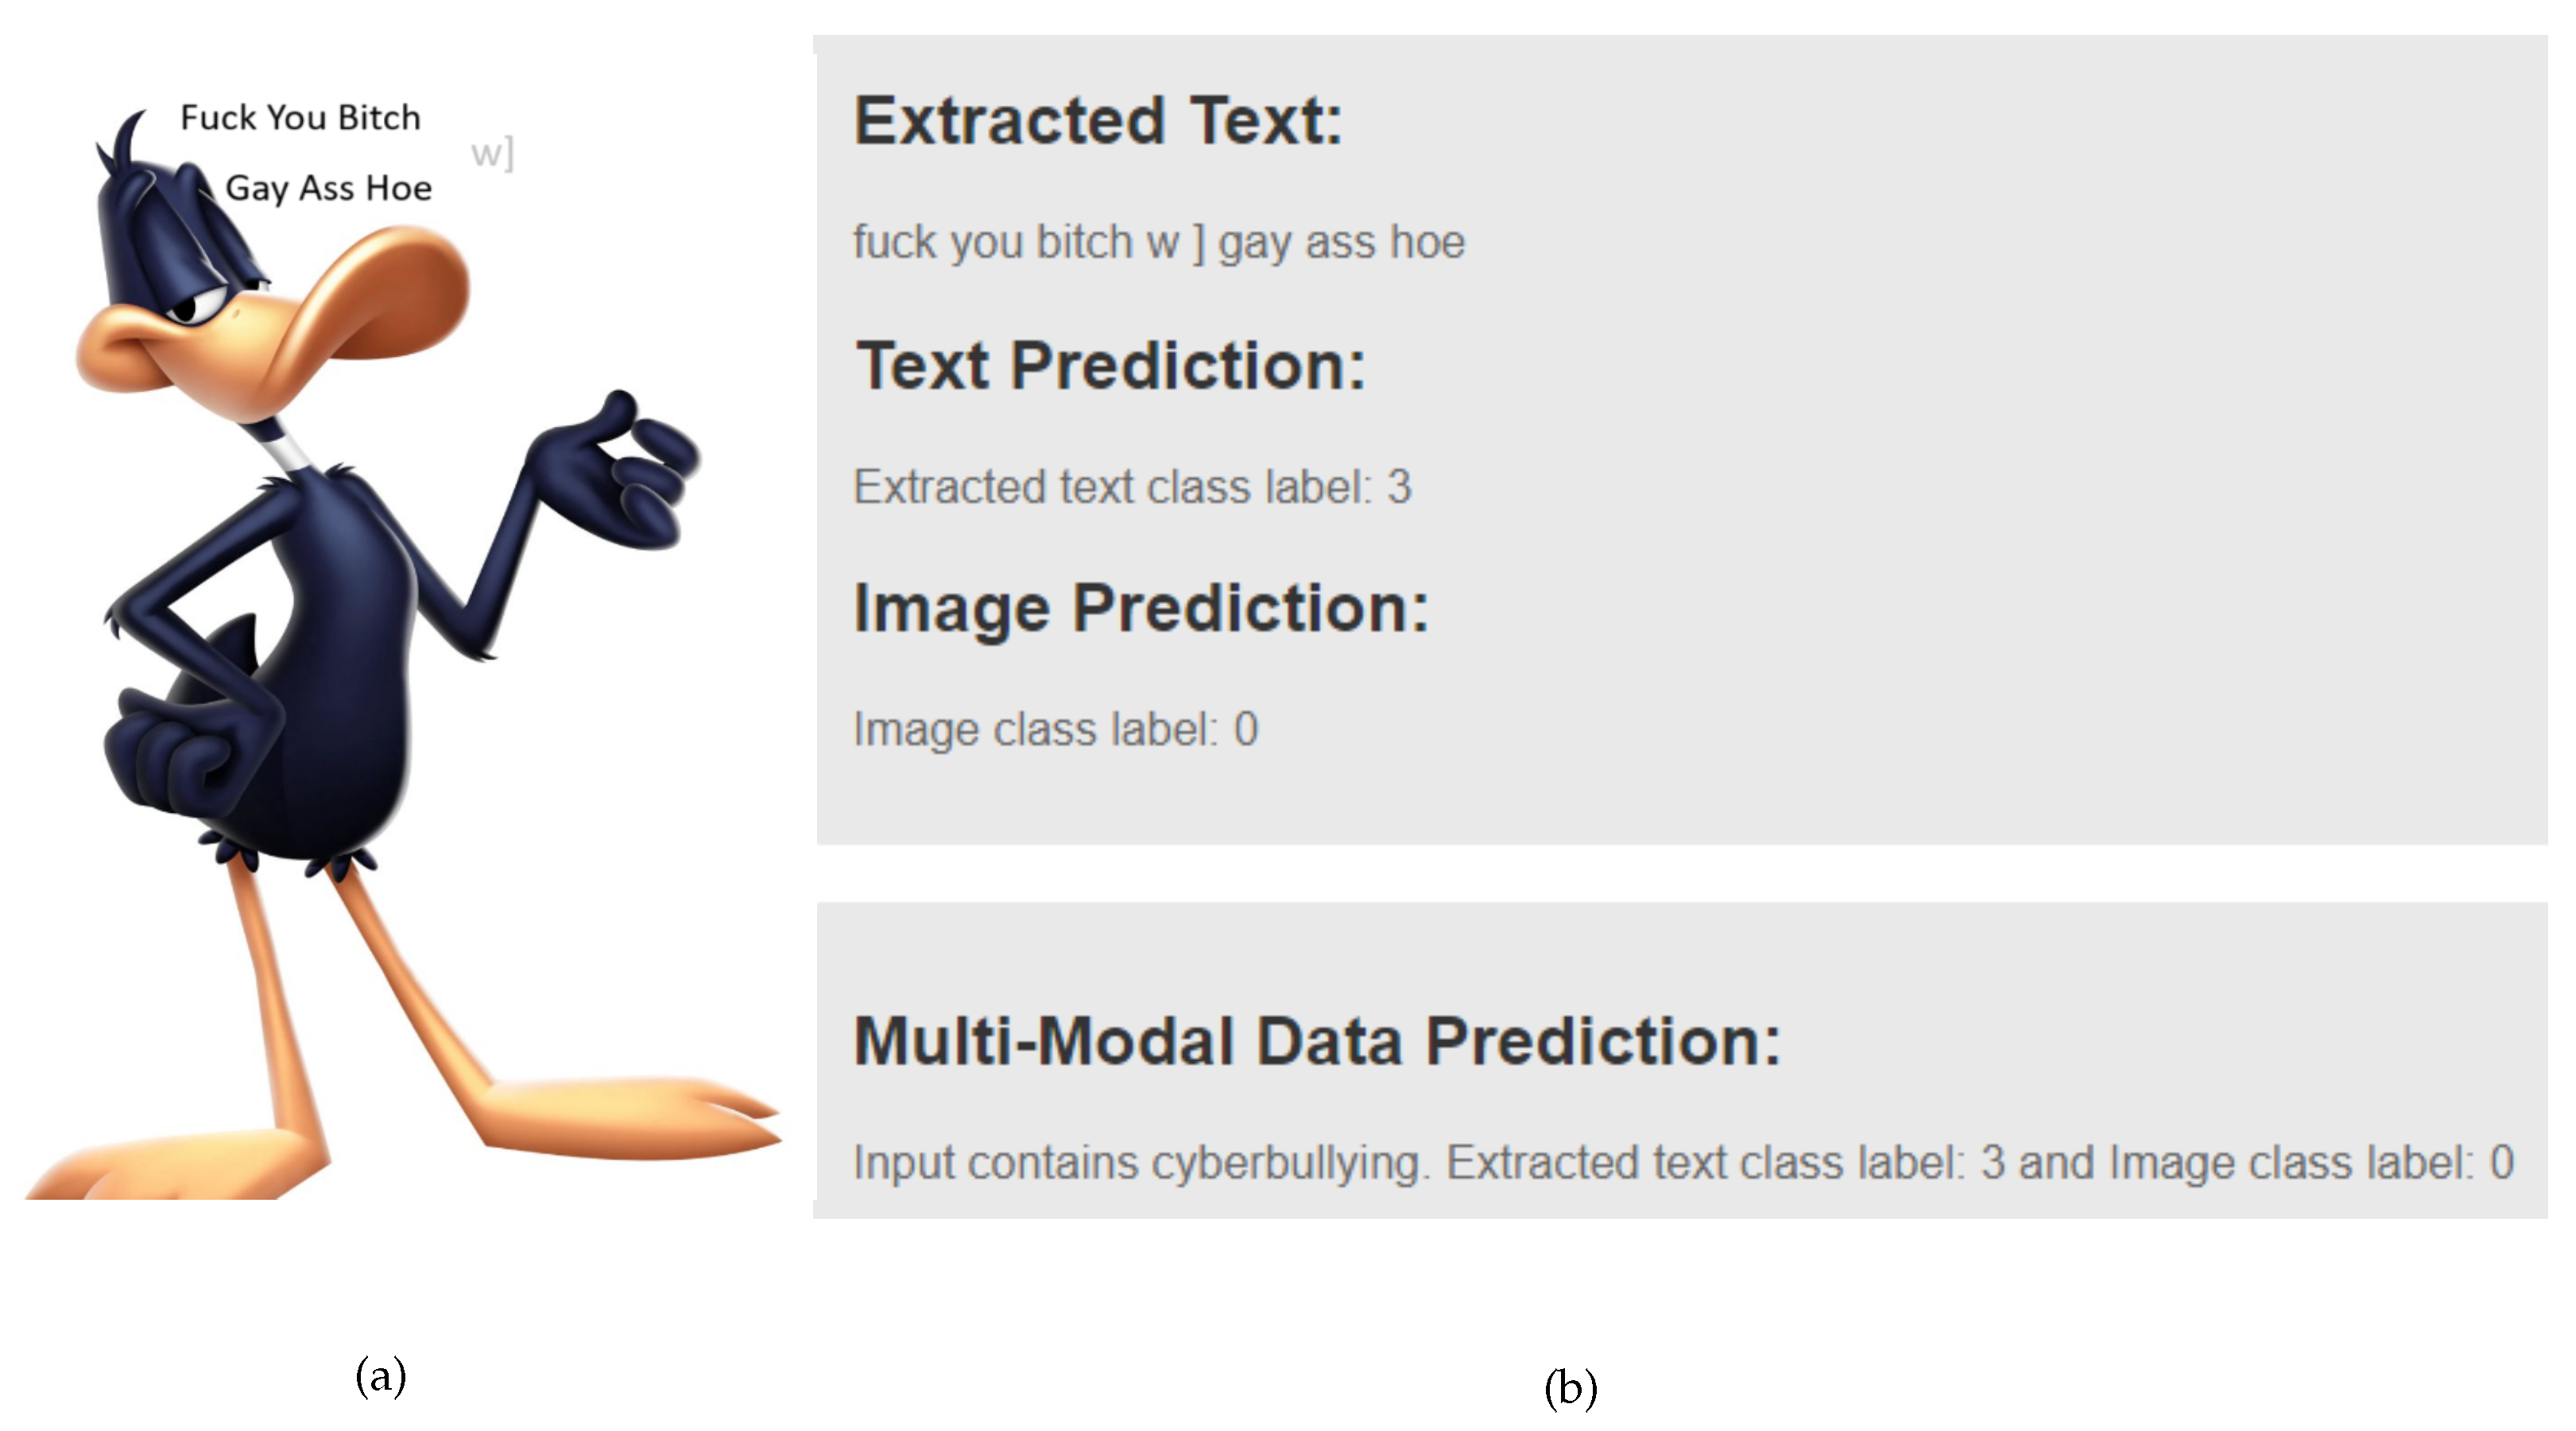
After developing the models, the best-performing model was deployed on a graphical user interface (GUI) to validate the results obtained earlier. The multi-modal data shown in
Figure 21a were used as input to assess whether the meme contained any traces of cyberbullying. If cyberbullying content was detected, the model assigned the appropriate label. Based on the given input meme, the model labeled the image as class 0 (non-cyberbullying) and the text as class 3 (aggressive cyberbullying), as shown in
Figure 21b. This classification was due to the presence of cyberbullying-related elements in the text, leading to the meme being ultimately categorized as cyberbullying-related content.
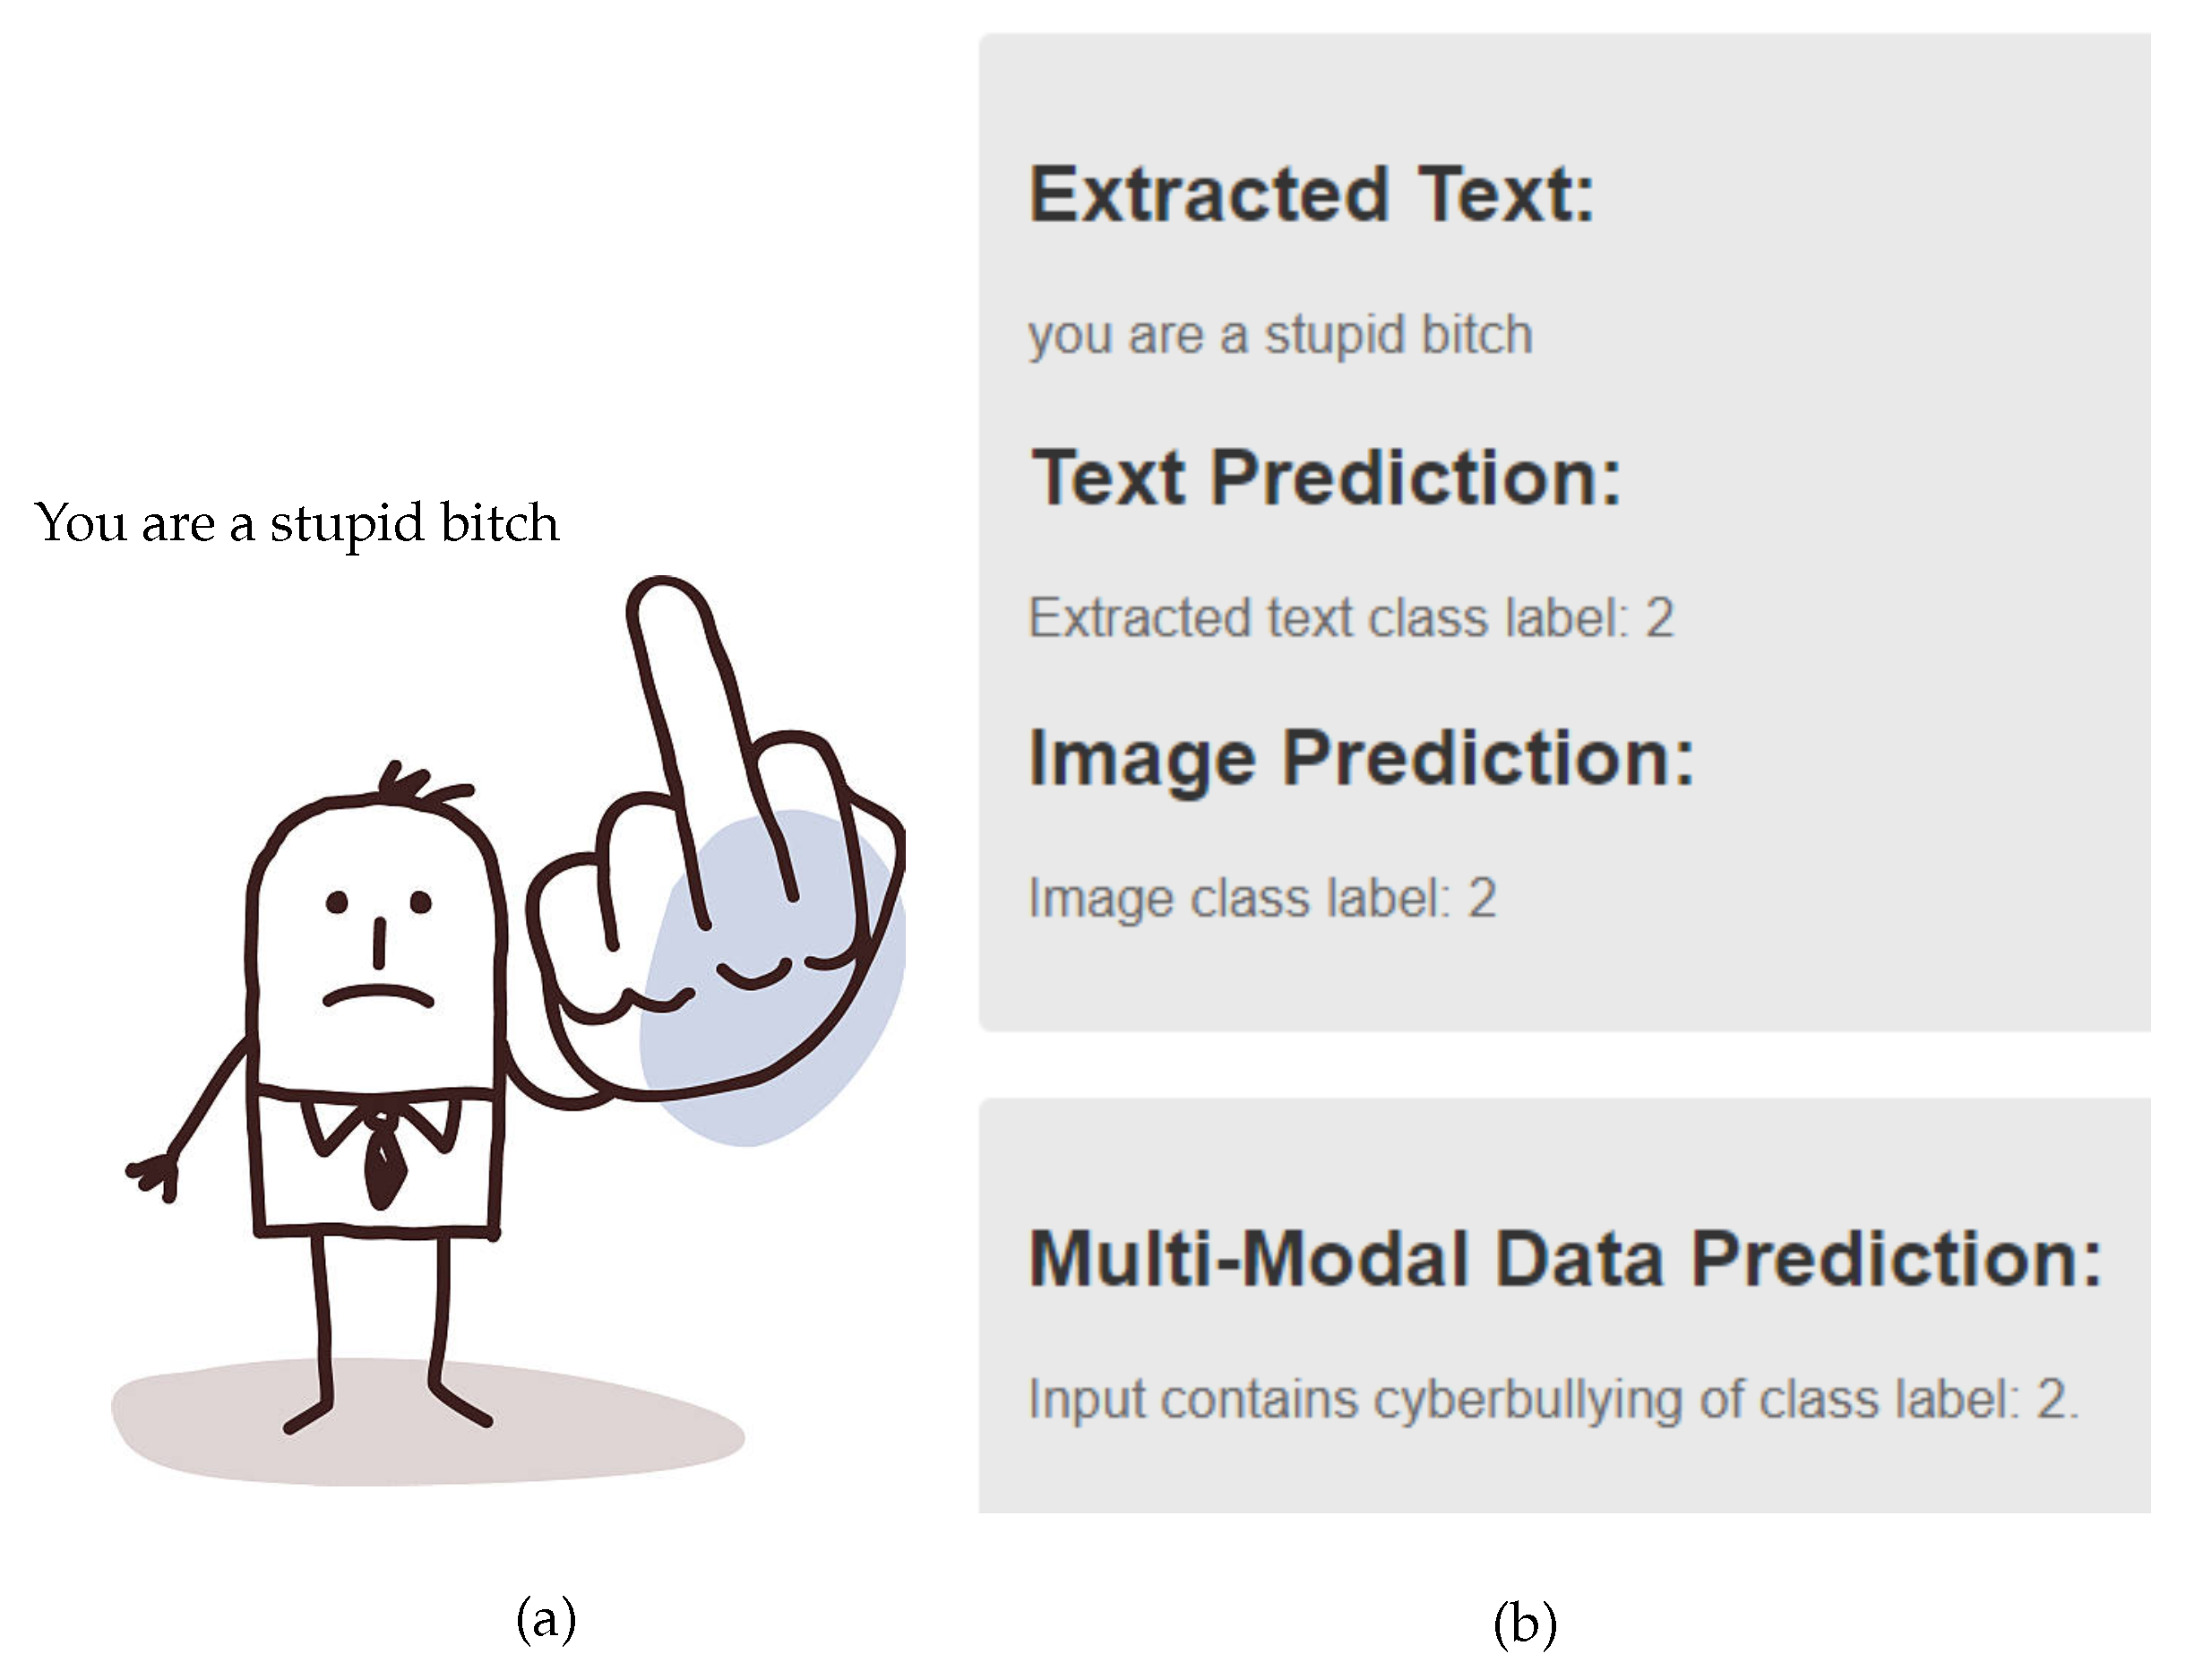
The multi-modal data depicted in
Figure 22a were analyzed to determine the presence of cyberbullying. The model assigned class 2 (offensive) to the image due to the depiction of a middle finger, which is indicative of cyberbullying. Additionally, the extracted text included offensive language, leading to its classification as class 2 (offensive). The overall classification of the meme as cyberbullying-related content is illustrated in
Figure 22b.
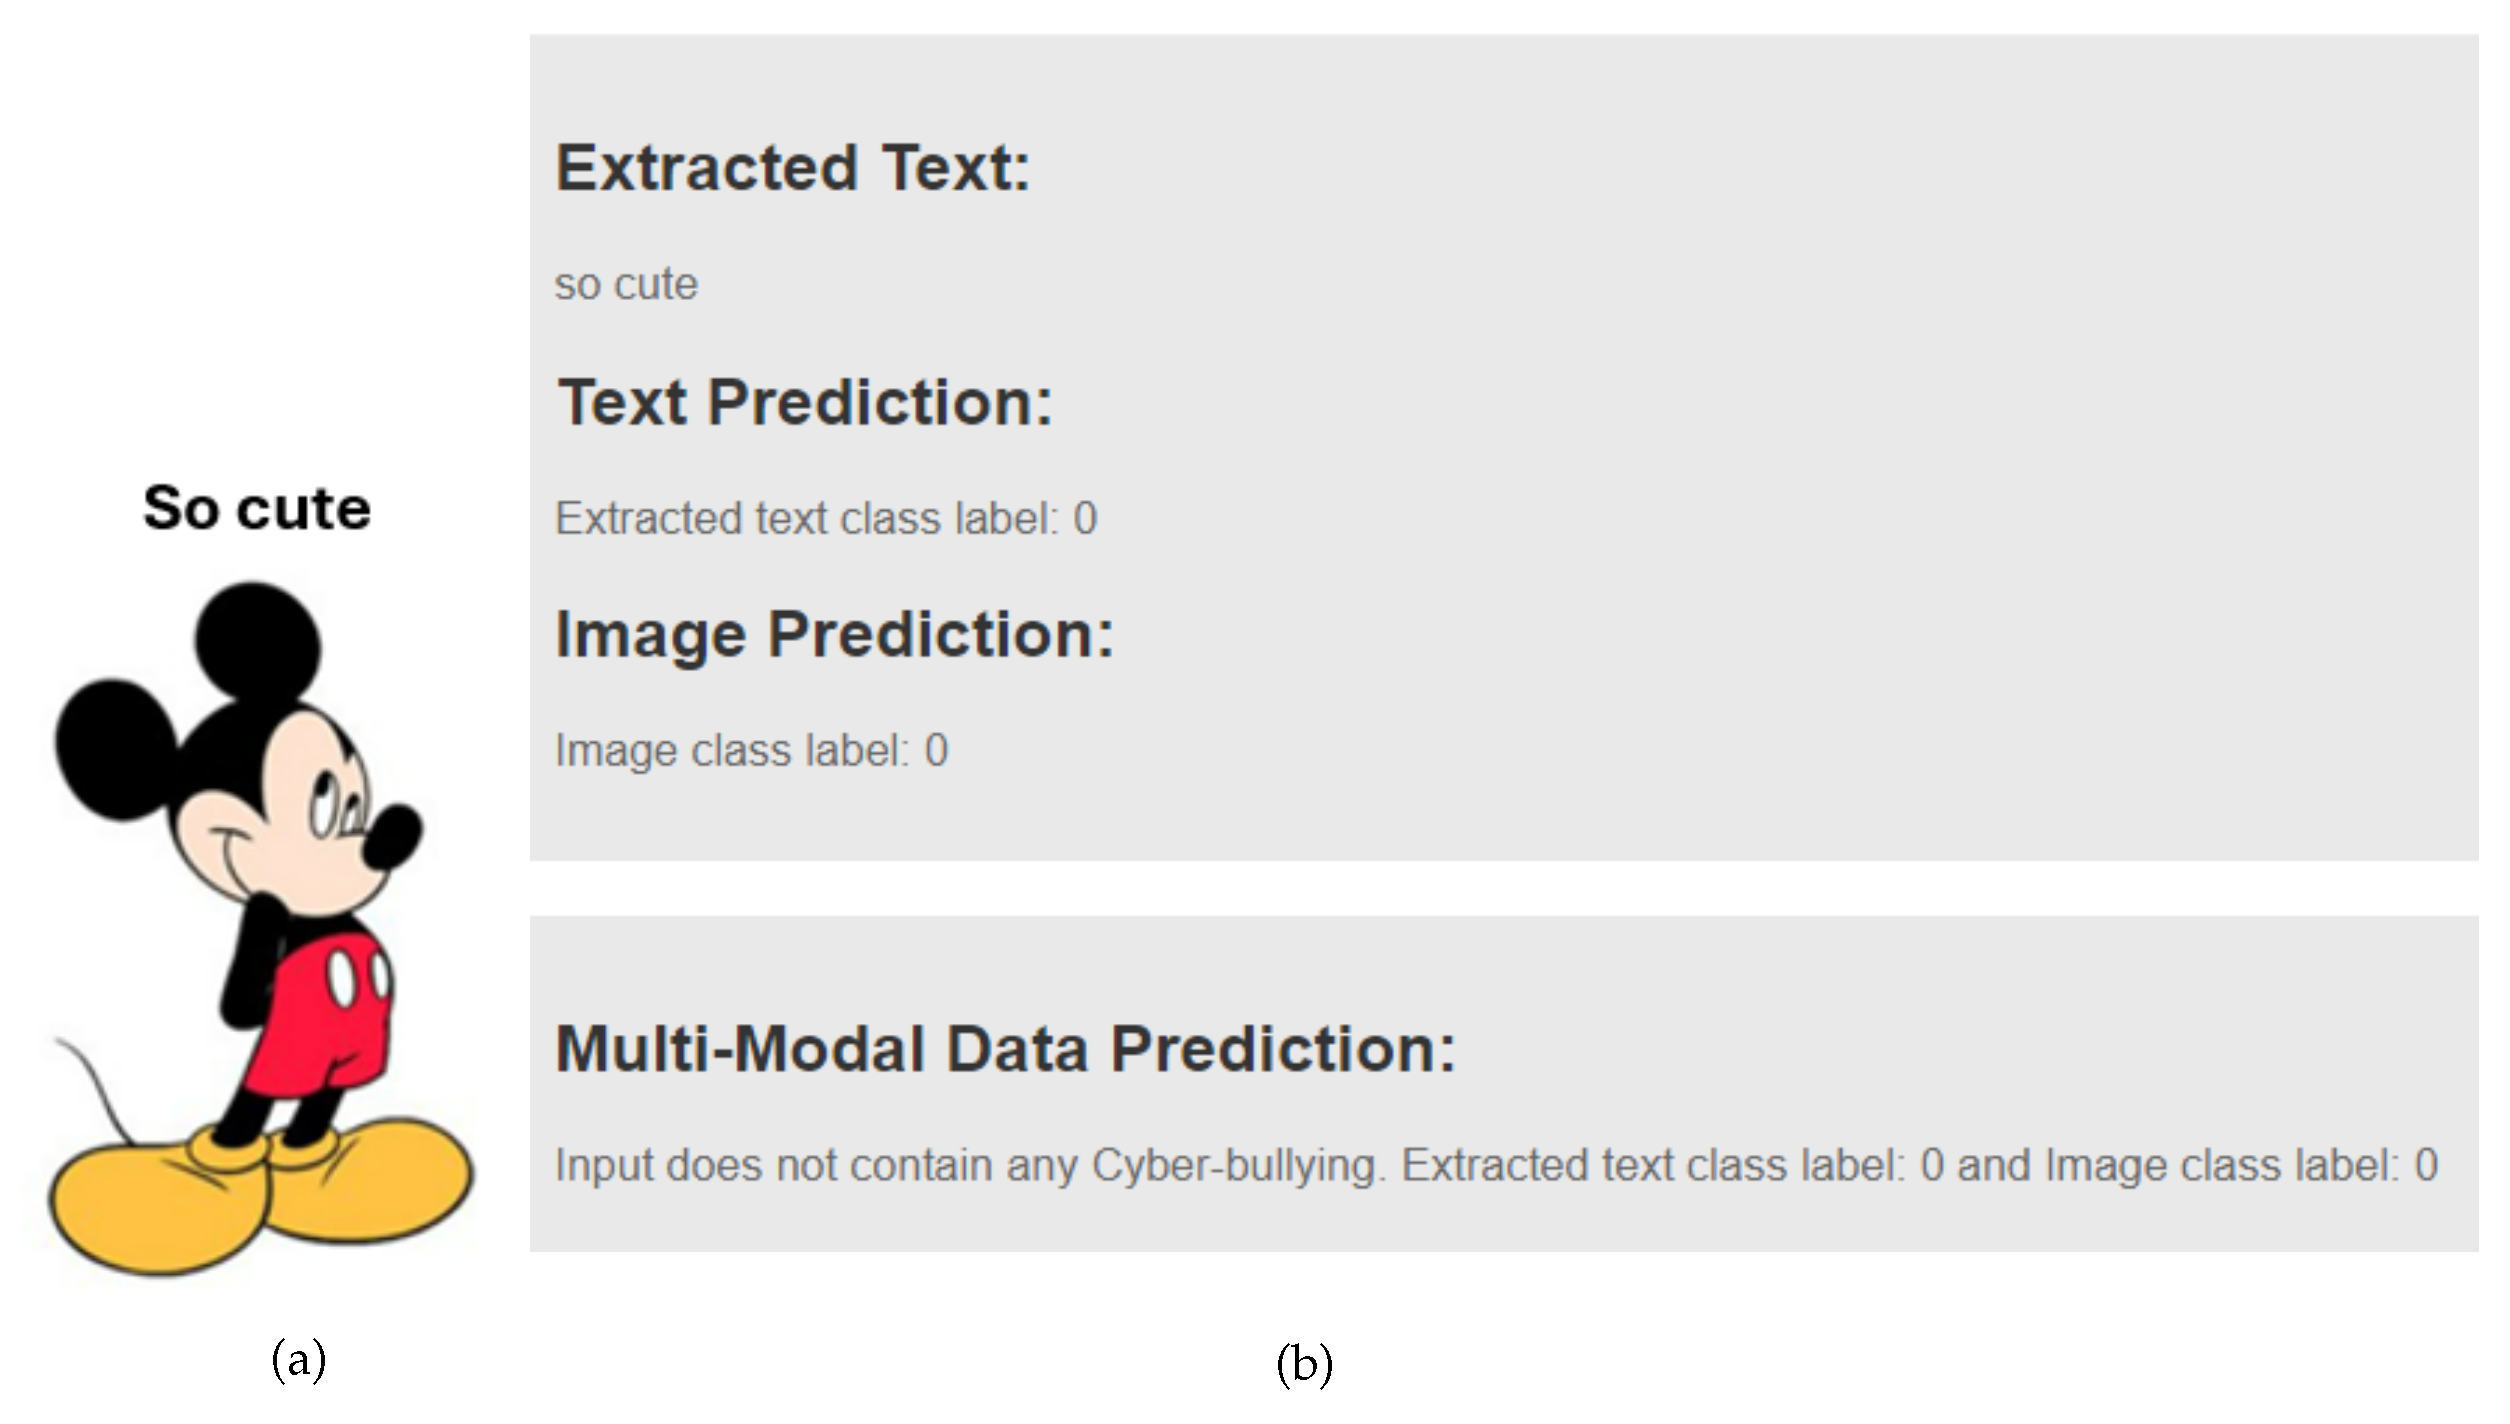
The multi-modal data shown in
Figure 23a were evaluated in the GUI to assess non-bullying content. The model classified both the image and the text as class 0 (non-cyberbullying), as depicted in
Figure 23b. This classification reflects the absence of cyberbullying in the meme. The GUI output in
Figure 23b displays the extracted text from the image, which was labeled as non-bullying, consistent with the image classification. Consequently, the overall assigned label for the multi-modal data was class 0 (non-cyberbullying).
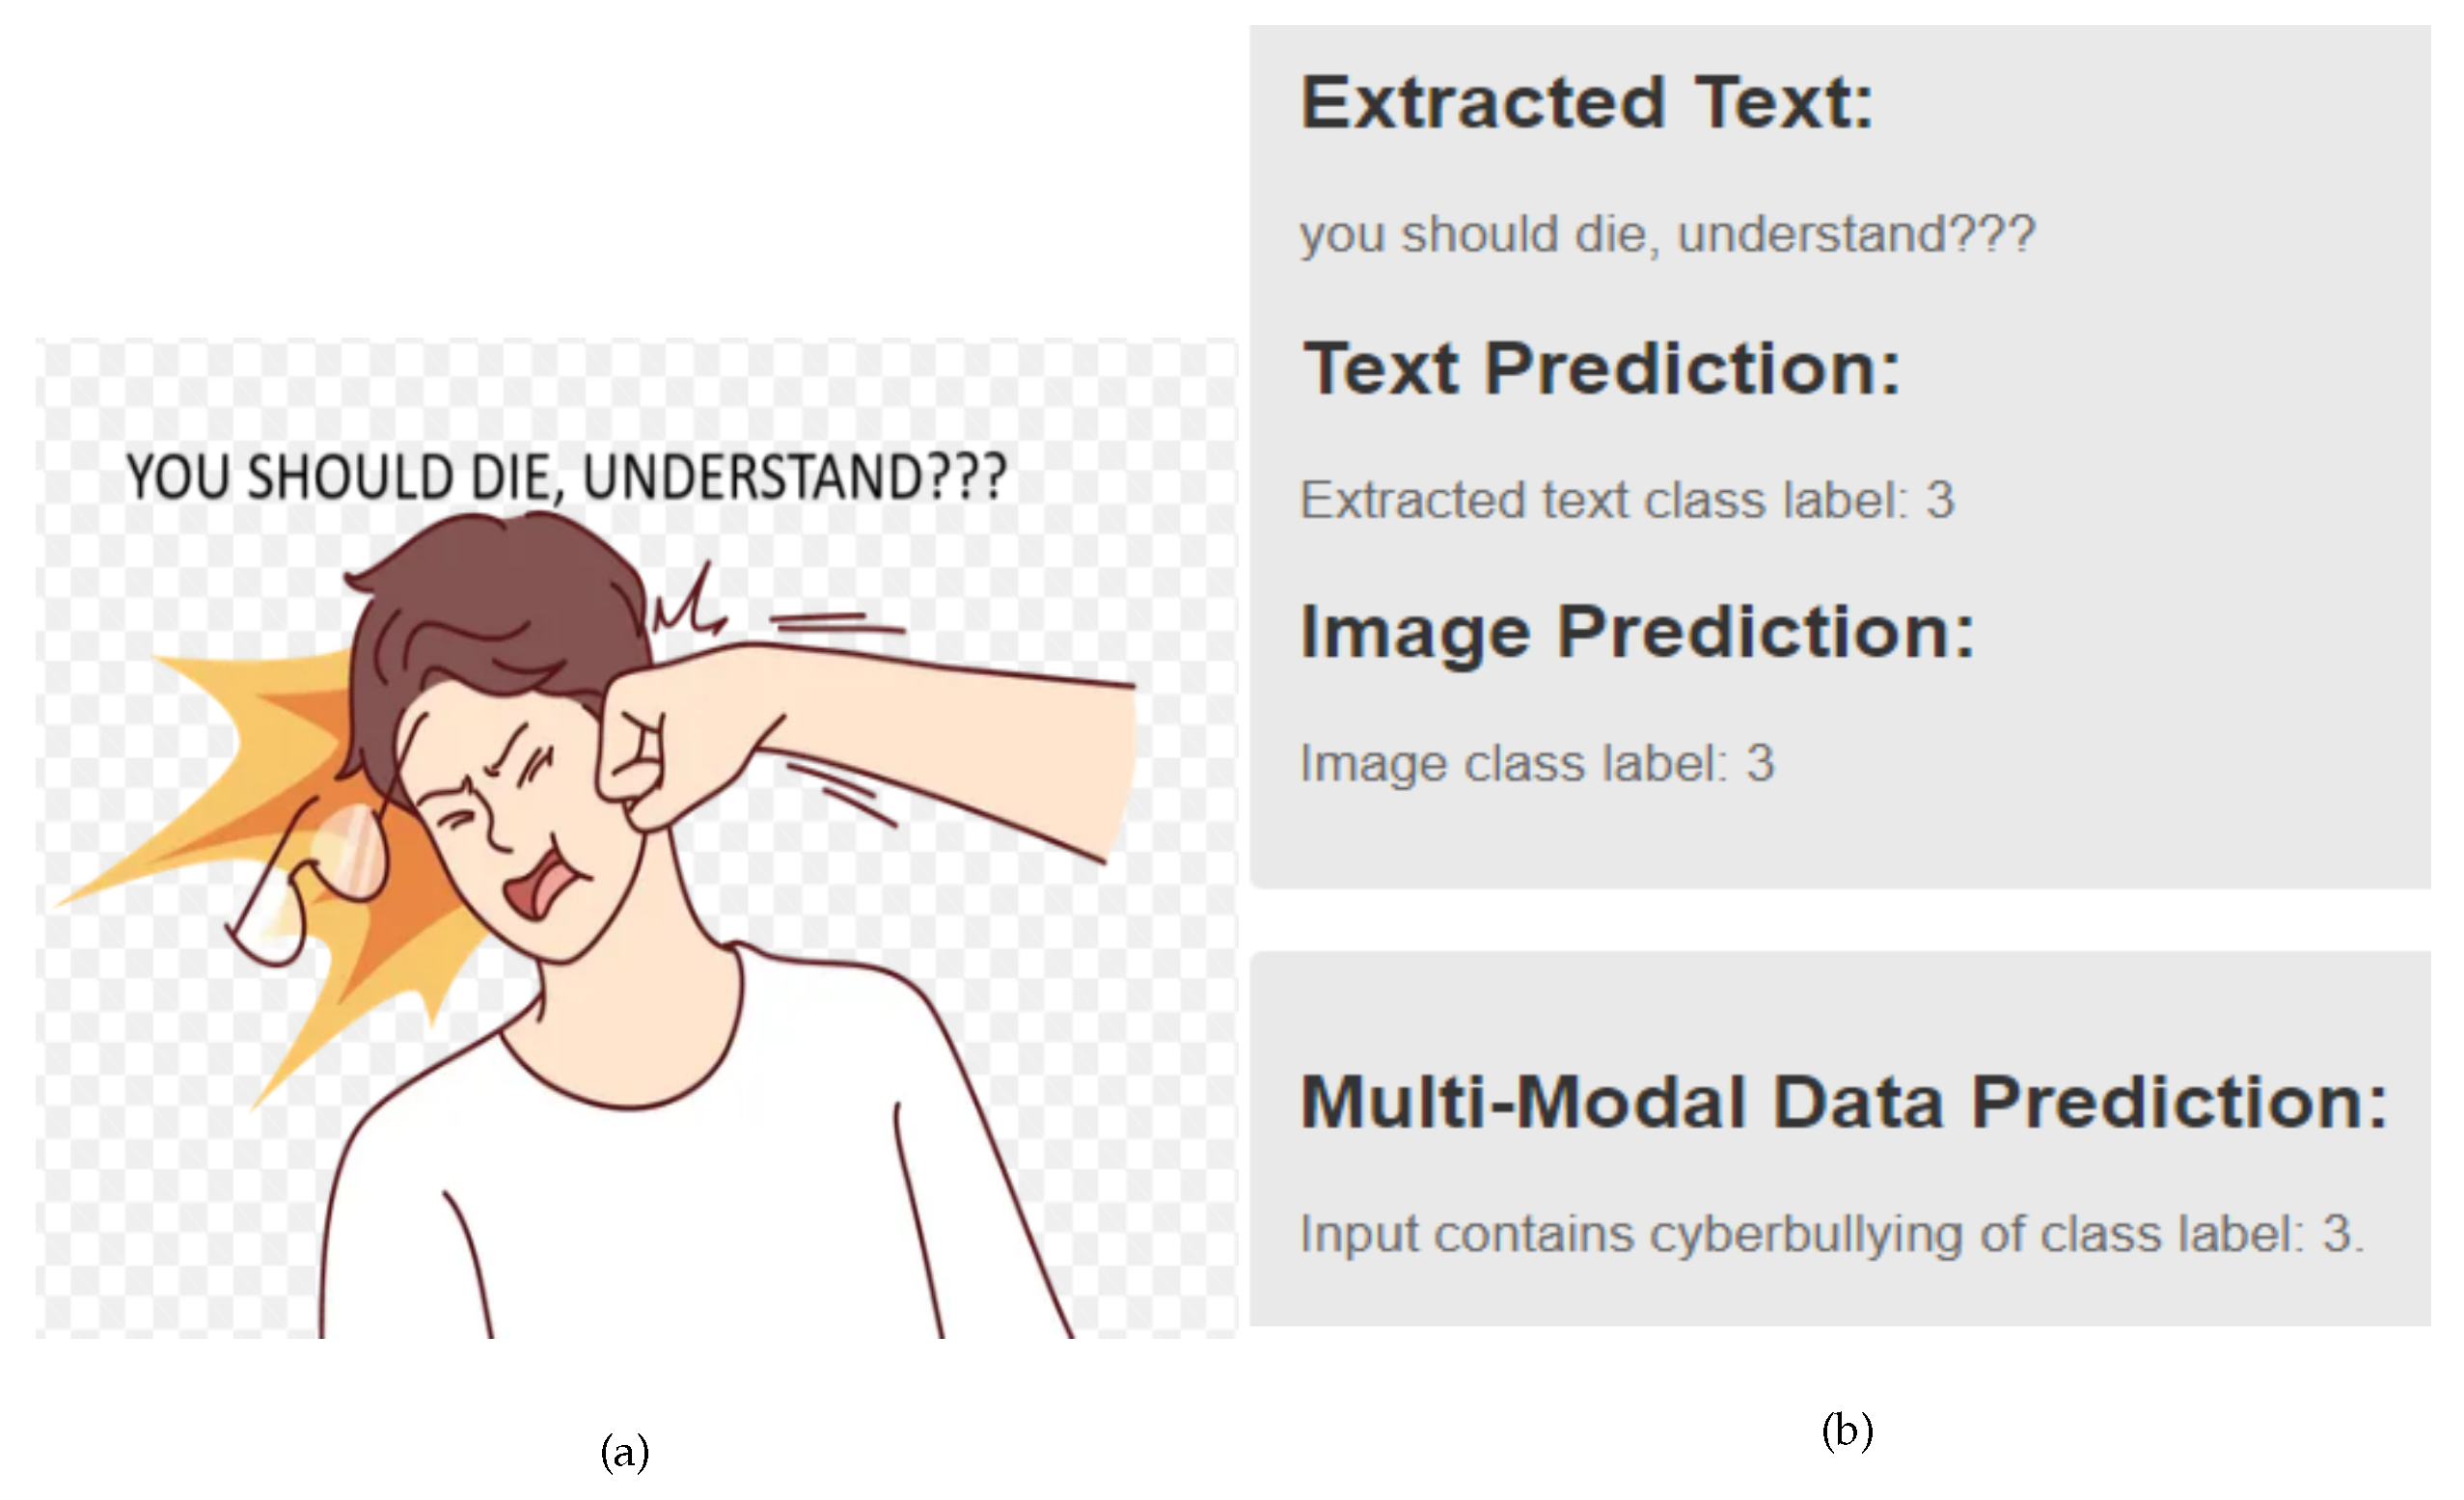
The multi-modal data displayed in
Figure 24a were analyzed in the GUI to evaluate aggression-related content. The image, depicting an individual punching another person, was identified as demonstrating aggressive behavior linked to cyberbullying and was classified as class 3 (aggressive). Similarly, the accompanying text, which contained aggressive language indicative of bullying, was also assigned a label of class 3 (aggressive). The overall classification results are presented in
Figure 24b.
5. Discussion
The primary goal of this study was the multi-classification of cyberbullying content using multi-modal data. In this context, we compared our results with those of previous studies that focused on similar tasks, particularly in identifying non-bullying (class 0), defamatory (class 1), offensive (class 2), and aggressive (class 3) classes from textual and visual data. As summarized in
Table 7, our study achieved a significantly higher accuracy of 99.20% on the public dataset, surpassing the results from previous works.
Hamza et al. [
19] used the RexNeXT-152 model combined with Masked R-CNN and BERT on Dataset-1, focusing on the identification of hateful versus non-hateful content. Their model achieved an accuracy of 70.60%. In contrast, Maity et al. [
21] used a multi-task learning approach on Dataset-2, leveraging the BERT-GRU model for text and the ResNet model for images. They focused on multiple tasks, including sarcasm identification, sentiment analysis, and emotion recognition, achieving accuracies of 59.72% for text and 59.39% for images. Similarly, Yue et al. [
31] combined BERT and ResNet, achieving a combined accuracy of 64.35% on Dataset-2.
Aggarwal et al. [
32] took a different approach by using a cross-lingual language model for text processing and ConvNet with attention mechanisms for images. Their study focused on sarcasm detection, and they achieved accuracies of 63.83% for text and 62.91% for images. While their study provided valuable insights into the use of multi-modal data for cyberbullying detection, their accuracy rates were lower than those observed in our study.
One of the key factors contributing to the superior performance of our model lies in the combination of two distinct datasets, Dataset-1 and Dataset-2, which allowed us to significantly increase the size and diversity of the training data. The larger dataset enabled the models to better handle the classification of multiple content types, i.e., non-bullying (class 0), defamatory (class 1), offensive (class 2), and aggressive (class 3). In contrast, previous studies worked with smaller, single datasets, which likely limited their models’ ability to generalize across various cyberbullying content types. Furthermore, our choice of the hybrid RoBERTa+ViT model represents a significant advancement over the models used in previous works. By integrating RoBERTa for text processing and ViT for image analysis, we were able to leverage the strengths of both modalities more effectively. This hybrid approach enhanced the model’s ability to capture complex relationships between textual and visual information, thus improving overall accuracy and robustness.
Previous studies, such as those by Hamza et al. [
19] and Maity et al. [
21], used separate models for text and image data, but our hybrid architecture allowed for more seamless integration, making the model better suited for handling the multi-modal nature of cyberbullying content. Another contributing factor to our model’s success was the use of advanced techniques in pre-training and fine-tuning, which allowed the hybrid model to learn more nuanced features from the data. This approach not only improved accuracy but also enhanced the model’s adaptability to new, unseen data, which is essential for real-world applications where data may vary over time.
5.1. Limitations of This Research
While the results of this study are promising, there are several limitations that should be considered. Firstly, the private dataset used in this research is relatively small, containing only one thousand data points. This limited sample size may restrict the generalizability of the model to a broader range of content or contexts. Smaller datasets can also lead to overfitting, where the model may perform well on the training data but struggle to generalize to unseen data. Although our model achieved high accuracy on the available data, future research could benefit from collecting larger and more diverse datasets to ensure that the findings hold true across different populations or content types.
Secondly, the nature of the data itself presents a challenge. The dataset consists of short video comments, which are inherently noisy. These comments may include irrelevant information, slang, misspellings, or ambiguous language, all of which can reduce the quality of the data. While preprocessing techniques like noise removal were applied, there is a risk that some useful information or unusual data points, which could potentially contribute to better classification, may have been discarded. In particular, unique or outlier data points sometimes provide valuable insights that enhance model performance. Therefore, a more refined approach to noise filtering could improve the quality of the dataset without sacrificing important features.
5.2. Ethical Challenges and Responsibilities When Deploying Hybrid Models
Deploying a hybrid deep learning approach for cyberbullying classification involved significant ethical challenges and responsibilities. One ethical challenge was ensuring user privacy, as the model processed sensitive social media data, which could include personal information such as names, user details, and images. The responsibility was to safeguard user privacy by implementing strict data anonymization measures, such as removing names, user information, and user images before processing.
Another ethical challenge was encountered with imbalanced data, which caused the model to perform poorly for minority classes. Additionally, noisy or unrepresentative samples in the data reduced the model’s reliability and fairness. To address these issues, we applied techniques such as data augmentation and class balancing, including oversampling minority classes, to create a more balanced dataset.
A further ethical challenge occurred when the model misclassified content containing multiple classes, such as bullying and sexual threats, by failing to correctly label it as its original class. The responsibility is to implement multi-label classification to address this issue effectively, allowing the model to assign multiple labels to content where applicable. To tackle this, we will focus on multi-label classification, as outlined in
Section 6.1.
6. Conclusions
Cyberbullying on social media comes with serious consequences, leading to emotional distress, anxiety, depression, and even self-harm or suicide for victims. The anonymity and public nature of these social platforms make it easier for bullies to target individuals and amplify the impact. This makes addressing cyberbullying a critical issue. Deep learning (DL) models offer a promising solution to this problem by identifying and classifying harmful content across platforms, including text, images, and memes. By analyzing large datasets, these models can detect and classify various forms of cyberbullying. However, challenges remain in accurately identifying and classifying cyberbullying, particularly due to the lack of diverse and well-labeled datasets for multi-class classification. In this research, we utilized various DL models to classify cyberbullying into four classes (non-bullying, defamatory, offensive, and aggressive), using both public and private data collected from multiple social media platforms.
The experimental results demonstrated that hybrid DL models, including LSTM+ResNet, LSTM+CNN, BERT+ViT, LSTM+ViT, GRU+ResNet, GRU+CNN, GRU+ViT, BERT+ResNet, BERT+CNN, achieved varying degrees of success in classifying cyberbullying, with accuracies of 0.709, 0.729, 0.734, 0.723, 0.743, 0.748, 0.959, 0.979, 0.984, 0.966, 0.986, 0.991, 0.966, 0.986, and 0.992, respectively, on the public dataset. The RoBERTa+ViT model, in particular, achieved an accuracy of 0.961 and an F1-score of 0.961 on the private dataset, demonstrating strong performance in multi-class cyberbullying classification.
These findings highlight the potential of hybrid models, especially RoBERTa+ViT, in accurately detecting and classifying cyberbullying within multi-modal datasets. RoBERTa excels in processing text data, while ViT effectively analyzes images. Combined, these models provide a robust framework for identifying cyberbullying in complex content, like memes. The results of this research can inform policy development, encouraging the adoption of AI-based tools for detecting and classifying cyberbullying on social media platforms. These tools could lead to more effective content moderation, timely interventions, and reduced exposure to harmful content. Additionally, social media companies can enhance their content moderation systems using these insights, enabling them to proactively filter harmful content and improve user support.
6.1. Future Work
As directions for future work, the following research initiatives will be taken into consideration:
Implementing multi-label classification to enhance the realism of the analysis. This approach will allow a single comment containing both aggressive and bullying content to be classified under both categories simultaneously, offering a more comprehensive representation of the data.
Expanding the scope of this study to include multilingual and culturally diverse datasets. While this study focused exclusively on English language data, future research will incorporate languages such as Bengali, Hindi, Urdu, and Norwegian for multi-class classification of multi-modal data to make the model more robust and applicable globally.
Integrating additional data types, including stickers, voice messages, videos, and GIFs, into the existing dataset. This will enable the classification system to handle diverse content types commonly found in social media comment sections, thereby improving its robustness and applicability.
In this work, we focused only on the model’s performance and technical implementation. However, we recognize the importance of addressing how non-technical stakeholders can understand and trust the model’s decisions. So, in future work, we will explore approaches to interpretability, such as explainable AI techniques (e.g., SHAP or LIME) and visualizations tailored for non-technical users.
Exploring advanced models such as Swin (Shifted Window) transformers, multi-scale vision transformers, and BLIP-V2 (Bootstrapping Language Image Pre-training Version 2) to further enhance classification performance.


