Brief Report

An Electricity Sale Package Recommendation Method Based on Prospect Strengths and Weaknesses Degree and Choquet Integral

School of Information Science and Engineering, Zhejiang Sci-Tech University, Hangzhou 310018, China
*
Author to whom correspondence should be addressed.
Appl. Sci. 2024, 14(24), 11905; https://doi.org/10.3390/app142411905
Submission received: 19 October 2024 / Revised: 11 December 2024 / Accepted: 17 December 2024 / Published: 19 December 2024

Abstract

:
Given that existing methods for recommending electricity sale packages primarily consider scenarios where customers are familiar with all package attributes, they overlook psychological factors, attribute correlations, and the determination of attribute weights during decision-making. To address these limitations, this paper proposes a recommendation method for electricity sale package based on prospect strengths and weaknesses degree and the Choquet integral. The details are as follows: Firstly, a label system for evaluating electricity sale packages and customer clustering is utilized to identify similar customers to a new customer. Secondly, a set of similar customers is identified, and N similar customers are selected as experimental customers. Their decision-making information is aggregated using the Choquet integral to construct a customer group decision-making matrix. Next, to account for customers’ psychological risk preferences, the Prospect Theory is integrated into the preference difference function of the classical Superiority–Inferiority Ranking method, resulting in the degree of prospect strengths and weaknesses. Building on this, and addressing the challenges of attribute correlation and weight determination, a model is constructed using the Choquet integral and comprehensive attribute weights. This model ranks electricity sale packages based on the degree of prospect strengths and weaknesses, capturing the differences between various schemes through the prospect strengths and weaknesses flow. The ranking of packages for recommendation is then derived from this flow. Finally, a case analysis is conducted with customers in a western Zhejiang region in China to verify the accuracy and effectiveness of the proposed recommendation method.

1. Introduction

The “Several Opinions on Further Deepening the Reform of the Electric Power System”, jointly issued by the Central Committee of the Communist Party of China and the State Council [1] (No. 9, 2015), has initiated a new wave of electricity system reform in China. This reform marks the commencement of a fresh round of electricity market reforms that have garnered widespread attention from various sectors of society. As a pivotal objective within the broader electricity system reform, the reform of the electricity sale side strives to foster market competition entities through diverse channels, empower customers with freedom of choice, and establish an electricity trading paradigm characterized by diverse entities and orderly competition [2]. This policy shift has not only invigorated competition within the electricity market, but has also imposed stricter service standards on electricity sale companies. Addressing how to scientifically guide these companies to enhance their operational proficiency, mitigate market risks, and augment revenues, thereby fostering the healthy and orderly development of the electricity sale market, is an urgent concern within the electricity industry [3]. To gain a competitive edge in this intense market landscape, electricity sale companies must elevate their refined service levels for customers and bolster customer satisfaction. As a crucial electric commodity, electricity sale packages have emerged as the central vehicle for electricity sale companies to provide services to customers. Consequently, it is of paramount importance for these companies to offer targeted electricity sale packages. Extracting valuable insights from vast amounts of customer behavior data, analyzing the diverse needs of electricity customers in real-time, and addressing the issue of information redundancy stemming from this abundance of data are all critical aspects related to the sales performance of electricity grid products.
Reform of foreign electricity markets was initiated comparatively early and has now matured into a relatively stable phase of development. As a trailblazer in electricity sale reform, the British electricity market has evolved into a sophisticated sale trading mechanism and regulatory framework. Fluctuations in primary energy prices have led to the gradual exit of some small-scale electricity retailers with limited risk resilience from the market [4]. British electricity sale packages primarily encompass two types, fixed and variable electricity prices, which are further influenced by pricing zones, time-of-use tariffs, and payment methods [5]. The Australian electricity sale market boasts a comprehensive sale package system. Herein, large consumers can negotiate sale rates with electricity providers [6]. For small commercial and residential customers, beyond standard electricity contracts (akin to guaranteed minimum sales contracts), electricity retailers also offer seasonal and flexible time-period pricing packages. Customers equipped with distributed photovoltaics can opt for solar power packages to receive higher feed-in tariffs, with corresponding value-added services encompassing integrated energy conservation, grid integration of distributed energy resources, and more [7]. The Texas electricity sale market in the United States commenced operations in 2002, with competitive electricity supply accounting for 75% of the state’s total load. Texas electricity sale packages are categorized into fixed-rate, variable-rate, and index-rate packages based on pricing models. Notably, fixed-rate packages hold an 87% market share, while index-rate packages constitute just 2% [8]. Although China’s electricity market reform started later, it has shown swift momentum. The synchronized advancement of electricity supply side reform alongside electricity pricing, trading system, and generation–consumption plan reforms constitute the pathway for China’s new electricity system reform round. Its objective is to open the electricity supply business to social capital and empower customers’ choice, thereby fostering a market structure of multiple buyers and sellers [2]. Over 6000 electricity retailers have applied for establishment in China, driving the thriving development of the country’s electricity sale market [3]. Reference [9] introduced China’s first personalized customization service platform, offering tailored packages to customers. The Kunming Electricity Trading Center, inspired by online e-commerce, launched the “Laitao Electricity Platform”. However, considering the current landscape and experiences from domestic and international electricity market developments, compared to large customers directly engaging in the wholesale electricity market, small-to-medium industrial, commercial, and residential customers with independent choice rights generally prefer purchasing electricity through retailers. To secure market share and sustained profitability, electricity retailers must offer tailored sale packages to electricity consumers. Given the vast customer base in the electricity market, effectively recommending suitable electricity sale packages has emerged as a pressing challenge for electricity retailers.
Existing electricity sale package recommendation methods can be broadly categorized into direct and indirect methods. Direct recommendation methods typically rely on straightforward weighted average calculations and are predominantly utilized on online recommendation platforms. These platforms, such as iSelect [6], Check24 [10], Power to Choose [11], Energy Made Easy [12], Entega [13], and Eprimo [14], recommend electricity sale packages with the lowest cost to customers based on their electricity consumption patterns. For instance, in Reference [15], a hierarchical clustering method for customers was proposed, utilizing differential feature extraction. Customers were clustered hierarchically according to their energy consumption levels and the variability of their electricity consumption behaviors, enabling targeted package recommendations to different customer segments. Additionally, a personalized electricity bill sale scheme recommendation system was introduced in Reference [16], leveraging customers’ electricity bill consumption characteristics, evaluation information, and preferences, along with machine learning techniques for recommendations. While direct recommendation methods are straightforward and easy to implement, they have limitations. Specifically, they primarily focus on minimizing electricity bill costs, neglecting the diverse behavioral characteristics, preferences, and evaluation attributes of customers, such as value-added services and the proportion of renewable energy.
On the other hand, indirect electricity sale package recommendation methods predominantly adopt a collaborative filtering (CF) framework, consisting of “customer feature extraction—similar customer identification—package score prediction—electricity sale package recommendation”. For instance, in Reference [17], collaborative filtering and utility recommendation algorithms were employed, utilizing the electricity customer similarity matrix and the comprehensive utility of electricity price packages. Addressing scalability and high-dimensional data sparsity in the big data market, Reference [18] proposed a recommendation mode based on bidirectional clustering and the Spark framework. Furthermore, Reference [19] analyzed the influence of factors like pricing methods, time-of-use prices, average prices, and the proportion of green electricity on package selection, introducing a recommendation method based on implicit package scores and customer portraits. Other studies have refined the collaborative filtering approach. In Reference [20], a customer feature subset screening algorithm was designed using weighted increasing item coverage, and the collaborative filtering algorithm was applied to predict scores for electricity sale packages within the selected feature subset. Considering customers’ preferences for various attributes, such as package capacity, electricity prices, and peak–valley electricity prices, Reference [21] proposed a hybrid electricity sale package recommendation method based on electricity customer characteristics and multi-attribute utility. Reference [16] utilized the fuzzy c-means clustering algorithm to classify customers, leveraging the similarity between the target customer and historical customers in the affiliated category, along with historical customers’ scores for electricity sale packages, to predict the target customer’s score. In Reference [22], household appliance usage time was considered as a residential customer’s energy consumption characteristic, and electricity sale packages were recommended based on similar customers’ package scores. Building on this, Reference [23] introduced a recommendation method based on Bayesian hybrid collaborative filtering, using the Bayesian probability matrix decomposition algorithm to handle missing usage data for some residential customer appliances, enhancing the practicality of the recommendation algorithm. Lastly, in Reference [24], a customer set matrix was established, employing the similar customer discrimination method of load characteristic labels and double-layer affinity propagation clustering. The study utilized the multi-granularity hesitant fuzzy language set and the differential weight model to quantify customers’ evaluation information on multiple package attributes, recommending the electricity sale package with the highest comprehensive satisfaction to the target customer.
However, despite considering customers’ electricity consumption costs, behavioral characteristics, and preferences, these indirect recommendation methods assume that customers are familiar with all package attributes, which is often unrealistic. Furthermore, they overlook psychological behavioral factors, such as risk-taking and avoidance psychology, which can influence customers’ subjective judgments. Additionally, the uncertainty of attribute correlations and attribute weights in the decision-making process remains unaddressed.
Therefore, given the limitations of both direct and indirect methods, the multi-attribute group decision-making (MADM) approach is considered for recommending electricity sale packages. Multi-attribute decision-making (MADM) constitutes a crucial component of modern decision science. The Prospect Theory effectively captures the psychological sentiments of experts when evaluating gains and losses in the decision-making process. Recently, the integration of the Prospect Theory with other MADM methods has emerged as a focal point of research in the field. For instance, in Reference [25], aiming to address the hybrid MADM problem with customers’ expectations, a decision analysis method based on Cumulative Prospect Theory was proposed, considering customers’ psychological behavioral factors. In Reference [26], addressing bounded rational behavior among customers, the Cumulative Prospect Theory and the VIKOR method were incorporated into Pythagorean hesitant fuzzy risk MADM. In Reference [27], the Hesitant Fuzzy Set-Prospect Theory evaluation method was utilized to compare evaluation index values across various scenarios, mitigating the impact of individual decisions on corporate emission reduction and determining the recommended emission reduction plan for energy. In Reference [28], a decision-making method based on the Prospect Theory was introduced for risk MADM problems involving customers’ expectations, where both probabilities and attribute values are interval numbers. In Reference [29], a MAGDM method grounded in a novel decision reference point and the Prospect Theory was proposed for scenarios where attribute index values are hesitant fuzzy information and where attribute weights are entirely unknown.
A review of the existing literature reveals various MADM methods rooted in the Superiority–Inferiority Ranking (SIR) method within the existing research landscape. For example, in Reference [30], considering the influence of diverse customers’ preferences on attribute weights, a variable-weight SIR method suitable for uncertain environments was introduced. In Reference [31], the POMETHEE method was extended, leading to the proposition of the SIR method, which establishes a superiority–inferiority matrix by directly comparing the magnitudes of scheme evaluation values and determines the partial or full ranking of all schemes through an appropriate multi-attribute information processing method. In Reference [32], the Hesitant Fuzzy Linguistic Term Set [33] was employed to describe customers’ linguistic preferences, expanding the application of the SIR method in uncertain language environments. Furthermore, the SIR method has been extensively applied and expanded in areas such as equipment supply [34], financial accounting [35], and enterprise management [36]. Therefore, incorporating the extended SIR method into the decision-making process for electricity sale packages is a prudent choice.
Moreover, the application of the Choquet integral is prevalent in MADM problems. Given the uncertainty and complexity of real-world decision-making environments, attributes may exhibit correlations, and the Choquet integral is predominantly used to address these inter-attribute correlations. For instance, in Reference [37], using the Choquet integral, the attribute correlation issue in the evaluation of innovation cooperation was analyzed, and a group decision-making method for ranking the superiority and inferiority of intuitionistic fuzzy sets based on the Choquet integral was proposed for partner selection. In Reference [38], targeting the coexistence of qualitative indicators and indicator interactions in multi-objective decision-making, the Fuzzy Grey Choquet Integral method was introduced, combining fuzzy measures, the Choquet integral, and gray relational degree with solutions derived through an intelligent algorithm. In Reference [39], addressing the hybrid MADM problem involving attribute interactions and exact numbers, interval gray numbers, intuitionistic fuzzy numbers, hesitant fuzzy numbers, and language variables as attribute values, a hybrid information gray relational decision-making method based on the two-additive Choquet integral was proposed. In Reference [40], for intuitionistic language MADM problems with attribute correlations, a multi-attribute group decision-making method of intuitionistic language TODIM based on the Choquet integral was introduced. In Reference [41], by incorporating the Choquet integral aggregation operator, a numerical issue in picture fuzzy MADM was resolved. In Reference [42], recognizing the prevalence of information fuzziness, attribute correlations, and individual preference differences in real-world MADM scenarios, an SIR MGDM method based on the Choquet integral and the Prospect Theory was proposed.
Considering the electricity sale package recommendation problem, customers are often unfamiliar with all packages and their attributes. Additionally, customers’ psychological behavioral factors and the uncertainty of objective information in the decision-making process are overlooked. By integrating the refined Prospect Theory, the extended SIR method, and the Choquet integral, an electricity sale package recommendation method is constructed. In summary, electricity sale companies urgently need to address the following challenges: improving the accuracy and efficiency of customer clustering, establishing and refining customer profiles, accurately depicting customer decision-making information, equalizing evaluation information across different granularities, enhancing the practicality and accuracy of electricity sale package recommendation algorithms, and precisely recommending electricity sale packages to customers.
For this reason, this paper proposes a new electricity sale package recommendation method—a recommendation method for electricity sale packages based on prospect strengths and weaknesses degree and the Choquet integral. The details are as follows: Firstly, a label system for evaluating electricity sale packages and customer clustering is utilized to identify similar customers to a new customer. Secondly, a set of similar customers is identified, and N similar customers are selected as experimental customers. Their decision-making information is aggregated using the Choquet integral to construct a customer group decision-making matrix. Next, to account for customers’ psychological risk preferences, the Prospect Theory is integrated into the preference difference function of the classical SIR method, resulting in the degree of prospect strengths and weaknesses. Building on this, and addressing the challenges of attribute correlation and weight determination, a model is constructed using Choquet integral and comprehensive attribute weights. This model ranks electricity sale packages based on the degree of prospect strengths and weaknesses, capturing the differences between various schemes through the prospect strengths and weaknesses flow. The ranking of packages for recommendation is then derived from this flow. Finally, a case analysis is conducted with customers in a western Zhejiang region in China to verify the accuracy and effectiveness of the proposed recommendation method.
In light of the aforementioned background and analysis, the objective of this paper is to refine the challenge of recommending electricity sale packages within the context of actual multi-attribute group decision-making into a coherent theoretical framework. The primary contributions of this paper are delineated as follows: In the comparison of electricity sale package schemes, this paper integrates the Prospect Theory into the calculation of the prospect strengths and weaknesses degree within the classical SIR method. This integration solves the limitation that Prospect Theory ignores the objective uncertainty of customers’ consumption habits and budget. Consequently, this approach facilitates a more nuanced portrayal of the distinctions among various electricity sale packages. Addressing the intricacies surrounding the correlations among electricity sale package attributes and the determination of their weights, this paper employs the Choquet integral to calculate the correlation coefficients of these attributes. Furthermore, leveraging the probabilistic language deviation function, it determines the attribute weights of electricity sale packages, thus elucidating the differences among the attributes of various packages.

2. Methods

2.1. Survey Location and Dates

The survey was conducted in the western Zhejiang region of China, as shown in Figure 1 below. The data were collected over a specific period, from 1 January 2022 to 31 January 2022, to ensure a comprehensive understanding of customer preferences and behaviors related to electricity sale packages.
The decision to use only one month of data was based on several considerations. Firstly, electricity consumption patterns within a single month can provide a snapshot of customer behavior and preferences that are relevant to the evaluation of electricity sale packages. Secondly, collecting data for a shorter duration allows for a more focused analysis, reducing the complexity and potential noise associated with longer-term data. Lastly, considering the practical constraints of time and resources, a one-month period was deemed sufficient to capture the essential information needed for this study while keeping the data collection process manageable. In addition, it should be noted that the main purpose of this paper is to propose a new method of recommending electricity sale packages, rather than to conduct an in-depth study of electricity consumption behavior over a long-time span. Therefore, one month’s data are sufficient to support the research purpose of this paper.

2.2. Multi-Attribute Customer Decision-Making System Establish

2.2.1. Establishment of Labeling System for Evaluation of Electricity Sale Packages

There are differences in the energy use and consumption habits of different types of customers, and the differences are reflected in the different results of different customers’ purchasing of electricity sales packages. In this paper, we will construct a customer’s portrait labeling system to reflect the customer’s electricity consumption characteristics and provide support for discriminating customers similar to the new customer’s portrait. In this paper, based on the load data of a certain month of the sample customer set U, the monthly load rate, monthly maximum utilization hours, average value of the peak and valley difference rate on weekdays and non-workdays, and the average value of the load rate in the peak and valley periods are used as the labeling [15] to establish customer profiles (refer to Appendix A) based on the following: different sets of finite electricity sale packages C as finite alternatives; different sets of decision information D as finite attribute set, where the decision information considered in this paper are tariffs, value-added services, incentive policies, the proportion of renewable energy sources, and whether or not it is a fixed package, etc.; and the weights of each attribute based on the different decision information are Q.

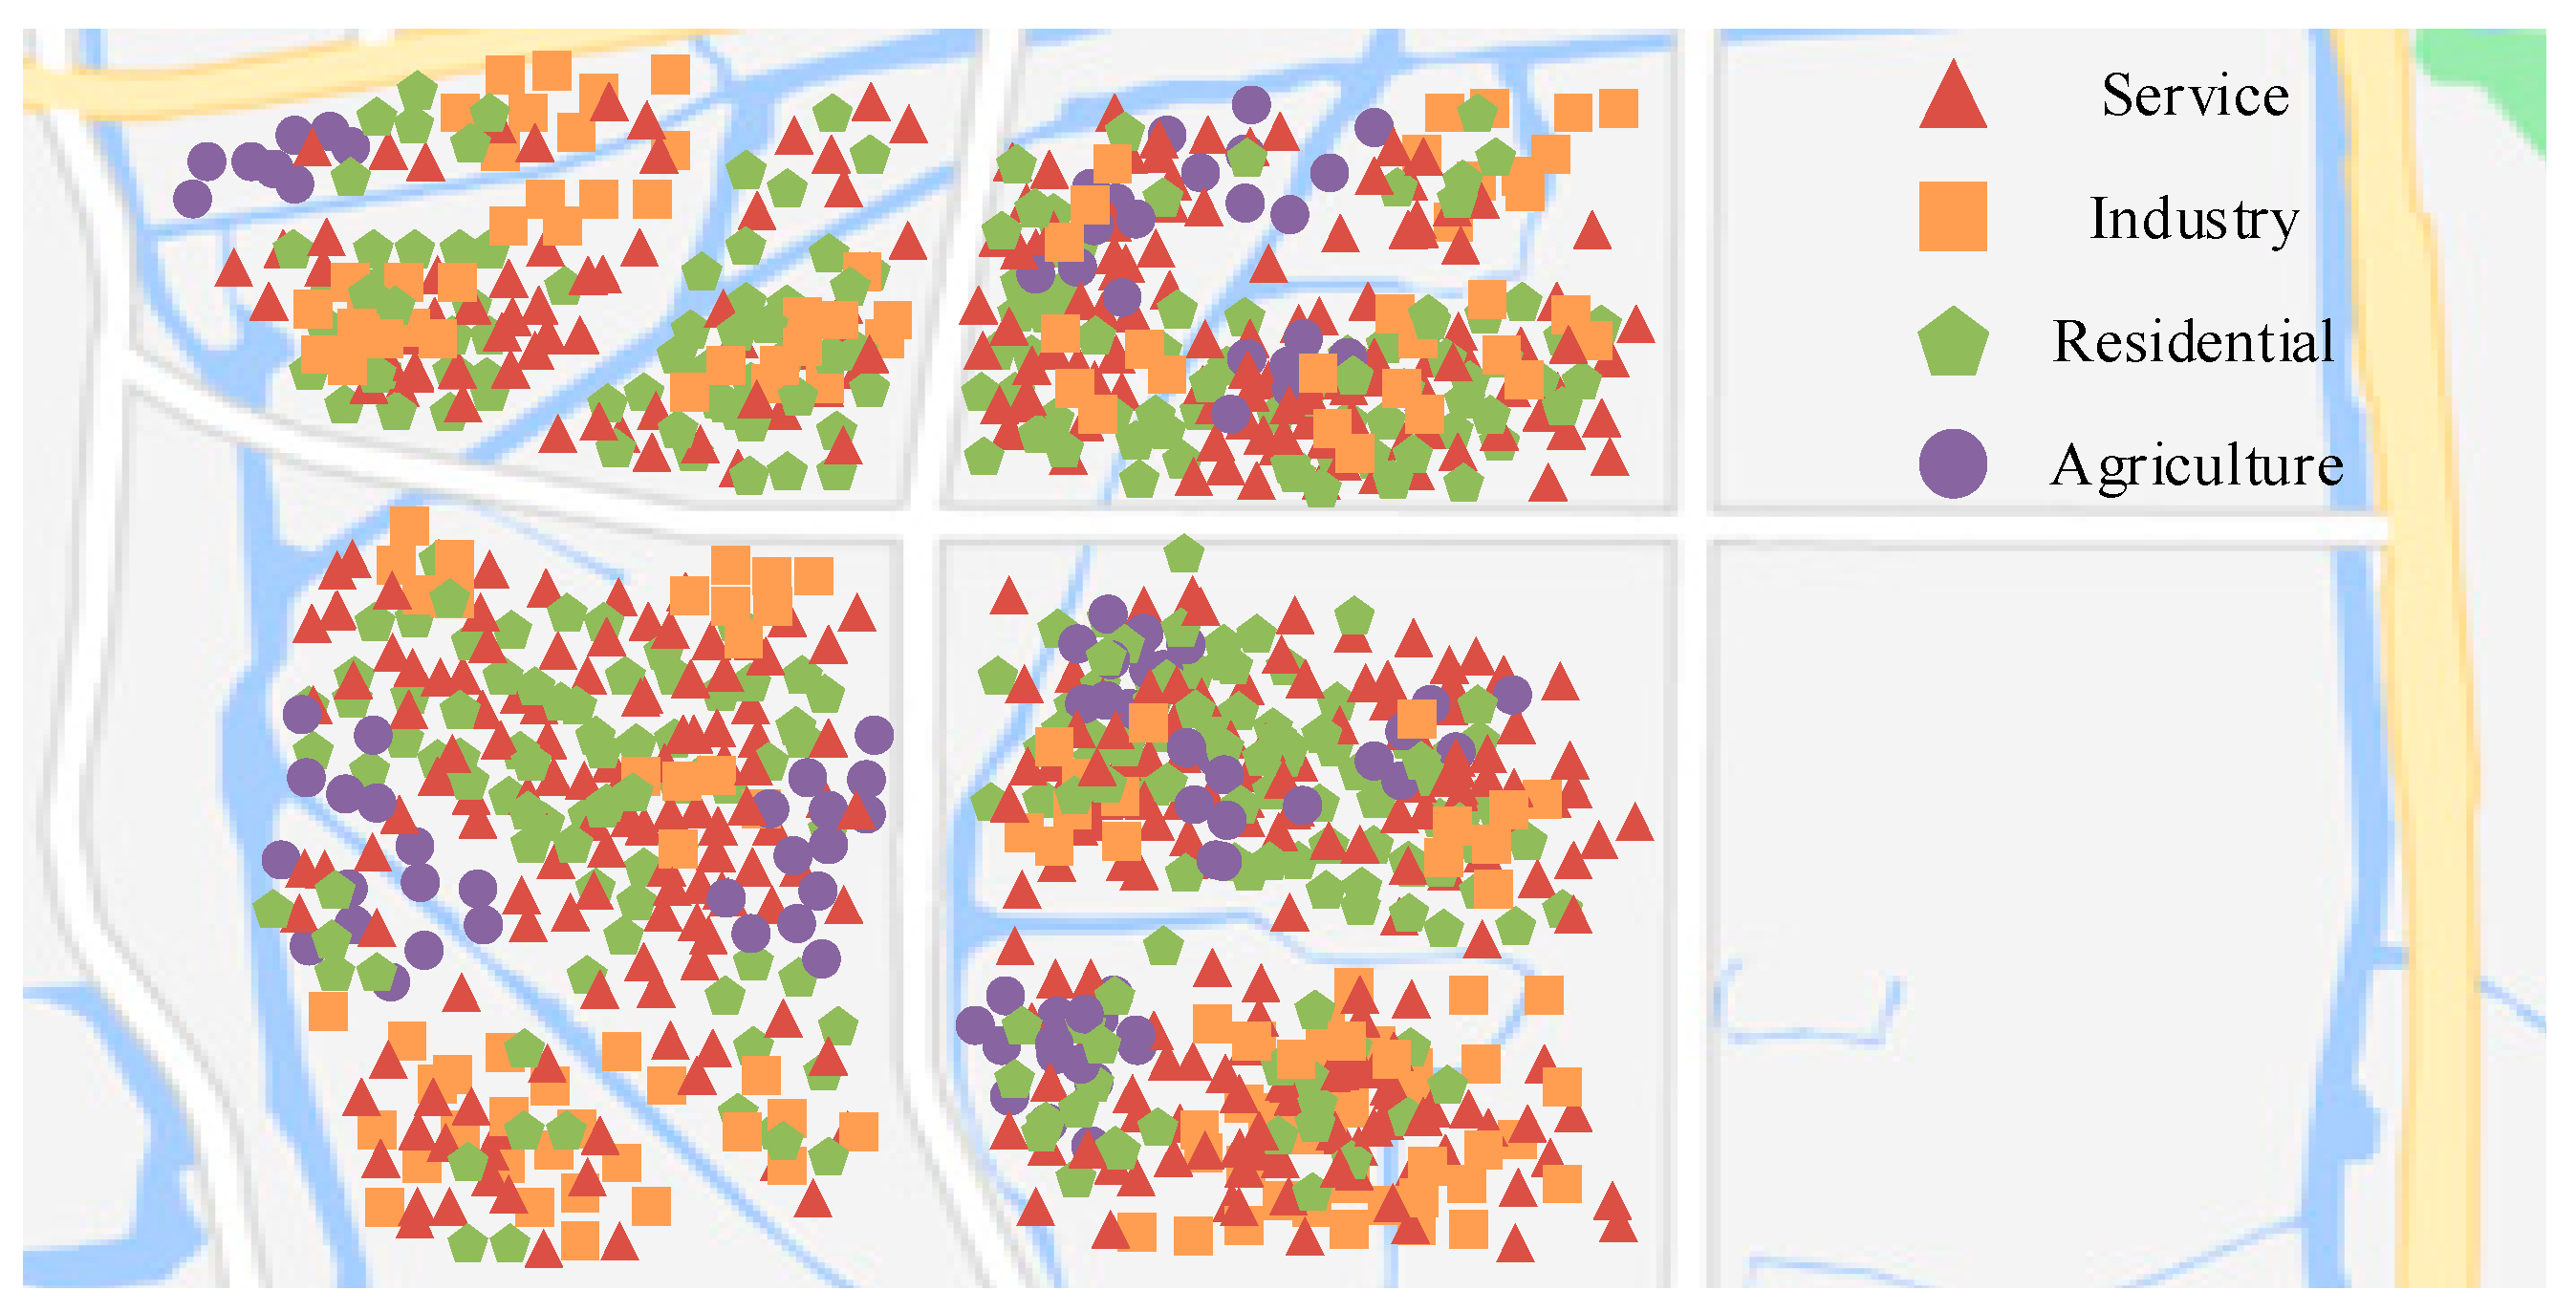
2.2.2. Sample Customer Clustering Division

Considering the large number of customers, customers with similar profiles must be clustered in order to reduce the computational effort [43]. The adaptive k-medoids algorithm with a variable number of clusters improves the traditional k-medoids algorithm, but its clustering results are greatly affected by the size of customers and the set self-similarity. For this reason, the BLAP clustering method is chosen in this paper [11]. In this paper, the BLAP clustering method is used, which firstly performs local partition AP clustering on the sample customer set U through the first layer of AP clustering so as to reduce the influence of customer size on the accuracy and efficiency of clustering. Then, the second layer of AP clustering is performed, and the cluster center set obtained from the first layer of clustering is subjected to adaptive AP clustering [44], which improves the accuracy of the clustering results and reduces the effect of the set customer self-similarity on the clustering results. The details of the BLAP clustering algorithm are referred to in Appendix B.
After the clustering division is completed, the similarity between the two key metrics of each customer is determined, s ρ U i , U j and the optimal number of clusters c*; the similarity is calculated by the following formula:
s ρ U i , U j = y = 1 7 b U i , y b ¯ U i b U j , y b ¯ U j y = 1 7 b U i , y b ¯ U i 2 y = 1 7 b U j , y b ¯ U j 2 i j  
where b U i , y and b U j , y are the yth image tag of Ui and Uj, respectively; and b ¯ U I and b ¯ U j are the mean value of image tags of Ui and Uj, respectively.
The optimal number of clusters, denoted as c*, is a crucial parameter in clustering analysis as it determines the level of granularity in the data segmentation. This number is not arbitrarily chosen, but is calculated using a specific methodology. The optimal number of clusters c* is calculated as follows, typically involving a combination of statistical measures and algorithmic processes. By determining the optimal number of clusters, researchers can ensure that the resulting segmentation is both meaningful and useful for subsequent analysis. Selecting the right number of clusters is essential for drawing accurate conclusions from the data and avoiding overfitting or underfitting in the clustering process:
c * = arg max Q Z Q , a v
where Z Q , a v is the clustering quality index for different pairs of clusters and the cluster number corresponding to the maximum of Z Q , a v is the optimal number of clusters c*.

2.3. Prospect Strengths and Weaknesses Degree and Choquet Integral Solution Methods

2.3.1. Prospect Theory and the SIR Method

Synthesizing the results of a large number of experiments, it can be seen that the variable environmental factors will produce different degrees of interference to the customer’s decision-making, and the customer’s decision-making is not completely rational. In order to accurately reflect the irrational psychology of the customer’s decision-making process, Kahneman and Tversky [45] used the value function and the weight function to represent the utility and probability in the expected utility, and proposed the Prospect Theory for representing the psychological characteristics of risk preference and aversion. Prospect Theory is an analytical theory used to describe the psychological behavior of customers under different conditions. According to Prospect Theory, the criterion that customers judge in the decision-making process is the prospect value of an alternative determined by the prospect value function and the psychological weight function. Among other things, the prospect value function describes how people assess the value of gaining or losing something. The expression of the prospect value function v Δ x is [31]:
v Δ x = Δ x α , Δ x 0 θ Δ x β , Δ x < 0
where Δ x is the positive or negative deviation between the decision value and the reference point; α and β   ( 0 < α , β < 1 ) are the risk attitude coefficients; and θ ( θ > 1 ) is the loss aversion coefficient, with the larger the value, the higher the risk aversion of the customer.
The mental weighting function ω ( p ) serves as a crucial tool in understanding how individuals assign weights to different probabilistic events. This function is essential in capturing the subjective perception of risk and uncertainty that people hold. It is calculated as follows, based on established methodologies outlined in the literature [31]. By utilizing this function, researchers can gain insight into how people evaluate the likelihood and consequences of various outcomes, which in turn can influence their decision-making processes. Understanding the mental weighting function is thus critical for predicting and explaining human behavior in situations involving uncertainty.
ω + p = p ξ p ξ + 1 p ξ 1 ξ ω p = p δ p δ + 1 p δ 1 δ
where ω + ( p ) and ω ( p ) are nonlinear weighting functions for gains and losses; p is the associated probability of occurrence; and ξ and δ are the risk attitude coefficients for gains and losses, respectively.
In summary, it can be seen that the prospect value function portrays the subjective judgment of the customer’s decision-making, and the existing related studies have failed to compare the programs directly. If the objective factors can be considered comprehensively in the Prospect Theory and a function can be drawn to compare the two programs, it will be more in line with the real decision-making situation.
In the ranking method of portraying the two-by-two differences in programs, some studies will use the classical SIR method [46]. The SIR method, i.e., Superiority–Inferiority Ranking method, constructs a clear strengths and weaknesses matrix by directly comparing the high and low values of each program. With the help of scientific multi-attribute information comprehensive processing technology, the SIR method can accurately calculate the strength and weakness flow of each program. Based on the results of these analyses, we can partially or fully determine the ranking of all options.

2.3.2. Comprehensive Prospect Strengths and Weaknesses Degree

By portraying the differences between the Prospect Theory and the SIR method in the previous subsection, the prospect value function and the psychological weight function of the Prospect Theory are introduced to extend the classical SIR method, and the related methods are introduced into the recommendation of electricity sale packages. To summarize, in the actual decision-making process, the customer needs to judge the strengths and weaknesses of a certain electricity sale package compared with other electricity sale packages under each decision-making information, but the ordering of electricity sale packages under different decision-making information is not the same, and it needs to be combined with the corresponding ordering formula in order to arrive at the final ordering of electricity sale packages. The classical SIR method involves the use of the preference difference function to measure the advantages and disadvantages of an electricity sale package under each piece of decision information compared with other programs, and then weigh the decision information weight value to the advantages and disadvantages, and then the preference difference function can be defined independently. To this end, the prospect value function v Δ x is expanded by replacing the comparison between the electricity sale package and the expected reference point (positive and negative ideal points) with a two-by-two comparison with the electricity sale package and utilizing the probabilistic linguistic deviation function to carve out the difference values between the electricity sale packages; the weighted psychological weighting function ω ( p ) is used, and then the resultant function is defined as a preference difference function in the SIR method, in order to come up with a new degree of strengths and weaknesses that can take into account the customers’ risk preference. The calculation formula is called prospect strengths and weaknesses degree. This innovation is a good solution to the problem of the subjectivity of customers in making decisions on electricity sale packages.
To this end, we refer to the labeling system for evaluating electricity sale packages established in Section 2.2, and set U = u 1 , u 2 , , u l k = 1 , 2 , , l as a finite set of customer sets, C = c 1 , c 2 , , c m i = 1 , 2 , , m as a finite set of electricity sale packages, D = d 1 , d 2 , , d n j = 1 , 2 , , n as a finite set of decision information, and Q = q 1 , q 2 , , q n as the subjective weights of each decision information. Customer uk makes an evaluation matrix H k = h k i j m * n of different electricity sale packages using probabilistic language under decision information dj, where h k i j = < L k i j p k i j > denotes the probabilistic language evaluation of electricity sale package ci by customer uk under decision information dj. When considering group decision-making, it is necessary to assemble the decision information of each customer. The Choquet integral described in the previous section is often used to determine the relevance of each piece of decision information, and the degree of correlation is solved by calculating the correlation coefficient.
When dealing with non-negative functions in the context of electricity sale packages, we often encounter the need to define these functions in relation to a specific measure. Specifically, if f is a non-negative function defined on the set C of electricity sale packages, it becomes necessary to establish its relationship with a fuzzy measure u within the framework of the Choquet integral. Therefore, f, with respect to the fuzzy measure u of the Choquet integral, can be defined as follows:
f d μ = i = 1 n f c i μ U i μ U i + 1
where 0 f c 1 f c n , U i = c I , , c n , and U n + 1 = .
Since the individual Choquet integral only considers the correlation of each decision information and ignores the correlation between customers, a Choquet integral operator is proposed: the appendix calculates all subset fuzzy measures u of the customer set by each customer weight, and the Choquet integral operator of (2) is applied to assemble the decision information later. In this paper, we use Reference [47]’s formula to assemble the probabilistic linguistic information of each customer.
H i j = E μ h 1 j , h 2 j , , h k j = l = 1 k L l p μ U l μ U l , 1 = L 1 p μ U 1 μ U 2 L 2 p μ U 2 μ U 3 L k p μ U 4 = g 1 ( η l L l l = 1 k η l l = 1 k p l μ U l μ U l , 2 )
where L 1 p L 2 p L k p , u(U) is the fuzzy measure of the subset of decision maker set, and, U l = l , l + 1 , , k , U k + 1 = , g 1 ( ) are the conversion functions of linguistic terms and their affiliation.
In the process of customer decision matrix standardization, to ensure that all the language term sets under each decision information have the same length. In this paper, the maximum set of linguistic terms is added repeatedly, and the probability of all added linguistic elements is 0. The standardized customer group decision matrix is defined as H k = h k i j m * n . At the same time, in order to eliminate the influence of the psychological factors of customers in the decision-making process, the SIR method is introduced considering the two-by-two comparisons between electricity sale packages, so the prospect value function can be rewritten as follows:
v + d L i j p , L t j p = 0 , o t h e r d L i j p , L t j p α , L i j p > L t j p v d L i j p , L t j p = 0 , o t h e r θ d L i j p , L t j p p , L i j p > L t j p
In this formula, I , t = 1 , 2 , , m , i t , j = 1 , 2 , , n , and 0 < α , β < 1 denote the risk preference coefficients of an individual facing gains and losses, respectively.
Combined with the Prospect Theory, the customer’s mental weight function offers a comprehensive framework for understanding how individuals evaluate potential gains and losses. The Prospect Theory, which was developed to explain human decision-making under risk, suggests that people perceive gains and losses differently and are often more sensitive to changes near reference points. The customer’s mental weight function, as defined in this context, can be specified as follows:
κ + p i = p j η p j η + 1 p j η 1 η κ p i = p j δ p j δ + 1 p j δ 1 δ
Among them, η and δ denote the individual risk appetite and aversion coefficients, respectively. Regarding the research question “How Customers’ Psychological Risk Preference Influence the Recommendation Accuracy of Electricity sale packages”, we present a line chart that illustrates the trend in recommendation accuracy as risk preference values change. In this illustrative case, as customers’ risk preference shifts from extreme aversion to neutrality and then to preference, the recommendation accuracy initially increases and subsequently decreases. This finding suggests that risk-neutral customers may exhibit a higher propensity to accept the recommended electricity sale package.
Furthermore, as shown in Figure 2, we conduct a detailed analysis to explore the impact of various risk preference values on recommendation accuracy. Through this analysis, we aim to identify the specific range of risk preference values that are most sensitive to changes in recommendation accuracy. This information will be instrumental in refining our recommendation strategy for electricity sale packages, enabling us to tailor our approach to better meet the needs and preferences of different customer groups.
The final Prospect Strengths and Weaknesses Degree Formula was adopted from the Reference [45]. The definition is as follows:
S j c i = t = 1 m P j c t , c t = t = 1 m ν + d L i j p , L i j p κ + p j I j c i = t = 1 m P j c t , c = t = 1 m ν d L i j p , L i j p κ p j
By utilizing this formula, customers can gain a better understanding of the potential risks and rewards associated with a given project or venture, enabling them to make more informed decisions. Finally, the combined prospect strengths matrix, S = (Sj(xi)) and the combined prospect weaknesses matrix, I = (Ij(xi)) for the xi scenario are determined, thus determining the prospect strengths and weaknesses matrix.

2.3.3. Choquet Integral

The matrix of prospect strengths and weaknesses mentioned above considers the psychological factors of customers and solves the problem of customer subjectivity, but in the actual customer decision-making process, the uncertainty of objective information still needs to be considered. The uncertainty of objective information includes the correlation problem between decision-making information and the weighting problem, in which the correlation problem between decision-making information also further affects its weighting problem. As a result, a mathematical tool is needed to solve the correlation problem and the weighting problem among decision-making information.
As a mathematical tool commonly used in fuzzy set theory with the ability to deal with the interrelationships and importance of elements, the Choquet integral has demonstrated its superiority in many fields such as classification and decision support. The Choquet integral obtains a more accurate numerical representation by introducing a nonlinear weighting function to order and weigh the elements in a fuzzy set and sum them up. This feature makes the Choquet integral better able to capture the intrinsic features of the data when dealing with complex and fuzzy datasets, and also provides a new way of thinking for the recommendation of electricity sale packages.
First, according to the application of Choquet’s integral theory in existing studies [15], let μ λ D be the fuzzy measure λ of the decision information set D, as follows:
μ λ D = 1 λ [ C j C 1 + λ μ λ D j 1 ] , λ 0 C j C λ μ λ D j , λ = 0
where μ λ D j is the decision information set D subset of the fuzzy measure and λ > 1 . If λ = 0 , the decision information is independent of each other; if λ > 0 , the decision information has a complementary correlation; if 1 < λ < 0 , the decision information has a redundant correlation. For any subset of decision information set Dj, the value of λ can be calculated as follows:
μ λ D j = 1 λ [ D j C 1 + λ μ λ D j 1 ]
Referring to the idea of ascending order of Choquet’s integral, the degree of prospect strengths and weaknesses described in the previous section are then ranked as follows:
0 S 1 c i S 2 c i S n c i , 0 I 1 c i < I 2 c i < I n c i .
Therefore, based on the fuzzy measurements with reference to the requested decision information set, the prospect strengths and weaknesses flow is defined as follows:
φ > c i = j = 1 n S j c i μ D j μ D j + 1
φ < c i = j = 1 n I j c i μ D j μ D j + 1 ,
where D j = D I , D i + 1 , , D n and Cn+1 = 0.
From the classical SIR method, it can be observed that the ranking of electricity sale packages can be determined through the required prospect strengths and weaknesses flows, and, according to the ranking rule of SIR [48], the electricity sale packages are ranked.

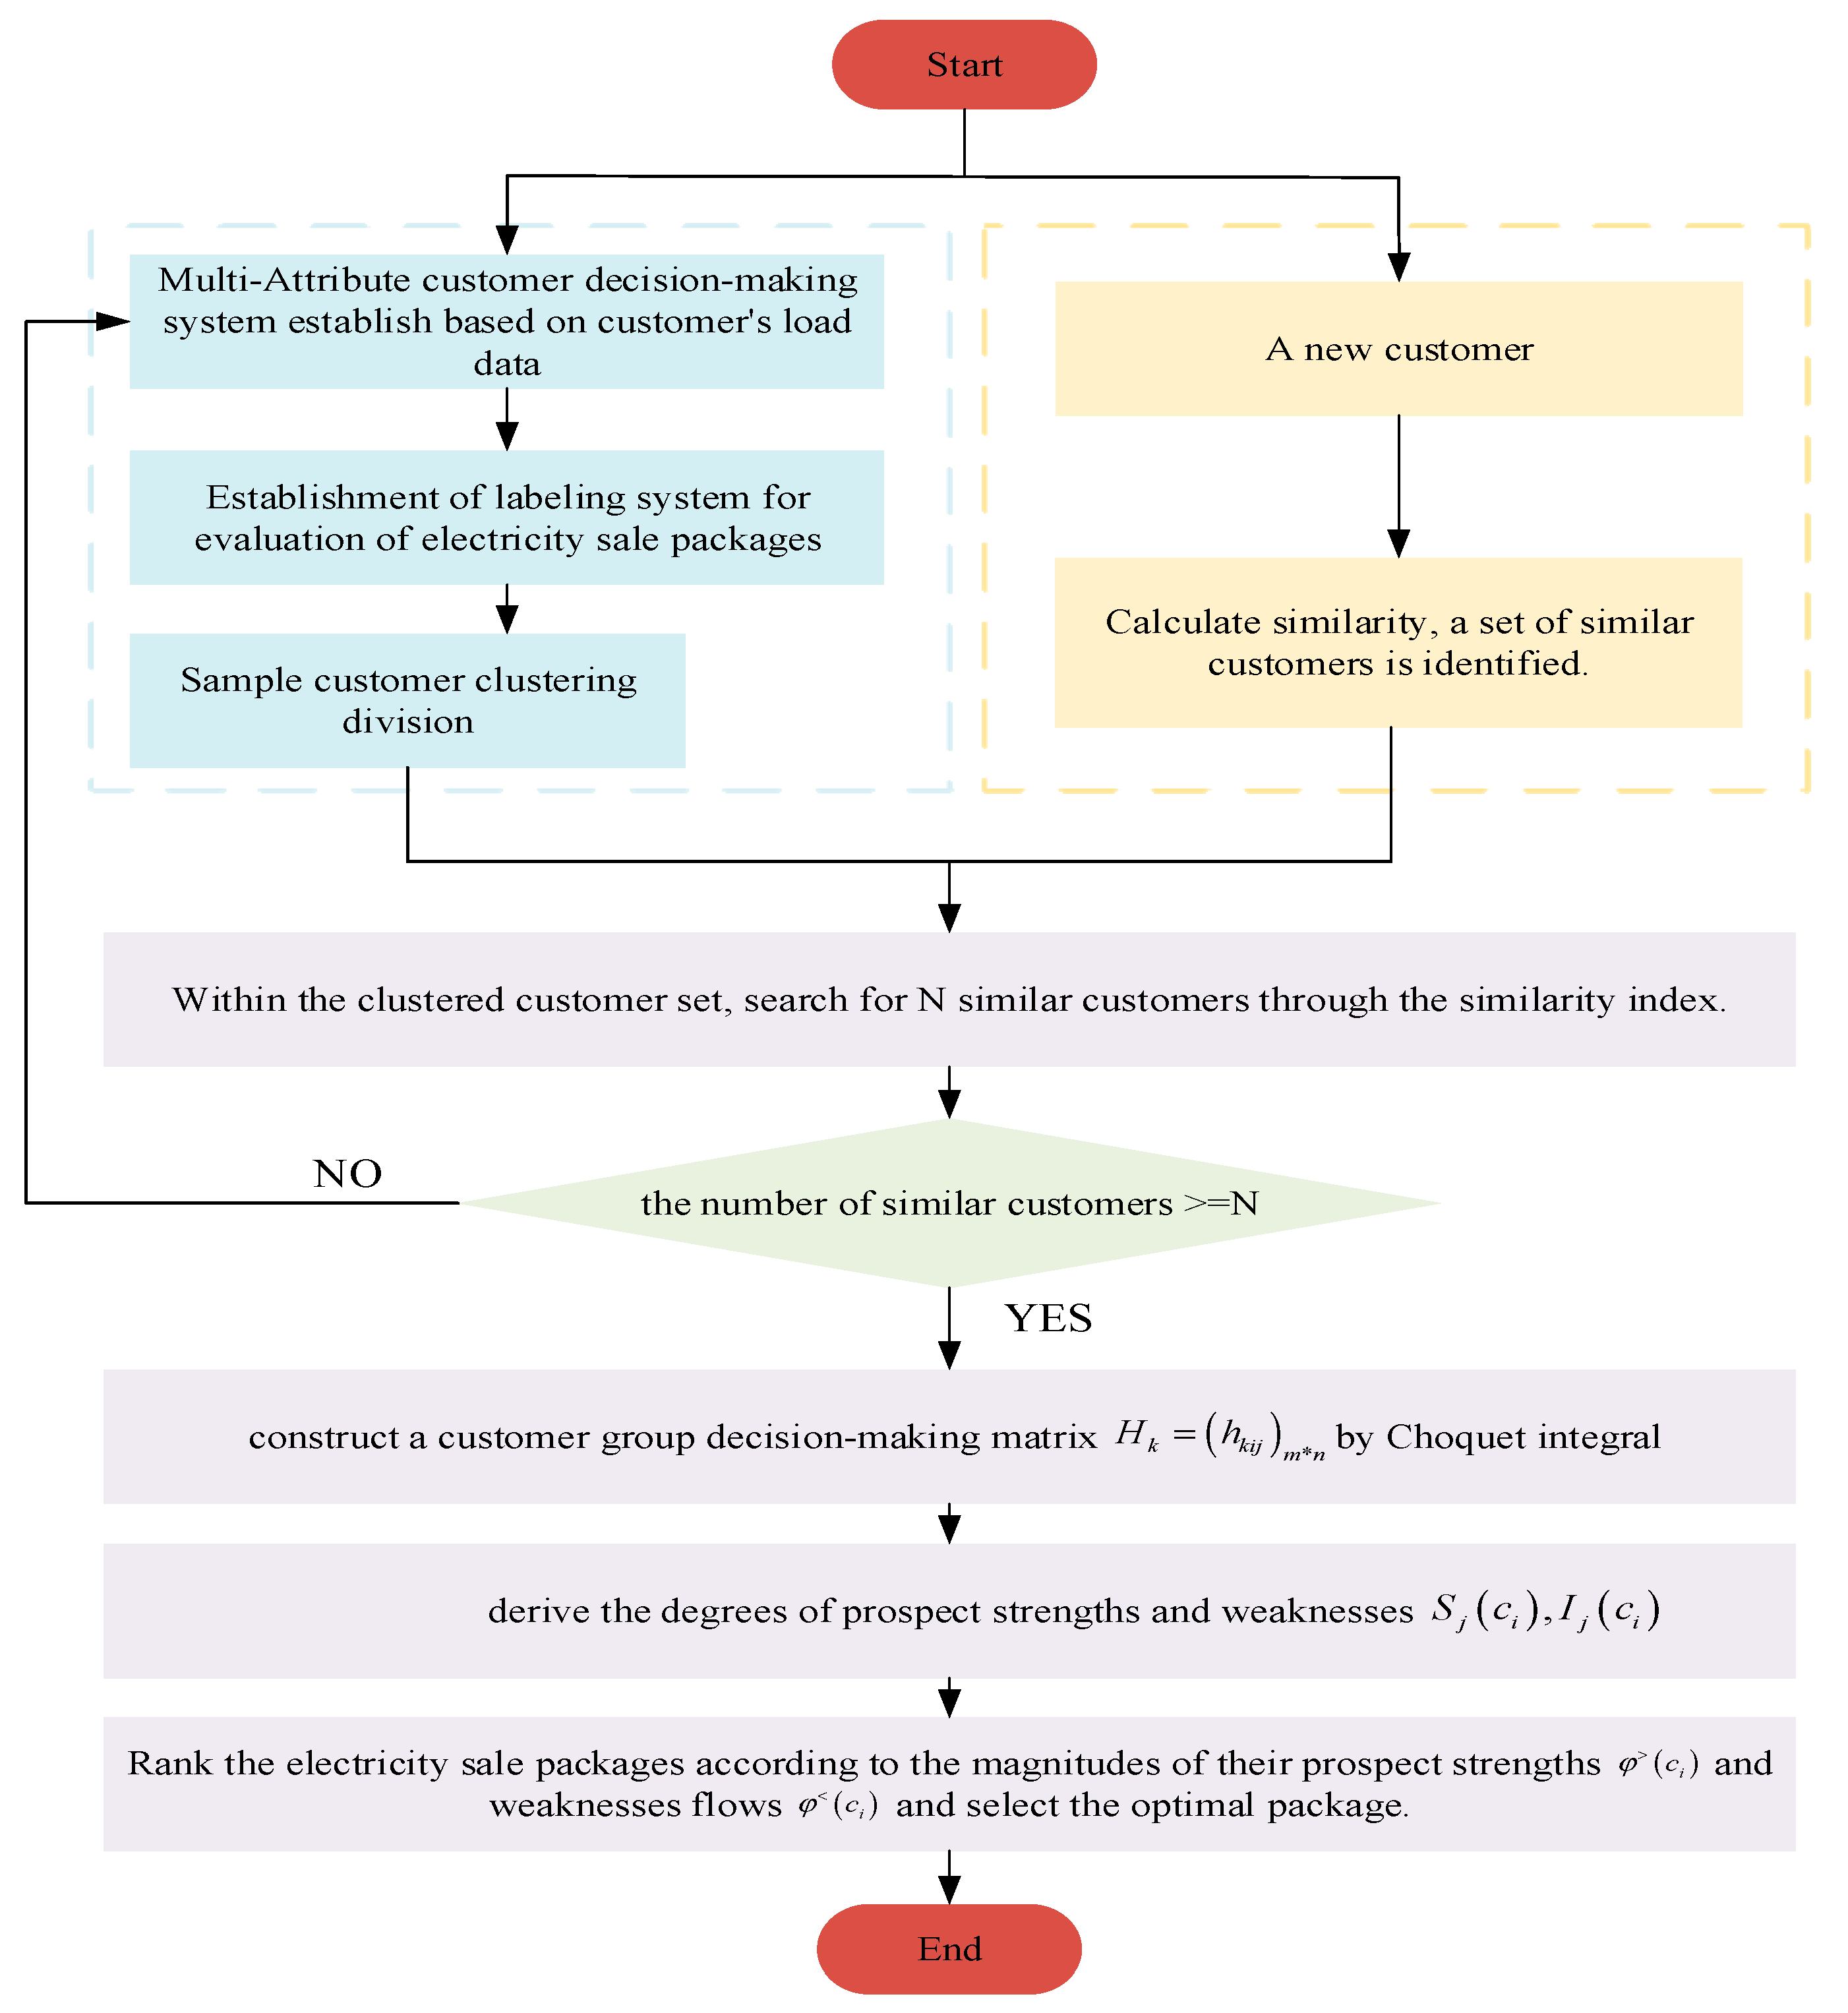
2.4. A Recommendation Method for Electricity Sale Package Based on Prospect Strengths and Weaknesses Degree and the Choquet Integral

2.4.1. New Customer Similarity Determination

The recommendation of packages by the electricity sale company needs to be handled differently for different customers. Firstly, to identify the similar customers from new customers; then, to assemble the evaluation matrix of similar customers’ electricity sale packages and to calculate the strengths and weaknesses of electricity sale packages through Choquet points and prospect strengths and weaknesses; and, finally, to give the order of electricity sale packages.
Based on the optimal clustering results obtained from Formula (2) in Section 2.2, similar customers from new customers can be discriminated using Formula (1). Let the set of new customers be W = { W 1 , W 2 , , W n , , W m } , where W n is the nth new customer and M is the total number of new customers, based on the portrait m W n of each new customer W n . The distance between each clustering center and m W n under the optimal clustering number c* is calculated with reference to probabilistic language [48], and the N customers with similar distances are selected to be judged as the similar customers of the new customer W n . It should be noted that the monthly load data of the new customer is unknown and must be predicted using the method of load forecasting.

2.4.2. Recommendations for Electricity Sale Package

Based on the similar customers discussed in Section 2.3, the customer decision matrix corresponding to them can be obtained, and each customer matrix can be assembled into a standardized customer group decision matrix, and the following can be used to recommend electricity sale packages using the recommendation method for electricity sale packages based on the prospect strengths and weaknesses degree and the Choquet integral. Specifically, the process of the electricity sale package recommendation method is as follows:
Step 1: Establish an evaluation label system for electricity sale packages and perform clustering division on different customers in the customer set. Once the evaluation label system is in place, clustering division is performed on the customer set to identify distinct customer segments. This segmentation is crucial for targeting personalized recommendations to each customer group.
Step 2: Calculate the similarity of new customers by using Formula (1) to determine N similar customers within the divided customer set. The selection of similar customers ensures that the recommendations are tailored to the needs and preferences of the new customer.
Step 3: Obtain the customer decision matrices of the N similar customers. Aggregate the decision-making information of similar customers by using Formula (6) to construct the customer group decision-making matrix and standardize the customer group decision matrix.
Step 4: Determine the prospect strengths and weaknesses matrices of the schemes by using Formulas (7)–(9). The matrices provide a comprehensive overview of the potential benefits and challenges associated with each package, which is essential for making informed recommendations.
Step 5: Determine the fuzzy measures between the decision information sets by using Formulas (10) and (11). Determine the comprehensive weight Q by using the prospect strengths and weaknesses matrices, and then obtain the prospect strengths and weaknesses degree through Formula (12).
Step 6: Determine the prospect strengths and weaknesses flows according to Formulas (13) and (14), rank the magnitudes of the prospect strengths and weaknesses flows of different electricity sale packages, and obtain the electricity sale package recommendation schemes based on the ranking of the prospect strengths and weaknesses flows.
Based on the above analysis, the said electricity sale package recommendation method can be divided into two stages: the establishment of a multi-attribute customer decision-making system and the evaluation and recommendation of electricity sale packages for new customers, and the recommendation method for electricity sale packages based on the prospect strengths and weaknesses degree and the Choquet integral is shown in Figure 3.

2.5. Research Contrast

To further verify the rationality and feasibility of the proposed recommendation method for electricity sale packages, the recommendation method presented in this paper is compared with the following four recommendation methods. The recommendation results for various new customers under each method are calculated, respectively.
Cost-Ignore Recommendation (CIR): Referring to References [6,10,11], directly recommend electricity sale packages, disregarding the cost factors associated with each package.
Direct Prospect Recommendation (DPR): Referring to Reference [16], without performing customer clustering analysis, leverage the customers’ electricity bill consumption characteristics, evaluation information, and preferences, along with machine learning techniques to directly evaluate and propose electricity sale packages.
Equal-Weight Clustered Recommendation (EWCR): Referring to References [24,25], assuming equal weight among all internal attributes of electricity sale packages, initiate customer clustering analysis. Subsequently, based on the clustering outcomes, employ the prospect dominance degree and SIR method, considering customers’ psychological behavioral factors, in conjunction with the shared traits of customer groups, to tailor electricity sale package recommendations.
Similar-Plan Clustered Recommendation (SPCR): Referring to Reference [42], presume that, instead of clustering the customer set, similarity calculations are conducted for all customers. Furthermore, the Choquet integral is introduced to address the issues pertaining to attribute weights and correlations, with the objective of recommending electricity sale packages.

3. Results

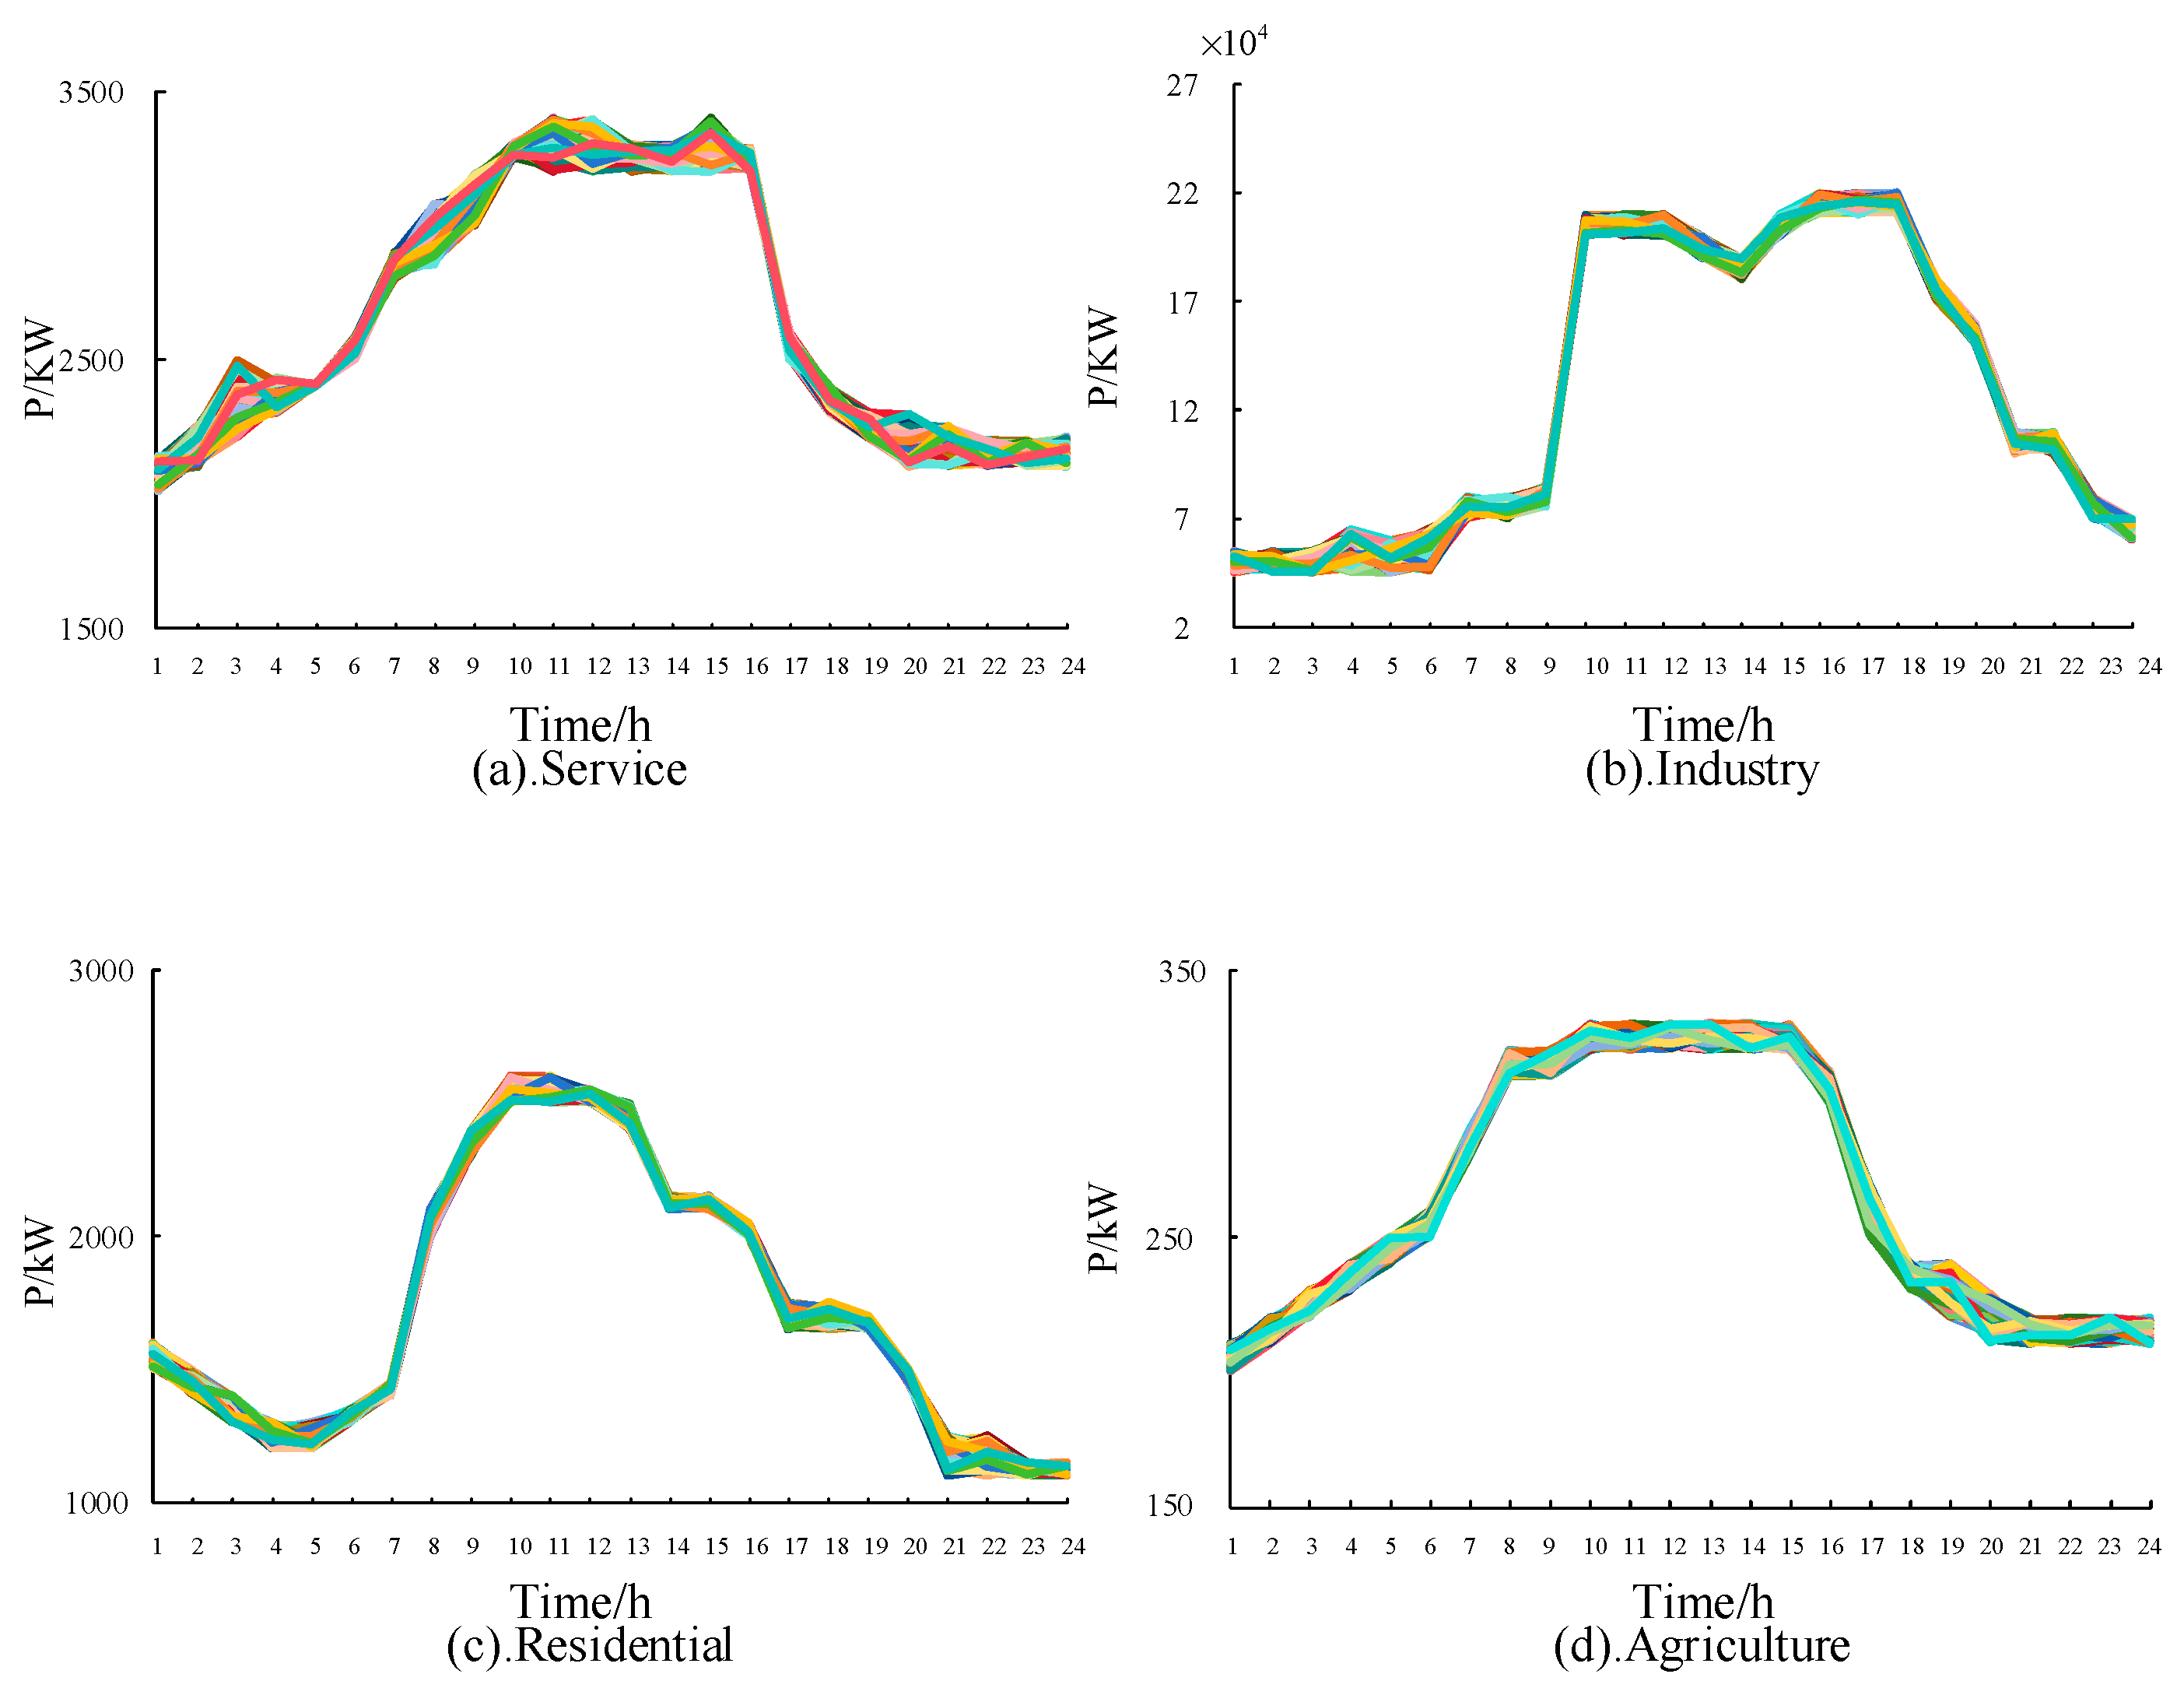
3.1. Introduction to the Arithmetic Example

Based on the load data of 500 typical customers U = { U 1 , U 2 , , U 500 } collected with smart meters from 1 to 31 January 2022, the leave-one-out cross validation method was used [46]. The proposed method is validated, i.e., one customer is extracted as a new customer each time, and the remaining 499 customers are taken as the customer set.
As shown in Table 1, to provide a comprehensive understanding of the customer base, a summary table of the key attributes of the 499 surveyed customers is presented. These attributes were chosen as they are crucial in understanding customers’ decision-making processes when selecting electricity sale packages. The surveyed customers were specifically chosen because they represent a diverse sample of residential and commercial electricity consumers in the western Zhejiang region, allowing for a comprehensive validation of the proposed recommendation method.
Furthermore, to demonstrate how representative the sample of customers was relative to the general population surveyed, a new table has been created as Table 2. The table comprises two primary components. The initial component enumerates the pivotal attributes taken into consideration, encompassing facets like “Category”, “Monthly Load (kWh)”, “Load Factor”, and “Value-Added Services Preference”. Subsequent to these attributes, the second component delineates two principal divisions. One division presents the mean values of these attributes, derived from our survey sample. The other division exhibits the corresponding mean values for the entire designated area.
Referring to the data of the Provincial Trading Center, as well as the actual situation of the customers, referring to the package set provided by the electricity sale company for the customers as C = { C 1 , C 2 , , C 4 } , the unit price (d1), value-added services (d2), incentive policy (d3), renewable energy proportion (d4), and whether it is a fixed package (d5) are selected as the decision-making information, which is detailed in Table 3. Considering that the main purpose of this paper is to study the recommendation method of the packages, the above load data are directly used as the monthly load of the new customers analyzed.

3.2. Recommended Analysis of Electricity Sale Packages

3.2.1. Obtaining the Customer Decision Matrix

Firstly, the sample BLAP cluster is applied to the customer set in order to identify distinct groups within the data. The optimal clustering results are derived using Formula (2), which is specifically designed to evaluate the quality of the clusters based on certain criteria such as compactness and separation. As illustrated in Figure 4 below, these results provide a clear visualization of the customer segments that have been identified through the BLAP clustering process. The clusters are distinct and well-separated, indicating that the BLAP method has effectively grouped similar customers together while differentiating between dissimilar ones.
Category I (depicted in Figure 4a) represents electricity consumption for services, Category II (Figure 4b) for industry, Category III (Figure 4c) for residential use, and Category IV (Figure 4d) for agriculture. Different colors represent clustering results for different individual users.
As illustrated in Figure 4, industrial electricity consumption exhibits a distinct pattern: loads are low at night, with only some production lines remaining operational. In the morning, there is a preheating and startup phase, leading to an increase in load. Peak load occurs during full-scale production, which spans from morning to afternoon. Subsequently, as production lines shut down in the evening and into the night, the load decreases. For residential electricity consumption, loads are similarly low at night, primarily due to standby power usage. Upon waking in the morning, the load increases. From morning to afternoon, when residents are typically out for work, the load remains at a relatively stable level. However, as people return home and engage in various activities in the evening and into the night, the load reaches its peak. Subsequently, as people go to sleep, the load decreases. Commercial electricity consumption follows a pattern where loads are low at night, despite some venues remaining open. In the morning, as businesses open and become operational, the load increases. Morning activities are frequent, resulting in higher load levels. During lunchtime, there is a slight decrease in load. However, in the afternoon, the load remains high. As evening activities peak, so does the load. Subsequently, as nighttime activities decrease, the load also drops. Agricultural electricity consumption is primarily utilized by mechanized farmers. Farmers generally consume more electricity during the day for farming activities and less at night when they are resting.
After the clustering is completed, the new customers are put into the customer set, and the similarity is calculated by using Formula (1), and then N similar customers are found, here N is taken as 3. And the probabilistic linguistic term set is used to portray the decision information value.
Given the challenges associated with obtaining actual ranking results for various electricity plans, this paper makes several assumptions regarding selection patterns to simulate real-world choices. These assumptions are crucial for developing a comprehensive understanding of consumer behavior in the electricity market.
Selection Pattern 1: Customers who exhibit higher electricity consumption during non-working hours are more inclined to choose time-of-use (TOU) electricity plans. This assumption is based on the idea that these customers may be seeking to optimize their electricity usage during off-peak hours to reduce costs. By selecting a TOU plan, they can take advantage of lower rates during non-working hours, which can lead to significant savings on their monthly electricity bills.
Selection Pattern 2: Customers with consistently high and relatively stable electricity consumption are more likely to opt for tiered pricing electricity plans. This assumption is based on the observation that customers with predictable and stable electricity usage patterns may find tiered pricing plans more suitable. These plans often offer lower rates for the first tier of usage, which can be beneficial for customers who consistently use a moderate amount of electricity.
Selection Pattern 3: When electricity plan prices are comparable, customers tend to prefer plans that offer a higher proportion of renewable energy sources. This assumption reflects the increasing importance of sustainability and environmental concerns in consumer decision-making. Customers who are willing to pay a slight premium for renewable energy sources are likely to prioritize plans that align with their values and contribute to a cleaner energy future.
Selection Pattern 4: When electricity plan prices are similar, customers who are sensitive to power quality disturbances tend to prioritize high-quality power value-added services, whereas other customers are more focused on energy management services. This assumption acknowledges the diverse needs and preferences of electricity consumers. While some customers may be willing to pay extra for reliable and high-quality power services, others may prioritize energy management tools and resources that help them monitor and reduce their electricity usage.
Let S = {s−3 = extremely low, s−2 = low, s−1 = low, s0 = average, s1 = higher, s2 = higher, and s3 = extremely high} be a symmetric linguistic term set, and, at the same time, to facilitate the calculation, consider that the probabilistic linguistic term sets in the customer decision matrix are all of standard type; at this time, the customer decision matrix given by 3 similar customers can be shown as follows:
H 1 = d 1 d 2 d 3 d 4 d 5 c 1 c 2 c 3 c 4 s 2 0.6 , s 1 0.4 s 2 1 s 2 0 s 2 0.65 , s 1 0.35 s 1 0.45 , s 0 0.55 s 2 1 s 0 0.3 , s 1 0.2 , s 2 0.5 s 1 0.7 , s 2 0.3 s 0 0.75 , s 1 0.25 s 1 0.3 , s 0 0.7 s 2 1 s 1 0.6 , s 2 0.4 s 1 1 s 1 1 s 1 1 s 2 0.7 , s 1 0.3 s 2 1 s 1 0.7 , s 2 0.3 s 0 0.8 , s 1 0.2 s 1 0.5 , s 2 0.5 H 2 = d 1 d 2 d 3 d 4 d 5 c 1 c 2 c 3 c 4 s 1 s 0 0.7 , s 10.3 s 2 1 s 2 0.55 , s 1 0.45 s 2 0.4 , s 1 0.6 s 2 0.2 , s 2 0.8 s 2 1 s 1 0.3 , s 2 0.7 s 0 1 s 1 1 s 2 1 s 1 0.5 , s 2 0.5 s 1 0.5 , s 0 0.5 s 1 0.5 , s 2 0.5 s 1 0.7 , s 2 0.3 s 2 0.4 , s 0 0.6 s 1 0.5 , s 0 0.4 , s 1 0.1 s 1 0.25 , s 2 0.75 s 1 0.55 , s 2 0.45 s 2 1 H 3 = d 1 d 2 d 3 d 4 d 5 c 1 c 2 c 3 c 4 s 0 0.6 , s ( 0.4 ) s 2 0.7 , s 10.3 s 1 0.4 , s ( 0.6 ) s 2 1 s 1 1 s 1 0.3 , s ( 0.7 ) s 1 0.5 , s 2 ( 0.5 ) s 2 1 s 1 0.5 , s 0 ( 0.5 ) s 1 0.5 , s 0 ( 0.5 ) s 3 0.5 , s ( 0.5 ) s 2 1 s 1 0.4 , s 0 0.4 , s ( 0.2 ) s 1 0.5 , s 2 0.5 s 0 0.5 , s 1 0.5 s 1 1 s 1 0.5 , s ( 0.5 ) s 2 1 s 2 1 s 2 1

3.2.2. Aggregate Decision-Making Information from Different Customers

Set the fuzzy measure of the customer set uniformly as 0.5, according to Equation (10), the degree of fuzzy calculated as 0.76. Then, using Equation (6) to assemble the decision-making information of the three customers, to obtain the decision-making matrix of the customer group, and standardize the evaluation matrix of the customer group, refer to Appendix D.

3.2.3. Identify the Prospect Strengths and Weaknesses Matrix of the Program

Incorporate the values of the parameters often used in existing studies—that is, α = β = 0.88 , θ = 2.25 , η = 0.61 , δ = 0.72 . The results of the prospect strengths and weaknesses matrix can be expressed separately as follows:
S = S j c i 4 × 5 = d 1 d 2 d 3 d 4 c 1 c 2 c 3 c 4 0 0.47 0 0 0.56 0.81 0.21 0.13 0.32 0 0.42 0.38 0.45 0.08 0.65 0.85 I = I j c i 4 × 5 = d 1 d 2 d 3 d 4 c 1 c 2 c 3 c 4 0 0.47 0 0 0.56 0.81 0.21 0.13 0.32 0 0.42 0.38 0.45 0.08 0.65 0.85

3.2.4. Calculate Fuzzy Measures for All Subsets of the Decision Information Set C

Referring to Appendix C, based on the decision matrix of customer groups, we can obtain the objective weight and the combined weight of decision information Q j , and find Q j > 1 by summing Q j [49], which can be initially considered since there is a correlation between the decision information. According to the comprehensive weight of decision information, the fuzzy measure λ = 0.77 is calculated by using the Choquet integral, which verifies the existence of redundant correlations between decision information and is consistent with the actual analysis, and then the fuzzy measure of all subsets of decision information set D is obtained [50]; refer to Appendix E.

3.2.5. Full Sorting of Electricity Sale Packages

Based on Formulas (13) and (14), the prospect strengths flows, φ > ( x 1 ) = 0.51 , φ > ( x 2 ) = 0.17 , φ > ( x 3 ) = 0.52 , φ > ( x 4 ) = 0.16 , and the prospect weaknesses flows φ < ( x 1 ) = 0.47 , φ < ( x 2 ) = 1.55 , φ < ( x 3 ) = 0.46 , φ < ( x 4 ) = 1.10 are calculated.
Based on the aforementioned simulation and considering the actual load characteristics of customers, each electricity plan is associated with a specific customer group, serving as the simulated actual ranking results for these plans. The simulated ranking results for the new customer’s electricity plan options are presented in Table 4. It is noteworthy that the aforementioned assumptions regarding selection patterns are primarily intended for simulating the electricity plan selection process. In practice, customers may demonstrate varying selection patterns; however, this does not impair the implementation of the electricity plan recommendation method proposed in this paper.
As depicted in Table 4, the package ranking results obtained through the method proposed in this paper are largely consistent with the simulated actual ranking results. The discrepancy in the ranking of C3 and C1 arises from the scenario where the costs of C3 and C4 are comparable, and they offer identical types of value-added services and incentive policies. However, C3 boasts more cost flexibility, which results in greater customer satisfaction with C3. This underscores that the package ranking results derived from the method in this paper are aligned with real-world expectations. Analogously, other customers can be arbitrarily selected as new customers to obtain their package satisfaction evaluation results, which are presented in Appendix A.

4. Discussion

According to the different method types presented in Section 2.5, as can be seen from Figure 5, the root-mean-square error (RMSE) of the sorting results obtained using the method proposed in this paper is the smallest, all of which are less than 1. In comparison with the other three recommendation methods, the RMSE corresponding to the recommendation results of the electricity sale package recommendation method based on the multi-attribute decision-making approach is the largest, indicating a poorer recommendation effect. Furthermore, if the differences in attributes of the electricity sale packages are not considered, Figure 5 demonstrates that the mean RMSE for various customers is 1.214, 1.471, 1.318, and 1.521, respectively. This suggests that the recommendation effect is significantly inferior to that of the method proposed in this paper, which takes into account attribute differences and incomplete weight information.
The methodology employed in this paper for recommending electricity sale packages integrates BLAP clustering, Prospect Theory, the SIR method, and the Choquet integral, thereby demonstrating enhanced comprehensiveness. On the one hand, it appropriately accounts for the subjective factor of customers’ risk psychological preferences. On the other hand, it also addresses issues related to attribute correlation and the determination of weights. The section devoted to case analysis further validates the applicability and effectiveness of the proposed methodology.

5. Conclusions and Outlooks

With the continuous development of the electricity market, electricity sale packages companies are facing increasingly fierce market competition and must have higher business capabilities. The choice of electricity sale package is affected by many subjective and objective factors, including the correlation between the decision information of electricity sale package function and customers’ risk preference. In this paper, these practical problems are abstracted into theoretical problems, and an effective decision model is constructed to solve these problems so as to provide a basis for accurate electricity sale package recommendations.
The goal of this research is to delineate the primary contributions of this paper in the context of comparing electricity sale package schemes. Therefore, the objective of this research is to integrate Prospect Theory into the classical SIR method for calculating the prospect strengths and weaknesses degree, thereby overcoming the limitation of ignoring the objective uncertainty of customers’ consumption habits and budget. This integration facilitates a more nuanced portrayal of distinctions among various electricity sale packages. Additionally, the research objective includes employing the Choquet integral to calculate the correlation coefficients of electricity sale package attributes and leveraging the probabilistic language deviation function to determine the attribute weights of these packages, ultimately elucidating the differences among the attributes of various electricity sale packages. In this paper, we have conducted an in-depth analysis of electricity sale package recommendation methods, focusing on capturing the diverse behavioral sentiments and risk preferences of customers. Through our proposed methodology, customers were successfully categorized into distinct groups based on their monthly load, load factor, preferences for value-added services, incentive policies, renewable energy, and price sensitivity. These categories, as depicted in the clustering results in Figure 4, provided a clear understanding of the different customer segments within the surveyed population. For each customer segment, we tailored electricity sale package recommendations by considering their specific attributes and preferences. The recommendation process leveraged a combination of fuzzy measures, the Choquet integral, and Prospect Theory to account for the subjective factors of customers’ risk, psychological preferences, and attribute correlations. The results indicate a significant improvement in recommendation accuracy, as evidenced by the root-mean-square error (RMSE) values obtained. Compared to other recommendation methods, our proposed approach achieved the lowest RMSE, demonstrating its effectiveness in reducing recommendation bias and enhancing customer satisfaction.
In future research, we can further explore and improve the electricity sale package recommendation method proposed in this paper. On the one hand, sensitivity analyses of customers’ psychological and behavioral parameters can be carried out to enhance the applicability of the model. On the other hand, the model parameters can be modified and optimized based on a wider range of market data to improve its accuracy and generalization ability in practical applications. In addition, more factors that affect the choice of electricity sale packages can be considered in the model, such as customers’ personal preferences, family structure, electricity consumption habits, etc., to further improve the personalization and accuracy of the recommendations.

Author Contributions

Conceptualization, Y.W. and L.Q.; methodology, Y.W., L.Q. and Y.M.; validation, Y.W. and L.Q.; formal analysis, Y.W. and Y.M.; investigation, L.Q. and Y.M.; resources, Y.W. and L.Q.; data curation, Y.M.; writing—original draft preparation, Y.W. and L.Q.; writing—review and editing, Y.W. and L.Q.; visualization, Y.M. and L.Q.; supervision, Y.M. and Y.W.; project administration, Y.M.; funding acquisition, Y.M. All authors have read and agreed to the published version of the manuscript.

Funding

This is supported by the Natural Science Foundation of China (No. 72301248).

Institutional Review Board Statement

Not applicable.

Informed Consent Statement

Not applicable.

Data Availability Statement

The data that support the findings of this study are available from the corresponding author upon reasonable request.

Conflicts of Interest

The authors declare no conflicts of interest.

Abbreviations

U The sample customer
C Different sets of finite electricity sale packages
D Different sets of decision information
Q The weights of each attribute based on the different decision information
s ρ U i , U j The similarity between the two key metrics of each customer.
c * The optimal number of clusters.
b U i , y The yth image tag of Ui
b ¯ U I The mean value of image tags of Ui
Z Q , a v The clustering quality index for different pairs of clusters
v Δ x The prospect value function
α The risk attitude coefficients
β The risk attitude coefficients
θ The loss aversion coefficient
ω ( p ) The mental weighting function
ω + ( p ) Nonlinear weighting functions for gains
ω ( p ) Nonlinear weighting functions for losses
ξ The risk attitude coefficients for gains
δ The risk attitude coefficients for losses
H k = h k i j m * n Evaluation matrix
f A non-negative function on the set of electricity sale packages C
u Fuzzy measures of the customer
η The individual risk appetite
δ Aversion coefficients
S = S j x i The combined prospect superiority matrix
I = I j x i The combined prospect inferiority matrix
λ Fuzzy measure of the decision information set D
W n The nth new customer
M The total number of new customers
S A symmetric linguistic term set

Appendix A

In Table 2, the customer Ui and the specific meanings of the portrait labels are as follows:
  • (U1) Monthly load factor
Monthly load factor, reflecting the fluctuation of load change in the customer for the whole month, this is the ratio of the monthly average load to the monthly maximum load, expressed as follows:
b U i , l r = P U i , a v P U i , m a x = v = 1 v P U i , v V P U i , m a x
In the formula, P U , s v and P U , max are, respectively, the customer’s Ui monthly average load and monthly maximum load, and P U , v is the customer’s Ui, the load at the firstv load at the last moment. Monthly load ratio is b U i , l r . The larger this is, the larger the customer’s Ui and the greater the load fluctuation throughout the month.
  • (U2) Maximum monthly utilization hours
Monthly maximum utilization hours, reflecting the time utilization efficiency of the customer’s load for the whole month, is the ratio of the total monthly electricity consumption to the maximum monthly load, as follows:
b U i , m u = Q U i , s u m P U i , m a x = P U i , v d t P U i , m a x
where Q U , s u m is the electricity consumption of the customer Ui for the whole month. The larger the monthly maximum utilization hours b U , m u , the higher the load time utilization efficiency of the customer Ui for the whole month.
  • (U3) Average weekday peak-to-valley differential rate
The average value of peak-to-valley difference rate on weekdays, reflecting the smoothness of electricity consumption by customers on weekdays throughout the month, is the average value of the ratio of the difference between the maximum and minimum loads on weekdays to the maximum load on the same day, and the expression is the following:
b U i , w d = P τ . U i , m a x P τ . U i , m i n P τ . U i , m a x a v = 1 K W τ = 1 K w P τ . U i , m a x P τ . U i , m i n P τ . U i , m a x
where Kw is the total number of working days in a month; P τ . A I , m a x and P τ . A I , m i n are the maximum and minimum loads of customer Ui on the τ th working day, respectively. The larger the average value of the peak-to-valley ratio b U i , w d on weekdays, the greater the fluctuation of the load of customer Ui on weekdays.
  • (U4) Average non-working day peak-to-valley differential rate
The average value of peak-to-valley difference rate on non-working days, reflecting the smoothness of electricity consumption by customers on non-working days of the whole month, is the average value of the ratio of the difference between the maximum and minimum loads on non-working days to the maximum load on the same day, with the following expression:
b U , n w d = P ξ , U i , m a x P ξ , U , m i n P ξ , U i , m a x a v = 1 K N W ξ = 1 K N W P ξ , U i , m a x P ξ , U i , m i n P ξ , U i , m a x
where KNw is the total number of non-working days in a month; P ξ , U I , m a x and P ξ , U , m i n are the maximum and minimum loads of the ξ non-working day customer Ui, respectively. The larger the average value of peak-to-valley ratio bUI,nwd on non-working days, the larger the fluctuation of load of Ui on non-working days.
  • (U5) Peak load factor averages
Peak load ratio average value, reflecting the fluctuation of the customer’s load change in the peak period in the whole month (the peak period is defined as 08:00–11:00 and 18:00–21:00), is the average value of the ratio of the average value of the load and the average value of the load of the day in that time period, expressed as follows:
b U i , plr = 1 G t = 1 G P t , U i , av . peak P t , U i , av
In the formula, G is the total number of days in a month, which satisfies G = Kw + KNW, P t , U I , av . peak is the average value of load of customer Ui during peak hours on day t, and P t , U I , av is the average value of load of customer Ui on day t. The larger the peak load factor average value b U I , plr is, the more obvious the fluctuation of the load of customer Ui during the peak hour.
  • (U6) Mean flat-period load factor
The average value of load ratio in the weekly period, reflecting the fluctuation in the load in the weekly period of the whole month (the weekly period is defined as 06:00–08:00, 11:00–18:00, and 21:00–22:00), and it is the average value of the ratio between the average value of the load in the time period and the average value of the load in the day, which is expressed as follows:
b U i , slr = 1 G t = 1 G P t , U i , av . sh P t , U i , av
where P t , U I , av . sh is the average value of load of customer Ui in the usual segment on day t. The larger the average value of load factor b U I , slr in the weekly period, the more obvious the fluctuation of the load of customer Ui in the weekly period.
  • (U7) Mean value of valley load factor
Valley load rate average, reflecting the fluctuation in the customer throughout the month in the valley time load change fluctuations (the valley time is defined as 22:00–24:00 and 00:00–06:00) for the time period of the load average and the day load average ratio of the average value, expressed as follows:
b U i , vlr = 1 G t = 1 G P t , U i , av . val P t , U i , av
where P t , U I , av . val is the average value of load of customer Ui during the valley hour on day t. The larger the average value of load factor b U I , vlr in the valley period, the more significant the fluctuation of the load of customer Ui in the valley period.

Appendix B

BLAP clustering.
  • Step 1: Calculate the similarity between each customer portrait in U using Equation (A8)
    s ρ U i , U j = y = 1 7 b U i , y b ¯ U i b U j , y b ¯ U j y = 1 7 b U i , y b ¯ U i 2 y = 1 7 b U j , y b ¯ U j 2 i j  
  • Step 2: Divide the customer set U into B parts and use the median customer portrait similarity μ m , H γ as the customer self-similarity within each part, i.e., s U j , H γ , U j , H γ ρ = μ m , H γ , where U j , H γ is the jth customer in H γ .
  • Step 3: Perform AP clustering for each segment of customers to obtain the set of cluster centers for each segment E 1 , E 2 , , E γ , , E B .
  • Step 4: Form a new set of customers E new = E 1 E 2 E B from the set of clustering centers for each part of the customers. If the number of customers in E n e w is greater than 400, return to Step 2; otherwise, go to Step 5.
  • Step 5: Initialize the customer self-similarity s U j , E new , U j , E new ρ = μ m , E new in E n e w , where U j , E new is the jth customer in E n e w and μ m , E n e w is the median value of the customer portrait similarity in E n e w .
  • Step 6: Perform AP clustering on E n e w to obtain the number of stable clusters as Q E n e w , and determine whether customer Ui belongs to the clustering center U j , E new based on Equation (A9):
    U i = a r g max U j s p U i , U j
  • Step 7: Based on the clustering results obtained in Step 6, calculate the clustering quality indicator using Equation (A10).
    Z Q , a v = 1 I i = 1 I Z Q U i = 1 I i = 1 I d o u t U i d i n U i m a x d o u t U i , d i n U i
  • Step 8: Update the customer self-similarity using Equation (A11).
    s ρ U j , U j = s ρ U j , U j s ρ s = s ρ U j , U j μ m 10 Q + 50
  • Step 9: Determine whether the number of clusters satisfies Q E n e w 2 . If so, the iteration ends and goes to step 10; otherwise, return to step 6 to continue the iteration.
  • Step 10: Compare the corresponding clustering quality indicators under different number of clusters and determine the optimal number of clusters c* from Equation (2).

Appendix C

The decision information objective weight wj can be expressed as follows:
w j = i = 1 m d L i j p , L i j + p d L i j p , L i j + p + d L i j p , L i j p 2 1 j n ( i = 1 m ( d L i j p , L i j + p d L i j p , L i j + p + d L i j p , L i j p ) 2 ) 1
The subjective weight of decision information pj can be expressed as follows:
p j = 1 k k = 1 l p k j
Furthermore, the combined attribute weight wj can be obtained:
W j = 0.5 p j + 0 . 5 w j

Appendix D

The normalized decision matrix is
H 1 = d 2 d 2 c 1 c 2 c 3 c 4 s 0.19 0.36 , s 0.07 0.24 , s 0.21 0.24 , s 0.5 0.16 s 1.27 0.14 , s 1 0.58 , s 0.85 0.06 , s 0.52 0.24 s 1.47 0.06 , s 1.67 0.14 , s 1.79 0.24 , s 2 0.56 s 0.66 0.15 , s 1 1 , s 1.09 0.15 , s 1.29 0.25 , s 1.47 0.1 , s 1.79 0.25 s 3 0.5 , s 2 0.5 s 0.92 0.3 , s 1.2 0.2 , s 1.23 0.3 , s 1.54 0.2 s 1.25 0.28 , s 1 0.12 , s 0.85 0.42 , s 0.55 0.18 s 0.92 0.25 , s 1.2 0.25 , s 1.23 0.2 , s 1.47 0.05 , s 1.54 0.2 , s 1.79 0.05 d 3 s 1.79 0.4 , s 2 0.6 s 1.79 0.21 , s 2 0.09 , s 2.25 0.49 , s 2.48 ( 0.21 ) s 1 0.2 , s 0.73 0.4 , s 0.22 0.2 , s 0.17 0.1 , s 0.21 0.1 s 1.47 0.18 , s 1.67 0.08 , s 1.79 0.53 , s 2 ( 0.23 ) d 4 s 2 0.36 , s 1.76 0.19 , s 1.59 0.29 , s 1.25 0.16 s 0.22 0.38 , s 0 0.38 , s 0.21 0.13 , s 0.46 0.13 s 0.5 0.25 , s 0.75 0.25 , s 0.92 0.25 , s 1.2 0.25 s 1.23 0.44 , s 1.47 0.11 , s 1.54 0.36 , s 1.79 0.09 d 5 s 1.25 0.18 , s 1 0.27 , s 0.85 0.22 , s 0.55 0.33 s 0.55 0.38 , s 0.22 0.38 , s 0.17 0.13 , s 0.21 0.13 s 0.79 0.35 , s 1 0.35 , s 1.23 0.15 , s 1.47 0.15 s 1.79 0.5 , s 2 0.5

Appendix E

Decision-making information set D. The fuzzy measure for all subsets can be shown below:
μ λ = 0 μ λ d 1 = 0.385 μ λ d 2 = 0.370 μ λ d 3 = 0.315 μ λ d 4 = 0.300 μ λ d 5 = 0.280
μ λ d 1 , d 2 = 0.645 μ λ d 1 , d 4 = 0.596 μ λ d 2 , d 3 = 0.595 μ λ d 2 , d 5 = 0.570 μ λ d 3 , d 5 = 0.527 μ λ d 1 , d 2 , d 3 = 0.804 μ λ d 1 , d 2 , d 5 = 0.786 μ λ d 1 , d 3 , d 5 = 0.756 μ λ d 2 , d 3 , d 4 = 0.758 μ λ d 2 , d 4 , d 5 = 0.739 μ λ d 1 , d 2 , d 3 , d 4 = 0.918 μ λ d 1 , d 2 , d 4 , d 5 = 0.905 μ λ d 2 , d 3 , d 4 , d 5 = 0.874 μ λ d 1 , d 3 = 0.607 μ λ d 1 , d 5 = 0.582 μ λ d 2 , d 4 = 0.585 μ λ d 3 , d 4 = 0.542 μ λ d 4 , d 5 = 0.515 μ λ d 1 , d 2 , d 4 = 0.796 μ λ d 1 , d 3 , d 4 = 0.767 μ λ d 1 , d 4 , d 5 = 0.748 μ λ d 2 , d 3 , d 5 = 0.747 μ λ d 3 , d 4 , d 5 = 0.705 μ λ d 1 , d 2 , d 3 , d 5 = 0.911 μ λ d 1 , d 3 , d 4 , d 5 = 0.881 μ λ d 1 , d 2 , d 3 , d 4 , d 5 = 1.000

References

  1. China Energy Portal. Several Opinions of the Central Committee of the Communist Party of China and The State Council on Further Deepening the Reform of the Electric Power System. Pop. Util. Electr. 2016, 31, 6–7. [Google Scholar]
  2. Available online: https://www.gov.cn/xinwen/2015-12/01/content_5018612.htm (accessed on 7 November 2023).
  3. Cao, Q.; Zheng, M.; Ding, Y. Multi-attribute decision making model for customer evaluation and selection in electricity market. Power Syst. Technol. 2018, 42, 117–125. [Google Scholar]
  4. Ofgem. Available online: https://www.ofgem.gov.uk/energydata-and-research/data-portal/retail-market-indicators (accessed on 12 December 2023).
  5. Zhang, X.; Li, J.; Fu, H. UK retail electricity market reform and challenges. Autom. Electr. Power Syst. 2016, 40, 10–16. [Google Scholar] [CrossRef]
  6. iSelect. Available online: http://www.iselect.com.au/energy/ (accessed on 2 February 2023).
  7. He, Y.; Chen, F.; Ye, Y.; Liu, P.; Gao, X. Experience and enlightenment of electricity price package in australian retail market. Smart Power 2019, 47, 19–23+28. [Google Scholar]
  8. Lu, B.; Song, Y.; Wang, Y.; Wang, L. The operation mode and enlightenment of electricity sales company in Texas USA. Power Demand Side Manag. 2017, 19, 60–64. [Google Scholar]
  9. Wang, C.; Pang, M.; Chen, Y. Yunnan “to Amoy electricity” to explore the electricity side reform model. Econ. Inf. Dly. 2022, 005. Available online: https://link.cnki.net/doi/10.28419/n.cnki.njjck.2022.000171 (accessed on 12 December 2023). [CrossRef]
  10. Check24. Available online: http://www.check24.de/strom-gas/ (accessed on 2 February 2023).
  11. Power to Choose. 2019. Available online: https://www.powertochoose.org (accessed on 12 December 2023).
  12. Energy Made Easy. 2019. Available online: http://www.energymadeeasy.gov.au (accessed on 15 December 2023).
  13. Entega. 2023. Available online: https://www.entega.de/ (accessed on 7 January 2024).
  14. Eprimo. 2023. Available online: https://www.eprimo.de/ (accessed on 7 January 2024).
  15. Sun, Y.; Gu, W.; Li, B.; Cui, C.; Sun, C.; Zheng, A. Electricity-retail-market-reform oriented recommendation method of customer’s hierarchical clustering and pricing packages. Power Syst. Technol. 2018, 42, 447–454. [Google Scholar]
  16. Luo, F.; Ranzi, G.; Wang, X.; Dong, Z.Y. Social information filtering-based electricity retail plan recommender system for smart grid end customers. IEEE Trans. Smart Grid 2019, 10, 95–104. [Google Scholar] [CrossRef]
  17. Wang, M. The System and Price Designing Method Of Retail Electricity Price Package Under the Opening of Power Sale Side. Ph.D. Thesis, North China Electricity Power University, Beijing, China, 2021. [Google Scholar]
  18. Feng, R.; Hu, J.; Jiang, G.; Huang, C.; Tang, W.; Zhao, L.; Zhang, K.; Huang, X.; Zhu, W. Recommendation Pattern of Electricity Sales Package based on Improved Clustering and Spark Framework. In Proceedings of the 2022 IEEE International Conference on Advances in Electrical Engineering and Computer Applications, Dalian, China, 20–21 August 2022; pp. 293–299. [Google Scholar]
  19. Zhang, Z.; Wang, Y.; Lin, Z.; Ma, Y.; Lu, F.; Yang, L. Electricity plan recommendation method based on implicit score of electricity plan and customer portrait. Autom. Electr. Power Syst. 2023, 47, 91–101. [Google Scholar]
  20. Qu, Z.; Feng, R.; Qu, N. Recommendation method of electricity selling packages based on optimal feature subset of electricity trading customers. Power Syst. Technol. 2018, 42, 3298–3304. [Google Scholar]
  21. He, Y.; Wang, M.; Yu, J.; He, Q.; Sun, H.; Sun, F. Research on hybrid optimal selection of electricity price packages based on power customer characteristics and multi-attribute utility in China. Energies 2020, 13, 2693. [Google Scholar] [CrossRef]
  22. Zhang, Y.; Meng, K.; Kong, W.; Dong, Z.Y. Collaborative filtering-based electricity plan recommender system. IEEE Trans. Ind. Inform. 2019, 15, 1393–1404. [Google Scholar] [CrossRef]
  23. Zhang, Y.; Meng, K.; Kong, W.; Dong, Z.Y.; Qian, F. Bayesian hybrid collaborative filtering-based residential electricity plan recommender system. IEEE Trans. Ind. Inform. 2019, 15, 4731–4741. [Google Scholar] [CrossRef]
  24. Ma, Y.; Li, Q.; Chen, H.; Zhang, Z.; Lin, Z.; Yang, Z. Recommendation method for electricity retail plan based on bi-level affinity propagation clustering and multigranular hesitant fuzzy sets. Autom. Electr. Power Syst. 2023, 47, 96–104. [Google Scholar]
  25. Fan, Z.; Chen, F.; Zhang, X. Method for hybrid multiple attribute decision making based on cumulative prospect theory. J. Syst. Eng. 2012, 27, 295–301. [Google Scholar]
  26. Chang, J.; Du, Y.; Liu, W. Pythagorean hesitant fuzzy risky multi-attribute decision making method based on cumulative prospect theory and vikor. Oper. Res. Manag. Sci. 2022, 31, 50–56. [Google Scholar]
  27. Cai, W.; Zhang, J.; Wu, X.; Wu, Z.; Yue, F.; Liu, D.; Rao, G. Comprehensive evaluation of carbon emission reduction technologies for thermal power generation enterprises based on hesitant huzzy set-prospect theory. Water Resour. Hydropower Eng. 2024, 1–14. Available online: http://kns.cnki.net/kcms/detail/10.1746.TV.20240924.1134.002.html (accessed on 12 December 2023).
  28. Zhang, X.; Fan, Z. A Method for Risky Interval Multiple Attribute Decision Making Based on Prospect Theory. Oper. Res. Manag. Sci. 2012, 21, 44–50. [Google Scholar]
  29. Ma, Q. Hesitant fuzzy multi-attribute group decision-making method based on prospect theory. Comput. Eng. Appl. 2015, 51, 249–253. [Google Scholar]
  30. Chou, J.-S.; Ongkowijoyo, C.S. Reliability-based decision making for selection of ready-mix concrete supply using stochastic superiority and inferiority ranking method. Reliab. Eng. Syst. Saf. 2015, 137, 29–39. [Google Scholar] [CrossRef]
  31. Xu, X. The sir method: A superiority and inferiority ranking method for multiple criteria decision making. Eur. J. Oper. Res. 2001, 131, 587–602. [Google Scholar] [CrossRef]
  32. Zhao, N.; Xu, Z.; Ren, Z. Hesitant fuzzy linguistic prioritized superiority and inferiority ranking method and its application in sustainable energy technology evaluation. Inf. Sci. 2019, 478, 239–257. [Google Scholar] [CrossRef]
  33. Rodriguez, R.M.; Martinez, L.; Herrera, F. Hesitant fuzzy linguistic term sets for decision making. IEEE Trans. Fuzzy Syst. 2012, 20, 109–119. [Google Scholar] [CrossRef]
  34. Zou, J.; Guo, Y.; Shang, Z.; Liu, H. Hybrid Multiple Attribute Group Decision Making Method in Equipment Suppliers Selection. J. Inf. Eng. Univ. 2017, 18, 458–463. [Google Scholar]
  35. Qin, J. Generalized Pythagorean Fuzzy Maclaurin Symmetric Means and Its Application to Multiple Attribute SIR Group Decision Model. Int. J. Fuzzy Syst. 2018, 20, 943–957. [Google Scholar] [CrossRef]
  36. Chan, J.W.K. Enhancing organisational resilience: Application of viable system model and MCDA in a small Hong Kong company. Int. J. Prod. Res. 2011, 49, 5545–5563. [Google Scholar] [CrossRef]
  37. Yang, J.; Li, D. Selection Method of Cooperative Innovation Partners with Dependent Attributes and Fuzzy Information. Oper. Reaseach Manag. Sci. 2016, 25, 53–58. [Google Scholar]
  38. Tian, G.; Hao, N.; Zhou, M.; Pedrycz, W.; Zhang, C.; Ma, F.; Li, Z. Fuzzy grey choquet integral for evaluation of multicriteria decision making problems with interactive and qualitative indices. IEEE Trans. Syst. Man Cybern. Syst. 2021, 51, 1855–1868. [Google Scholar] [CrossRef]
  39. Feng, Y.; Dang, Y.; Wang, J.; Yang, Z. Grey incidence decision-making method with mixed information based on 2-additive choquet integral and its application. Chin. J. Manag. Sci. 2023, 1–12. [Google Scholar] [CrossRef]
  40. Liu, N. Multi attribute group decision making method of intuitionistic linguistic todim based on choquet integral. Math. Pract. Theory 2020, 50, 10–19. [Google Scholar]
  41. Deva, K.; Mohanaselvi, S. Picture fuzzy choquet integral based geometric aggregation operators and its application to multi attribute decision-making. Math. Model. Eng. Probl. 2022, 9, 1043–1052. [Google Scholar] [CrossRef]
  42. Yang, J.; Cai, Z.; Zheng, Z.; Lai, L.; Xu, Z. A prospect theory and attribute association based probabilistic linguistic fuzzy sir method for multi-attribute group decision-making and its application. Chin. J. Manag. Sci. 2024, 1–15. [Google Scholar] [CrossRef]
  43. Hung, W.C.; Liu, Y.C.; Wu, Y.L.; Tang, C.Y.; Hor, M.K. Adaptive affinity propagation clustering in mapreduce environment. In Technologies and Applications of Artificial Intelligence; Lecture Notes in Computer Science (including subseries Lecture Notes in Artificial Intelligence and Lecture Notes in Bioinformatics); Springer: Cham, Switzerland, 2014; Volume 8916, pp. 209–218. [Google Scholar]
  44. Chen, S.; Wang, J.; Wang, T. Cloud-based ERP system selection based on extended probabilistic linguistic MULTIMOORA method and Choquet integral operator. Comput. Appl. Math. 2019, 38. [Google Scholar] [CrossRef]
  45. Murofushi, T.; Sugeno, M. An interpretation of fuzzy measures and the choquet integral as an integral with respect to a fuzzy measure. Fuzzy Sets Syst. 1989, 29, 201–227. [Google Scholar] [CrossRef]
  46. Kahneman, D.; Tversky, A. Prospect theory: An analysis of decision under risk. Econometrica 1979, 47, 263–291. [Google Scholar] [CrossRef]
  47. Wang, Y.; Li, J.; Xu, M. Collaborative optimization of distributed energy resources in microgrid based on prospect theory under the framework of blockchain. Syst. Eng. Theory Pract. 2022, 42, 2551–2564. [Google Scholar]
  48. Ma, Y.; Ma, X.; Chen, H.; Lei, Y. Electricity sale package recommendation method based on unbalanced evaluation and incomplete weight multi - granularity fuzzy language set. Electr. Power Syst. Res. 2023, 221, 109382. [Google Scholar] [CrossRef]
  49. Ma, Y.; Zheng, R.; Lu, Y.; Zhang, Z.; Wang, Y.; Lin, Z.; Yang, L.; Liang, H.; Liu, P.X. Electricity retail plan recommendation method based on multigranular hesitant fuzzy sets and an improved non-negative latent factor model. IEEE Trans. Energy Mark. Policy Regul. 2024, 2, 146–161. [Google Scholar] [CrossRef]
  50. Zhang, Z. Research on Optimization of Operation Strategy of Power Selling Company Including Deviation Assessment and Demand Response. Ph.D. Thesis, Zhejiang University, Zhejiang, China, 2022. [Google Scholar]
Figure 1. Sampling site (a region in the west of Zhejiang, China).
Applsci 14 11905 g001
Figure 2. The effect of customers’ psychological risk preference on the accuracy of recommending electricity sale packages.
Applsci 14 11905 g002
Figure 3. Diagram of the recommendation methods for electricity sale packages based on prospect strengths and weaknesses degree and the Choquet integral.
Applsci 14 11905 g003
Figure 4. Customer sample clustering results.
Applsci 14 11905 g004
Figure 5. RMSE of recommended ranking results of electricity sale plans using different methods.
Applsci 14 11905 g005
Table 1. Summary of key attributes of surveyed customers.
Key AttributesDescription
Monthly Load (kWh)Average monthly electricity consumption of the customer.
Load FactorReflects the fluctuation of load change for the whole month.
Value-Added Services Pref.Preference for value-added services such as power quality, energy management, etc.
Incentive Policy Pref.Preference for incentive policies offered by electricity sale packages.
Renewable Energy Pref.Preference for packages with a higher proportion of renewable energy sources.
Price SensitivityThe influence of the price of electricity sale packages on the customer’s choice.
Table 2. Comparison of key attributes between survey sample and regional average.
CategoryMonthly Load (kWh)Load FactorValue-Added Services Pref.Incentive Policy Pref.Renewable Energy Pref.Price Sensitivity
SurveyedServices2655.930.620.570.720.670.62
Industry3,066,650.610.570.530.830.730.89
Residential1730.030.360.170.570.260.47
Agriculture264.960.370.390.470.520.53
AverageServices25000.600.550.750.650.60
Industry3,000,0000.600.500.800.700.90
Residential15000.350.200.550.300.50
Agriculture3000.450.400.500.500.55
Table 3. Set of electricity sale packages offered by the electricity sale companies.
Electricity Sale PackagesThe Unit PriceValue-Added ServiceIncentive PolicyProportion of Renewable Energy/%Whether It Is a Fixed Package
C10.59 (<500 kWh)
0.61 (500–1000 kWh) 0.87 (>1000 kWh)
Energy efficiency managementAn 8% discount for on-time billing15be
C20.48 (<500 kWh) 0.67 (500–1000 kWh) 0.93 (>1000 kWh)High electricity qualityReward 10% of the battery percentage5be
C30.86 (Peak:10:00–12:00, 13:00–19:00) 0.60 (Flat: 06:00–10:00, 12:00–13:00, 19:00–22:00)
0.30 (Valley: 22:00–06:00 next day)
Energy efficiency management8%discount for on-time billing15clogged
C40.80 (Peak:10:00–12:00, 13:00–19:00) 0.63 (Flat: 06:00–10:00, 12:00–13:00, 19:00–22:00)
0.30 (Valley: 22:00–06:00 next day)
High electricity qualityReward 10% of the battery percentage5clogged
Table 4. Recommended ranking results and simulated actual ranking results.
Electricity Sale PackagesThe Recommended Ranking in This PaperSimulated Actual Ranking
C123
C244
C311
C432
Disclaimer/Publisher’s Note: The statements, opinions and data contained in all publications are solely those of the individual author(s) and contributor(s) and not of MDPI and/or the editor(s). MDPI and/or the editor(s) disclaim responsibility for any injury to people or property resulting from any ideas, methods, instructions or products referred to in the content.

