Article

Exploring the Impact of Nature-Based Solutions for Hydrological Extremes Mitigation in Small Mixed Urban-Forest Catchment

by
Lina Pérez-Corredor
1,*,
Samuel Edward Hume
1,*,
Mark Bryan Alivio
2 and
Nejc Bezak
2
1
Institute for Technology and Resources Management in the Tropics and Subtropics, Cologne University of Applied Sciences, Betzdorfer Straße 2, 50679 Köln, Germany
2
Faculty of Civil and Geodetic Engineering, University of Ljubljana, Jamova cesta 2, 1000 Ljubljana, Slovenia
*
Authors to whom correspondence should be addressed.
Appl. Sci. 2024, 14(24), 11813; https://doi.org/10.3390/app142411813
Submission received: 30 October 2024 / Revised: 5 December 2024 / Accepted: 13 December 2024 / Published: 18 December 2024
(This article belongs to the Special Issue Sustainable Urban Green Infrastructure and Its Effects)

Abstract

:

Featured Application

Hydrological modelling using HEC-HMS to model runoff changes associated with different nature-based solutions. The solutions implemented into the model were green roofs, permeable paving and retention ponds.

Abstract

Many regions in Europe face increasing issues with flooding and droughts due to changing rainfall patterns caused by climate change. For example, higher rainfall intensities increase urban flooding. Nature-based solutions (NbS) are suggested as a key mitigation strategy for floods. This study aims to address and mitigate the challenges faced in Tivoli natural park in Ljubljana regarding high peak discharges and low-flow issues in the creek entering the sewer system. The study involves setting up, calibrating and validating a Hydrologic Engineering Centre–Hydrologic Modelling System (HEC-HMS) model using available data. This study analyses NbS, such as small ponds, green roofs and permeable paving, to reduce peak discharge. Runoff was reduced by an average of 32.4% with all NbS implemented and peak discharge by 20 L/s. Permeable parking performed best, with an average runoff reduction of 6.4%, compared to 4.8% for permeable streets and 5.9% for green roofs. The ponds reduced peak discharge, although their effectiveness varied between rainfall events. Rainfall events with higher volumes and durations tended to overwhelm the proposed solutions, reducing their effectiveness. The ability of HEC-HMS to model NbS is also discussed. The curve number (CN) parameter and impervious % alterations to simulate NbS provided quantitative data on changes in runoff and discharge.

1. Introduction

Runoff management has become a key topic in water management in recent times, particularly in the context of urban water drainage, flood management and climate change adaptation [1,2,3,4,5]. Runoff processes determine how much precipitation becomes surface runoff. It is a key hydrological process, and its relevance is emphasised due to the extent to which human activities can alter this process. In both rural and urban areas, land use drastically changes runoff processes [6,7,8]. Different areas and ecosystems experience different issues regarding runoff processes, which can be globally driven.
Climate change and rapid urbanisation are expected to exacerbate the potential negative impacts of runoff [4,5,9]. Extreme storm events are projected to become more frequent and severe [10,11]. The continuous expansion of urban areas leads to greater areas of impermeability [3,5]. Flooding due to sealed surfaces related to urbanisation is present in many built-up areas worldwide [3,12,13]. Often, the flood risk in these areas comes from extreme storm events, where high-intensity precipitation events result in water not being able to infiltrate or drain away. This causes high peak discharges in urbanised sub-catchments. Understanding the behaviour of runoff can help reduce flood risk in these areas and plan possible mitigation measures.
In many cases of runoff management, nature-based solutions (NbS) are frequently being proposed [2,14,15,16,17]. NbS are often preferred to grey infrastructure in environmentally sensitive areas. They help provide cooling, fresh air and a better ambience for locals compared to grey infrastructure [18]. Additionally, NbS typically provide much better infiltration, which can help build drought resilience and maintain ecosystems [19]. Many issues arising from changes in runoff processes come from human activity. NbS aim to mimic natural processes and are being introduced in many cities around the world [20]. They help decrease surface runoff by increasing infiltration, which can benefit groundwater recharge and help maintain environmental flows in dry periods [2,20]. Common examples of NbS include bioswales, permeable paving, green roofs and infiltration trenches [21,22,23,24].
NbS hold great promise, but it is important to quantify the changes in runoff that their implementation would provide. This type of analysis is significant both for the engineers tasked with designing such solutions and for the stakeholders who are involved in such projects. Hydrological modelling is a key tool for quantifying runoff changes under different scenarios. As sustainable runoff management becomes increasingly crucial, runoff modelling is being utilised to gain a deeper understanding of the factors influencing runoff and to predict how changes in a watershed affect these processes, as well as predicting the impact of runoff reduction mitigation measures.
The modelling of NbS is an emerging topic, and therefore, the performance of NbS in different contexts is not fully understood [25,26,27]. The evaluation of NbS performance under extreme events in particular can be developed further [28,29]. Different storms can have unique hydrological responses based on their intensity and duration [30,31,32]. The infiltration methods used in modelling often fail to account for this, leading to inaccuracies [33]. When using the SCS-CN method [34], tailoring the CN values to reflect these characteristics may allow for a better representation of the runoff response and improve model accuracy [35]. New models have been developed for specific cases, and NbS projects have been modelled using pre-existing models. For example, MIKE-SHE can be used for modelling some NbS, such as implementing trees and green roofs [2]. SWMM is commonly used due to its specific modules for NbS modelling, referred to as low-impact developments (LIDs) [14,36,37]. Various NbS have been modelled using HEC-HMS, including rainwater harvesting [38], retention ponds [39], bioswales [40] and changes in land use [39,40].
The aim of this research was to assess the effectiveness of different NbS in runoff and peak discharge management in the study area using hydrological modelling. This was achieved by developing and calibrating a HEC-HMS model of the current situation (baseline scenario) and implementing selected NbS into the basin and analysing the effect on runoff and peak discharge. Based on the results, the best NbS measures to mitigate peak discharge concerns and improve ecological conditions are recommended.

2. Materials and Methods

2.1. Study Area

The study was performed on a small catchment in Rožnik, on the west side of Ljubljana, Slovenia. The catchment is inside a mixed urban-forest area, which extends up into Tivoli Park and forms part of the Krajinski landscape park, a natural heritage area. The forested area has a mix of native pine and birch species [41]. The catchment area is small (0.24 km2) and ranges from 309 to 430 m.a.s.l. in elevation. The terrain is hilly, with an average slope of 38.27%. Figure 1 illustrates the location of the study area within Ljubljana, including land use and water courses in the upper part of the map and elevation in the lower part of the map.
The climate is temperate with a warm summer and no significant dry season (Cfb) [42]. The city has an annual average precipitation of around 1400 mm according to the long-term meteorological data (1970–2022) from the Ljubljana-Bežigrad synoptic station, while the average temperature ranges from 0.3 °C in January to 21.3 °C in July [43]. Thunderstorms are common during summer.
The land cover is largely forest (82%), with some built-up land (13.6%) concentrated in the southern tip of the catchment near the outflow (Figure 1). In this section, the streams are channelised and in one section tunnelled under a paved section and hotel building. There are small patches of grassland and agricultural land, which comprise a small proportion of the land cover (<5%) (Figure 1). Silty clay loam is the predominant soil type.
A recent study by Alivio et al. [32] found that the studied catchment experiences rapid runoff and large runoff volume during heavy and long-duration rainfall events. This observation is attributed to the relatively steep slope and low infiltration capacity of the soil (hydrologic soil group D) in the catchment.

2.2. Methodology

This study investigates the changes in runoff, infiltration and peak discharge associated with implementing selected NbS during storm events in the study area compared to a baseline scenario depicting the current situation. The methodology is illustrated in Figure 2, with further details in the following sections.

2.2.1. Field Measurements

In situ precipitation and discharge data are important to calibrate and validate the hydrological model. Rainfall was measured at a 5 min interval using a tipping bucket rain gauge (0.2 mm/tip, Onset RG2-M) in the open area of a small urban park next to the Department of Environmental Civil Engineering building (46.04° N, 14.49° E) [41,44,45,46,47,48,49]. Discharge was calculated using a rating curve that was obtained from water level and discharge measurements [32]. Water level was measured using a HOBO Fresh Water Level Data Logger at a 10 min interval. Discharge measurement was performed sporadically during high and low flows using a tracer dilution method. The rating curve was then used to convert the water level data to discharge estimates. Baseflow separation was conducted using the Lyne and Hollick method [50] in R software version 4.1.2. Soil moisture was monitored at a 20 min frequency using the Teros 10 sensor (METER Group, Inc. Pullman, WA, USA) with an accuracy of ±3%. The soil moisture sensor was installed very close to the investigated catchment where measurements were performed in the open area and under forest cover (46.052535° N, 14.479135° E).

2.2.2. Datasets Used

The digital elevation model (DEM) [51] allows for the topography of the basin to be analysed. Based on the DEM, it is possible to delineate the basin and determine the main channel. Once the main channel is identified, the length and the distance from the centroid can be calculated, which is a necessary data input for calculating the unit hydrograph parameters. Land use and land cover (LULC) is a valuable tool for assessing the characteristics of a watershed and understanding its behaviour during flooding. The LULC data from the Slovenia Ministry of Agriculture, Forestry and Food (MKGP) [52] are used for the study. Additionally, field visits were conducted to refine LULC classifications. Soil type data are provided by the MKGP [53].

2.2.3. Hydrological Modelling

HEC-HMS is a well-known rainfall-runoff model developed by the US Army Corps of Engineers. It is widely used in hydrological modelling, as it requires fewer input parameters than some other physically based models [54]. The relatively modest data requirements allow for HEC-HMS to be applied in many scenarios and case studies worldwide [55,56,57].
HEC-HMS is selected for this study due to a large literature base of different applications of the software and for its ability to quantify changes in runoff volume and infiltration volumes, as well as peak discharge [40,54,58]. Simulating the implementation of different NbS can be performed by changing the CN parameter and impervious % [39,40] or by implementing sinks or reservoirs [38].
Ten precipitation events and corresponding discharge and soil moisture data were selected to represent a range of precipitation volumes and intensities. The moisture level of the soil determines how much water the soil can absorb. It is used to categorise the soil’s antecedent moisture condition (AMC) as wet, dry or at an intermediate level.
The Snyder method was used to determine the lag time (tp) parameter, based on the following Formula (1) [59]:
t p = 0.75 C t ( L L c ) 0.3
where tp = lag time (hrs); Ct = catchment coefficient; L = length of the main stream (km); Lc = length from the nearest point on the stream to the centroid to the outflow point (km). Both L and Lc were calculated using GIS from the outputs of the stream definition from the delineation. The centroid was calculated using “calculate geometry” in the attribute table of the watershed polygon for Lc. Ct was estimated to be 3.5.
The peaking coefficient (Cp) was then estimated by calculating the peak discharge (qp) from the lag time using Equations (2) and (3):
q p = 4.1515 t p 0.92
C p = q p t p 6.992
The curve number (CN) is an important parameter for hydrological design. CN was calculated using the LULC and soil type. Field visits were conducted to refine LULC classifications. ArcGIS Pro was used to intersect the LULC with the soil classes, and the CN for each combination was chosen based on CN tables from SCS TR-55 [60]. The average CN for each sub-catchment was then calculated and adjusted for the AMC of each event. In addition, the impervious % was also calculated by digitalising the buildings and paved surfaces in the catchment from satellite imagery.

2.2.4. Model Set-Up and Calibration

The model was set up with the two sub-basins defined in the delineation process. They connect at a junction, which is also the outflow point of the catchment. The 10 rainfall events were used independently to optimise the parameters to accurately model each event, with a focus on replicating the peak discharge while also meeting the accuracy parameters defined by Moriasi (2015) [61]. The parameters selected were lag time, peaking coefficient and CN. The “Optimisation Trial” tool in HEC-HMS was used with further manual calibration to obtain the highest accuracy. Calibration was performed for each event individually to best represent the hydrological response to each storm event.

2.2.5. Selection of Nature-Based Solutions

The Center for Neighbourhood Technology (CNT) has created a quantitative tool called the Green Values Calculator to compare the water and financial costs and benefits of multiple green infrastructure measures with those of conventional stormwater management [62]. This tool was used to identify the three most effective nature-based solutions based on the specific characteristics of the watershed. A detailed explanation of the process is provided in the Supplementary Material. Permeable paving systems have been shown to significantly improve infiltration [63,64]. Green roofs were also selected, with 15 cm substrate depth, due to favourable results from previous studies [36,65].
The implementation of ponds as NbS can be relevant for the regulation of stormwater runoff, even though individually, they have a limited storage volume. However, the cumulative capacity of these ponds can efficiently regulate the runoff of large impermeable surfaces. Pond storage capacity during prolonged dry periods can be increased due to soil infiltration and evapotranspiration, allowing for greater retention of water and nutrients in subsequent events, thereby reducing outflows and improving water management in dry seasons [66,67]. Therefore, ponds were also considered for evaluation in the hydrological model.
Site assessments were used to identify suitable locations for potential NbS implementation. Focus was put on the impervious surfaces and possible locations for retention ponds. Flat roofs were identified for adding green roofs. Roads and car parks were selected for permeable paving. An existing pond and two natural depressions in the terrain were identified as possible retention pond locations. The scenarios that were modelled are based on these solutions and possible combinations of them (Figure 3).

2.2.6. Scenario Modelling

Potential solutions for the catchment were investigated, mainly focusing on the built-up area and increasing retention capacity. The scenarios cover different combinations of NbS, including green roofs, permeable paving and ponds (Table 1).
The prevailing method for modelling design discharges for infrastructure design is to use one set of parameters, calculated from the calibration and validation process. In this case, the calibrated parameters repeatedly failed the validation process. As the focus of this study is changes in peak discharge and runoff, the decision was made to model each event individually with different parameters. Therefore, the model was calibrated to each rainfall event individually using the method outlined in Section 2.2.4. The use of different CN values for each event can be substantiated by the fact that the CN derived from observed rainfall-runoff data varies significantly between storm events, since the selected storm events vary greatly in terms of total rainfall amount, intensity and duration [32,68,69]. Significantly, Alivio et al. (2024) [32] showed that the CN of the studied catchment varied greatly between storm events, ranging from 63.6 to 97.4, with observed seasonal variability. This correlates with the CN parameters determined from the calibration in this study (Table 2), which show a similar range. This suggests that the catchment is reactive, meaning heavy rainfall events can alter the hydrology, which changes the runoff patterns. Modelling each event with different parameters allowed for accurate representations of the varied hydrological response and discharges for each event, thus achieving a better representation of the impact of each NbS scenario.
For Scenarios 1–3, which involved green roofs and permeable surfaces, adjustments were made to the CN parameter and the impervious % to represent the change in land cover. Based on a literature review, a CN of 90 was selected for green roofs [70,71] and 62 for permeable paving [24,72]. The areas where land cover would change in each scenario were calculated, and the updated CNs for the new surfaces were incorporated into the sub-catchment CN calculation (Table 2). The implementation of green roofs utilised only a change in impervious %, as the CN of green roofs is the same as that used for the built-up area. A calculation of the reduction that each NbS results in in the CN and impervious % is then applied to the baseline parameters of each event. Scenario 4 uses the cumulative CN and impervious % reductions associated with the implementation of Scenarios 1–3 simultaneously.
In Scenarios 5 and 6, the modelling approach differed with the inclusion of ponds. These were implemented using the Reservoir tool in HEC-HMS. For Scenario 6, the impervious % and CN were also implemented to consider the other scenarios. The Reservoir tool required a storage function, for which elevation–area curves were calculated from the elevation data and imported into the model. The outflow structures were designed and adjusted using the results of the model runs.

2.2.7. Percent Change in Runoff Volume and Peak Discharge

When analysing a simulation model, the percentage of change helps assess the efficiency of a process in managing runoff volume compared to volume losses. By calculating the percentage of change for different scenarios, one can compare how different configurations, interventions or changes in the initial conditions affect the relationship between volume losses and runoff volume.
To calculate the percent change, the following formula was used:
P e r c e n t   C h a n g e = O r i g n a l   R u n o f f   V o l .     S c e n a r i o   R u n o f f   V o l . O r i g n a l   R u n o f f   V o l . 100

3. Results

Model Calibration
Calibration of the model was performed independently for each of the 10 rainfall events to best represent the peak discharge and runoff volume. The events included a variety of durations and intensities (Table 3). An NSE value greater than 0.50 indicates that the model has acceptable predictive capability [47], showing that the model effectively replicates the observed runoff and flow patterns for all evaluated events. PBIAS measures the average tendency of the model to overestimate or underestimate the observed values. PBIAS values within the range of ±25% to ±50% are considered acceptable, according to the criteria of Moriasi et al. [
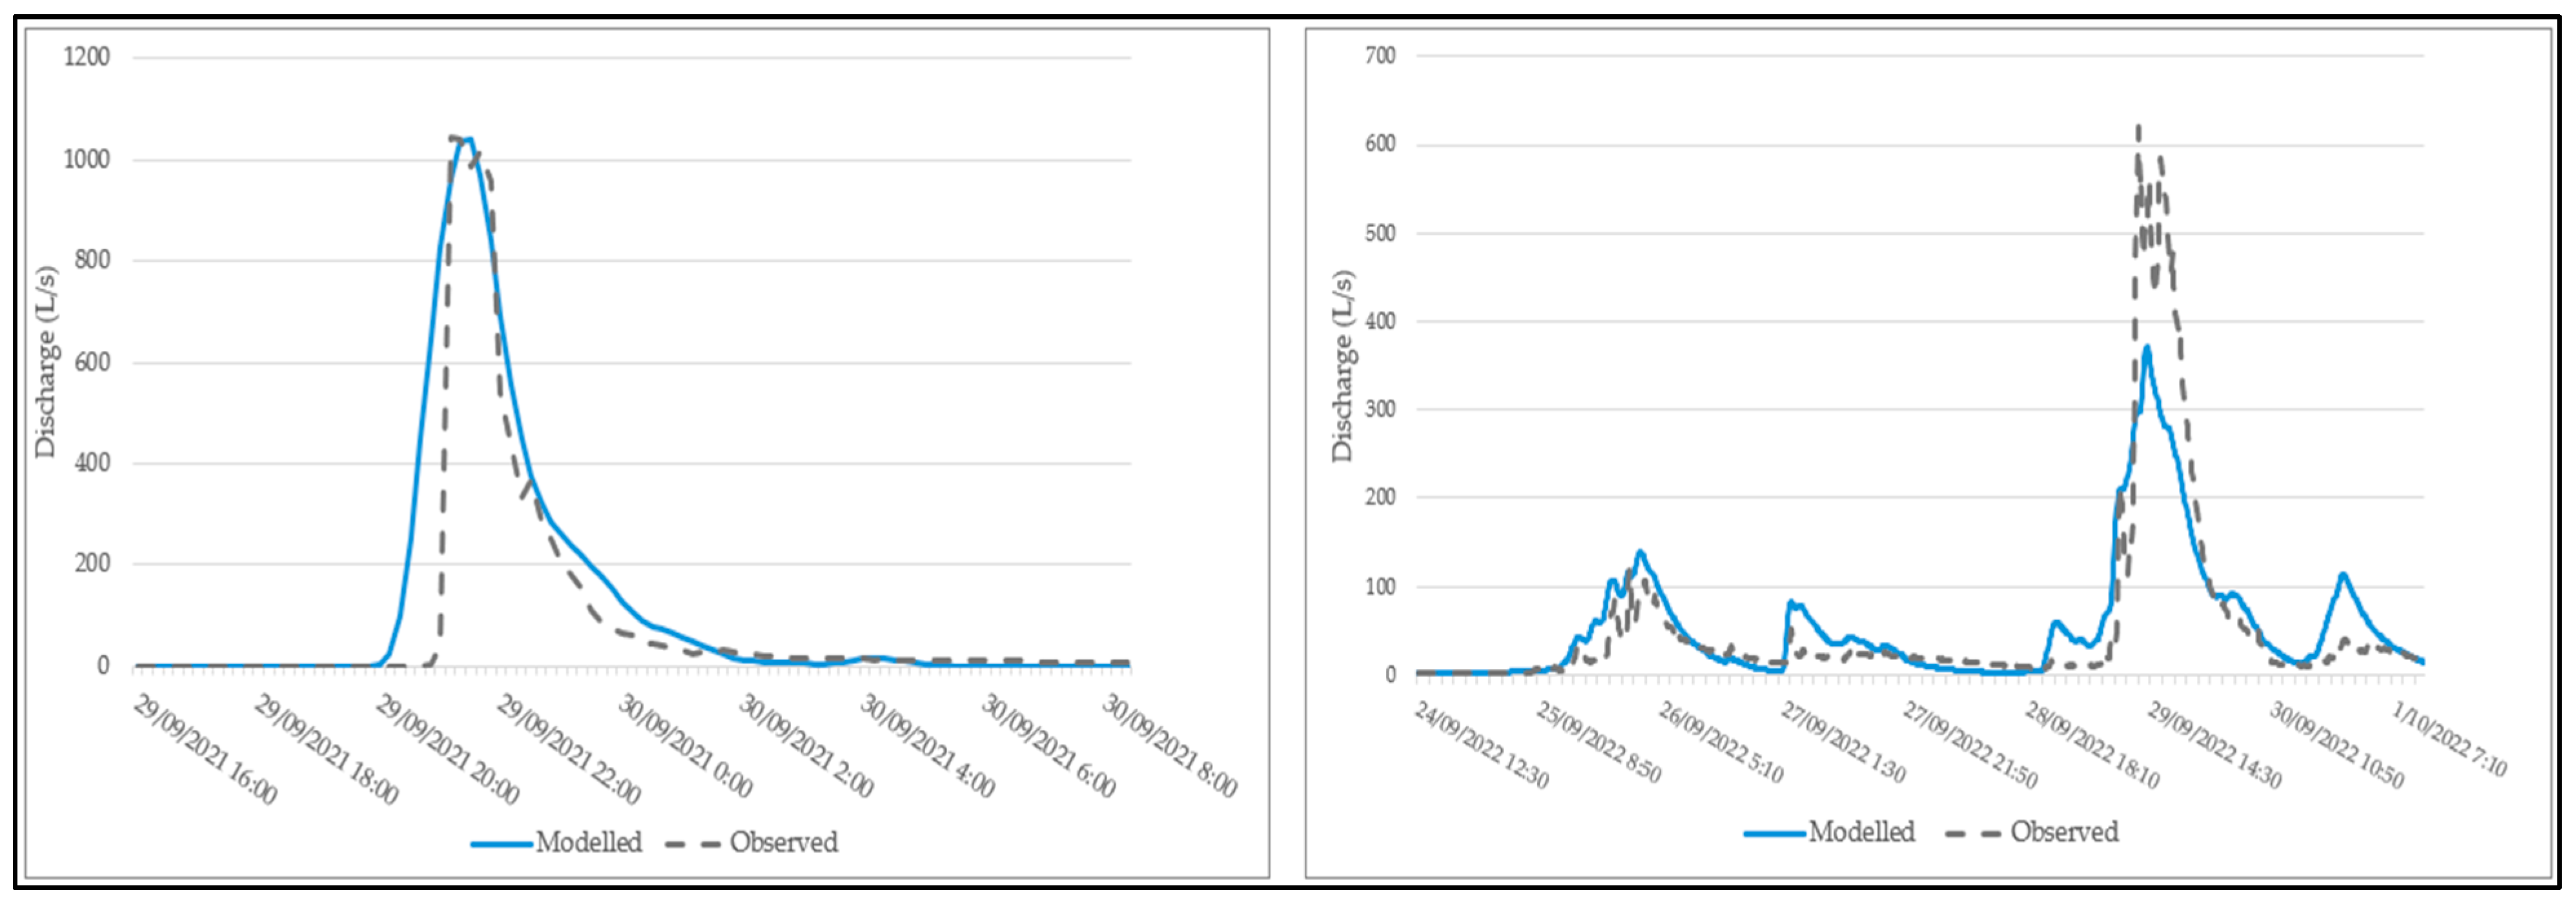
47]. Negative values indicate that the model tends to systematically overestimate flow or runoff. In all events, the calibrations resulted in an adequately accurate model that also retained realistic parameters for the basin.
The statistics, including the root mean square error (RMSE), Nash–Sutcliffe efficiency (NSE) and percent bias (PBIAS), for each event are summarised in Table 4, and examples of observed and modelled hydrographs from the calibration are shown in Figure 4.
The implementation of different scenarios enables the performance of different NbS to be evaluated in terms of efficiency, providing a more complete view on which solutions are most effective in controlling the flow and mitigating the flood risk in each specific context.
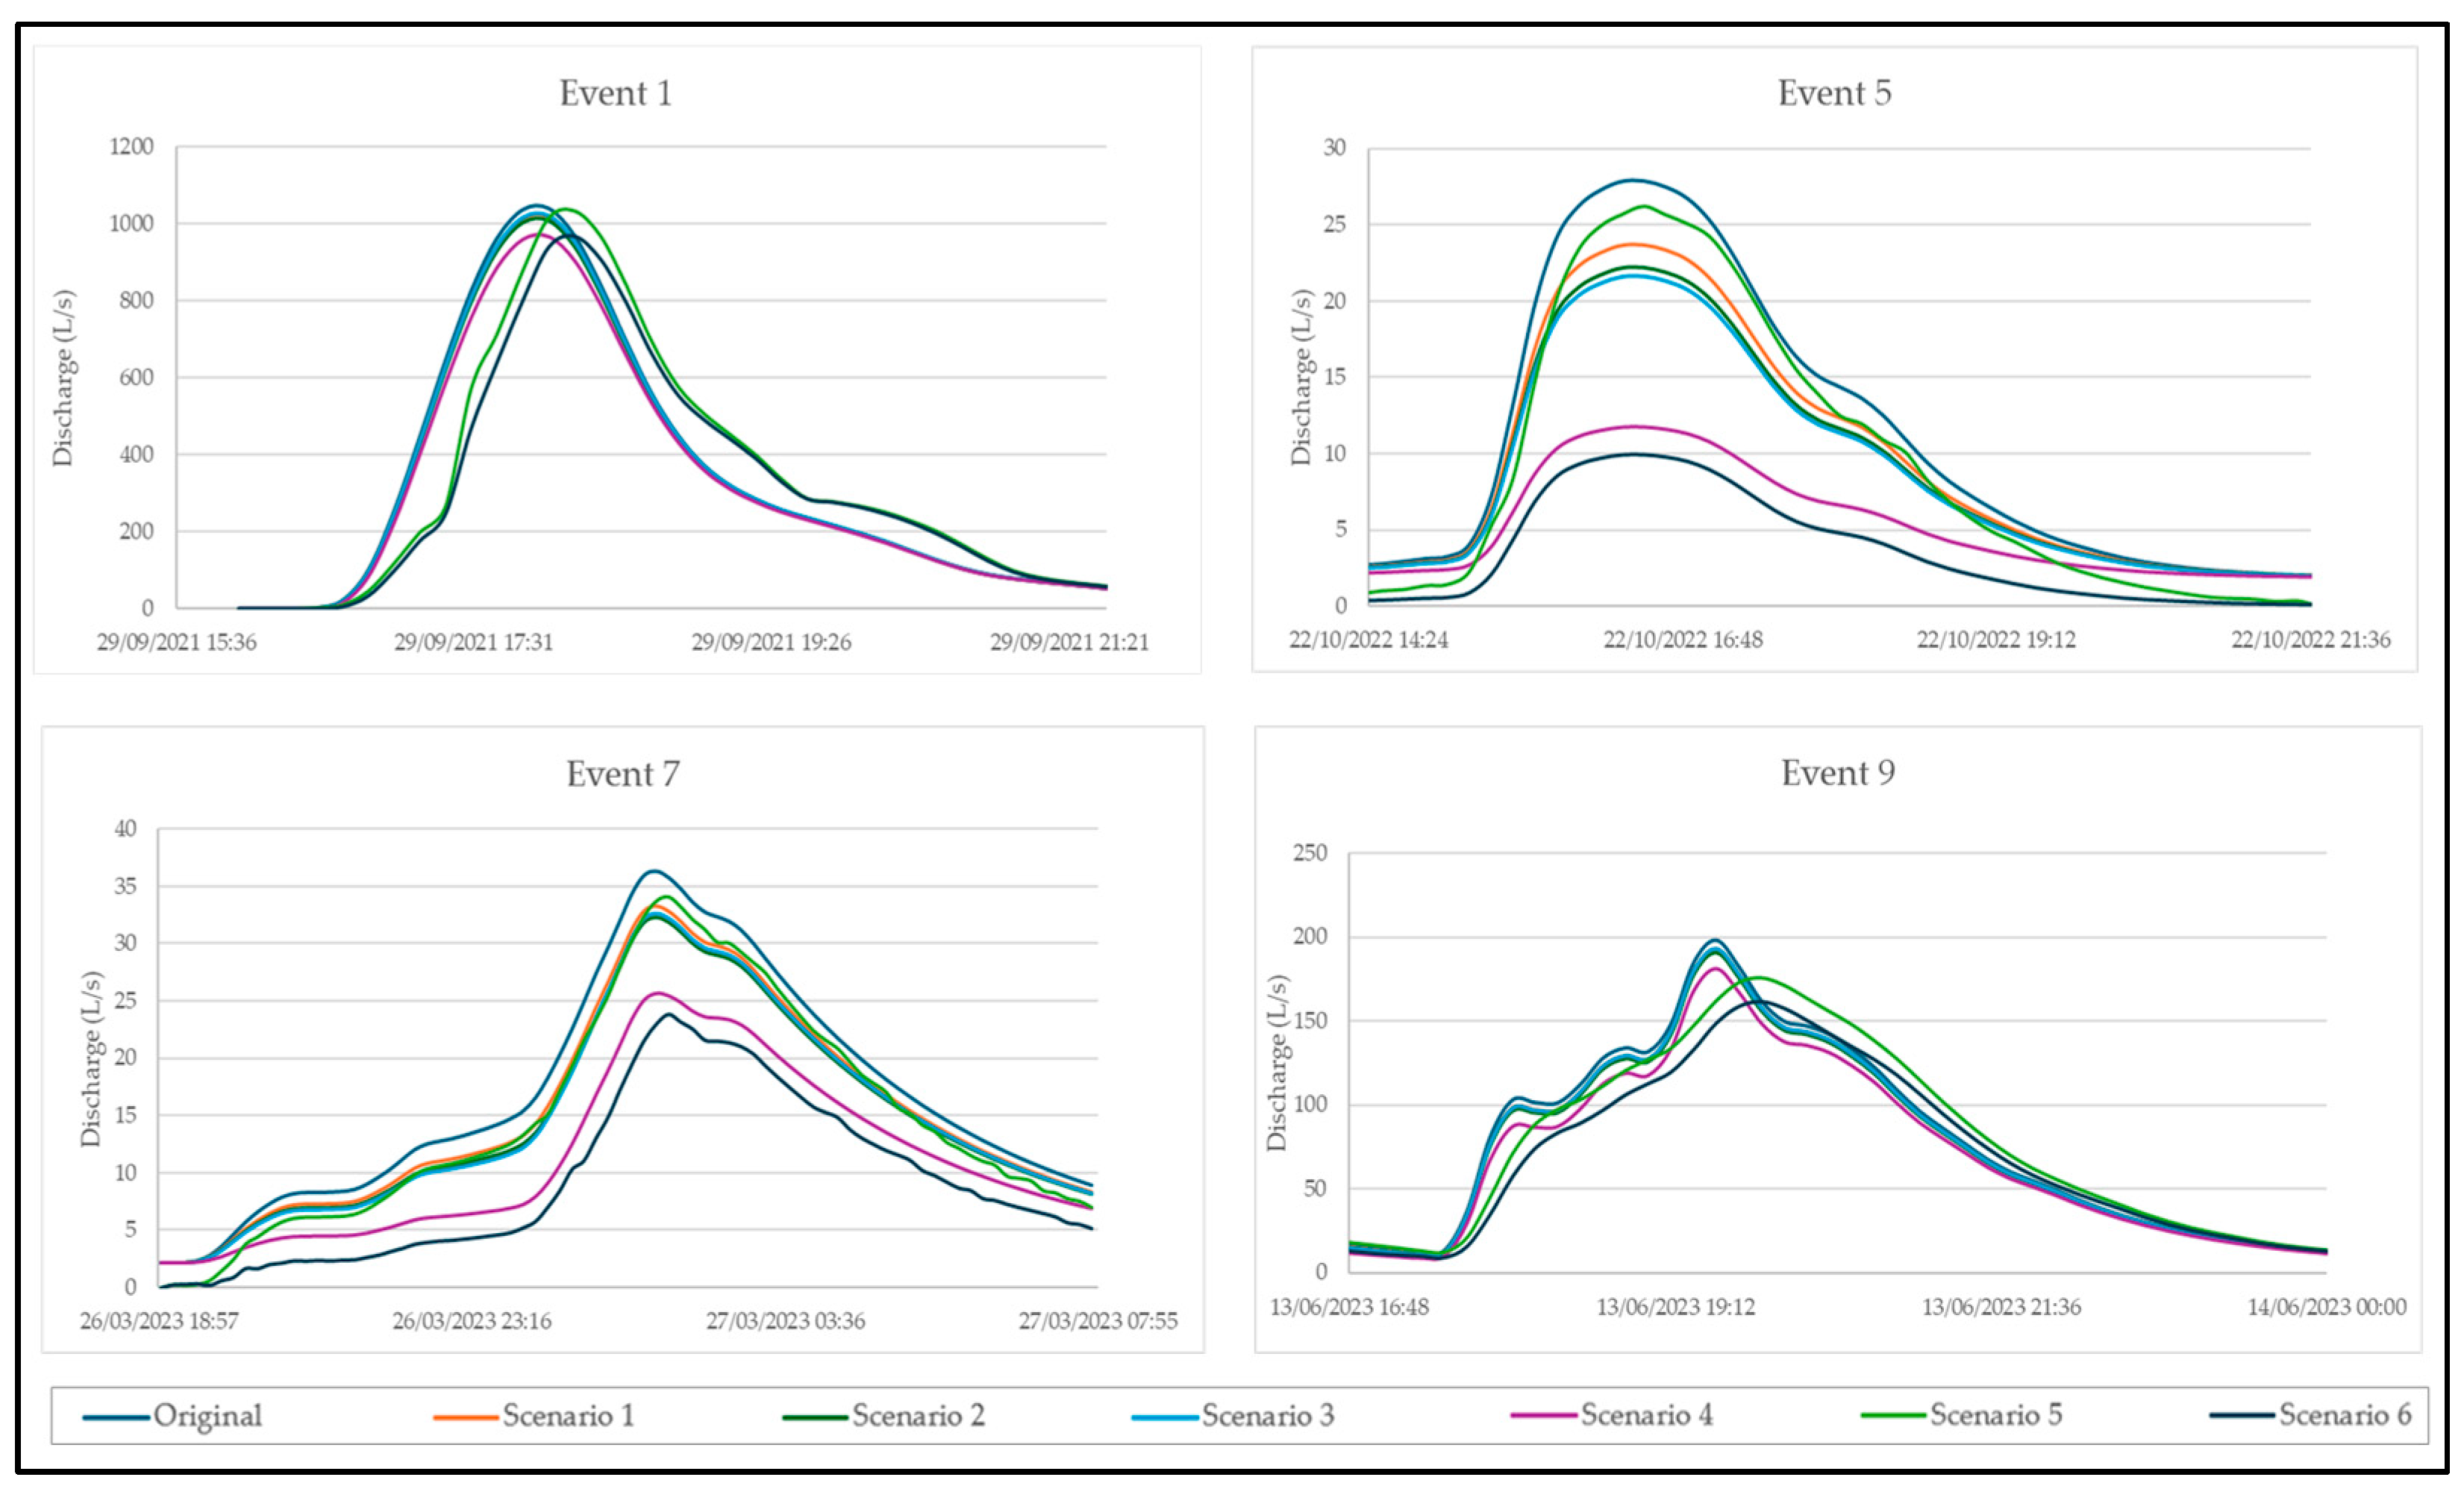
The graphs for the four events show the discharges for each of the scenarios compared to the value for the scenario without any implementation (Figure 5). For smaller events, such as Event 5 and Event 7, a significant difference in discharges is observed, which can be attributed to the ability of NbS to manage smaller flows more effectively. All events showed a reduction in flow for most scenarios. In particular, Scenario 6, which included the implementation of all NbS, showed the largest decrease in discharge, evidencing its effectiveness in controlling flow.
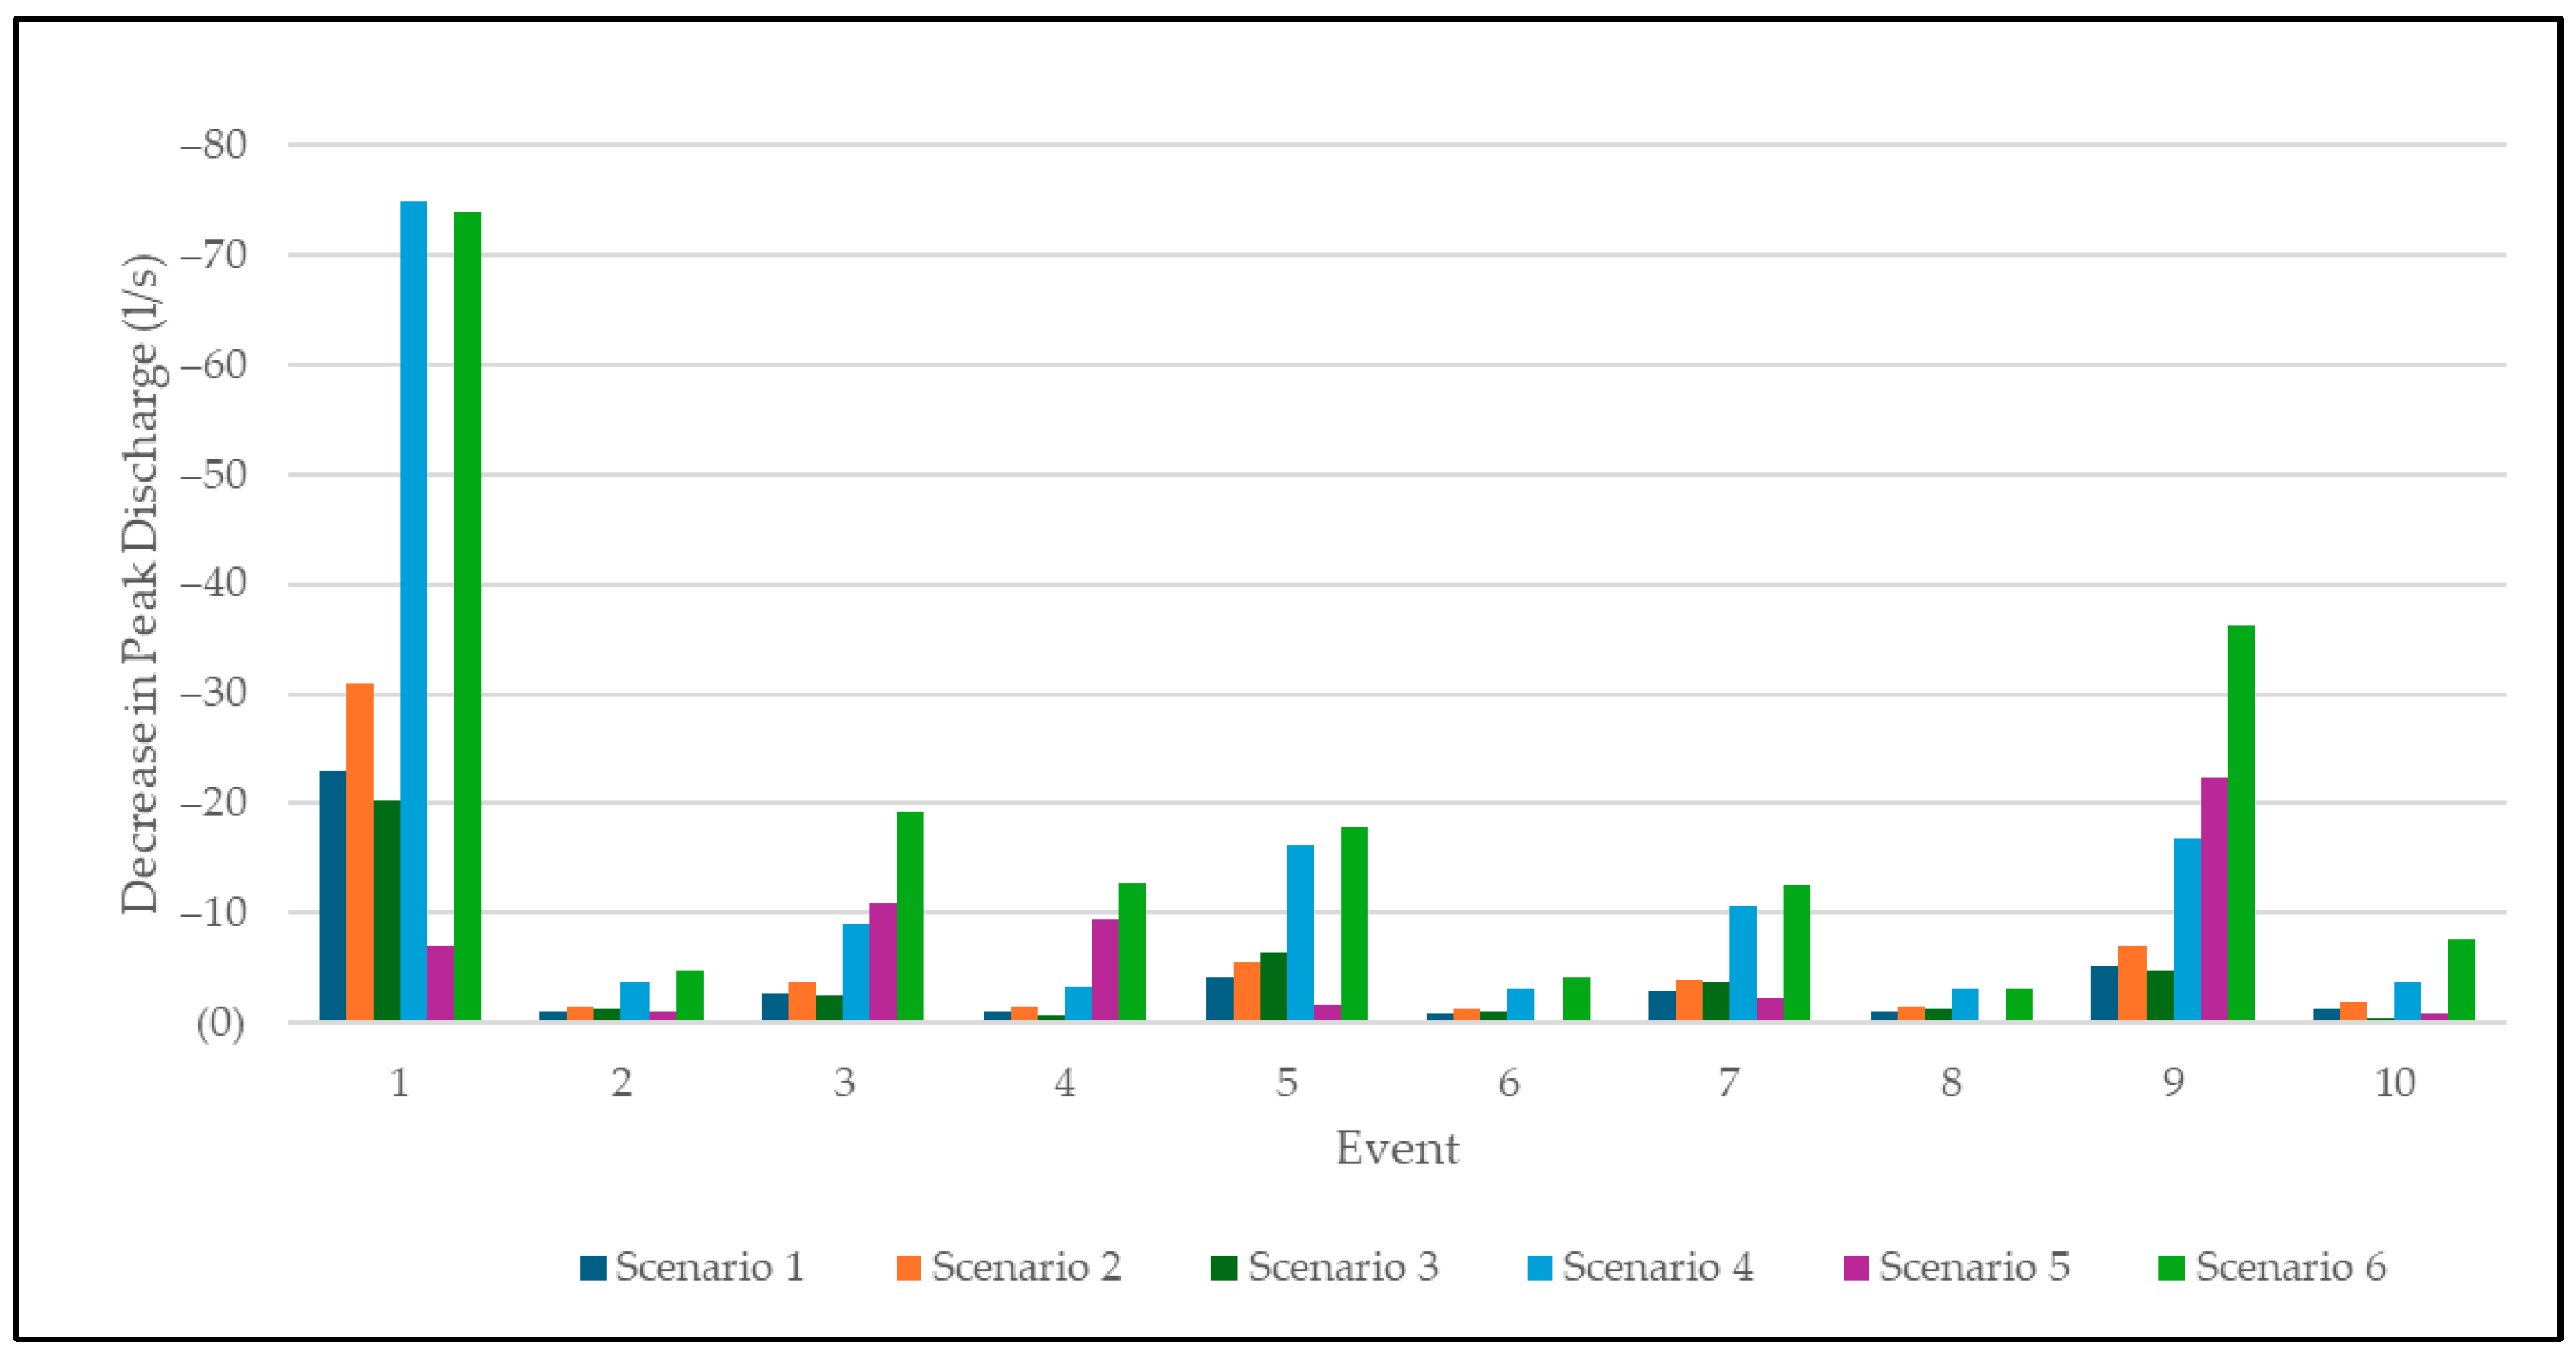
The biggest decrease in peak discharge between scenarios was observed in Scenario 4 in all events, except Event 1 (Table 5; Figure 6). The scenarios for individual solutions had minimal impact on peak discharge, although Scenario 2 (permeable parking) performed slightly better than the permeable streets and green roof. The degree to which the peak discharge was reduced varied greatly between the modelled events and did not appear to be influenced by the magnitude of the original peak discharge of the event. However, the best performance was observed in Event 1, which had the highest original peak discharge.
Table 6 shows the percentage decrease in surface runoff compared to the “No solutions” scenario for each event. Scenarios 5 and 6 are not included, as surface runoff volume is not affected by the ponds. The ponds’ effects are instead a result of water storage, affecting the peak discharge and lag time. Hence, storing water in ponds can significantly slow the runoff process, and the water can potentially be used for other purposes as well. In all events, the percent decrease showed that the applied strategies are effective in reducing runoff, either by increasing water retention or infiltration. This effect is particularly noticeable in Events 2, 5 and 6, where the percent change values are high, suggesting a considerable improvement in water management compared to the “No solutions” scenario.
Scenario 4 consistently stands out due to its high impact on percent change, showing better values in most events compared to other scenarios. This suggests that the combination of all NbS in this scenario is effective in reducing runoff volume and increasing water retention. Events 10 and 4 exhibit a smaller decrease in percentage change. However, this behaviour may be linked to the intensity and magnitude of the event. In Scenario 1, there were relatively small reductions in runoff, with the largest reduction occurring in Event 5. Scenarios 2 and 3 present similar results, although Scenario 3 is less effective in certain events.
The scenarios evaluated in Table 7 indicate how implementation of the scenarios can influence the timing of peak discharge. For example, delaying the peak (as in the events in Scenario 3) can help distribute the volume of water in a more manageable way. In contrast, Scenario 4 shows no changes in delay time compared to Scenario 1, in which no interventions were applied. Events 2 and 5 also showed no changes in delay time, while the other events showed variations in a range of between 10 and 40 min.

4. Discussion and Possible Study Limitations

The results of the model allowed for a comparison of the NbS using the changes observed in runoff and peak discharge. All NbS combinations were associated with a decrease in runoff volume, along with a decrease in peak discharge. Multiple scenarios also showed a delay in the peak discharge. These results from the model suggest that the proposed NbS could be an effective way of mitigating the issues with runoff management in the study area.
When comparing the three solutions implemented in the east sub-catchment separately, Scenario 2 (permeable parking) presents the best results in terms of percent change in runoff volume. It presents the highest runoff reduction in Scenarios 1–3 in 9 out of the 10 simulations. This trend is also reflected in the effect on peak discharge. In all events, the use of permeable parking is more effective in reducing peak discharge compared to the other two solutions. In this case study, the parking area represents the largest single impervious area. Restoring permeability thus leads to the largest reduction in runoff and peak discharge of the modelled solutions. This finding is important because it indicates that this specific solution could be effective in similar contexts, where a small catchment has a significant area of permeability and shares specific characteristics of the terrain and the storm event. In this case, permeable parking is shown as most effective in flood mitigation.
The ponds reduced the peak discharge significantly in most cases and therefore helped overall performance when combined with the other NbS. Scenario 6 was the best performing scenario overall. The behaviour of the ponds and their impact on peak discharge changed between events and showed little correlation with the characteristics of each precipitation event. The ponds demonstrated a slight increase in lag time in most events due to water being stored in the ponds. The delay in discharge peak was between 0 and 40 min across the rainfall events compared to the “No solutions” scenario. In addition to delaying the peak, the ponds delayed the rising limb of the hydrographs and reduced the reactivity of the basin to precipitation. The hydrograph from Event 9 (Figure 5) showed a smoother discharge curve as a result of water storage from pond implementation. The results of this study align with a previous work showing that ponds help reduce the peak discharge, smoothing and distributing floods over time and providing more time for infiltration [73].
Scenarios 4 and 6 with all NbS implemented had the highest runoff % reduction for all simulations, and Scenario 6 performed best in reducing peak discharge. These findings emphasise the importance of implementing multiple solutions. This supports other literature works on nature-based solution analysis [2,70,74] and the “sponge-city” concept [20,75].
Notable changes in runoff were observed when changing the impervious % parameter across the scenarios, especially in Scenario 3, where green roofs were modelled only by altering this parameter and not the CN. This highlighted the importance of this parameter in HEC-HMS models, as well as the overall significance of impervious surfaces in runoff processes. The results reaffirm the choice of NbS over grey infrastructure due to the reduction in impervious area, one of the main benefits associated with NbS.
As well as the changes in runoff and peak discharge, the NbS used in this study have differing levels of ecological benefits. Permeable paving does not contribute much to habitat provision compared to green roofs and ponds [76]; therefore, although it is most effective in reducing runoff, it is not recommended as an independent solution due to the study area being part of a natural heritage site.
In very high rainfall events like Events 3, 4 and 10, the capacity of the implemented solutions to mitigate runoff volume may be overwhelmed, resulting in a lower reduction in runoff volume. Although the infiltration volume is increased, it can only be increased by a certain level, and once the saturation point is reached, the runoff rates will be high. This issue is also reflected in the changes in peak discharge. While the peak discharge volume is consistently reduced, this reduction in high discharge events is comparably small. Although the strategies may be effective in moderate rainfall, their effectiveness decreases when faced with extreme and prolonged rainfall events.
Events 1 and 3 resulted in differing performance of the NbS, likely due to large differences in precipitation intensity. Both are extreme rainfall events, with Event 1 having a return period (RP) of >100 years and Event 3 having a RP of >250 years. However, Event 1 has a very short duration (<8 h), whereas Event 3 is much longer (>50 h). While Event 3 has more rainfall in total, its lower average intensity (5.04 mm/h) allows the implemented solutions to work more efficiently by having more time to infiltrate and manage the water. In contrast, in Event 1, the higher average rainfall intensity (11.42 mm/h) causes a rapid accumulation of runoff, overcoming the capacity of the solutions to reduce the runoff volume, resulting in a smaller abatement. This highlights the difference in NbS response depending on the nature of the event. The CN method factors in precipitation intensity when calculating runoff volume [34], which may explain this relationship.
The modelled reductions in runoff volume appear to change with the starting CN. This is apparent when the results from Events 3 and 10 are considered. They have comparable original runoff volumes (Table 5), but the NbS perform very differently. Event 10 sees a runoff volume reduction of 1.4% with all NbS, whereas Event 3 has a reduction of 18.3% for the same scenario. Event 3 has an average precipitation intensity of 5.04 mm/hr, and Event 10 has an average precipitation intensity of 1.95 mm. This contradicts the idea that higher intensities reduce the effectiveness of the NbS. A possible cause is the starting CN of the two models. Event 3 has the lowest starting CN of all models, with 36. Event 10 has the highest starting CN, with 88 (Table 2). Both deviate significantly from the average calibrated CN of 66.43 across all events. Therefore, the CN changes due to NbS implementation represent a greater proportion in terms of reduction in Event 3 than in Event 10 (a reduction in CN of 2.44% and 1.00%, respectively).
This research supports existing literature on the potential of NbS for runoff management. The green roofs in this study had a moderate impact, which varied with rainfall volume. This result correlates strongly with a study performed in Denmark, which showed very similar decreases in runoff volume [77]. Permeable paving had the best performance in this study and was shown to be effective in other locations. In a case in Australia, permeable paving reduced the peak flows by 7–16%, which is comparable to the results in this case study [78]. The limited effectiveness of retention ponds correlates with a similar modelled implementation in southeastern US [79]. However, retention pond effectiveness varies greatly depending on the dimensions used and the dynamics of the watershed they are implemented in. Large-scale NbS, such as land use changes, tend to perform well [39,40]; however, they are not applicable to small watersheds, such as in this case study. For small urban catchments, a combination of small-scale measures is often the most effective solution [2,80], a statement, which this study also supports.
The outflow structures allowed for relatively high discharges in order for the model to function. This resulted in ponds not appearing as effective at reducing peak discharges and not providing water storage for longer durations, as water flowed out of the ponds immediately. Gates on the outflow structures are suggested, so that the discharge can be more closely regulated, which could be especially beneficial for maintaining water storage both on the surface and by recharging groundwater, so that the ponds can also serve an ecological purpose [81]. Gates are a function in HEC-HMS but were not integrated into the model in this study.
The field measurements showed that runoff volumes from different rainfall events were inconsistent, with the proportion of effective rainfall to total precipitation changing significantly. The potential causes of this are changes in water storage in the catchment or changes in season. As the majority of the catchment is forest, the effects of leaves on the throughflow may alter runoff processes [41,45,46]. The existing depressions in the topography may also contribute to this, and it is likely these storage functions also change seasonally. These inconsistencies meant harmonised parameters for the model that provided a good fit for all events were unable to be obtained.
The limitations of this study relate to the previously mentioned problems with calibration. Furthermore, HEC-HMS lacks specific functionality to implement NbS. In this case, the CN values and changes in impermeability were used as approximations. This implies that the exact locations of the solutions are not represented in the model, which could lead to variations in the results. Additionally, the absence of a change in the CN parameter for green roofs means that the model does not reflect the lagged runoff response compared to ordinary roofs. Although green roofs did not alter the CN, they achieved a reduction in runoff almost comparable to that of the permeable car park. This can be explained because the impervious data in this case are crucial, since the implementation of green roofs is the one that reduces the impervious area most compared to other solutions.

5. Conclusions

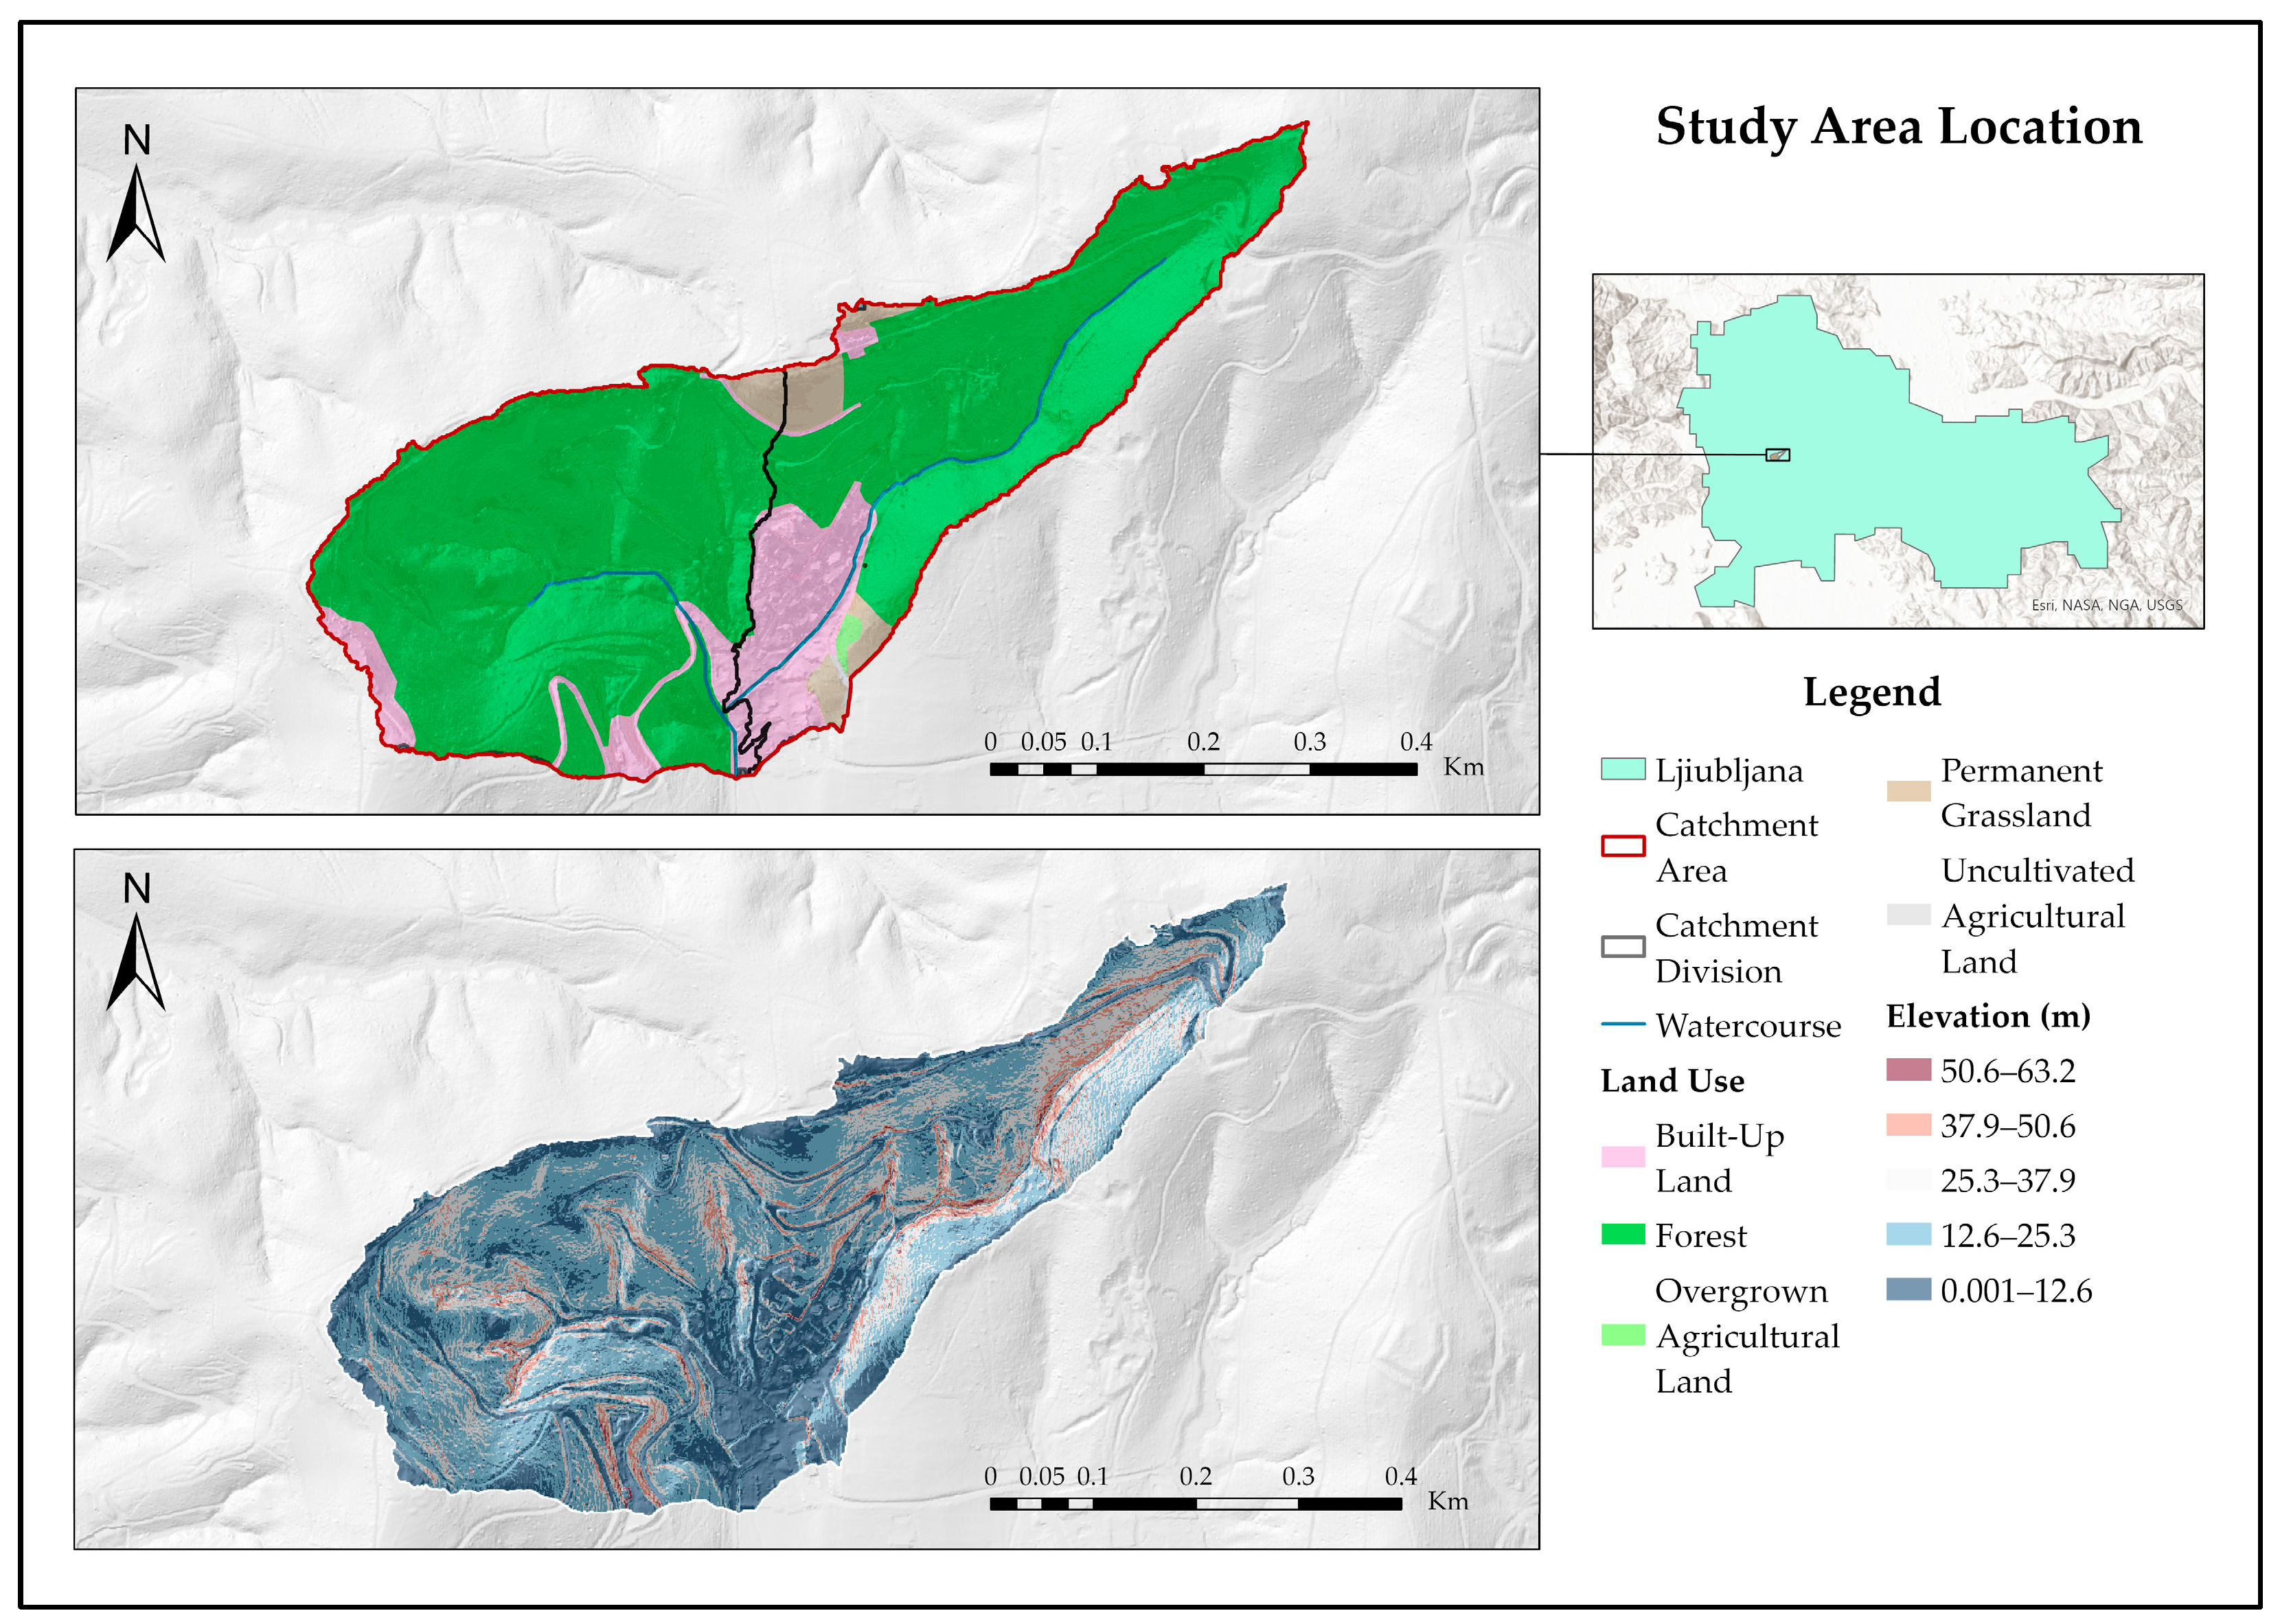
This study addressed the challenges related to high peak discharges and low-flow issues in the creek that enters the sewer system in the study area (i.e., Ljubljana, Slovenia). The analysis was conducted using HEC-HMS, evaluating different scenarios incorporating various nature-based solutions (NbS), as well as combinations of these solutions.
The implementation of permeable parking (Scenario 2) was the most efficient individual solution in reducing both runoff volume and peak flow in most simulations compared to green roofs, permeable streets and retention ponds. This is because permeable parking is key to reducing runoff by restoring permeability. Event 1 exhibited the greatest reduction in peak discharge, particularly in Scenarios 4 and 6, with a decrease of more than 70 l/s. Scenario 6, which combined all proposed nature-based solutions (NbS), was shown to be the most effective overall, with the largest reduction in peak flow. The implementation of multiple NbS is important for maximising benefits. Ponds were effective at increasing the lag times in most cases, helping to increase water storage and reduce peak discharges. The events that showed the best response to NbS implementation were small or shorter precipitation events. The impact was smaller for more extreme precipitation events with higher durations. Extreme rainfall volumes appeared to overwhelm the proposed solutions, as they became saturated part way through the event, at which point they lost their effectiveness.
Ponds can be effective in reducing peak flows under certain conditions, but their storage capacity is limited during extreme rainfall events, and they require improvements in flow control (e.g., outflow gates) to maximise their effectiveness, which were not considered in this study.
It was found that changing the impervious % for each scenario had an important impact on runoff and discharge. This highlights the benefit of NbS in terms of breaking up sealed urban areas and reflects a key benefit of NbS over grey infrastructure. The importance of this parameter in hydrological models is also reinforced.
HEC-HMS is a hydrological modelling software that, through adjustments to the CN and impervious areas, provides valuable insights into the impact of different infrastructures. Although HEC-HMS offers a useful approximation, exploring other hydrological models may improve the accuracy of the results and facilitate comprehensive performance evaluations of NbS.

Supplementary Materials

The following supporting information can be downloaded at: https://www.mdpi.com/article/10.3390/app142411813/s1, Figure S1: Calibration performance of the model for Event 2; Figure S2: Calibration performance of the model for Event 3; Figure S3: Calibration performance of the model for Event 5; Figure S4: Calibration performance of the model for Event 6; Figure S5: Calibration performance of the model for Event 7; Figure S6: Calibration performance of the model for Event 8; Figure S7: Calibration performance of the model for Event 9; Figure S8: Calibration performance of the model for Event 10; Figure S9: Elevation–area curve for southeast (SE) pond; Figure S10: Elevation–area curve for northwest (NW) pond; Figure S11: Elevation–area curve for existing pond; Table S1: Pond dimension and design parameters; Table S2: Evaluation matrix of nature-based solutions; Table S3: Final evaluation of natured-based solutions matrix with weighted percentages; Text T1: Selection process for natured-based solutions.

Author Contributions

Conceptualisation, L.P.-C., S.E.H. and N.B.; methodology, software, validation, formal analysis, investigation, resources, data curation, writing—original draft preparation, visualisation, L.P.-C. and S.E.H.; writing—review and editing, L.P.-C., S.E.H., N.B. and M.B.A.; supervision, N.B. and M.B.A.; project administration, N.B.; funding acquisition, N.B. All authors have read and agreed to the published version of the manuscript.

Funding

The study was conducted within the scope of the lead agency project “Evaluation of hazard-mitigating hybrid infrastructure under climate change scenarios” funded by the Czech Science Foundation and the Slovenian Research and Innovation Agency (ARIS) (Grant ID: J6-4628).

Institutional Review Board Statement

Not applicable.

Data Availability Statement

Data can be obtained by contacting the authors marked for correspondence.

Acknowledgments

The authors would like to acknowledge the Slovenian Environment Agency (ARSO) for making the data publicly available. We thank the reviewers for their contributions to the paper.

Conflicts of Interest

The authors declare no conflicts of interest.

References

  1. Lavtar, K.; Bezak, N.; Šraj, M. Rainfall-Runoff Modeling of the Nested Non-Homogeneous Sava River Sub-Catchments in Slovenia. Water 2020, 12, 128. [Google Scholar] [CrossRef]
  2. Zölch, T.; Henze, L.; Keilholz, P.; Pauleit, S. Regulating Urban Surface Runoff through Nature-Based Solutions—An Assessment at the Micro-Scale. Environ. Res. 2017, 157, 135–144. [Google Scholar] [CrossRef] [PubMed]
  3. Xu, Z.; Zhao, G. Impact of Urbanization on Rainfall-Runoff Processes: Case Study in the Liangshui River Basin in Beijing, China. In Proceedings of the IAHS-AISH Proceedings and Reports; Copernicus GmbH: Göttingen, Germany, 2016; Volume 373, pp. 7–12. [Google Scholar]
  4. Anache, J.A.A.; Flanagan, D.C.; Srivastava, A.; Wendland, E.C. Land Use and Climate Change Impacts on Runoff and Soil Erosion at the Hillslope Scale in the Brazilian Cerrado. Sci. Total Environ. 2018, 622–623, 140–151. [Google Scholar] [CrossRef] [PubMed]
  5. Saraswat, C.; Kumar, P.; Mishra, B.K. Assessment of Stormwater Runoff Management Practices and Governance under Climate Change and Urbanization: An Analysis of Bangkok, Hanoi and Tokyo. Environ. Sci. Policy 2016, 64, 101–117. [Google Scholar] [CrossRef]
  6. Mohammad, A.G.; Adam, M.A. The Impact of Vegetative Cover Type on Runoff and Soil Erosion under Different Land Uses. Catena 2010, 81, 97–103. [Google Scholar] [CrossRef]
  7. Sajikumar, N.; Remya, R.S. Impact of Land Cover and Land Use Change on Runoff Characteristics. J. Environ. Manag. 2015, 161, 460–468. [Google Scholar] [CrossRef] [PubMed]
  8. Sun, Z.; Li, X.; Fu, W.; Li, Y.; Tang, D. Long-Term Effects of Land Use/Land Cover Change on Surface Runoff in Urban Areas of Beijing, China. J. Appl. Remote Sens. 2014, 8, 084596. [Google Scholar] [CrossRef]
  9. Kling, H.; Fuchs, M.; Paulin, M. Runoff Conditions in the Upper Danube Basin under an Ensemble of Climate Change Scenarios. J. Hydrol. 2012, 424–425, 264–277. [Google Scholar] [CrossRef]
  10. Christensen, J.H.; Hewitson, B.; Busuioc, A.; Chen, A.; Gao, X.; Held, I.; Jones, R.; Kolli, R.K.; Kwon, W.-T.; Laprise, R.; et al. Regional Climate Projections. In Climate Change 2007: The Physical Science Basis. Contribution of Working Group I to the Fourth Assessment Report of the Intergovernmental Panel on Climate Change; Solomon, S., Qin, D., Manning, M., Chen, Z., Marquis, M., Averyt, K.B., Tignor, M., Miller, H.L., Eds.; Cambridge University Press: Cambridge, UK; New York, NY, USA, 2007. [Google Scholar]
  11. Beniston, M.; Stephenson, D.B.; Christensen, O.B.; Ferro, C.A.T.; Frei, C.; Goyette, S.; Halsnaes, K.; Holt, T.; Jylhä, K.; Koffi, B.; et al. Future Extreme Events in European Climate: An Exploration of Regional Climate Model Projections. Clim. Change 2007, 81, 71–95. [Google Scholar] [CrossRef]
  12. Chen, Y.; Zhou, H.; Zhang, H.; Du, G.; Zhou, J. Urban Flood Risk Warning under Rapid Urbanization. Environ. Res. 2015, 139, 3–10. [Google Scholar] [CrossRef] [PubMed]
  13. Miller, J.D.; Hutchins, M. The Impacts of Urbanisation and Climate Change on Urban Flooding and Urban Water Quality: A Review of the Evidence Concerning the United Kingdom. J. Hydrol. Reg. Stud. 2017, 12, 345–362. [Google Scholar] [CrossRef]
  14. Wijayanti, Y.; Julianto, A.; Cahyono, C.; Juliastuti; Setyandito, O. Analysis of Flooding and Nature-Based Solutions in the Improvement of Urban Drainage System. In Proceedings of the IOP Conference Series: Earth and Environmental Science; Institute of Physics: London, UK, 2023; Volume 1218. [Google Scholar]
  15. Huang, W.; Hashimoto, S.; Yoshida, T.; Saito, O.; Taki, K. A Nature-Based Approach to Mitigate Flood Risk and Improve Ecosystem Services in Shiga, Japan. Ecosyst. Serv. 2021, 50, 101309. [Google Scholar] [CrossRef]
  16. Miller, J.D.; Vesuviano, G.; Wallbank, J.R.; Fletcher, D.H.; Jones, L. Hydrological Assessment of Urban Nature-Based Solutions for Urban Planning Using Ecosystem Service Toolkit Applications. Landsc. Urban. Plan. 2023, 234, 104737. [Google Scholar] [CrossRef]
  17. Vozelj, U.; Šraj, M.; Bezak, N. Analysis of the impact of green infrastructure on surface runoff from an urban area. Acta Hydrotech. 2023, 36, 111–121. [Google Scholar] [CrossRef]
  18. Kreter, K.; Roderick-Jones, R. Nature-Based Solutions for Urban Stormwater Management; The Nature Conservancy: Arlington, VA, USA, 2023. [Google Scholar]
  19. Li, C.; Peng, C.; Chiang, P.C.; Cai, Y.; Wang, X.; Yang, Z. Mechanisms and Applications of Green Infrastructure Practices for Stormwater Control: A Review. J. Hydrol. 2019, 568, 626–637. [Google Scholar] [CrossRef]
  20. Chan, F.K.S.; Griffiths, J.A.; Higgitt, D.; Xu, S.; Zhu, F.; Tang, Y.T.; Xu, Y.; Thorne, C.R. “Sponge City” in China—A Breakthrough of Planning and Flood Risk Management in the Urban Context. Land. Use Policy 2018, 76, 772–778. [Google Scholar] [CrossRef]
  21. Toran, L.; Jedrzejczyk, C. Water Level Monitoring to Assess the Effectiveness of Stormwater Infiltration Trenches. Environ. Eng. Geosci. 2017, 23, 113–123. [Google Scholar] [CrossRef]
  22. Xiao, Q.; Gregory McPherson, E.; Zhang, Q.; Ge, X.; Dahlgren, R. Performance of Two Bioswales on Urban Runoff Management. Infrastructures 2017, 2, 12. [Google Scholar] [CrossRef]
  23. Carpenter, D.D.; Kaluvakolanu, P. Effect of Roof Surface Type on Storm-Water Runoff from Full-Scale Roofs in a Temperate Climate. J. Irrig. Drain. Eng. 2011, 137, 161–169. [Google Scholar] [CrossRef]
  24. Rodríguez-Rojas, M.I.; Huertas-Fernández, F.; Moreno, B.; Martínez, G. Middle-Term Evolution of Efficiency in Permeable Pavements: A Real Case Study in a Mediterranean Climate. Int. J. Environ. Res. Public Health 2020, 17, 7774. [Google Scholar] [CrossRef] [PubMed]
  25. Possantti, I.; Marques, G. A Modelling Framework for Nature-Based Solutions Expansion Planning Considering the Benefits to Downstream Urban Water Users. Environ. Model. Softw. 2022, 152, 105381. [Google Scholar] [CrossRef]
  26. Liao, K.W.; Thedy, J.; Tai, C.C. Fluvial Flood Adaptation Using Nature-Based Solutions: A Comprehensive and Effective Assessment of Hydro-Meteorological Risks. Sci. Total Environ. 2024, 912, 169329. [Google Scholar] [CrossRef]
  27. Ruangpan, L.; Vojinovic, Z.; Di Sabatino, S.; Leo, L.S.; Capobianco, V.; Oen, A.M.P.; McClain, M.; Lopez-Gunn, E. Nature-Based Solutions for Hydro-Meteorological Risk Reduction: A State-of-the-Art Review of the Research Area. Nat. Hazards Earth Syst. Sci. 2020, 20, 243–270. [Google Scholar] [CrossRef]
  28. Manes, S.; Vale, M.M.; Pires, A.P.F. Nature-Based Solutions Potential for Flood Risk Reduction under Extreme Rainfall Events. Ambio 2024, 53, 1168–1181. [Google Scholar] [CrossRef] [PubMed]
  29. Dodman, D.; Hayward, B. Cities, Settlements and Key Infrastructure. In Climate Change 2022: Impacts, Adaptation and Vulnerability. Contribution of Working Group II to the Sixth Assessment Report of the Intergovernmental Panel on Climate Change; Pörtner, H.-O., Roberts, D.C., Tignor, M., Ploczanska, E.S., Mintenbeck, K., Alegría, A., Craig, M., Langsdorf, S., Eds.; Cambridge University Press: Cambridge, UK, 2022; pp. 907–1040. [Google Scholar]
  30. Zhang, L.; Xu, Q.; Wang, K.; Chen, G.; Luo, Z.; Li, X.; Guo, B. Event-Scaled Hydrological Response of a Headwater Catchment in Hong Kong. Front. Environ. Sci. 2023, 11, 1218239. [Google Scholar] [CrossRef]
  31. Latron, J.; Soler, M.; Llorens, P.; Gallart, F. Spatial and Temporal Variability of the Hydrological Response in a Small Mediterranean Research Catchment (Vallcebre, Eastern Pyrenees). Hydrol. Process 2008, 22, 775–787. [Google Scholar] [CrossRef]
  32. Alivio, M.B.; Radinja, M.; Šraj, M.; Gribovszki, Z.; Bezak, N. Comparative Analysis of Event Runoff Coefficients and Curve Numbers in Contrasting Urban Environments Based on Observed Rainfall-Runoff Data. J. Hydrol. 2024, 645, 132135. [Google Scholar] [CrossRef]
  33. Ogden, F.L.; Hawkins, R.P.; Walter, M.T.; Goodrich, D.C. Comment on “Beyond the SCS-CN Method: A Theoretical Framework for Spatially Lumped Rainfall-Runoff Response” by M. S. Bartlett et Al. Water Resour. Res. 2017, 53, 6345–6350. [Google Scholar] [CrossRef]
  34. Boughton, W.C. Soil and Water Management and Conservation A Review of the USDA SCS Curve Number Method. Aust. J. Soil. Res. 1989, 2, 511–534. [Google Scholar] [CrossRef]
  35. Chin, D.A. On Relationship between Curve Numbers and Phi Indices. Water Sci. Eng. 2018, 11, 187–195. [Google Scholar] [CrossRef]
  36. Cipolla, S.S.; Maglionico, M.; Stojkov, I. A Long-Term Hydrological Modelling of an Extensive Green Roof by Means of SWMM. Ecol. Eng. 2016, 95, 876–887. [Google Scholar] [CrossRef]
  37. Alemaw, B.F.; Chaoka, T.R.; Tafesse, N.T. Modelling of Nature-Based Solutions (NBS) for Urban Water Management—Investment and Outscaling Implications at Basin and Regional Levels. J. Water Resour. Prot. 2020, 12, 853–883. [Google Scholar] [CrossRef]
  38. Meshram, S.G.; Ilderomi, A.R.; Sepehri, M.; Jahanbakhshi, F.; Kiani-Harchegani, M.; Ghahramani, A.; Rodrigo-Comino, J. Impact of Roof Rain Water Harvesting of Runoff Capture and Household Consumption. Environ. Sci. Pollut. Res. 2021, 28, 49529–49540. [Google Scholar] [CrossRef] [PubMed]
  39. Theochari, A.P.; Baltas, E. The Nature-Based Solutions and Climate Change Scenarios toward Flood Risk Management in the Greater Athens Area—Greece. Nat. Hazards 2024, 120, 4729–4747. [Google Scholar] [CrossRef]
  40. Agarwal, D.S.; Bharat, A.; Kjeldsen, T.R.; Adeyeye, K. Assessing Impact of Nature Based Solutions on Peak Flow Using HEC-HMS. Water Resour. Manag. 2024, 38, 1125–1140. [Google Scholar] [CrossRef]
  41. Alivio, M.B.; Šraj, M.; Bezak, N. Investigating the Reduction of Rainfall Intensity beneath an Urban Deciduous Tree Canopy. Agric. Meteorol. 2023, 342, 109727. [Google Scholar] [CrossRef]
  42. Kottek, M.; Grieser, J.; Beck, C.; Rudolf, B.; Rubel, F. World Map of the Köppen-Geiger Climate Classification Updated. Meteorol. Z. 2006, 15, 259–263. [Google Scholar] [CrossRef] [PubMed]
  43. ARSO ARSO Meteorological Archive. Available online: https://meteo.arso.gov.si/met/sl/archive/ (accessed on 23 October 2023).
  44. Alivio, M.B.; Bezak, N.; Mikoš, M. The Size Distribution Metrics and Kinetic Energy of Raindrops above and below an Isolated Tree Canopy in Urban Environment. Urban For. Urban Green. 2023, 85, 127971. [Google Scholar] [CrossRef]
  45. Zabret, K.; Šraj, M. Rainfall Interception by Urban Trees and Their Impact on Potential Surface Runoff. Clean 2019, 47, 1800327. [Google Scholar] [CrossRef]
  46. Zabret, K.; Rakovec, J.; Šraj, M. Influence of Meteorological Variables on Rainfall Partitioning for Deciduous and Coniferous Tree Species in Urban Area. J. Hydrol. 2018, 558, 29–41. [Google Scholar] [CrossRef]
  47. Zabret, K.; Šraj, M. Evaluating the Influence of Rain Event Characteristics on Rainfall Interception by Urban Trees Using Multiple Correspondence Analysis. Water 2019, 11. [Google Scholar] [CrossRef]
  48. Zabret, K.; Šraj, M. Relation of Influencing Variables and Weather Conditions on Rainfall Partitioning by Birch and Pine Trees. J. Hydrol. Hydromech. 2021, 69, 456–466. [Google Scholar] [CrossRef]
  49. Radulović, L.; Bezak, N.; Šraj, M. The influence of vegetation on the microstructure and erosivity of precipitation. Acta Hydrotech. 2023, 36, 57–79. [Google Scholar] [CrossRef]
  50. Lyne, V.; Hollick, M. Stochastic Time-Variable Rainfall-Runoff Modeling. Inst. Eng. Aust. Natl. Conf. 1979, 79, 89–93. [Google Scholar]
  51. ARSO 1m Resolution LIDAR DEM for Slovenia. Available online: http://gis.arso.gov.si/evode/profile.aspx?id=atlas_voda_Lidar@Arso (accessed on 15 June 2024).
  52. MAFF Records of Actual Use by the Farmer and Forest Land: Data on Records of Actual Use for Previous Years (Shape + Metadata). Available online: https://rkg.gov.si/vstop/ (accessed on 19 July 2024).
  53. Ministrstvo za Metijstvo, Gozdarstvo in Prehrano Graphical Soil Data For Slovenia. Available online: https://rkg.gov.si/vstop/ (accessed on 20 June 2024).
  54. Sahu, M.K.; Shwetha, H.R.; Dwarakish, G.S. State-of-the-Art Hydrological Models and Application of the HEC-HMS Model: A Review. Model. Earth Syst. Environ. 2023, 9, 3029–3051. [Google Scholar] [CrossRef]
  55. Choudhari, K.; Panigrahi, B.; Chandra Paul, J. Simulation of Rainfall-Runoff Process Using HEC-HMS Model for Balijore Nala Watershed, Odisha, India. Int. J. Geomat. Geosci. 2014, 5, 253–265. [Google Scholar]
  56. Acuña-Alonso, C.; Álvarez, X.; Bezak, N.; Zupanc, V. Modelling the Impact Land Use Change on Flood Risk: Umia (Spain) and Voglajna (Slovenia) Case Studies. Ecol. Eng. 2024, 200, 107185. [Google Scholar] [CrossRef]
  57. El Alfy, M. Assessing the Impact of Arid Area Urbanization on Flash Floods Using GIS, Remote Sensing, and HEC-HMS Rainfall-Runoff Modeling. Hydrol. Res. 2016, 47, 1142–1160. [Google Scholar] [CrossRef]
  58. Halwatura, D.; Najim, M.M.M. Application of the HEC-HMS Model for Runoff Simulation in a Tropical Catchment. Environ. Model. Softw. 2013, 46, 155–162. [Google Scholar] [CrossRef]
  59. Snyder, F.F. Synthetic Unit Hydrographs. Trans. Am. Geophys. Union. 1938, 19, 447–454. [Google Scholar]
  60. United States Department of Agriculture. Urban Hydrology for Small Watersheds; USDA: Washington, DC, USA, 1986.
  61. Moriasi, D.N.; Gitau, M.W.; Pai, N.; Daggupati, P. Hydrologic and Water Quality Models: Performance Measures and Evaluation Criteria. Trans. ASABE 2015, 58, 1763–1785. [Google Scholar] [CrossRef]
  62. Kennedy, J.; Haas, P.; Eyring, B. Chapter 18. Measuring the Economic Impacts of Greening: The Center for Neighborhood Technology Green Values Calculator. In Growing Greener Cities; University of Pennsylvania Press: Philadelphia, PA, USA, 2008; pp. 326–345. [Google Scholar]
  63. Scholz, M.; Grabowiecki, P. Review of Permeable Pavement Systems. Build. Environ. 2007, 42, 3830–3836. [Google Scholar] [CrossRef]
  64. Imran, H.M.; Akib, S.; Karim, M.R. Permeable Pavement and Stormwater Management Systems: A Review. Environ. Technol. 2013, 34, 2649–2656. [Google Scholar] [CrossRef] [PubMed]
  65. Nguyen, C.N.; Tariq, M.A.U.R.; Browne, D.; Muttil, N. Performance Evaluation of Large-Scale Green Roofs Based on Qualitative and Quantitative Runoff Modeling Using MUSICX. Water 2023, 15, 549. [Google Scholar] [CrossRef]
  66. Oertli, B.; Decrey, M.; Demierre, E.; Fahy, J.C.; Gallinelli, P.; Vasco, F.; Ilg, C. Ornamental Ponds as Nature-Based Solutions to Implement in Cities. Sci. Total Environ. 2023, 888, 164300. [Google Scholar] [CrossRef] [PubMed]
  67. Janke, B.D.; Finlay, J.C.; Taguchi, V.J.; Gulliver, J.S. Hydrologic Processes Regulate Nutrient Retention in Stormwater Detention Ponds. Sci. Total Environ. 2022, 823, 153722. [Google Scholar] [CrossRef] [PubMed]
  68. Ibrahim, S.; Brasi, B.; Yu, Q.; Siddig, M. Curve Number Estimation Using Rainfall and Runoff Data from Five Catchments in Sudan. Open Geosci. 2022, 14, 294–303. [Google Scholar] [CrossRef]
  69. Mccuen, R.H. Approach to Confidence Interval Estimation for Curve Numbers. J. Hydrol. Eng. 2002, 7, 43–48. [Google Scholar] [CrossRef]
  70. Soulis, K.X.; Ntoulas, N.; Nektarios, P.A.; Kargas, G. Runoff Reduction from Extensive Green Roofs Having Different Substrate Depth and Plant Cover. Ecol. Eng. 2017, 102, 80–89. [Google Scholar] [CrossRef]
  71. Fassman-Beck, E.; Hunt, W.; Berghage, R.; Carpenter, D.; Kurtz, T.; Stovin, V.; Wadzuk, B. Curve Number and Runoff Coefficients for Extensive Living Roofs. J. Hydrol. Eng. 2016, 21, 04015073. [Google Scholar] [CrossRef]
  72. Yoo, C.; Ku, J.M.; Jun, C.; Zhu, J.H. Simulation of Infiltration Facilities Using the SEEP/W Model and Quantification of Flood Runoff Reduction Effect by the Decrease in CN. Water Sci. Technol. 2016, 74, 118–129. [Google Scholar] [CrossRef]
  73. Chul, J.; Jin, Y. 청양대학 토목과․ 2) 건양대학교 토목시스템공학과 A Case Study on Development of Stormwater Retention and Infiltration Pond System. J. Korean Environ. Res. Reveg. Technol. 2003, 6, 52–61. [Google Scholar]
  74. Shafique, M.; Kim, R.; Kyung-Ho, K. Rainfall Runoffmitigation by Retrofitted Permeable Pavement in an Urban Area. Sustainability 2018, 10, 1231. [Google Scholar] [CrossRef]
  75. Qin, Z.; Yao, Y.; Zhao, J.; Fu, H.; Zhang, S.; Qiu, L. Investigation of Migration Rule of Rainwater for Sponge City Roads under Different Rainfall Intensities. Environ. Geochem. Health 2022, 44, 3395–3407. [Google Scholar] [CrossRef]
  76. Atkins, E. Green Streets as Habitat for Biodiversity. In Nature Based Strategies for Urban and Building Sustainability; Elsevier Inc.: Amsterdam, The Netherlands, 2018; pp. 251–260. ISBN 9780128123249. [Google Scholar]
  77. Locatelli, L.; Mark, O.; Mikkelsen, P.S.; Arnbjerg-Nielsen, K.; Bergen Jensen, M.; Binning, P.J. Modelling of Green Roof Hydrological Performance for Urban Drainage Applications. J. Hydrol. 2014, 519, 3237–3248. [Google Scholar] [CrossRef]
  78. Arora, M.; Chopra, I.; Nguyen, M.H.; Fernando, P.; Burns, M.J.; Fletcher, T.D. Flood Mitigation Performance of Permeable Pavements in an Urbanised Catchment in Melbourne, Australia (Elizabeth Street Catchment): Case Study. Water 2023, 15, 562. [Google Scholar] [CrossRef]
  79. Guido, B.I.; Popescu, I.; Samadi, V.; Bhattacharya, B. An Integrated Modeling Approach to Evaluate the Impacts of Nature-Based Solutions of Flood Mitigation across a Small Watershed in the Southeast United States. Nat. Hazards Earth Syst. Sci. 2023, 23, 2663–2681. [Google Scholar] [CrossRef]
  80. Sciuto, L.; Licciardello, F.; Scavera, V.; Verde, D.; Giuffrida, E.R.; Cirelli, G.L. The Role of Nature-Based Solutions for the Water Flow Management in a Mediterranean Urban Area. Ecol. Eng. 2024, 208, 107375. [Google Scholar] [CrossRef]
  81. Rodriguez, K.; Swanson, S.; McMahon, A. Conceptual Models for Surface Water and Groundwater Interactions at Pond and Plug Restored Meadows. J. Soil. Water Conserv. 2017, 72, 382–394. [Google Scholar] [CrossRef]
Figure 1. Map showing the location of the study area in Ljubljana (upper right), showing land use, water courses (upper left) and topography (lower left).
Applsci 14 11813 g001
Figure 2. Project methodology, including the data used, the pre-processing steps taken and the modelling conducted.
Applsci 14 11813 g002
Figure 3. Location of NbS scenarios implemented in the study area. P1 = Existing Pond; P2 = Southeast Pond; P3 = Northwest Pond.
Applsci 14 11813 g003
Figure 4. Calibration performance of the model for Events 1 and 4.
Applsci 14 11813 g004
Figure 5. Selected discharge hydrographs for Events 1, 5, 7 and 9, showing all scenarios.
Applsci 14 11813 g005
Figure 6. Reduction in peak discharge (L/s) for all events and scenarios.
Applsci 14 11813 g006
Table 1. Scenario description table.
Scenario NbSArea (m2)Description
OriginalCalibrated Model-Model without NbS (i.e., baseline scenario, current situation)
Scenario 1Permeable Streets1458Permeable alternative to traditional impervious surfaces, which allows stormwater to infiltrate through the pavement into the ground below
Scenario 2Permeable Parking1967There are parking areas (Figure 3) near the hotel, where implementing permeable parking can reduce discharge and increase infiltration rates
Scenario 3Green Roofs2185Implementing green roofs on flat roofs (Figure 3)
Scenario 4All NBS East Basin5610Incorporating all NbS implemented in east sub-catchment (i.e., Scenarios 1–3 combined)
Scenario 5PondsP1: 250Three retention ponds to prevent the possibility of flooding during heavy rainfall events from runoff (Figure 3)
P2: 212
P3: 165
Scenario 6All Basin NBS6237Implementation of all NbS from west and east sub-catchments
Table 2. The curve number (CN) parameter for each event. “No solutions” refers to the CN derived from calibration, which is then changed for each scenario. Rainfall events are also categorised according to the antecedent moisture condition (AMC).
EventImpervious (%)Event 1 Event 2Event 3Event 4Event 5Event 6Event 7Event 8Event 9Event 10
AMCAverageDryDryDryDryAverageDryAverageDryAverage
No solutions8.374.774.436.077.957.063.661.465.865.588.0
Scenario 17.074.374.035.677.656.663.261.065.465.287.6
Scenario 26.374.273.935.577.456.563.160.965.265.087.5
Scenario 36.574.774.436.077.957.063.661.465.865.588.0
Scenario 43.273.873.535.177.156.162.760.564.964.787.1
Table 3. Characteristics of modelled rainfall events.
EventMax Intensity (mm/h)Rainfall Depth (mm)Rain Duration (h)
1129.687.67.7
2162.027.048.2
363.6295.858.7
440.8201.2150.2
527.651.868.8
610.841.628.0
712.059.054.7
810.860.659.0
950.456.218.3
1049.2131.267.3
Table 4. Root mean square error standard deviation (RSME SD), Nash–Sutcliffe efficiency and percent bias results for the calibrated models for each event.
EventEvent 1Event 2Event 3Event 4Event 5Event 6Event 7Event 8Event 9Event 10
RMSE SD (m3/s)0.50.70.70.50.60.40.60.70.70.6
Nash–Sutcliffe0.80.50.50.80.60.80.60.50.50.6
Percent Bias (%)24.029.60.03.720.5−14.7−5.8−7.4−18.5−35.1
Table 5. Percent decrease in peak discharge for each scenario from the “No solutions” model, which is presented with the peak discharge in L/s.
EventUnitsEvent 1 Event 2Event 3Event 4Event 5Event 6Event 7Event 8Event 9Event 10
No solutionsL/s1040.010.3242.0372.227.936.336.321.4197.9316.1
Scenario 1%2.210.11.10.315.02.48.25.22.60.4
Scenario 2%3.013.61.50.420.23.211.07.03.50.6
Scenario 3%1.912.41.10.122.52.710.05.42.40.1
Scenario 4%7.235.93.80.957.88.429.314.48.51.2
Scenario 5%0.711.14.52.55.90.06.00.011.30.3
Scenario 6%7.146.87.93.464.311.234.314.318.32.4
Table 6. Percent decrease in surface runoff (in mm) for each scenario from the “No solutions” model (i.e., baseline scenario), which is presented with the original runoff volume. Only Scenarios 1–4 are listed, as Scenarios 5 and 6 replicate runoff results from Scenarios 1 and 4, respectively, due to use of the same CNs.
EventUnitsEvent 1 Event 2Event 3Event 4Event 5Event 6Event 7Event 8Event 9Event 10
No solutionsmm36.32.483.5140.42.34.45.08.79.6100.0
Scenario 1%3.515.05.41.416.114.313.99.79.21.4
Scenario 2%4.820.27.31.821.719.218.813.012.41.9
Scenario 3%3.119.45.60.924.118.718.211.310.70.7
Scenario 4%11.554.718.34.261.952.251.034.132.44.0
Table 7. Delay of discharge peak for selected scenarios.
ScenarioUnitsEvent 1Event 2Event 3Event 4Event 5Event 6Event 7Event 8Event 9Event 10
Scenario 4min0000000600 *00
Scenario 51004010001002020
Scenario 6100401001010600 *2020
* This discrepancy is because the event in question presents two discharge peaks. When Scenarios 4 and 6 are implemented, the highest peak shifts from the first to the second of the discharge peaks. This causes a significant variation in the time recorded as the “peak” of the event. It is important to note that this variation does not imply a total reduction in the amount of water discharged but rather a change in the sequence and magnitude of the peaks.
Disclaimer/Publisher’s Note: The statements, opinions and data contained in all publications are solely those of the individual author(s) and contributor(s) and not of MDPI and/or the editor(s). MDPI and/or the editor(s) disclaim responsibility for any injury to people or property resulting from any ideas, methods, instructions or products referred to in the content.

