1. Introduction
Social humanoid robots are becoming more prevalent, with their abilities advancing quickly. They are outfitted with various systems that allow them to perform human-like actions naturally, along with sensors that enable them to gather information about their surroundings, including other people. Some of these robots are fully autonomous and are effectively replacing humans in many situations, acting as a museum tour guide [
1], a personal companion [
2], a sales assistant [
3], and so on. For such robots, it is crucial to design human–robot interfaces that are not only intuitive for the human user but also capable of adapting to their personal needs, preferences, and habits. A well-designed interface should facilitate seamless communication and interaction, minimizing the learning curve for users of different ages, backgrounds, and technological familiarity. This adaptability ensures that the robot can tailor its behavior and responses to suit individual preferences, providing a more personalized experience. Additionally, the interface should allow for continuous learning, enabling the robot to evolve alongside the user, recognizing patterns in behavior, adjusting to changing needs, and enhancing user comfort and engagement over time. An effective interface fosters trust and promotes long-term user satisfaction by creating a more natural, meaningful human–robot relationship.
Two common channels through which humans communicate are speech and gaze [
4]. In this research, our long-term goal is to design intuitive interfaces for human–robot communication, allowing for robot adaptation.
The main contributions of this research are proposing a new approach to the personalization of robot behavior using the Model Predictive Control approach, performing experiments in a simulated environment, and rule-based data generation for the verification of the proposed solution.
This article is structured as follows:
Section 2 discusses related work.
Section 3 contains a high-level description and implementation details of our proposed solution. In
Section 4, we describe the evaluation experiments and their results. Concluding remarks and directions for further research are presented in
Section 5.
2. Related Research
In [
5], Noriaki Mitsunaga et al. proposed using policy gradient reinforcement learning (PGRL) to create a system for allowing adaptation of robot behavior in a human–robot interaction scenario. They propose using the subconscious body signals of humans as the main data for calculating pleasure or discomfort from interacting with a robot. They use gaze contact time, and the distance between human and robot to calculate the reward function and adjust six parameters defining robot behavior, including gaze time of the robot, gesture speed, and waiting time. In our study, we also use gaze data and adapt gestures, motion speed, and waiting time, as well as using and adjusting other parameters, e.g., the emotional state of the user and the volume of utterances.
Collecting data that will be used in the training of a system controlling robot behaviors that can adapt to changing situations is a very demanding and time-consuming task, according to Antonio Andriella et al. [
6]. This task is not only demanding from a robot and experimenter perspective but more so from a user perspective, mainly due to the sheer number of data samples that need to be collected for one user to perform successful adaptation without previous knowledge. As a solution to this problem, Antonio Andriella et al. proposed using a persona–behavior simulator to create a base model, and user input is used only to fine-tune the model used for adaptation. In our work, we use a similar approach to create the base model in a simulated environment. The main difference is in the type of model used in the system and the complexity of the simulation.
One of the areas of human–robot interaction that can make great use of task adaptation and personalization is human–robot collaboration. Olivier Mangin et al. [
7] explored this in a scenario of a collaborative furniture construction task. They proposed using Partially Observable Markov Decision Processes (POMDP) to decide which high-level task to execute, and then the Monte Carlo solver was employed for the short-term execution of the plan for a robot. The authors used a high-level hierarchical task model (HTM), similar to our work, then high-level abstract tasks, e.g., “assemble leg”, were divided into a more concrete series of subtasks using POMDP, e.g., “hold, pick up leg, get screw, …”. A single task transformed in this manner is called a restricted model. Restricted models (RM) are recombined into HTM, where the interaction between them is minimal. The benefit of such an approach is the possibility to focus on short-term planning and analyzing RM separately. Also, it is less computationally demanding, as calculating global policy at a high level is complex compared to calculating short-term policies for simple tasks. Adaptation of the robot’s behavior is achieved based on user feedback collected during the collaboration. The results presented in the paper suggest that the proposed approach produces excellent results.
Eshed OhnBar et al. [
8] studied the personalization in adaptive navigation systems for blind people. They emphasized the importance of tailoring such a system to the user’s personal needs to minimize navigation errors and user confusion. The authors propose using a weighted expert model to handle the limited amount of data collected from user interactions and compare it to a standard single model fine-tuning with the obtained results. Models are trained on user position and heading data extracted from user movements and Bluetooth beacon localization. They are used to predict navigation instructions appropriate for the user at that moment. Especially in turn-based actions, better results are achieved much faster. As with our work, they use a simulated environment based on real-world data to test their approach.
The authors of [
9] propose an interesting approach to a human–robot collaboration in the task of helping disabled humans dress. They propose a system that gives commands to the robot and user on what to perform next to achieve the goal. The proposed solution is adapting to the user’s physical capabilities and body size and shape. The system works in an offline mode. First, data about user capabilities and needs must be collected. Then, the system creates personalized plans using a simulated environment. Lastly, during the second interaction, the robot can take advantage of previous interactions and adapt to the user, apply one of the plans, and perform tasks better, thanks to adaptation. The simulated environment is quite detailed as it handles cloth physics in contrast to our simulation, which uses a simplified approach.
Alessandro Umbrico et al. [
10] emphasize a need to adapt and personalize behaviors according to the context and needs of a person in the task of social assistive robotics (SAR). This approach can improve the effectiveness of user support and, therefore, user acceptance. The authors propose a system that can work in a continuous loop in the SAR task using a holistic ontology of what the robot knows and can do. The main focus of the authors is on the representation of the world. Sensor data are converted using a rule-based system to a semantic form and combined with robot self-knowledge (e.g., information on which sensors were available) in the
Event and Activity Detection step. User adaptation is based on the International Classification of Functioning, Disability, and Health (ICF) as it defines semantics for representing the physical and cognitive capabilities of a person. These features, together with activities and participation, create a user model that is updated during interaction with the robot. The user model is used in the robot decision process to select appropriate actions. In our work, we also apply the rule-based system, which results in a good interpretability of the approach.
3. Proposed Solution
In our previous work [
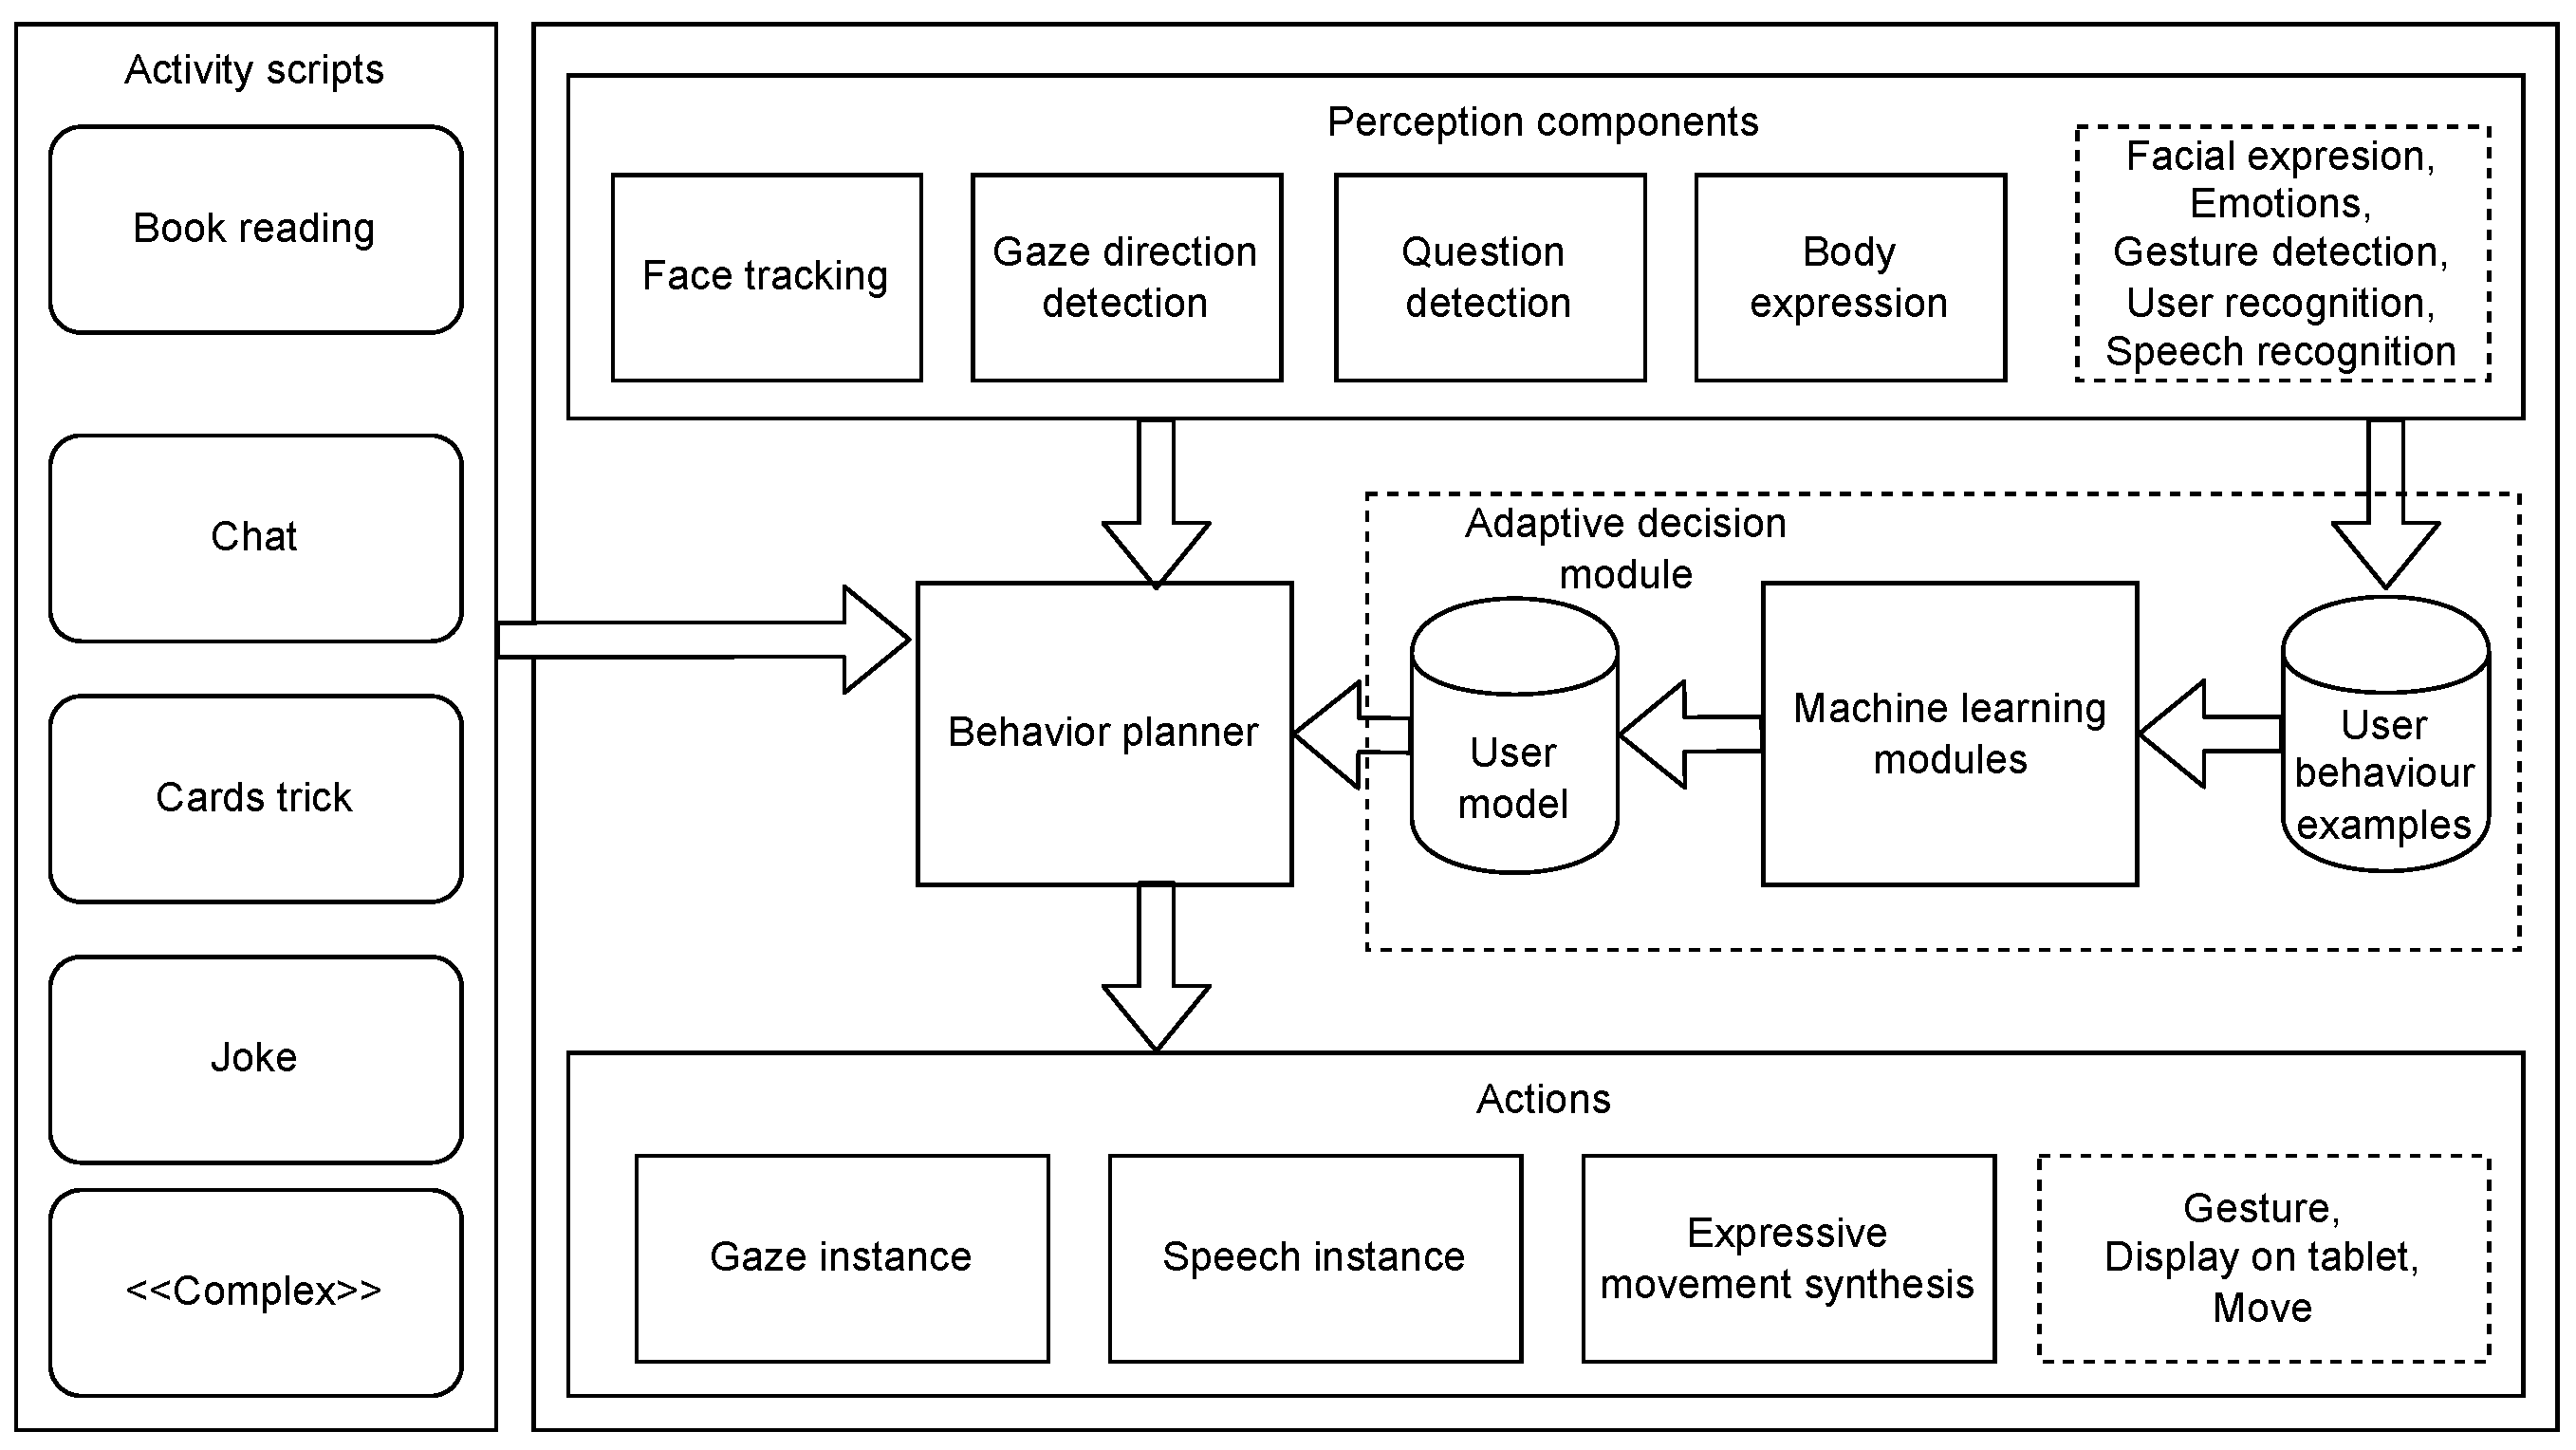
11], we proposed a human–robot interaction framework that can work on multiple platforms and streamline the creation of interaction scenarios. The main focus was on perception modules and framework architecture. In this work, we will extend the adaptive decision module to provide behavior personalization. A diagram presenting our framework architecture is shown in
Figure 1. It is written in Python language.
Perception components are responsible for processing raw data obtained from the sensors, giving a higher-level perception description. The
face-tracking component processes raw video from the camera, taking into account the robot’s joint position, and moves the robot to follow the detected user face.
The Gaze-Detection Direction module extracts the user’s gaze direction from the video and combines it with the robot’s joint positions. The module returns angle values representing the gaze direction in the camera’s plane of perspective. The Question-Detection component converts the audio signal to spectrograms and, using a deep neural network, detects when a question is asked. The Emotion component identifies the user’s face in the camera image and classifies the expressed emotion using a deep neural network. The Speech-Recognition module transcribes the audio input into text. We use Google Speech-to-Text for this functionality to achieve the best results. The Behavior Planner reads Activity Scripts and, using the perception description and the Adaptive Decision Module, selects and executes Actions, which represent basic or complex activities performed by the robot according to the scenario outlined in one of the Activity Scripts.
Our solution is based on the Model Predictive Control (MPC) method [
12]. MPC is an advanced control strategy that uses a mathematical model of a system to predict and optimize its future behavior over a defined time horizon. At each step, MPC solves an optimization problem by considering the current system conditions and constraints to determine the best sequence of control actions. Then, it applies the first action from the sequence, recalculating the next optimal sequence in subsequent steps as new data become available. This process allows MPC to handle multivariable systems with constraints on inputs and outputs, making it highly effective for complex, dynamic environments.
In our solution, the MPC approach is applied in the decision module.
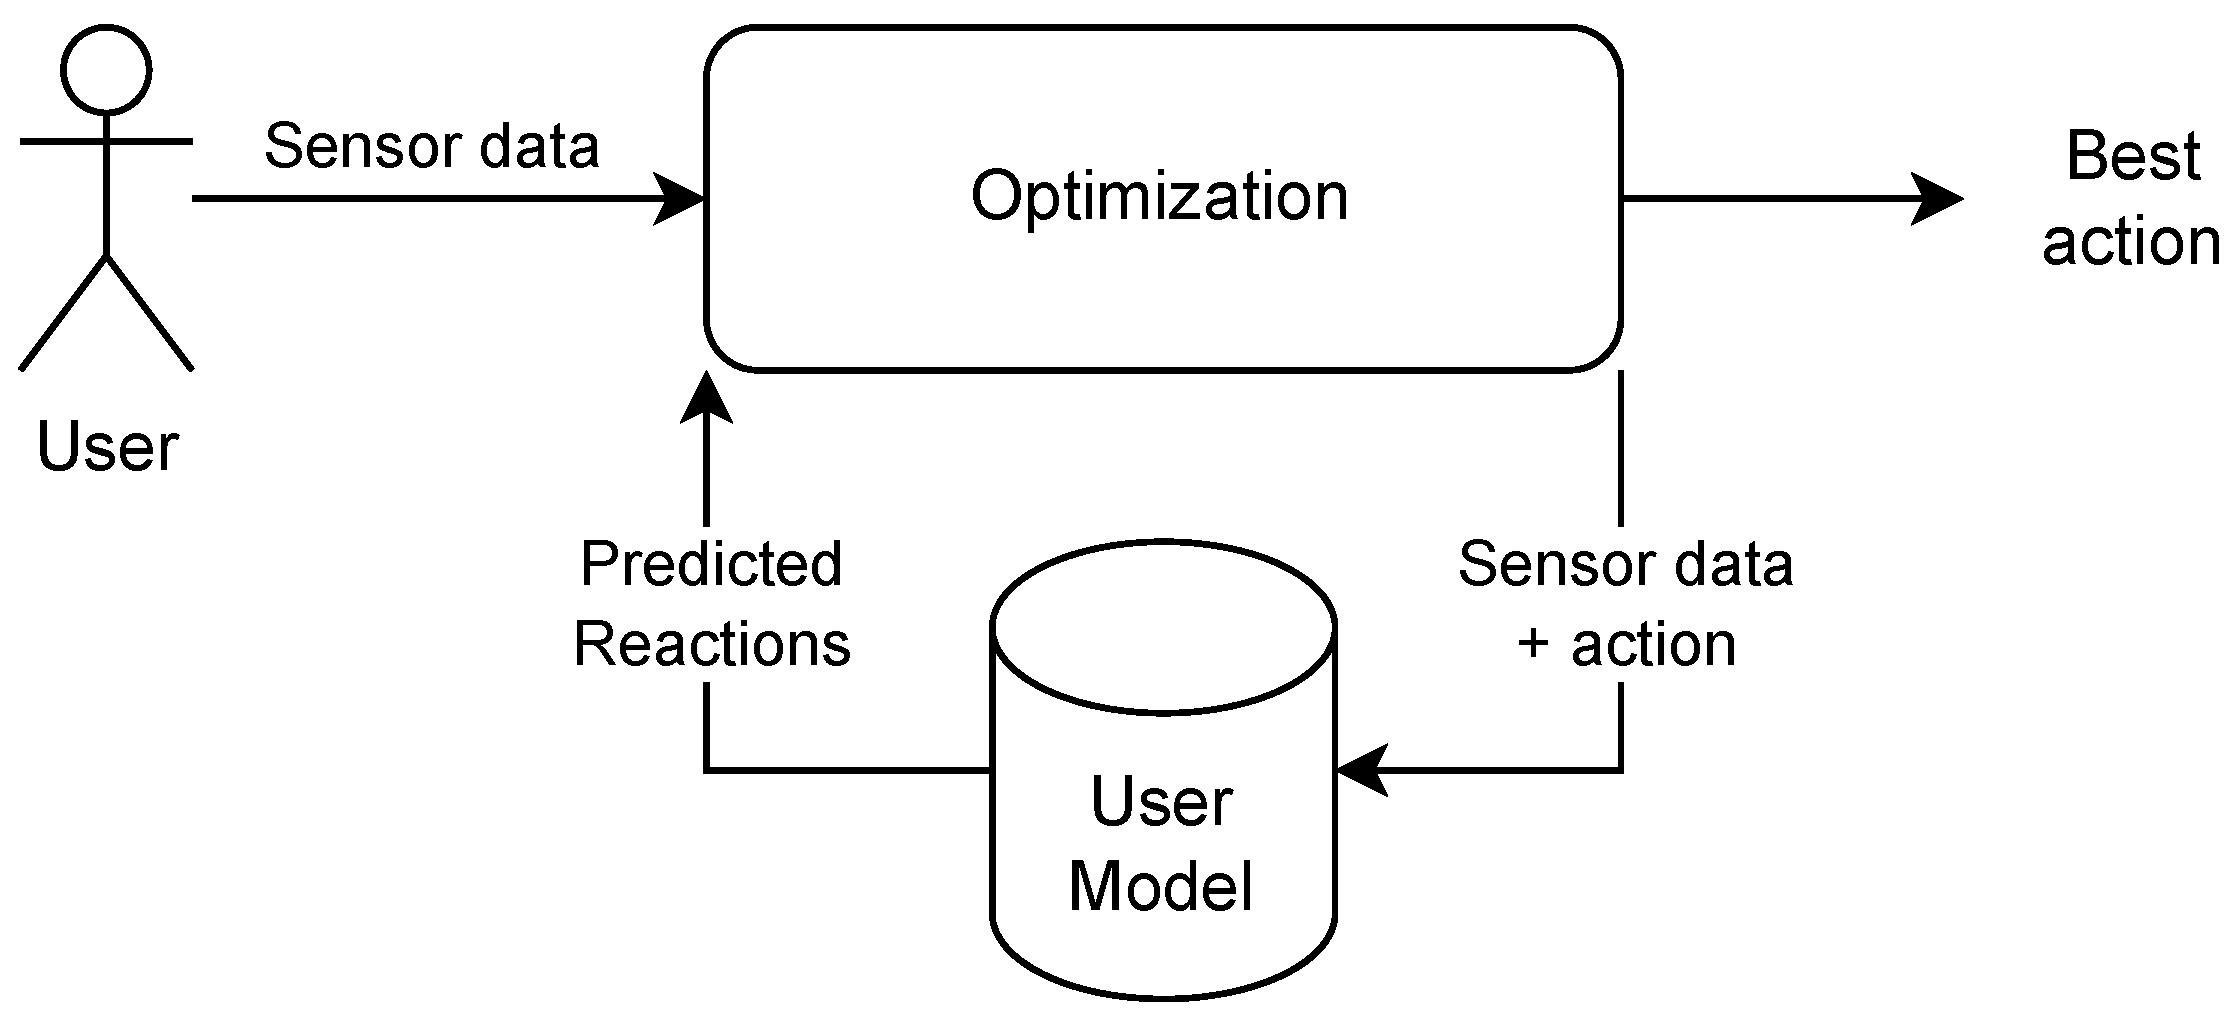
Figure 2 presents its architecture. In
Figure 3 we can see a flow chart showing how this module works internally. The
User model is a key element used to adapt to the personality of the user. The
User model is fed with input
Data from the available sensors. Then, it predicts the user reaction to all possible robot actions, and the best action is picked to execute by the optimization component. Selection is based on
cost function, which currently combines two factors: maximizing the user’s positive emotions and increasing the user’s focus calculated in a given optimization time horizon.
MPC has several limitations. The first is computational complexity. It is necessary to execute the User model many times to choose the best decision, especially when the time horizon value is high. However, in our approach, MPC is not applied to a real-time problem. The
Adaptive Decision Module controls high-level functionalities. Therefore, delays are more acceptable. Another problem is the limited resources on the robot platform. Our platform allows for distributed computation; therefore, the solution is to run highly demanding computations on a server. The final issue is cost-function parameter tuning. We have tuned it manually, which is described below, but algorithmic approaches can also be applied (e.g., using Gaussian processes or the genetic algorithm [
13,
14]).
In our experiments, we apply a time horizon equal to one step for user reaction prediction and for optimization. As a result, the action selection is greedy, as only immediate reaction to the action is predicted (without delayed effects), and the action providing the lowest cost in the next step is chosen. However, the algorithm is general and allows us to extend the time horizon, which would allow the robot to find more sophisticated action plans. Also, the cost function can be more complex and include energy consumption by a given action, duration of the action, etc.
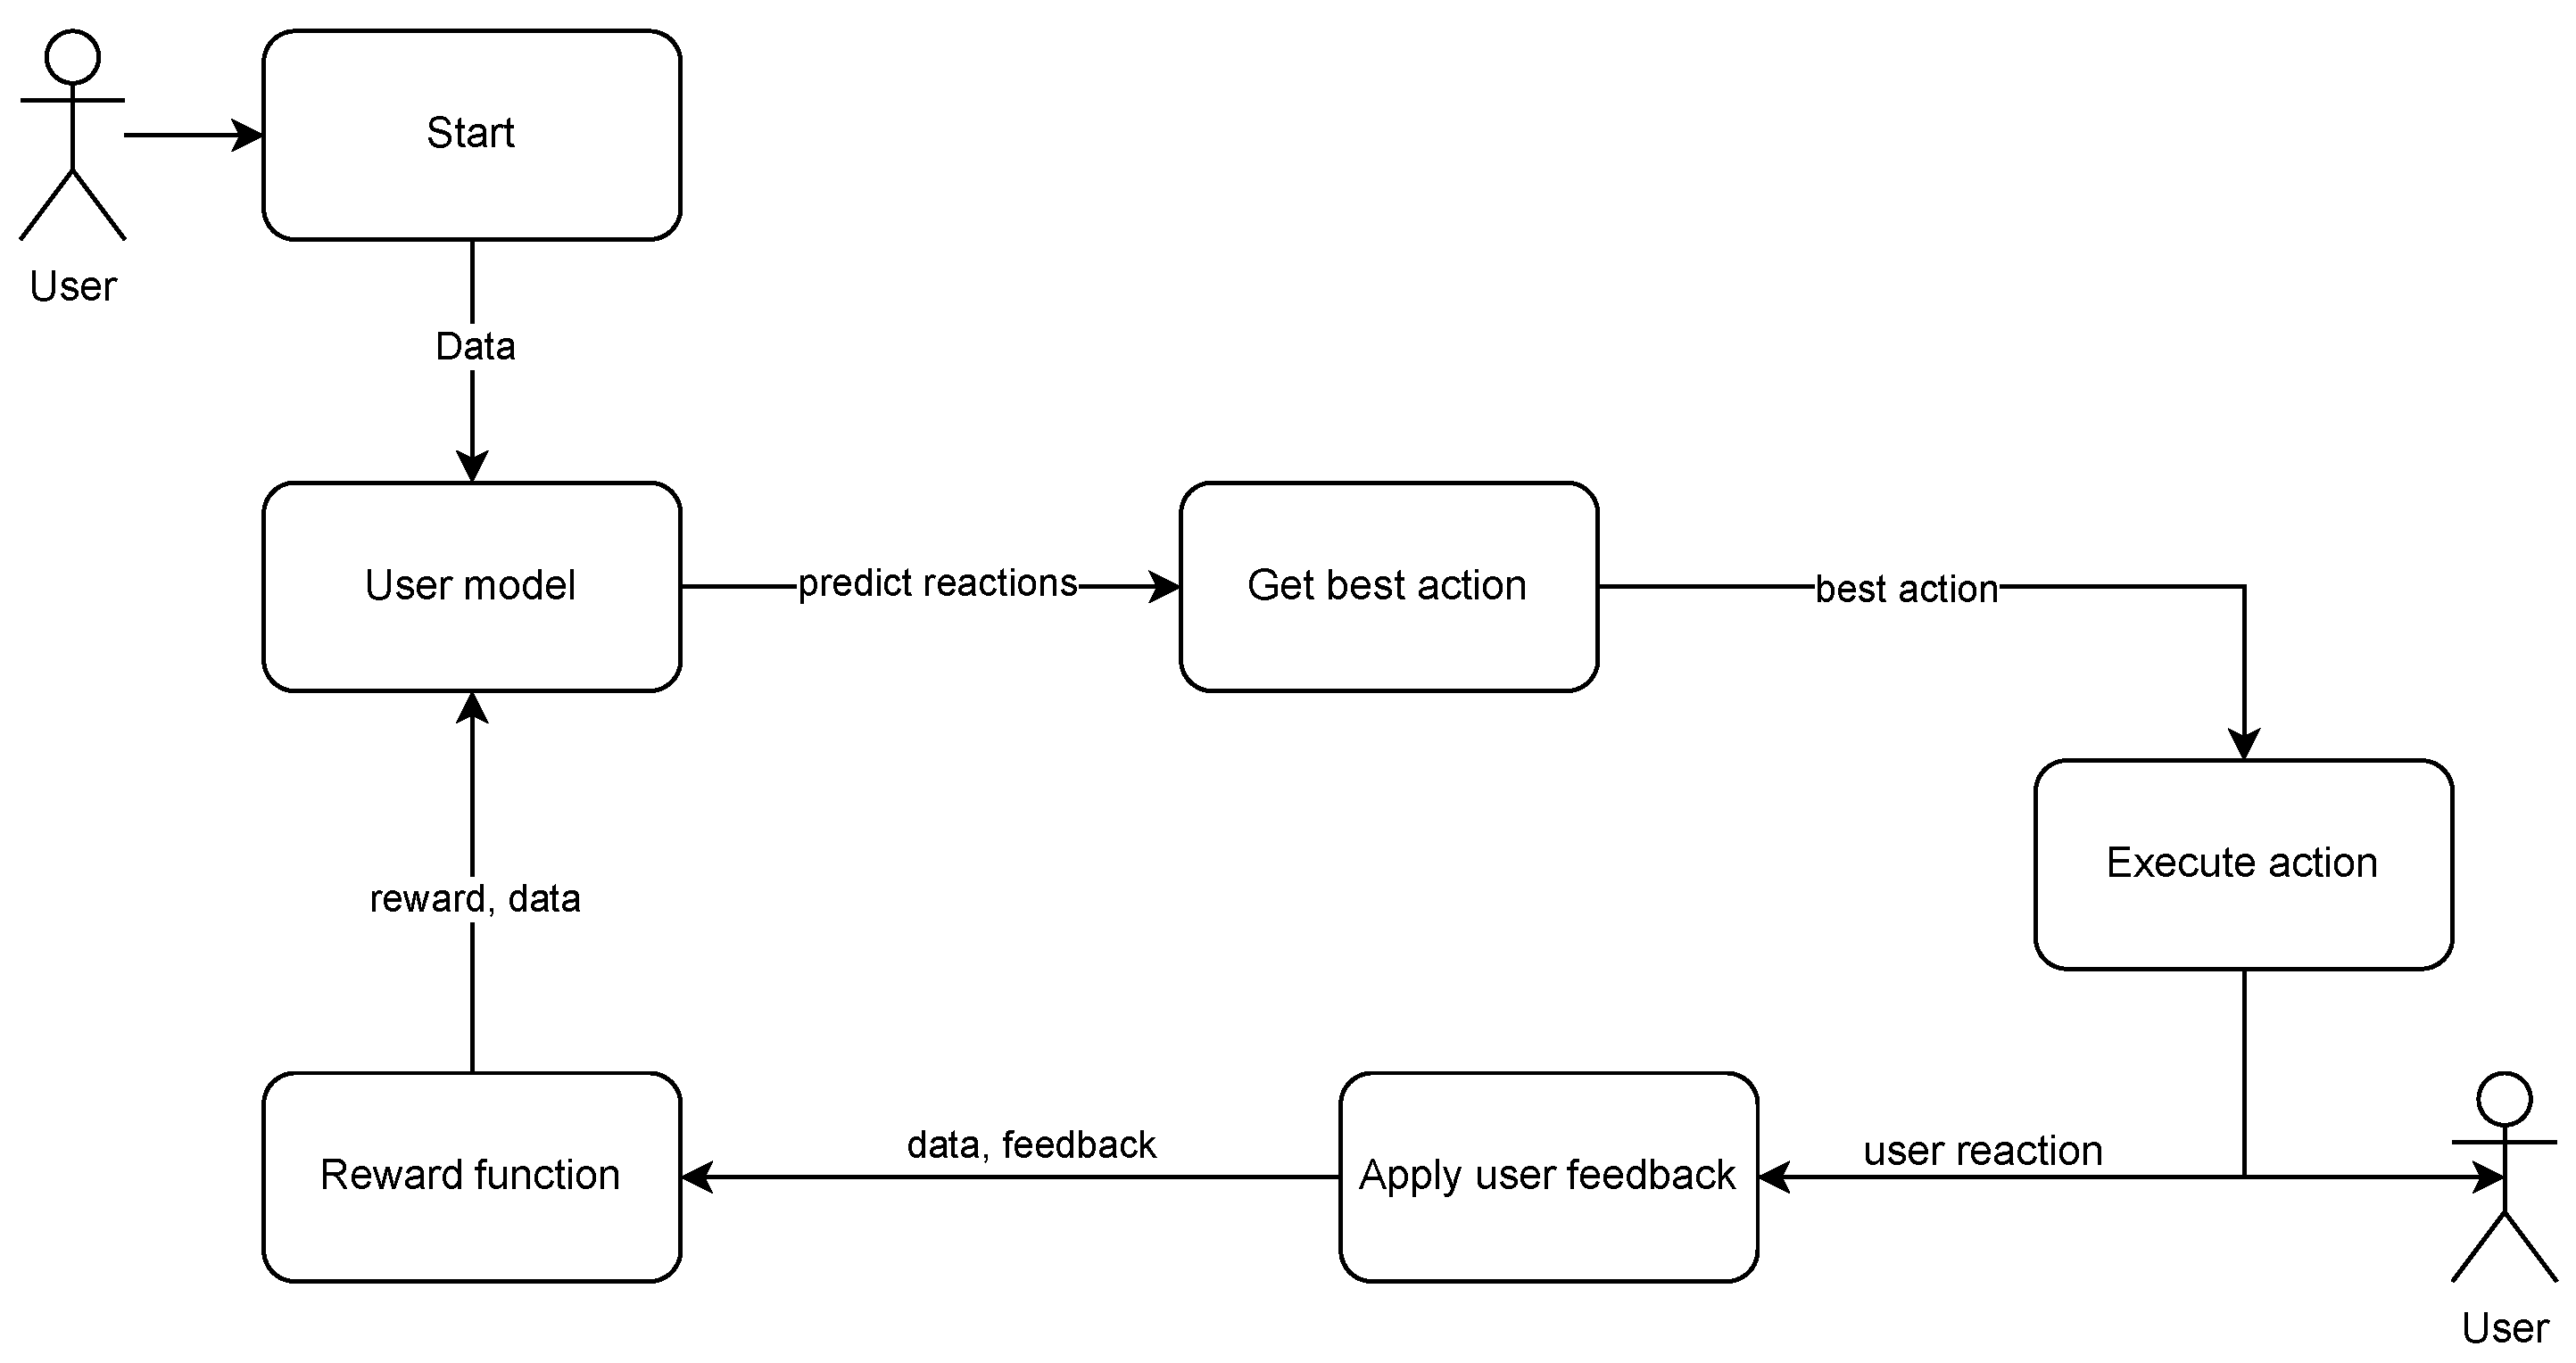
To provide adaptability of robot behavior, this architecture is extended as follows. The state after the best-action execution is observed using sensors, and the collected data are used as
User feedback. These results are evaluated using the
reward function. They are used to improve and reevaluate the
User model. The complete decision process, including adaptation, is presented in Algorithm 1.
Main_loop procedure is the primary function in the decision module that initiates and calls other functions. Here, we present a simplified and abstract version of it. In reality, our framework operates in parallel, is partially distributed, and follows an event-driven paradigm, making it challenging to represent as a single function. The
user_model parameter is an object representing the
User model, while
list_of_interactions is a list of planned user–robot interactions (the subsequent stages of the conversation between the robot and the user in our case). For more details, please refer to [
11]. The
list_of_robot_actions contains all possible robot actions.
adaptive_decision function uses
User model to predict user reactions to all possible robot actions in a given state and selects the best action for execution.
get_best_action function chooses the optimal action from the robot action list based on the user reactions predicted. The
apply_user_feedback function calculates and returns a reward function based on the sensor data and the performed action, using Equation (
1).
Depending on the model used, re-evaluation can be executed incrementally or in all-at-once batch mode. Incremental algorithms, like reinforcement learning, can learn continuously, using new data only, and do not require retraining to update the model. Algorithms without such capabilities, such as Random Forest, require training on the whole training data (base dataset combined with data from last experiments with the user) to improve the model each time new data appear.
| Algorithm 1 Adaptive decision module algorithm |
procedure Main_loop() for each do function adaptive_decision() for each do return function get_best_action() ) return function apply_user_feedback() ) return
|
In this approach, the personalization of robot behavior is achieved by developing an appropriate model. There are two ways to accomplish this: by enhancing the model with additional training data to improve its performance and by refining the reward function. By collecting more real data from the user and retraining the user model, the model becomes better adapted to the user’s behavior. The reward function, which initially represents a theoretical baseline user, can also be adjusted to reflect the preferences of the specific user as more data is collected, improving personalization. Such an adjustment would require manually changing the values of the emotions and gaze factors or using some learning algorithm; see Equation (
1).
The reward function
assigns a real value to the change in the user’s emotional state and the user’s gaze pattern after the robot’s action. It corresponds to the MPC goal function. The adaptive decision module selects an action with the highest predicted value, so the reward function should return a value that represents the quality of the action in the current situation. Its definition depends on the application and the available sensors. In our research, it is calculated as a linear composition of recognized user emotions and parameters describing gaze contact between the user and the robot:
These functions allow the analysis of the change in the observed behavior of a user after the execution of an action A. represents emotion quality. It is a sum of the differences between the emotions after () and before () execution of the action multiplied by a factor .
The factor values were manually chosen to closely align with a rule-based expert system that represents the user in the simulated environment. Specifically, they were selected to give a high-quality score for actions preferred by a user simulated by the expert system and a low score for actions that differ significantly from the user’s preferences. The most distinct examples of differing actions would be opposites, such as increasing volume versus decreasing volume.
Emotion x is one of the following emotions: angry (a), disgust (d), fear (f), happy (h), sad (s), surprise (su), and neutral (n). The values for are {−6.75, −5.5, −10.0, 5.5, −2.5, 1.5, 4.0}, respectively. They are designed to penalize negative changes and encourage positive or neutral ones.
Similarly, we calculate representing the quality of the human gaze. The following gaze directions were used in the calculations: contact with the robot (c), down (d), up (u), left (l), right (r), and diagonal (d). The values of are also manually chosen and are equal to {4.0, −1.0, −1.75, 0.5, −3.625, −0.25}, respectively, to promote engagement understood as gaze contact. The reward function is a sum of emotion and gaze quality.
One might ask why create a new uncertain function instead of using an already existing function for data generation. The biggest advantage of such an approach is the ease of interpretation of how such a function works, the low computational complexity, and the simple application for future, real-time experiments.
4. Evaluation
Personalizing a robot’s behaviors in human–robot interaction scenarios is a complicated task due to many reasons. The biggest one is that there is no readily available dataset to train the model for such a task. Therefore, in order to realize the main goal of our research, such a dataset must be created.
4.1. Dataset
To create a dataset, there are two possible approaches. The first is to perform experiments with a robot and a human interacting with each other, with a random user model to collect the best data. Using a random model would allow us to explore a bigger space of reactions than using no model or an arbitrarily created model. In our previous research [
11], in real experiments with the robot, we used a fake job-interview scenario—a simple interaction with a dozen questions asked by the robot. In this experiment, human behavior while answering a question is analyzed, and after that, robot behavior can be modified accordingly to a personalized model. Thus, from every single experiment, we can obtain a dozen data samples. The problem is that most machine-learning algorithms require hundreds or thousands of data samples to train and evaluate. Hence, a huge number of real experiments would need to be conducted to gather enough data. Due to a lack of available time and space and a lack of participants, such an approach was not feasible.
The other option is to collect data in a simulated environment, as conducted in [
6]. This approach was taken in this study. It should be noted that simulated data come with its own set of drawbacks. First and foremost, the data are less certain than those from a real-world experiment. Also, to make such an approach feasible, some simplifications must be made. The biggest one is that instead of simulating the whole robot, the human, and its environment, only data collected from such an interaction were simulated. In addition, instead of personalizing for a given person, the behavior was adopted for one of the personality traits—talkativeness. The reason for this was to simplify the learning process. The data sample describing the interaction between the user and the robot consists of 51 features; see
Table 1.
Data are generated in a raw form, which is the same as real data collected in experiments with a physical robot. Later, it is converted to a more usable form. The data sample consists of three parts: data collected from the user by the robot describing a given state, the action chosen by the robot in a given state, and data collected after action execution.
The first value in the data sample
time_from_last_question is the time from the most recent question asked by the user. It is scaled from 0 to 1 and resets after asking a question or the next round of conversation.
number_of_question_asked is the number of questions asked in the current round of the experiment,
time_from_last_event is a time from the last event that occurred in the current round. It is also scaled from 0 to 1.
silence_detected binary represents the information if the user was silent for long enough to finalize the current round.
user_speech_time is the duration during which the user was speaking. It is scaled from 0 to 1.
emotion_X represents the percentage of emotion
X observed in the user in the current round, calculated from the top 3 emotions consequently observed in the round. The human gaze is represented by a set of features of the form
gaze_looking_on_X, which represent the fact that the user is looking at a direction
X. It is a percentage of all the gaze directions observed by the user.
robot_gaze_strategy_X is a one-hot encoded robot gaze strategy (see [
11]),
robot_state_X represents a one-hot encoded robot state, and
triggered_events_X is a list of events in the current round.
For every data sample, there is also a label that is generated by the expert system representing the user, which describes the quality of the user’s reaction to the robot’s action: good, bad, or neutral. There are 14 possible robot actions: nothing, make louder, make quieter, gesture normal, gesture calm, gesture vivid, speak faster, speak slower, pitch higher, pitch lower, robot movements on, robot movements off, robot gaze on, and robot gaze off.
The main part of the simulator is a rule-based expert system that analyses input data from the user and robot reaction and then evaluates the quality of that reaction using rules stored in its knowledge base. The system uses 70 rules to predict the response of the user. The rule system is created in Python using the durable rules library (see [
15]). Rules have various complexity, from simple ones, like:
to more complex ones, like:
all(’emotion’ & ’happy’ | ’surprise’ | ’neutral’,
’emotion’ & ’sad’ | ’fear’ |’angry’ | ’neutral’,
none(’has’) & ’positive_emotion’|’negative_emotion’ | ’neutral_emotion’)
then emit fact ’mixed_emotion’
Rules have priority of importance and are ordered hierarchically from simple, working on raw data, to more complex and abstract, working on previously derived facts. The emit fact function creates a new fact and adds it to the knowledge base on which rules are calculated. The fact represents data and is represented as JSON and stored until retracted. The all function is true if all conditions written after a comma are true. The “|” sign stands for logical OR combining conditions, while the “&” sign is logical AND. The none function is true if the fact passed as an argument is not present in the knowledge base.
The other part of the simulator is a generator that generates actual data based on parameters derived from our previous experiments [
11,
16]. The gaze data collected during these experiments were converted into Markov Decision Models. The emotion model was statistically derived from emotion data, user personality, and the quality of the robot’s actions. The simulator operates in a 12-round simulation cycle to mimic real interactions with the same individual, applying gaze and emotion models to generate the next state based on the previous one. As a result, each set of 12 data samples, corresponding to consecutive questions, is interrelated. To generate the next data sample, the latter part of the previous sample is used, with this process applied to every sample except the first and the 12th.
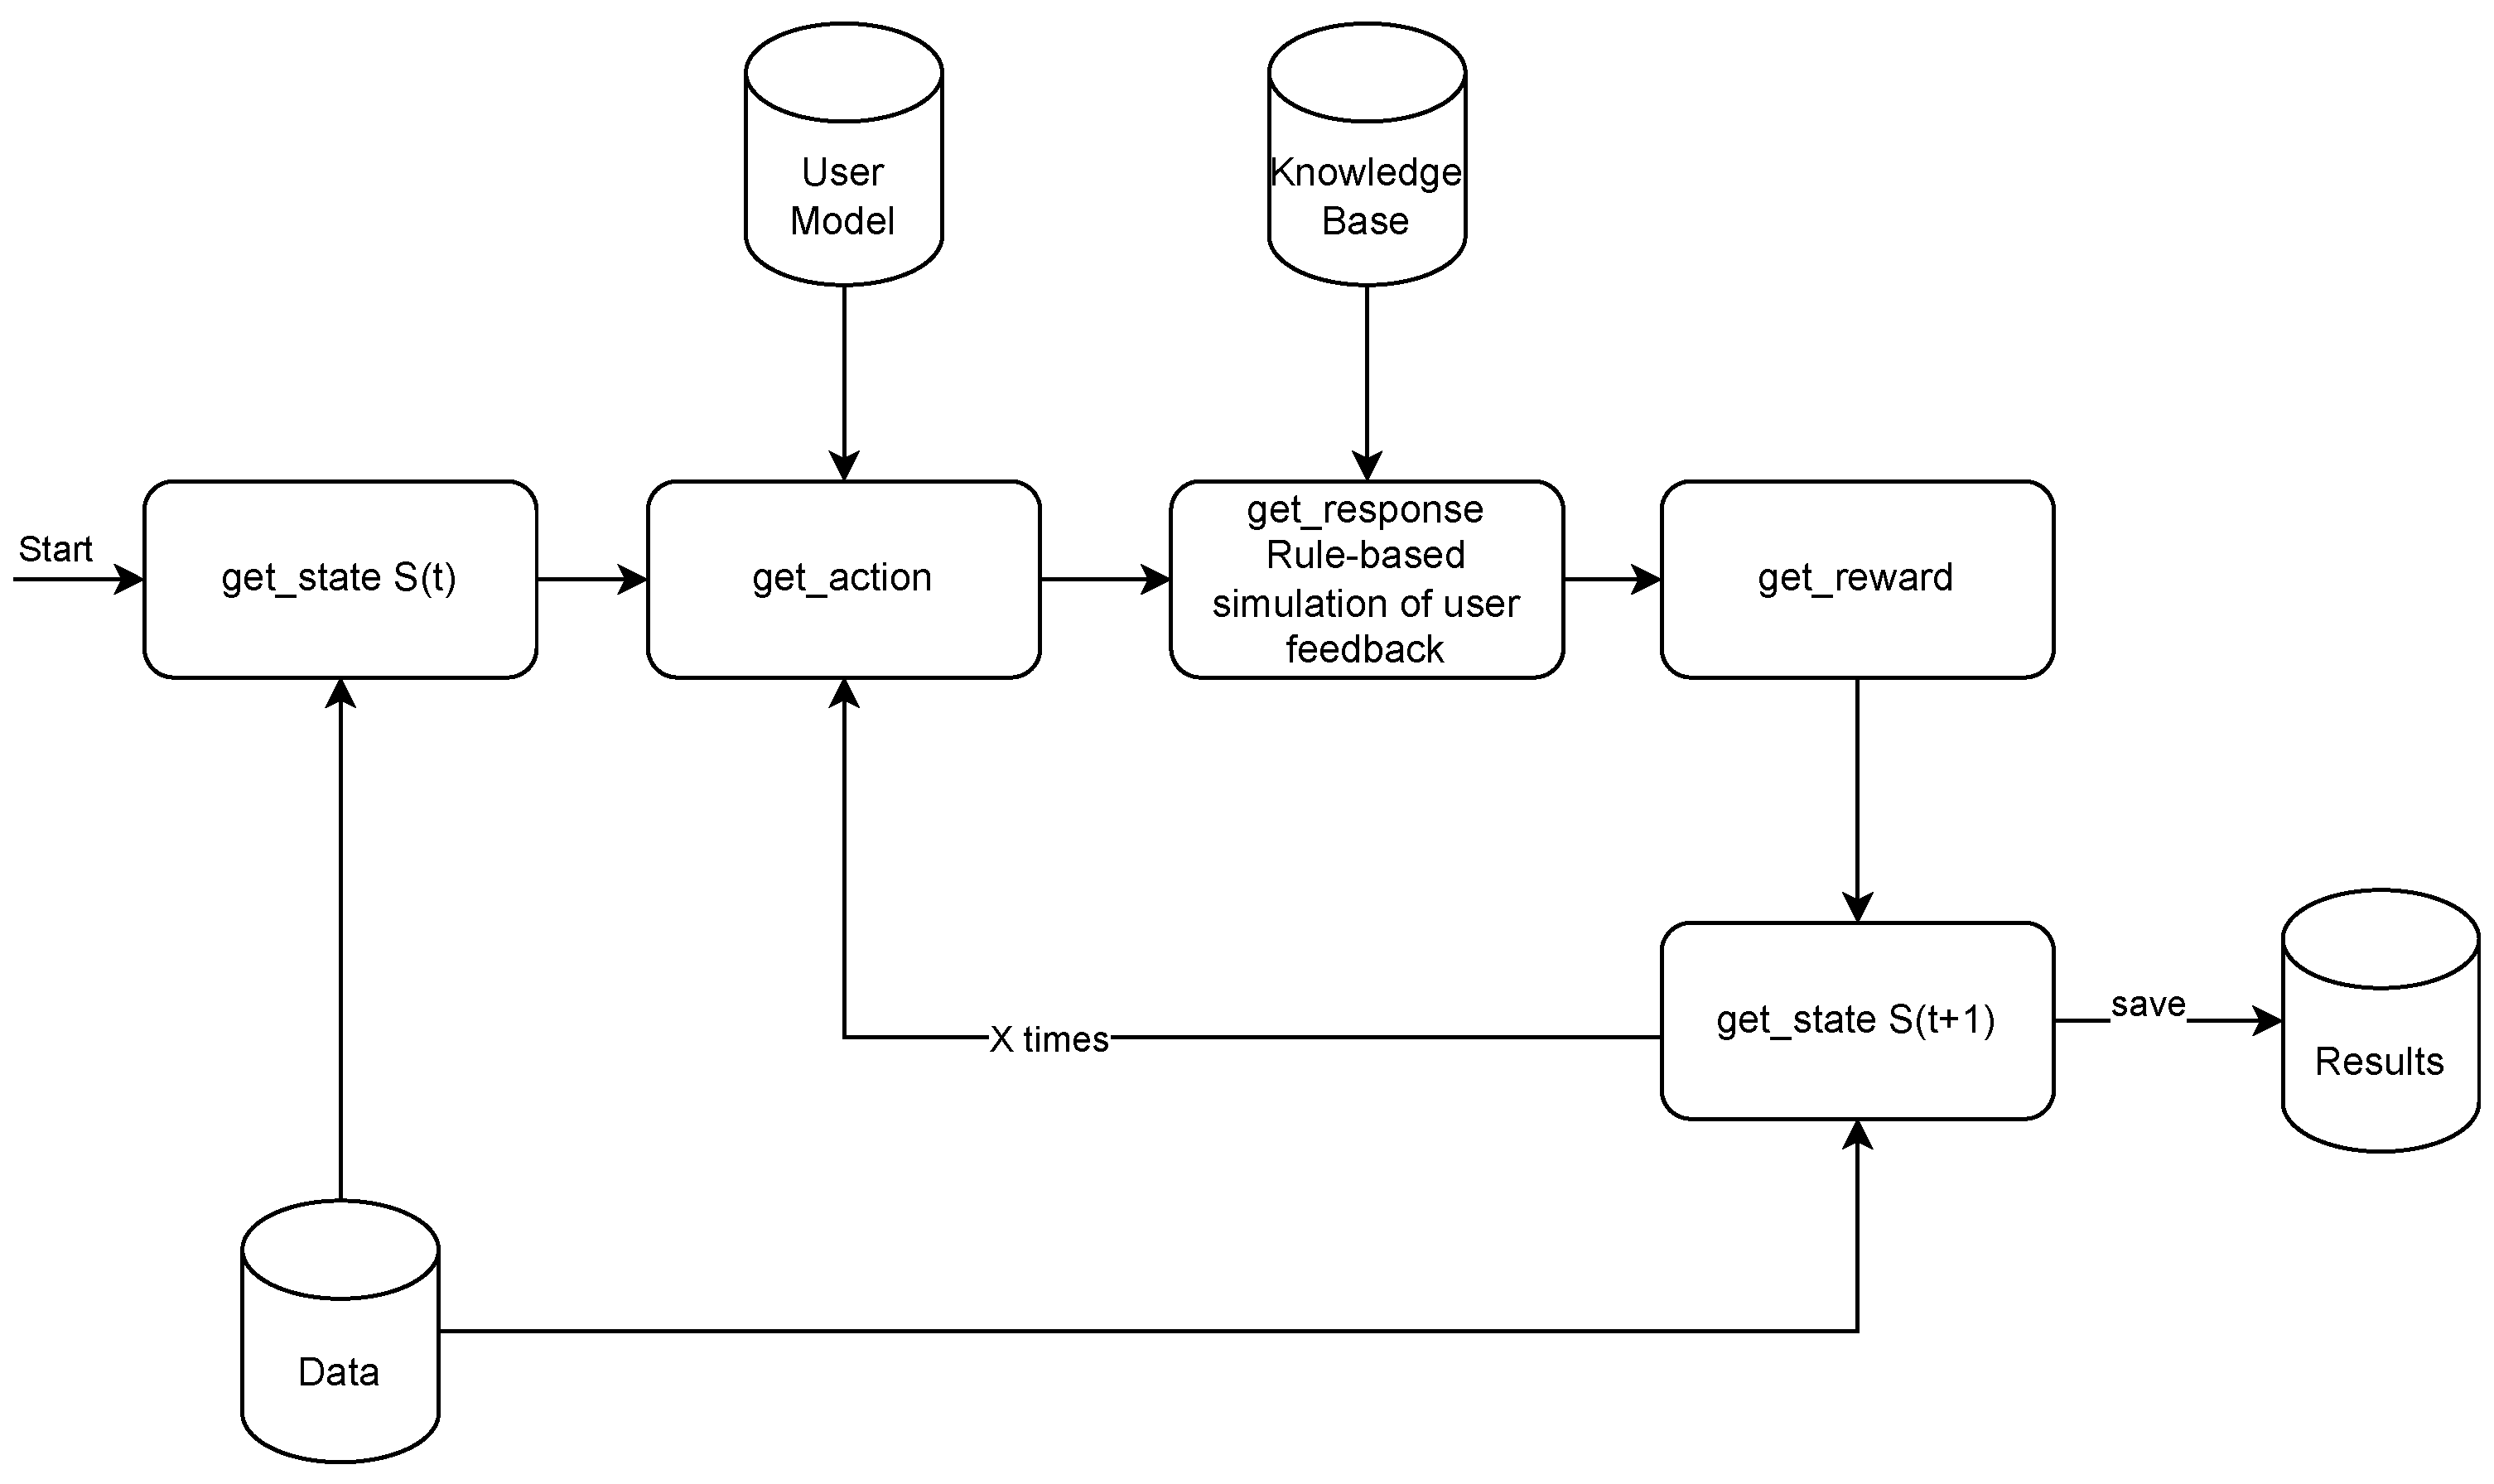
In
Figure 4, we can see a simulation flow chart with
X number of rounds, which corresponds to the for-each loop in function
Simulate in Algorithm 2.
Get_state blocks use generator described in the previous paragraph,
get_action follows
adaptive decision algorithm, with random user model used in base dataset creation to explore the environment, and trained model in evaluation and adaptation scenarios. User feedback is created by the rule-based expert system described at the beginning of this section, which substitutes a real user in the simulated environment. Based on the generated user feedback, the reward function value is calculated, and the state is updated. Finally, the results are saved in the results file.
| Algorithm 2 Data set generation algorithm |
procedure main() for each do function simulate() for each do return
|
The final dataset consists of 3000 simulated experiments, i.e., 36,000 data samples. The dataset generation algorithm is presented as Algorithm 2. The main procedure takes arguments as follows: file is a handle to a file where the dataset will be saved, num_of_sims is a number of simulated interactions to perform, personality is a personality type to simulate e.g., Talkative. The main procedure is responsible for running n simulations, collecting and saving their results to a file. The simulate function takes two arguments: num_of_rounds is a number of simulated interactions to simulate in human–robot interaction, one round can be, for example, communication: a robot asks a question and a user answers. The randomize_robot_gaze_strategy is a simple function that returns the robot gaze strategy randomly selected from human, stare, random. The personality_model is a representation of a user with a given personality.
4.2. Comparison of Machine-Learning Algorithms Used for Training User Models
In this work, we compared several algorithms that can be applied to train a user model that will be used to predict user reaction, which allows the choice of the right action for the robot in a given situation in the MPC paradigm. We decided to test the following five algorithms (with parameters given in parentheses): Decision Tree (gini split criterion), Random Forest (gini split criterion, num_estimators = 500, max_fetures = 0.4), ada boost(num_estimators = 1000, lr = 0.4), Light Gradient Boosting Machine (LGBM) (subsample = 1.0, num_estimators = 500, lr = 0.4, num_leaves = 80), KNN (n = 5) and two baseline algorithms, Random and One Rule, which select the reaction by random or using the one rule model learned from training data.
To clear training data by removing outliers, the following three algorithms were applied: Isolation forest (IF) outliers fraction set according to [
17], local outlier factor (LOF) outliers fraction set according to [
18], one-class SVM (OCS) with 0.01 outliers.
The results of the user models testing performed on a test dataset, containing 25% of the cases of the whole dataset, are presented in
Table 2. As we can see, the best results were achieved by LGBM and Random Forest algorithms. All outlier removing algorithms achieved similar results—see
Table 3,
Table 4 and
Table 5.
To evaluate each machine-learning algorithm used to train the model, 300 simulated experiments were performed for each algorithm. Each experiment has 12 rounds. For the best action, we calculated the value of the quality function and then summed it for each experiment. The results shown in
Figure 5 represent the performance of the base models, which are used in the framework to predict user behavior, as shown in
Figure 3 and Algorithm 1. The charts show the evaluation results in the form of box plots, where the median is marked in the center of each box, and the box extends from the first quartile to the third quartile of the data. The best-performing model (LGBM) is the same as during the learning phase; see
Table 2 and
Figure 5.
As we can see, using outlier removal during the learning stage provides minimal or no improvement for the best algorithm LGBM (compare
Table 2,
Table 3,
Table 4 and
Table 5). During evaluation, models trained on the cleared data performed slightly better, but the difference was not statistically significant. The Random Forest and LGBM algorithms scored the best results in the learning and evaluation phase, as they are more complex, have a larger capacity compared to other algorithms, and can better model the user in this task. The difference between the performance of Random Forest and LGBM algorithms compared to other tested algorithms is statistically significant.
The time complexity of the best models (as listed in
Table 2) tested in the evaluation scenario is presented in
Figure 6. Each box plot displays the results of 3600 simulated interactions using the assigned model. The total execution time of the
adaptive_decision function is measured. As expected, the simplest model (random) has the shortest execution time, while adaBoost has the longest. The LGBM model performs comparably to the fastest models while achieving the highest accuracy. In contrast, the Random Forest model is, on average, four times slower than the LGBM model, although it ranks second in terms of accuracy.
4.3. Adaptation
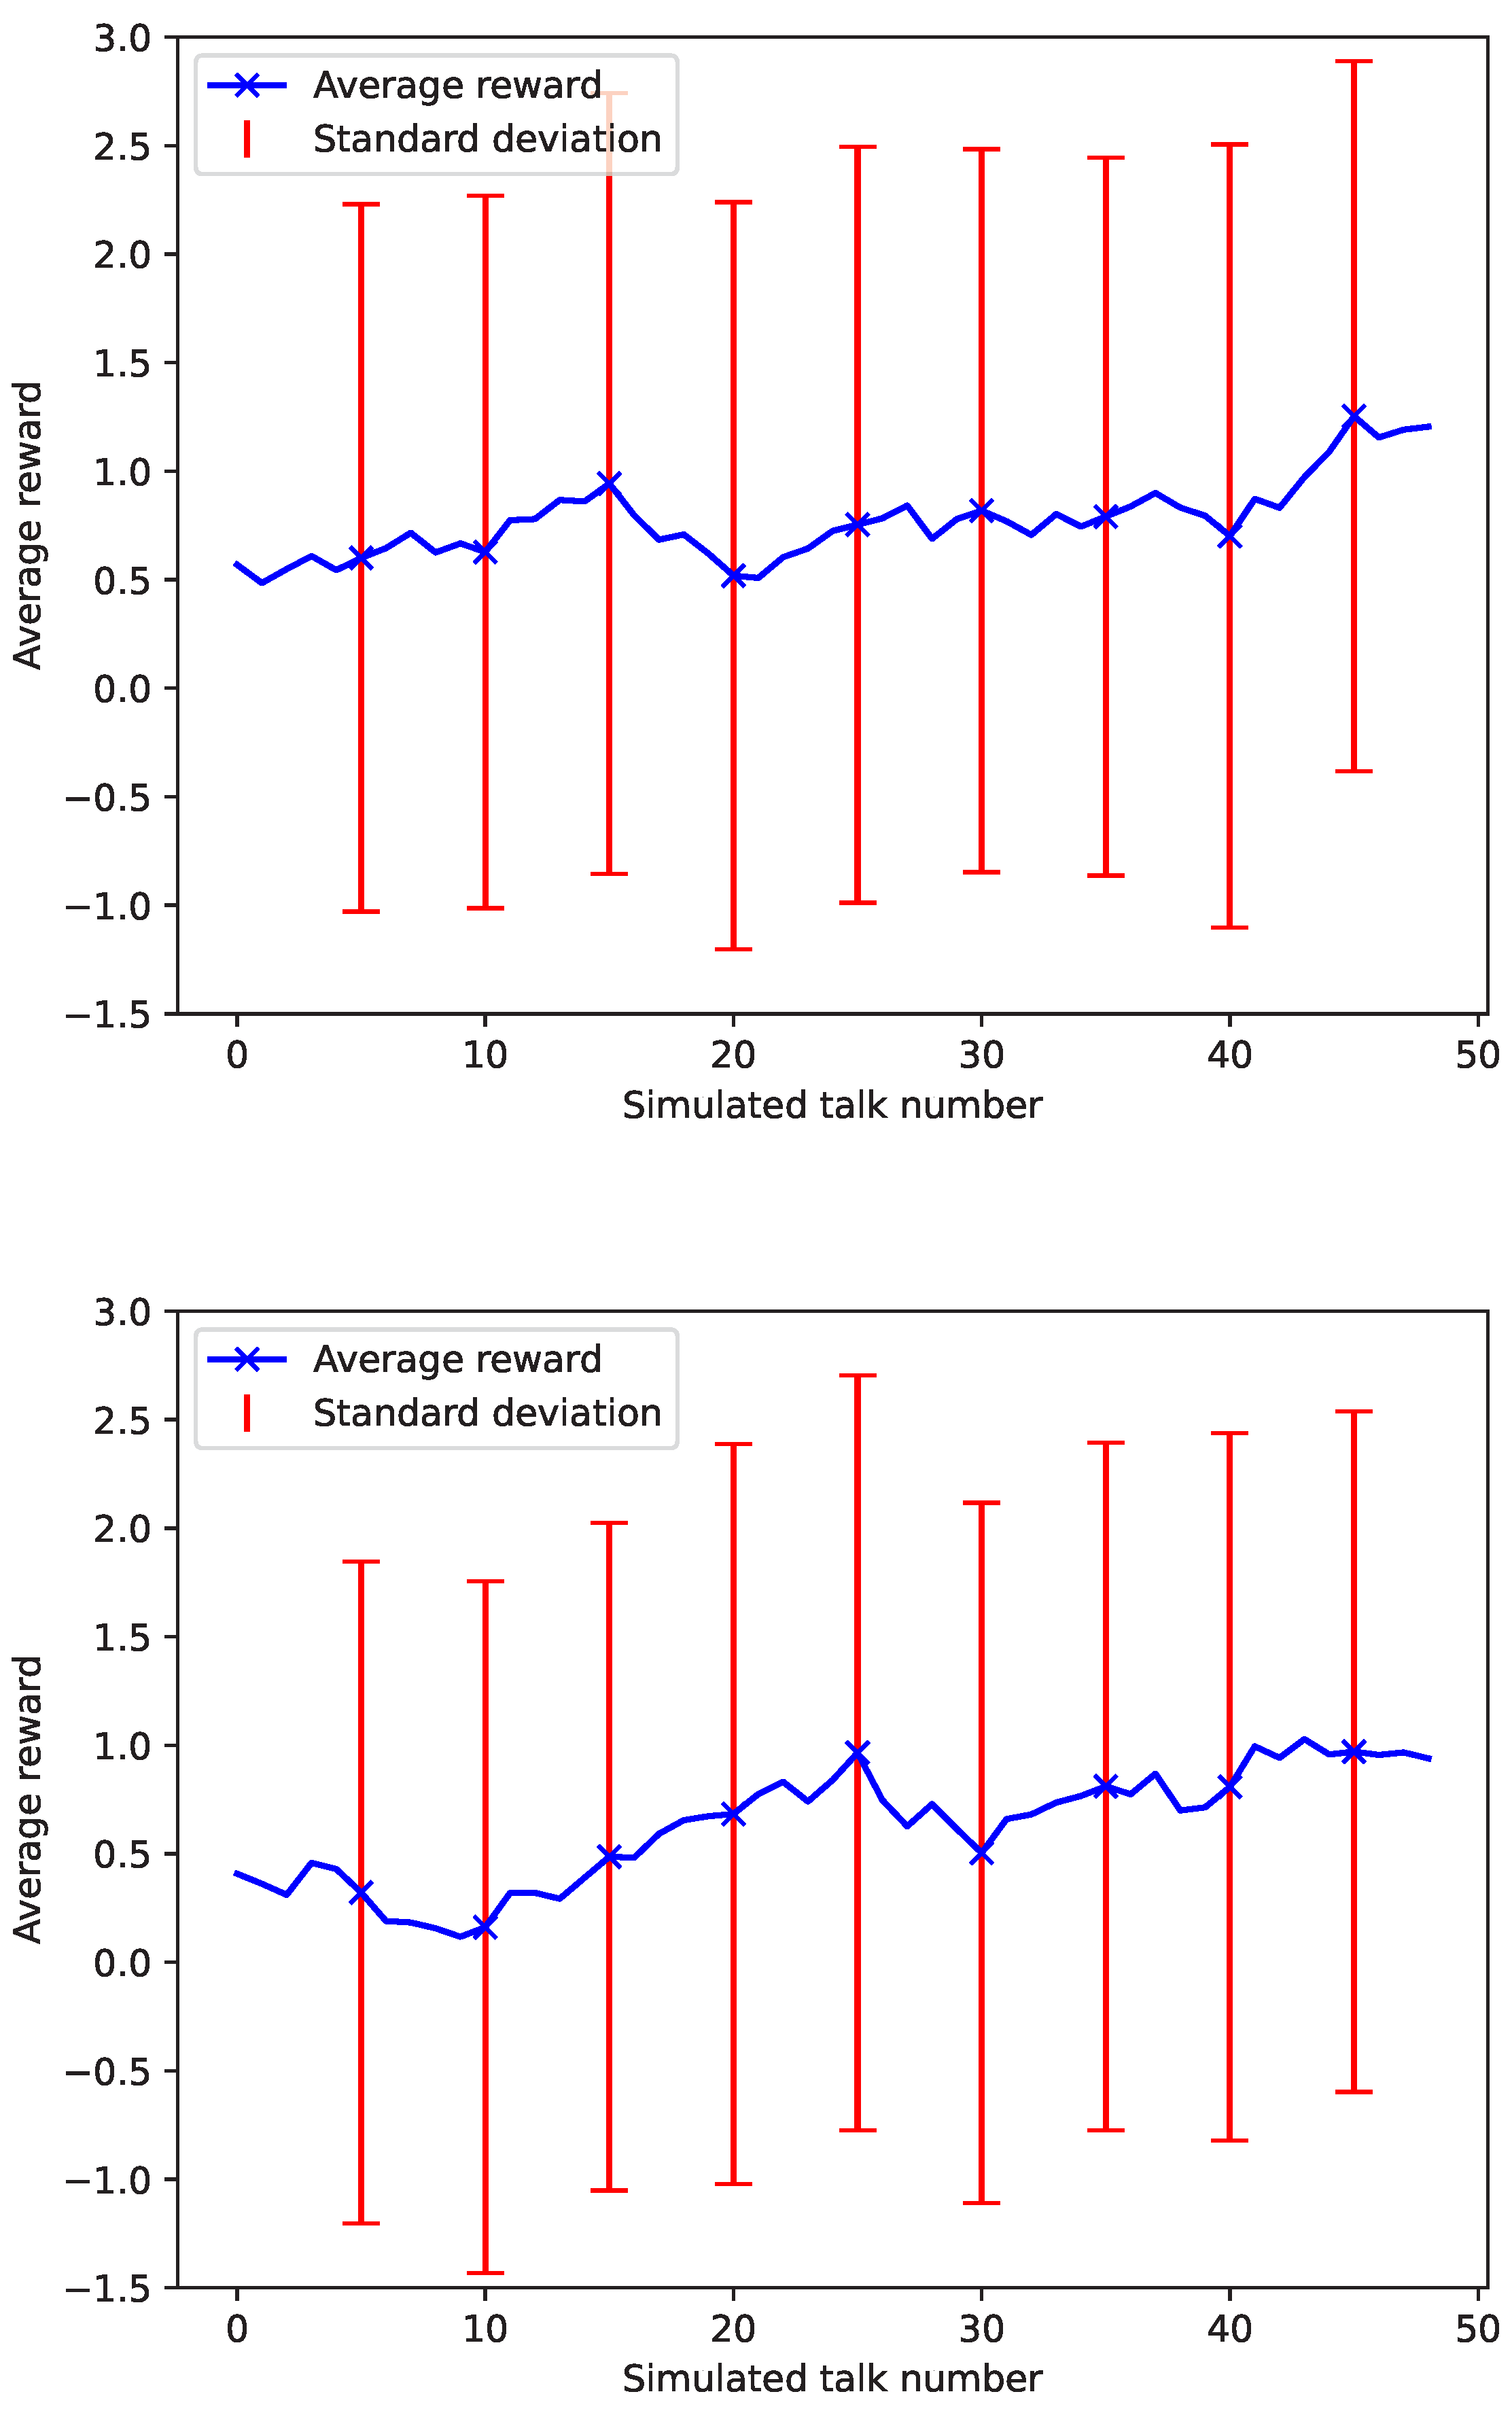
For experiments checking if robot behavior adaptation increases reward function values over time, the two best-performing algorithms were chosen: Random Forest and LGBM. The user models were retrained after every simulated conversation with a user, using new data samples and bootstrapped samples from the base dataset. Training data were weighted to balance size differences in datasets: new samples with a weight of 1 and base ones with 0.05. The simulation consisting of 50 talks was repeated 30×. The results are presented in
Figure 7. As we can see, the Random Forest algorithm increased the reward from 0.5 to almost 1.0 after 15 talks. LGBM algorithm achieved a similar result after 25 talks. In experiments, we have also tested another approach to adaptation—to vote for the final result. A new model was added to this ensemble after every interaction. The experimental results were worse than the base model.
4.4. Discussion
In the test data (
Table 2) and in the evaluation (
Figure 5), the best performance was achieved by the LGBM algorithm. The second one was Random Forest. However, in the robot domain, the time complexity of algorithms should also be taken into account. LGBM is also faster than Random Forest. This can be explained by comparing the sizes of the models. The LGBM model is more than 10× smaller than the Random Forest model, mainly due to the number of trees (500) in the Random Forest model, which was selected as the optimal configuration for performance. The Decision Tree algorithm takes third place according to the F1 score. It is very fast and has a low execution time variance and a small number of outliers. Therefore, it could be used in time-demanding settings. It is especially important in MPC, because the model is applied many times. The reason is the simplicity of the Decision Tree model. The performance of the KNN model, which is also very simple, is unstable, with a high number of longer execution times despite maintaining a low median.
In addition, performance differences and hardware issues can arise between simulations and real-world experiments. To minimize these discrepancies, we use the same software framework (as shown in
Figure 1) and the same servers used in real-world experiments with the Pepper robot.
Finally, to resolve uncertainties about the validity of simulations, the most reliable approach is to conduct numerous experiments with real users.
So far, we have run very few experiments on the real robot using the framework designed and user model based on LGBM trained offline. The proposed adaptation of robot behavior based on the MPC approach worked well.
5. Conclusions
In this study, we proposed an approach to the adaptation of robot behaviors to human actions based on Model Predictive Control. We also showed the possibility of using a simulated environment to create models for human–robot interaction and its advantages over performing real-world experiments. In experiments, the performance of five machine-learning algorithms for the user model (Decision Tree, Random Forest, ada boost, LGBM, and KNN) was evaluated in the simulated environment, showing an increase in average reward over time. The LGBM algorithm scored the best results, with the Random Forest trailing not far behind.The IF and LOF outlier-removal algorithms show a small improvement in simulated evaluation compared to the absence of outlier removal. We have also performed experiments to test the time complexity of selected models. LGBM was more than four times faster than Random Forest. Therefore, it is the best choice in the set of algorithms analyzed. The Decision Tree can also be considered a good choice in time-demanding cases. It has a little smaller F1-score than LGBM, but its execution time has a smaller variance and fewer outliers. Another advantage of the Decision Tree is its high explainability, which can also be useful.
All experiments were performed using prediction and control horizons equal to one, which is a limitation of the current implementation. Therefore, the search process is greedy. However, the approach proposed is general and allows for larger horizon values, which may be useful in complex tasks.
The results of experiments conducted in both a simulation environment and a real robot with a pretrained model confirmed that the proposed approach for the adaptation of robot behavior based on MPC performs effectively.
In our next study, we are going to collect additional data by conducting experiments with a real robot to statistically validate whether this approach can be effectively applied in real-world environments and to confirm our simulation-based results. The number of tests conducted so far has been insufficient for a comprehensive statistical analysis. We also plan to compare the proposed approach with reinforcement learning algorithms for this task. Preliminary studies have shown promising results. Another potential direction for future research is to conduct experiments with time horizon values greater than one to evaluate their impact on the robot’s performance.


