Article

Experimental Study of Material Proportioning for Similar Modeling of Brittle Rocks

by
Chaojun Zhang
1,
Chaoqun Chu
1,*,
Shunchuan Wu
1,2,3,*,
Rui Pang
1 and
Zhiyuan Xia
2
1
School of Civil and Resource Engineering, University of Science and Technology Beijing, Beijing 100083, China
2
Faculty of Land Resources Engineering, Kunming University of Science and Technology, Kunming 650093, China
3
Key Laboratory of Geohazard Forecast and Geoecological Restoration in Plateau Mountainous Area, Ministry of Natural Resources of the People’s Republic of China, Kunming 650093, China
*
Authors to whom correspondence should be addressed.
Appl. Sci. 2024, 14(24), 11694; https://doi.org/10.3390/app142411694
Submission received: 15 November 2024 / Revised: 10 December 2024 / Accepted: 12 December 2024 / Published: 14 December 2024

Abstract

:
Over the past 30 years, China has emerged as the country with the world’s largest engineering construction industry. However, rockbursts induced by tunnel excavation in rock engineering have resulted in a substantial number of casualties and extensive property damage. Understanding the brittle failure behavior of rock masses and identifying the mechanism of rockbursts have become critical challenges in the field. Physical model tests can provide a more intuitive simulation of the rockburst process. The selection and proportioning of materials similar to brittle rocks are crucial factors for the success of these model tests. This study selected refined iron powder, barite powder, quartz sand, gypsum powder, and a rosin–alcohol solution to prepare rockburst simulation materials characterized by a low strength and high brittleness. The rockburst tendency and brittleness indices were introduced, and an orthogonal experimental design was used to establish 25 different formulation schemes. The influence of the material component proportions on the physical and mechanical properties of the specimens, as well as their brittleness characteristics, was systematically analyzed. A multiple linear regression analysis was conducted to derive linear regression equations for the physical and mechanical parameters of the brittle rock simulation materials. In addition, simulation materials and standard specimens of Jinping marble were prepared. The brittle failure modes and acoustic emission characteristics of the specimens under uniaxial compression and Brazilian splitting conditions were analyzed. The results indicate that component proportions significantly affected the physical and mechanical properties of the specimens. The refined iron powder–barite powder ratio, as well as the concentration of the rosin–alcohol solution, played a primary role in controlling the physical and mechanical parameters of the brittle rock simulation materials.

1. Introduction

As large-scale underground engineering construction and mineral resource extraction extend to greater depths, rockbursts directly related to tunnel excavation have become increasingly frequent, causing a substantial number of casualties and extensive property damage [1,2,3]. A rockburst is a phenomenon characterized by the sudden and violent release of accumulated elastic strain energy within the rock mass, accompanied by rock fracturing and intense ejection [4,5]. Numerous scholars have conducted detailed research on rockbursts, including the conditions for their occurrence [6], triggering mechanisms [7,8,9], failure characteristics [10,11], and prevention measures [12,13]. However, reproducing the rockburst failure process in the laboratory remains a significant challenge.
Physical model tests are one of the most effective methods for addressing deep underground engineering problems. According to similarity principles, physical model testing can help conduct scaled-down studies of the rockburst problem, providing a more intuitive simulation of the rockburst initiation and triggering processes. Chen et al. [14] conducted plane strain model tests of rockburst failure under high-stress conditions using a large true triaxial physical model testing machine and found that the simulation results are generally consistent with the actual engineering conditions. Kusui et al. [15] analyzed the instability and ejection processes of the surrounding rock in hard-rock tunnels under high-stress conditions. Feng et al. [16] developed a novel large-scale three-dimensional physical model experimental system (PMES) capable of accommodating standard sample sizes of 2 m × 2 m × 1.5 m. The system was used to simulate the failure of the surrounding rock and the rockburst processes in the drainage tunnel of the Jinping-II hydropower station in China, and the authors discussed the effects of boundary stress, excavation, and geological structures on model deformation and failure.
The selection and proportioning of analogous materials have a significant impact on the physical and mechanical properties of the model body and play a decisive role in the success of physical model tests. Therefore, some scholars have attempted to conduct research on the proportioning of analogous materials for rockburst studies. Burgert et al. [17] developed model materials for rockburst simulation using epoxy resin with 3% to 5% hardener. Pan et al. [18] proposed a new similarity coefficient, E/λ, and developed a series of brittle materials that can simulate different types of rockbursts. Li et al. [19] developed rockburst simulation materials using sand, gypsum, cement, and a rosin–alcohol solution and conducted two-dimensional physical simulation studies of rockbursts to observe rockburst failure phenomena. Xu et al. [20] conducted proportioning experiments on simulation materials, identifying several types suitable for rockburst model testing. Chen et al. [21] selected the uniaxial compressive strength, the compressive strength–tensile strength ratio, and the impact energy index as evaluation indices. The optimal formulation for rockburst model materials was obtained by mixing quartz sand, gypsum, cement, glycerin, gelatin, and water. Zhou et al. [22] introduced the rockburst tendency index and the brittleness evaluation index to analyze the relationships between the influencing factors and the various indices of the materials using an orthogonal design and a sensitivity analysis. Wu et al. [23] formulated rockburst simulation materials and analyzed the stress in and displacement patterns of the surrounding rock during excavation processes in rockburst models with various types of structural surfaces. Ma et al. [24] prepared white sandstone simulation materials with a strong rockburst tendency and discussed the internal energy changes in and rockburst mechanisms of the specimens at different temperatures. Jiang et al. [25] prepared model materials with a rockburst tendency using quartz sand, gypsum, cement, and glycerin and analyzed the forms and characteristics of rockburst failure. Shi et al. [26] developed rockburst simulation material models and used the strain acquisition and digital microscopic imaging systems to analyze the deformation and failure evolution of the tunnel roof during continuous excavation.
Although the aforementioned scholars have made significant progress in the selection and proportioning of rockburst-mimicking materials, few have provided insights into the variation patterns in the physical and mechanical parameters of these materials, making it difficult to accurately predict their mechanical properties. Based on the previous research, in this study, we selected refined iron powder, barite powder, quartz sand, gypsum powder, and a rosin–alcohol solution to formulate similar materials. The rockburst tendency index and the brittleness index were introduced, and the orthogonal design method was used to analyze the influence of the material proportions on the physical and mechanical parameters of the specimens. As a result, linear regression equations for the various physical and mechanical parameters were obtained. Additionally, uniaxial compression tests were conducted to analyze the brittle failure modes and acoustic emission characteristics of the specimens, which helped verify the feasibility of using materials to simulate brittle rocks. The results of this study will provide a scientific basis and reference for material proportioning in similar model tests of rockbursts in brittle rocks.

2. Materials and Methods

2.1. Selection of Material Components

Simulation materials similar to rocks are generally composed of coarse aggregates, fine aggregates, and binders, and they always possess characteristics such as high density and low strength. However, materials prepared using the slurry casting method [18,20,27] often have issues such as low density, high strength, unstable mechanical properties, and long production times. Zhang et al. [28] developed a novel rock-similar material (IBSCM) that exhibits characteristics such as high density, low strength, stable performance, and short drying time. Building on previous research, this study selected refined iron powder and barite powder as fine aggregates, quartz sand as a coarse aggregate, and rosin–alcohol solution as the binder to formulate similar materials. Gypsum powder was added to adjust the brittleness of analogous materials. The material components are shown in Figure 1. In the figure, the barite powder is a mixture of equal proportions of 400-mesh, 600-mesh, and 800-mesh particle sizes, while the quartz sand is a mixture of equal proportions of 70–110-mesh and 110–160-mesh particle sizes; furthermore, the iron powder has a 200–300-mesh specification, the gypsum powder is α-type high-strength gypsum with a fineness of 1500 mesh, and the rosin used is premium-grade rosin from the Guangxi Masson pine.

2.2. Orthogonal Design of Material Proportions

Orthogonal experimental design [29] is an efficient method for addressing multi-factor optimization problems. It uses systematic arrangements and combinations to assist researchers in maximizing the exploration of the effects of multiple factors on experimental outcomes within limited experimental conditions.
A Taguchi L25 orthogonal array (comprising five factors and five levels) was used to systematically design material-proportioning tests. The five factors considered in this study were the mass ratio of refined iron powder to barite powder (factor A), the mass fraction of quartz sand (factor B), the mass fraction of gypsum powder (factor C), the concentration of the rosin–alcohol solution (factor D), and the dosage of the rosin–alcohol solution (factor E). The proportions of all material components were determined based on their respective masses to ensure consistency and accuracy in the experimental design. Five orthogonal levels were assigned to each factor, resulting in a total of 25 mix design schemes. The range of the five levels for each factor was determined based on the results of over 300 material-proportioning experiments conducted by Zhang et al. [28]. Table 1 and Table 2 present the orthogonal experimental design levels and the 25 groups of material-proportioning experimental schemes, respectively.

2.3. Material Mixing and Specimen Preparation

To prepare standard specimens, the materials were mixed according to proportioning schemes, followed by mechanical testing to obtain the physical and mechanical properties of the materials. To prepare specimens, this study designed and manufactured two sets of cylindrical molds of different specifications: one for fabricating standard cylindrical specimens of Φ50 mm × H100 mm size for uniaxial compression tests and the other for producing Brazilian disc specimens of Φ50 mm × H25 mm size for Brazilian splitting tests.
According to the orthogonal design scheme, the components were weighed, and the refined iron powder, barite powder, quartz sand, and gypsum powder were mixed together and thoroughly blended using a mixer. To prepare the rosin–alcohol solution, a suitable amount of rosin was measured and added to industrial alcohol, followed by slow stirring to facilitate the dissolution of rosin. While the aggregates were stirred, the rosin–alcohol solution was gradually poured into the mixture until it was thoroughly blended.
A suitable amount of the mixture was weighed and poured into the mold in multiple batches, applying pressure to compact it. After each compaction, a fork was used to roughen the surface of the specimen to prevent layering before pouring in additional mixture for further compaction. The mold containing the specimen was placed on a YAW-600 electro–hydraulic servo pressure testing machine and compacted at a pressure of 3 MPa. Due to the lower strength of the specimen in the initial stages, it was demolded using an extrusion method to prevent internal damage.
Labels were affixed to the specimens, which were then placed in a cool, ventilated area to dry for 7 days. For each set of material proportions, at least three standard cylindrical specimens and three Brazilian disc specimens were produced, resulting in a total of over 170 specimens. A portion of the completed specimens is shown in Figure 2.

2.4. Testing Methods and Evaluation Indicators

This study used uniaxial compression tests and Brazilian splitting tests to measure the mechanical parameters of the specimens, as shown in Figure 3. The uniaxial compression test determines the compressive strength and elastic modulus of the analogous materials, while the Brazilian splitting test measures their tensile strength. During the loading process, the acoustic emission related to specimen fracture was simultaneously monitored.
To develop rock simulation materials characterized by brittleness for use in large-scale true three-dimensional physical model experiments investigating the evolution process of rockbursts, it is essential to evaluate the rockburst tendency and brittleness of the materials in addition to identifying their fundamental mechanical parameters.
Rockburst tendency refers to the activity and intensity with which rock is likely to experience a rockburst under specific conditions [30]. This tendency determines the rock’s capacity to undergo rockburst failure. The rockburst tendency index, Wcf [31], is a widely used evaluation indicator for assessing rockburst tendency. In this study, Wcf was used as a criterion to determine whether the analogous materials exhibit rockburst potential. Wcf represents the ratio of the total input energy density prior to the peak to the failure energy density following the peak in the stress–strain curve obtained from the uniaxial compression test of a rock specimen.
Wcf is defined as follows:
Wcf = E1/E2,
where E1 is the total input energy density calculated from the rising segment of the stress–strain curve during the uniaxial compression test and E2 is the failure energy density calculated from the descending segment of the stress–strain curve (see Figure 4). The energy density can be calculated by integrating the stress–strain curve of the specimen.
The classification criteria for the rockburst tendency index, Wcf, are as follows: Wcf < 1.0 indicates no rockburst tendency, 1.0 ≤ Wcf < 2.0 indicates moderate rockburst tendency, and Wcf ≥ 2.0 indicates strong rockburst tendency [32].
Currently, most scholars use the compressive strength–tensile strength ratio as a brittleness evaluation index. However, this ratio reflects the material’s strength characteristics rather than its complete brittleness characteristics. It does not account for other parameters, such as residual strength, that influence the variations in rock brittleness. The sensitivity of the compressive strength–tensile strength ratio is insufficient to describe the brittleness differences among various rocks, and its range of variation is quite limited. This study introduces the rock brittleness index, Bi [33], to assess the brittleness of the analogous materials. The rock brittleness index, Bi, consists of two components: the rate of stress drop after the peak and the ratio of the elastic energy released during failure to the total energy stored before the peak strength. The definition of Bi is as follows:
B i = σ p σ r ε r ε p + σ p σ r ε r ε p σ p ε p ,
where σp and σr are the peak strength and the residual strength, respectively, and εp and εr are the peak strain and the residual strain, respectively. The larger the Bi value, the higher the brittleness of the analogous material.

3. Experimental Results and Analysis

3.1. Physical and Mechanical Parameters of the Materials

Each group of specimens was weighed and their dimensions measured. Next, uniaxial compression and Brazilian splitting tests were conducted to obtain the stress–strain curves of the specimens. The density (ρ), compressive strength (σc), tensile strength (σt), and elastic modulus (E) of the specimens were calculated. Additionally, the rockburst tendency index (Wcf) and the brittleness index (Bi) were determined using Equations (1) and (2), presented in Section 2.4. The test results are presented in Table 3. The density range of the specimens produced with different proportioning schemes was between 2.10 and 2.40 g/cm3, while the compressive strength ranged from 0.12 to 1.94 MPa. The tensile strength varied between 0.01 and 0.20 MPa, and the elastic modulus was in the range of 0.120 to 0.772 GPa. The rockburst tendency index exhibited a range of 0.59 to 3.29, and the brittleness index varied from 0.141 to 1.578. Note that the variation ranges in the aforementioned parameters represent only the results derived from the 25 mix design schemes.

3.2. Sensitivity Analysis of Factors

In orthogonal design, the range analysis method is commonly used to evaluate the sensitivity and priority order of various influencing factors in the experiments, allowing for the identification of the primary and secondary factors. According to the theory of orthogonal experiments, the average physical and mechanical parameters corresponding to factors A through E at the same level are calculated, and the range is determined by subtracting the minimum average value of the physical and mechanical parameters from their maximum average value across different levels. A larger range indicates that the factor has a more significant effect on the corresponding physical and mechanical parameters. Therefore, based on the magnitude of the range, the primary and secondary importance of the influencing factors can be determined.

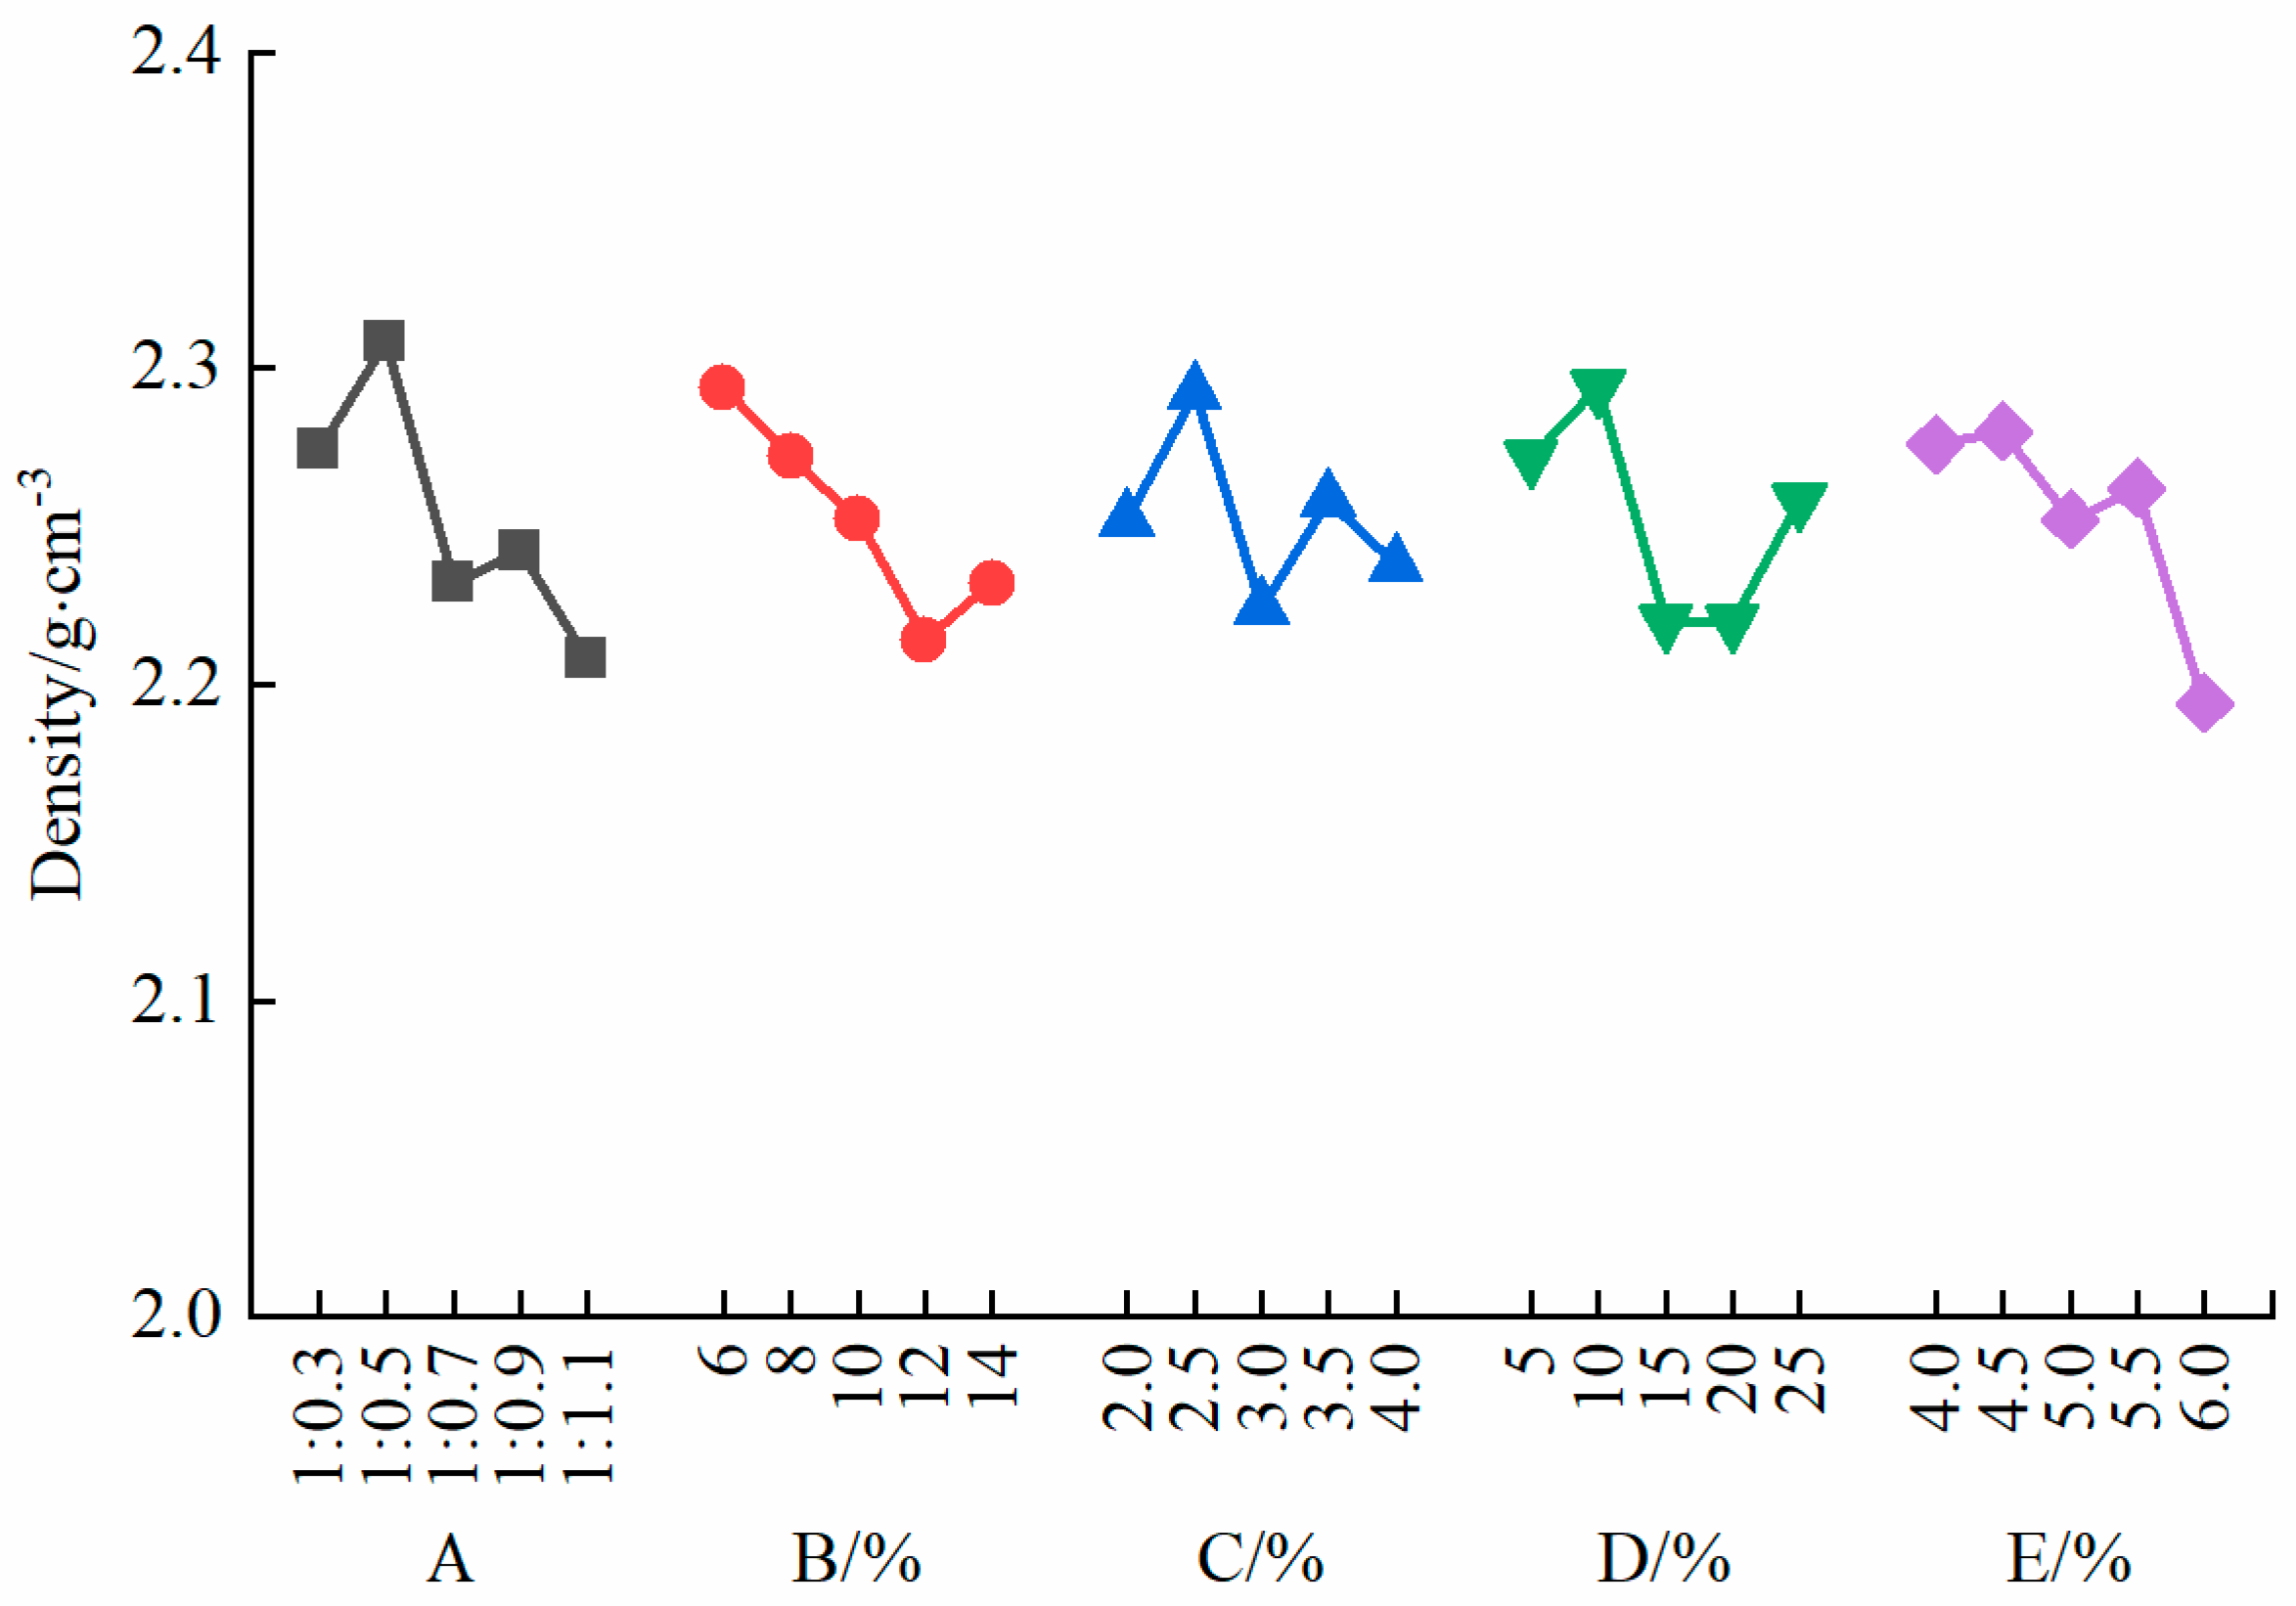
3.2.1. Sensitivity Analysis of Density

As shown in Figure 5, the density of the specimens decreased with a reduction in the refined iron powder–barite powder ratio. The maximum density of the specimens was observed when the refined iron powder–barite powder ratio was 1:0.5. The density of the specimens also decreased with an increase in the quartz sand content. The maximum density was reached at a quartz sand content of 6%, while the minimum density occurred at a quartz sand content of 12%. In addition, the density of the specimens decreased with increasing concentrations and dosages of the rosin–alcohol solution. However, at a rosin–alcohol solution concentration of 25%, the density of the specimens actually increased. The effect of the gypsum content on the specimen density was not significant. The maximum density was observed at a gypsum content of 2.5%.
The density of the refined iron powder in the aggregates was the highest, playing a dominant role in the specimen density, while the quartz sand, being a coarse aggregate, had a negative impact on the density of the specimen. Based on the sensitivity analysis of specimen density (see Table 4), the refined iron powder–barite powder ratio had the greatest impact on the specimen density, with a range of 0.10. In contrast, the gypsum content and the rosin–alcohol solution concentration had the least effect, with a range of 0.07. The sensitivity ranking of the factors influencing specimen density is as follows: A > E > B > D = C.

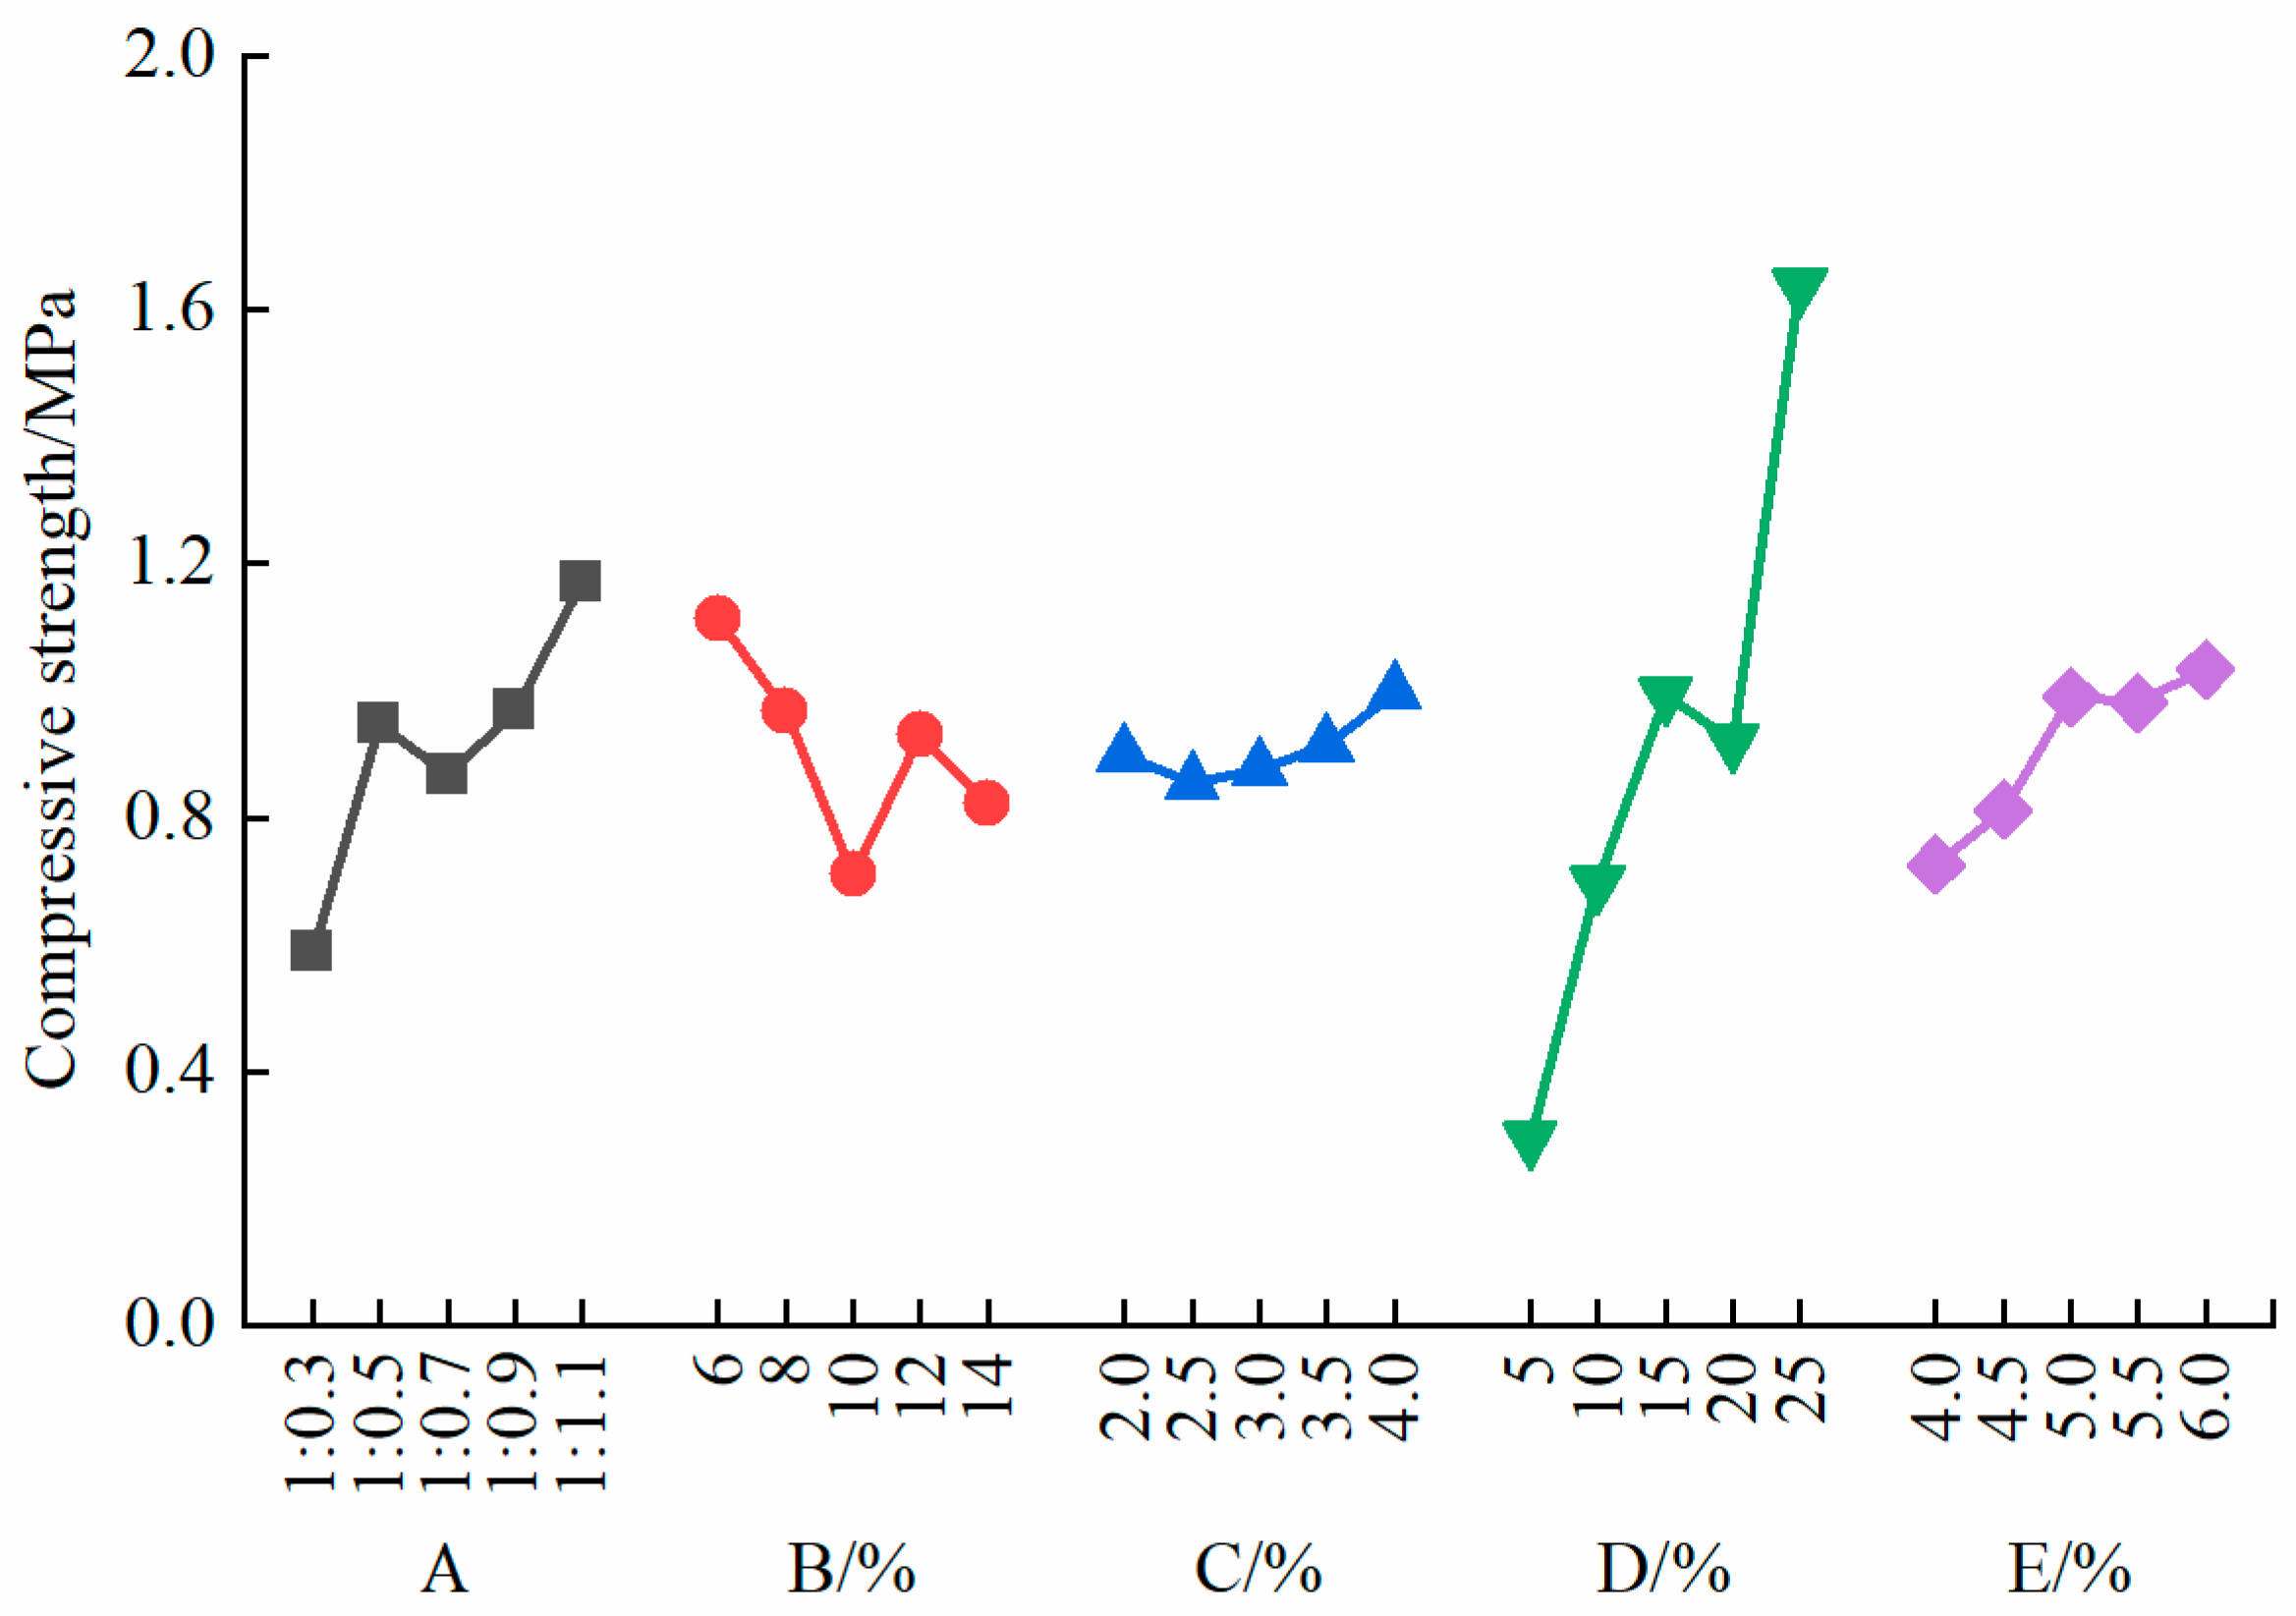
3.2.2. Sensitivity Analysis of Compressive Strength

As shown in Figure 6, the compressive strength of the specimens increased as the refined iron powder–barite powder ratio decreased, reaching its maximum value when the ratio was 1:1.1. The compressive strength of the specimens also increased with the increasing concentration of the rosin–alcohol solution, reaching its maximum value when the concentration was 25%. However, the compressive strength of the specimens initially decreased, then increased, and then decreased again with the increasing content of quartz sand. The minimum compressive strength was observed when the quartz sand content was 10%. The compressive strength of the specimens increased with the increasing dosage of the rosin–alcohol solution. Although there was a positive correlation between the compressive strength and the gypsum content, the effect of the gypsum content on the compressive strength was not significant. The maximum compressive strength was observed at a gypsum content of 4.0%.
The rosin–alcohol solution primarily served as a binder within the specimen, and the binding properties of the rosin enhanced the compressive strength of the specimen. Since quartz sand is classified as a coarse aggregate with a larger mesh size, the increase in the aggregate strength positively impacted the compressive strength of the specimen. However, as the quartz sand content increased, the gaps between the aggregates within the specimen also increased, leading to a reduction in bonding strength. Consequently, the compressive strength first decreased, then increased, and then decreased again. Based on the sensitivity analysis of the compressive strength of the specimens (see Table 5), the concentration of the rosin–alcohol solution had the greatest impact on the compressive strength, with a range of 1.34. Conversely, the gypsum content had the least effect, with a range of 0.14. The sensitivity ranking of the factors influencing compressive strength is as follows: D > A > B > E > C.

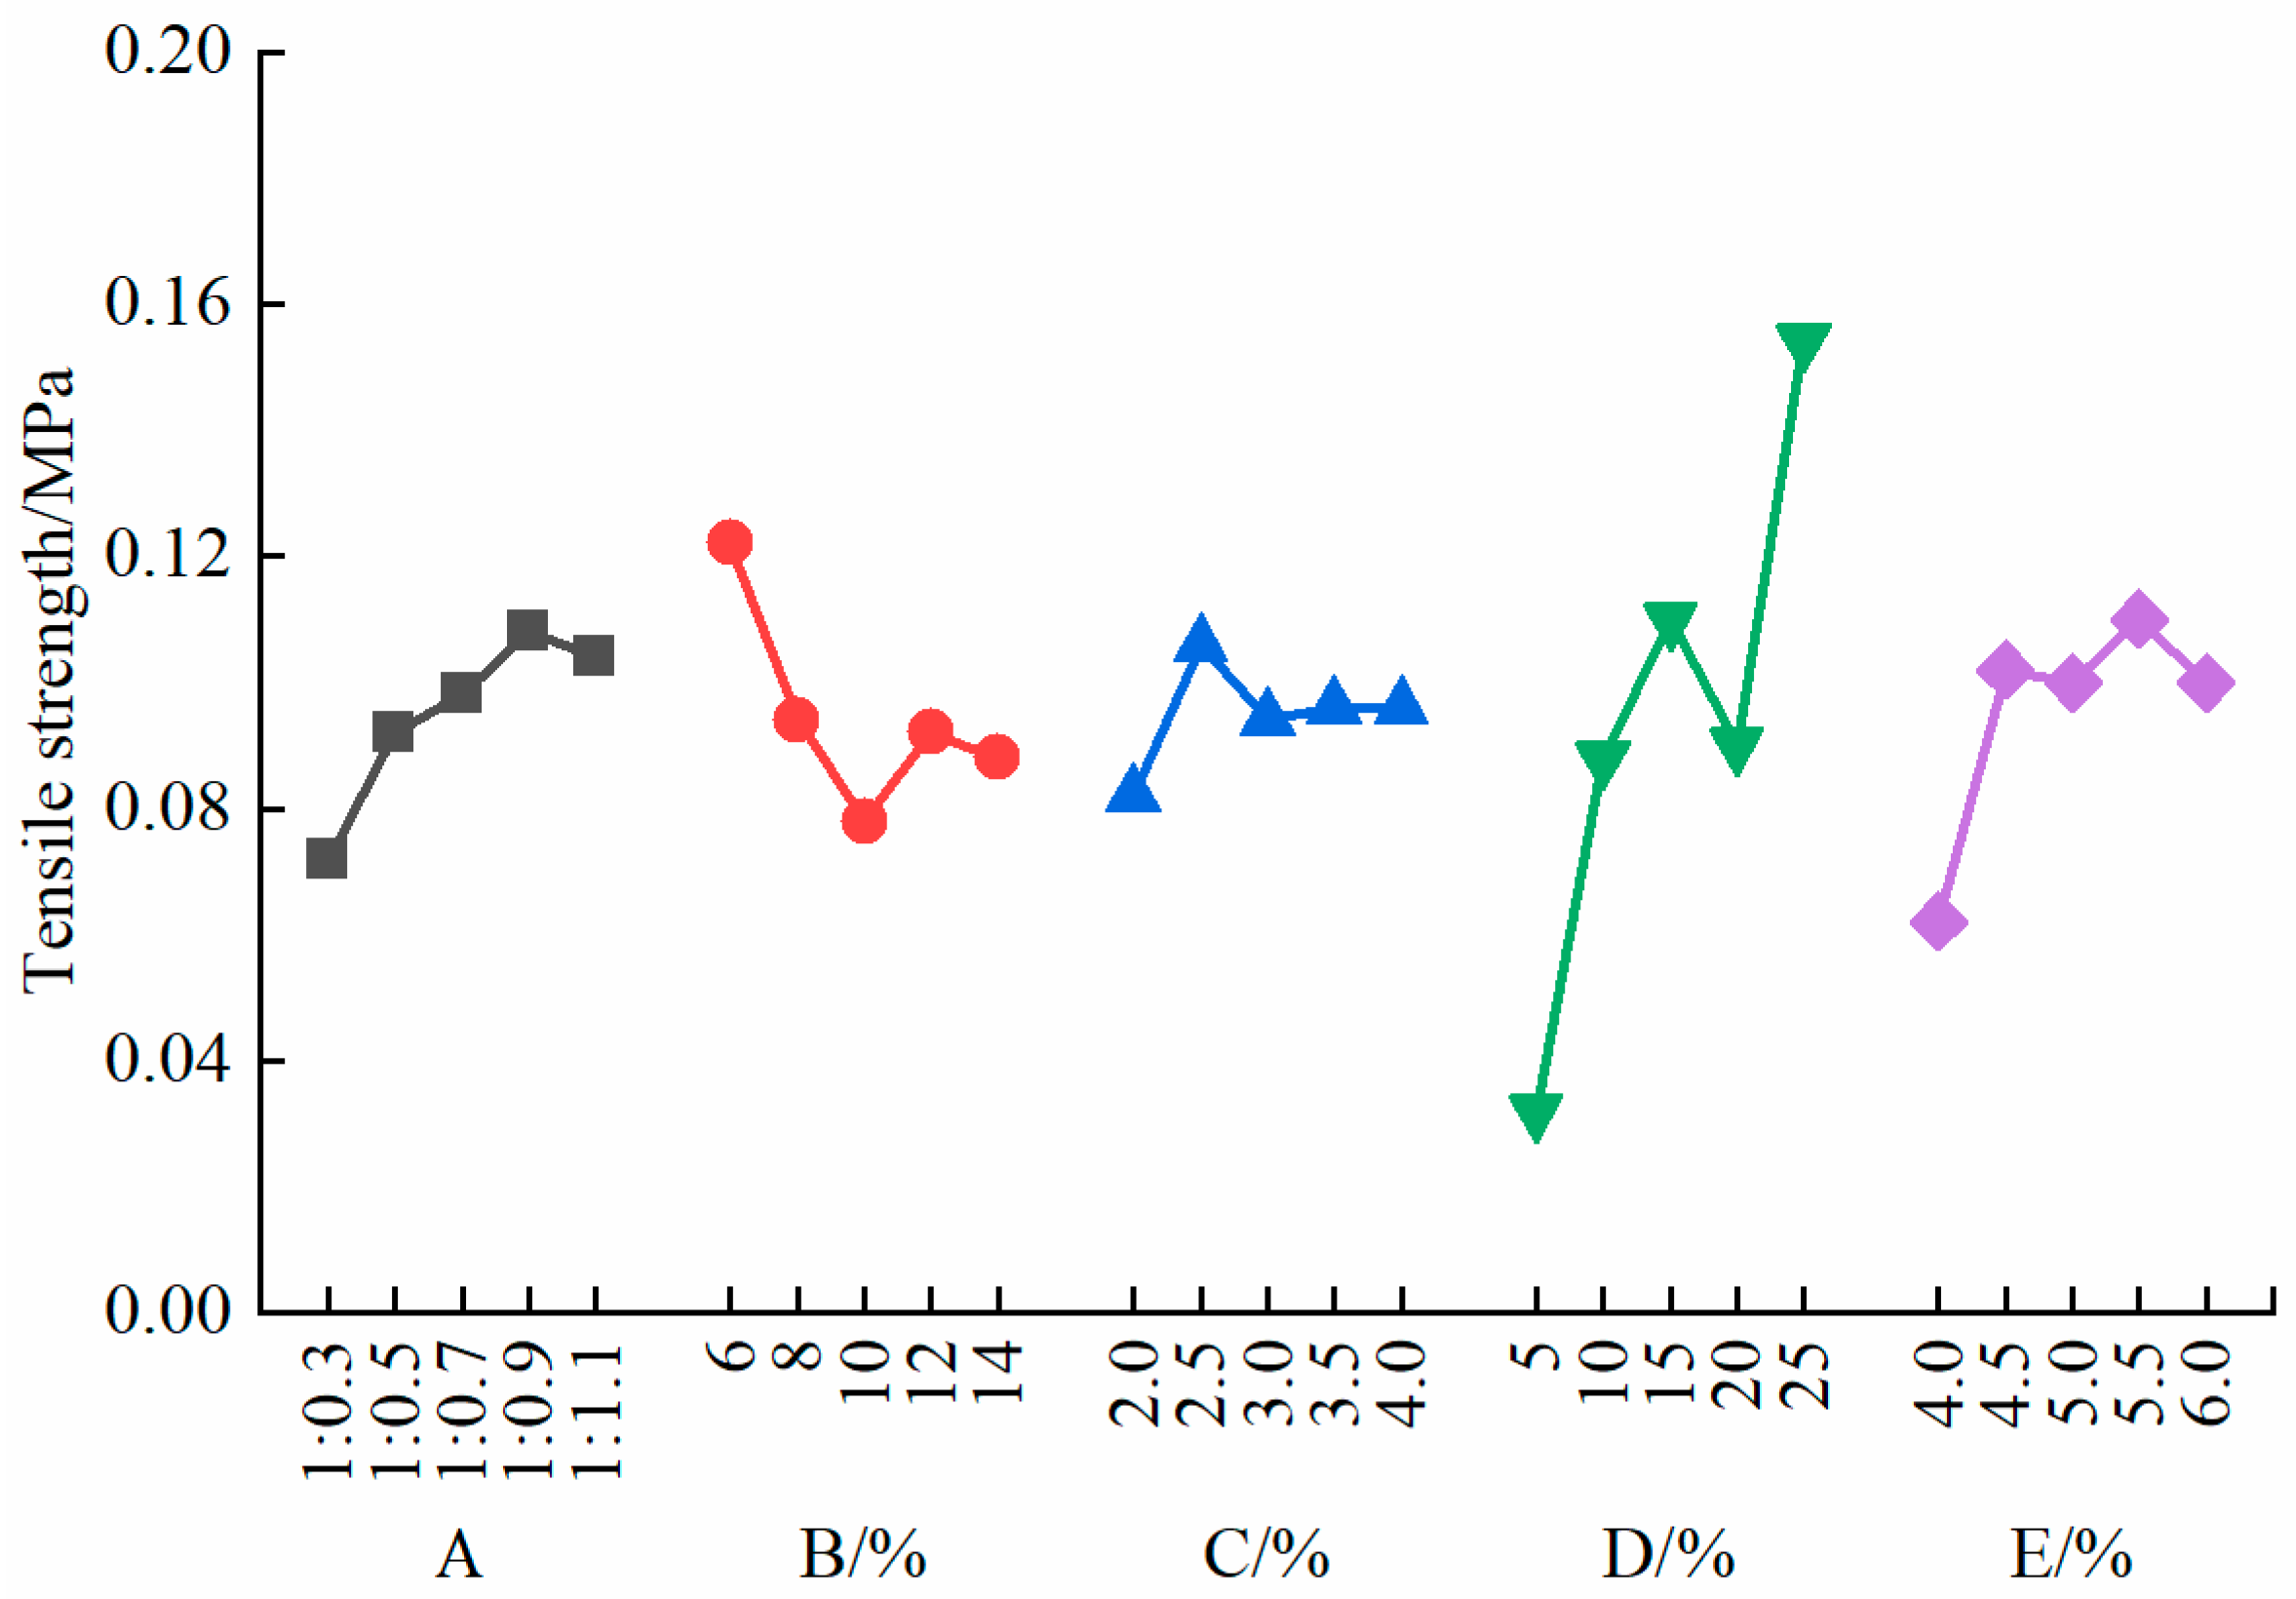
3.2.3. Sensitivity Analysis of Tensile Strength

As shown in Figure 7, the tensile strength of the specimens increased with the increasing concentration of the rosin–alcohol solution, reaching its maximum value when the concentration was 25%. The tensile strength of the specimens also increased with the increasing dosage of the rosin–alcohol solution, peaking when the solution content reached 5.5%. However, with the increasing quartz sand content, the tensile strength of the specimens initially decreased, then increased, and then decreased again, reaching a minimum when the quartz sand content was 10%. The gypsum content showed no significant effect on the tensile strength of the specimens.
The bonding effect of the rosin–alcohol solution enhanced the tensile strength of the specimen. However, a high quartz sand content reduced the cohesion between the materials, leading to opposing trends in their impact on the tensile strength. The range analysis of tensile strength (Table 6) indicated that the rosin–alcohol solution concentration had the most significant impact on the tensile strength of the specimens, with a range of 0.12, while the gypsum content had the least effect, with a range of 0.03. The sensitivity ranking of the factors influencing tensile strength is as follows: D > E > B = A > C.

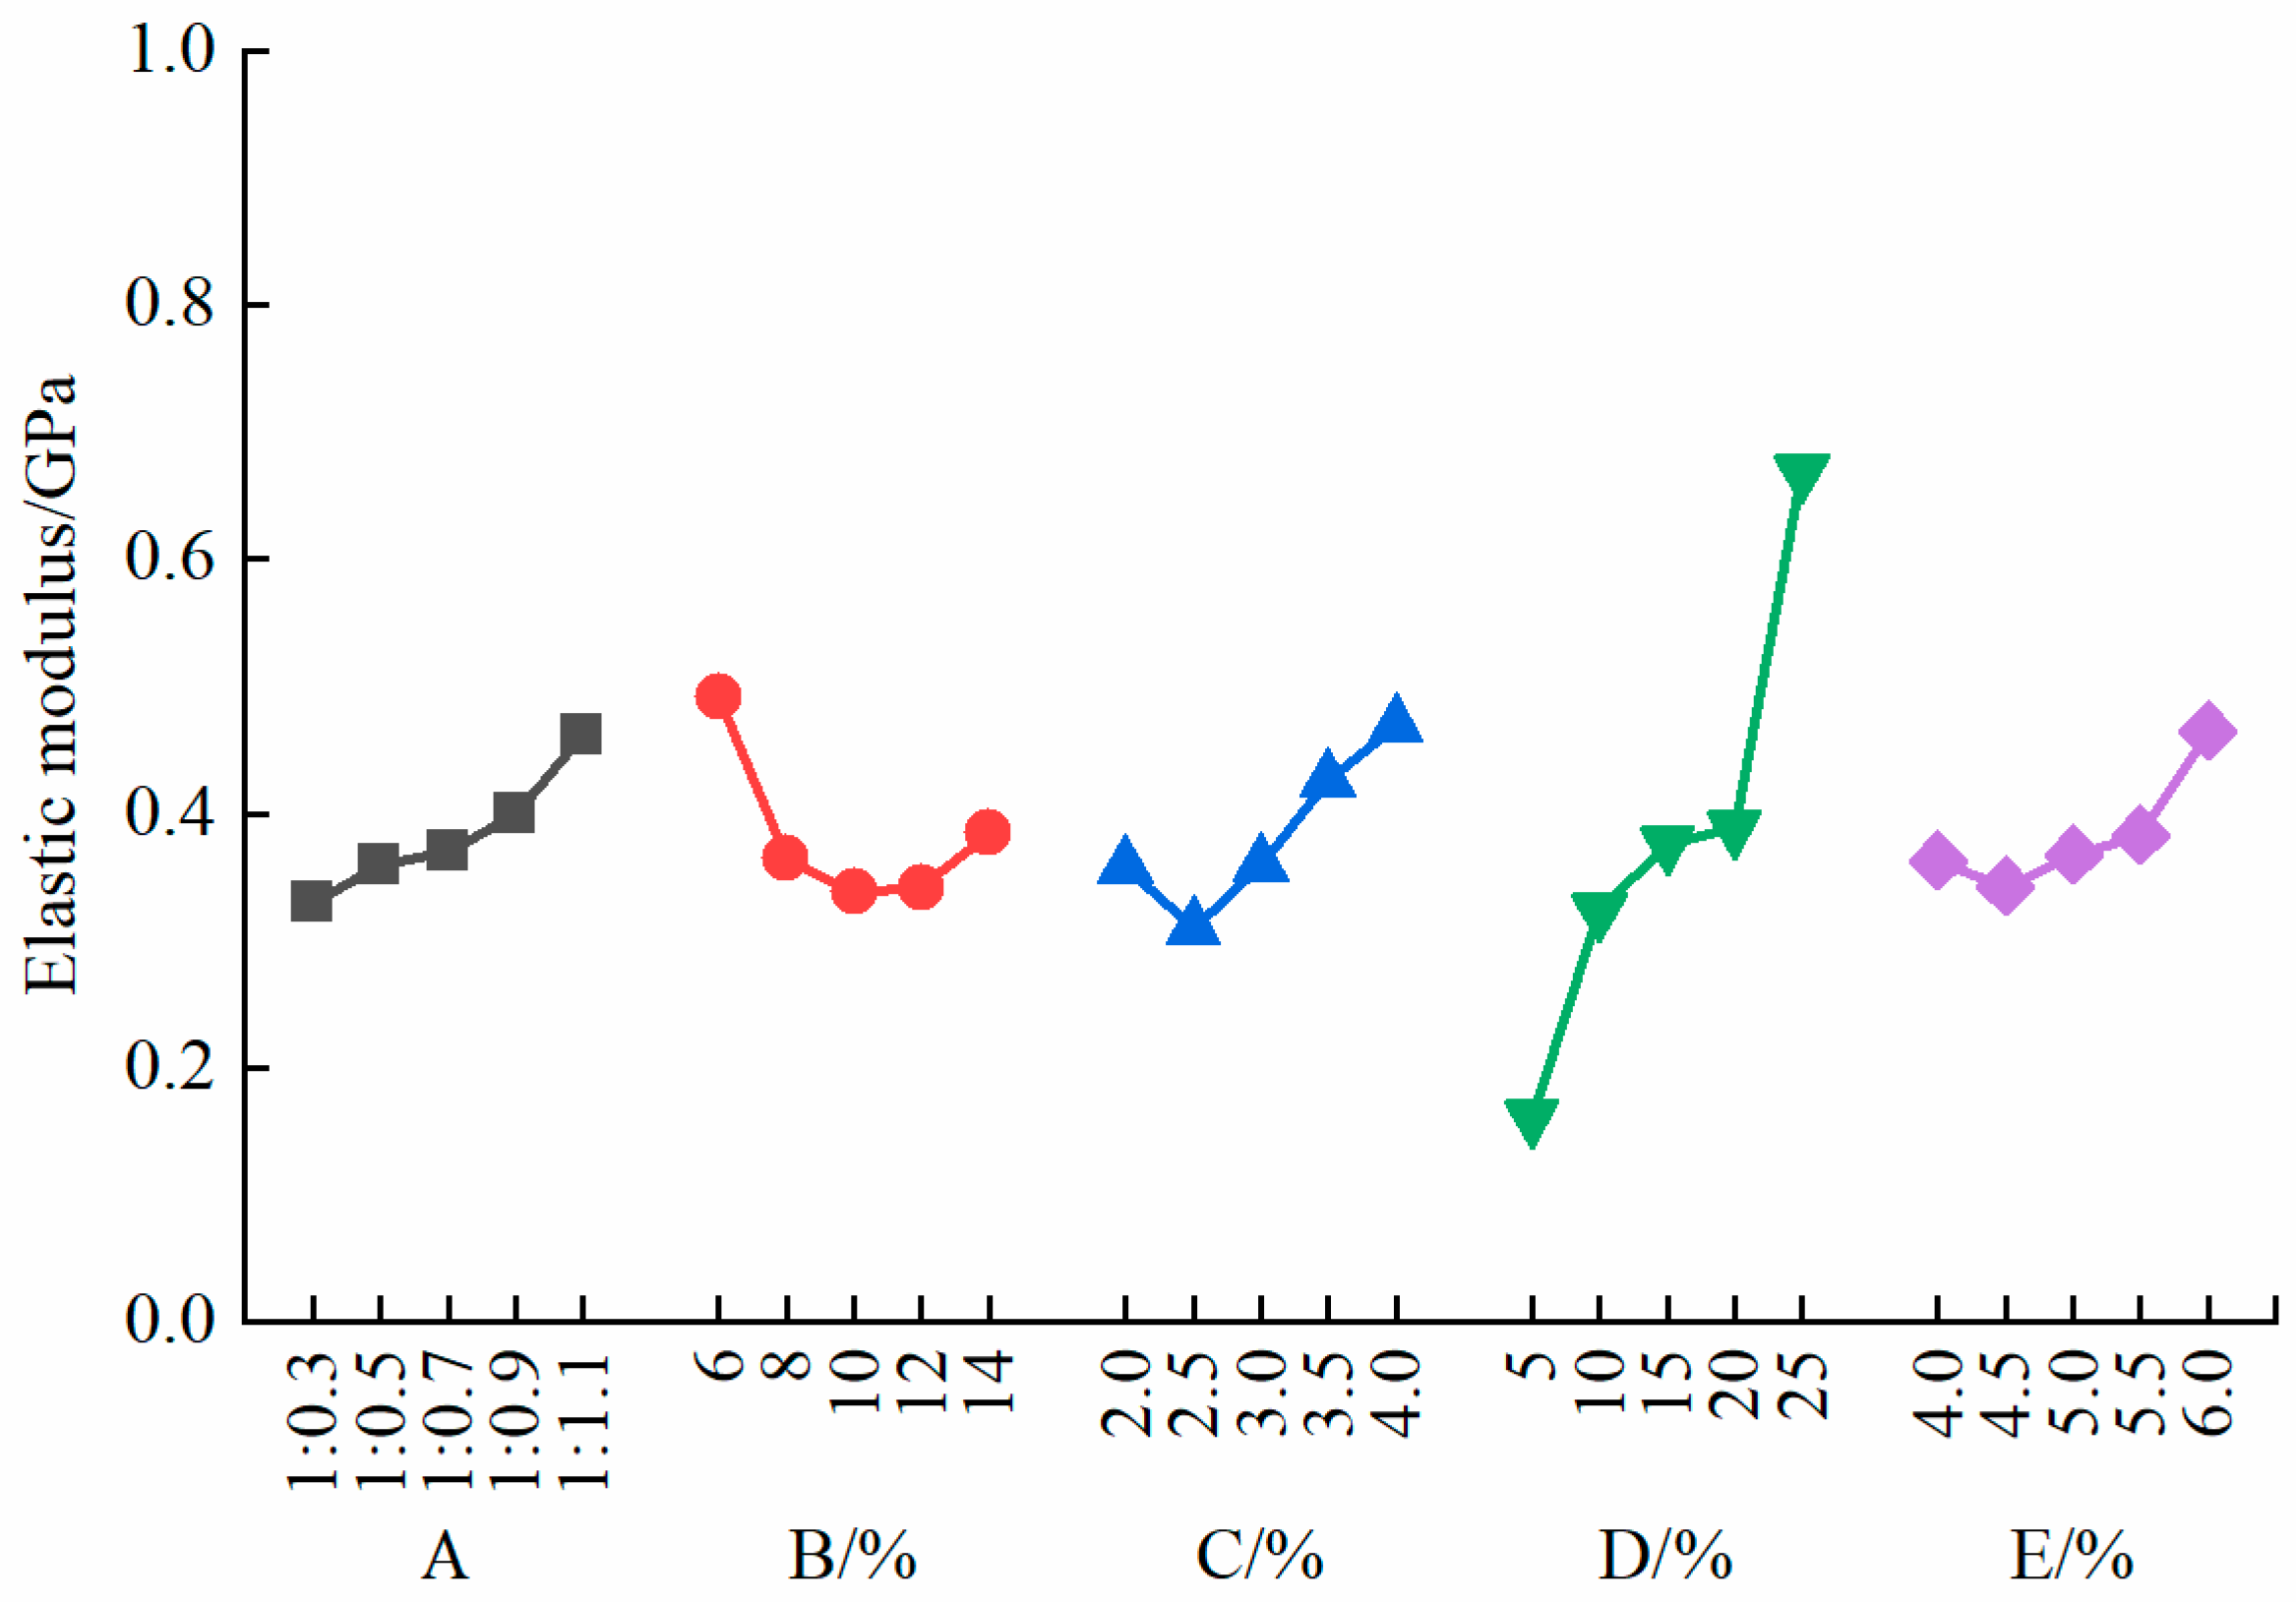
3.2.4. Sensitivity Analysis of the Elastic Modulus

As shown in Figure 8, the elastic modulus of the specimens increased as the iron powder–barite powder ratio decreased. The maximum elastic modulus was observed when the iron powder–barite powder ratio reached 1:1.1. The elastic modulus of the specimens increased with the gypsum content, the rosin–alcohol solution concentration, and the rosin–alcohol solution dosage. The maximum elastic modulus was achieved when these values reached 4.0%, 25%, and 6.0%, respectively. The elastic modulus of the specimens decreased as the quartz sand content increased.
The rosin–alcohol solution primarily acted as a binder in the specimen. High concentrations of the rosin–alcohol solution contributed to the increasing the stiffness of the cementing structure. Furthermore, the relatively high elastic modulus of the rosin enhanced the overall elastic modulus of the specimen. According to the sensitivity analysis of the elastic modulus of the specimens (Table 7), the concentration of the rosin–alcohol solution had the greatest impact on the elastic modulus, with a range of 0.507. The dosage of the rosin–alcohol solution had the least impact, with a range of 0.122. The sensitivity ranking of the factors influencing the elastic modulus of the specimens is as follows: D > C > B > A > E.

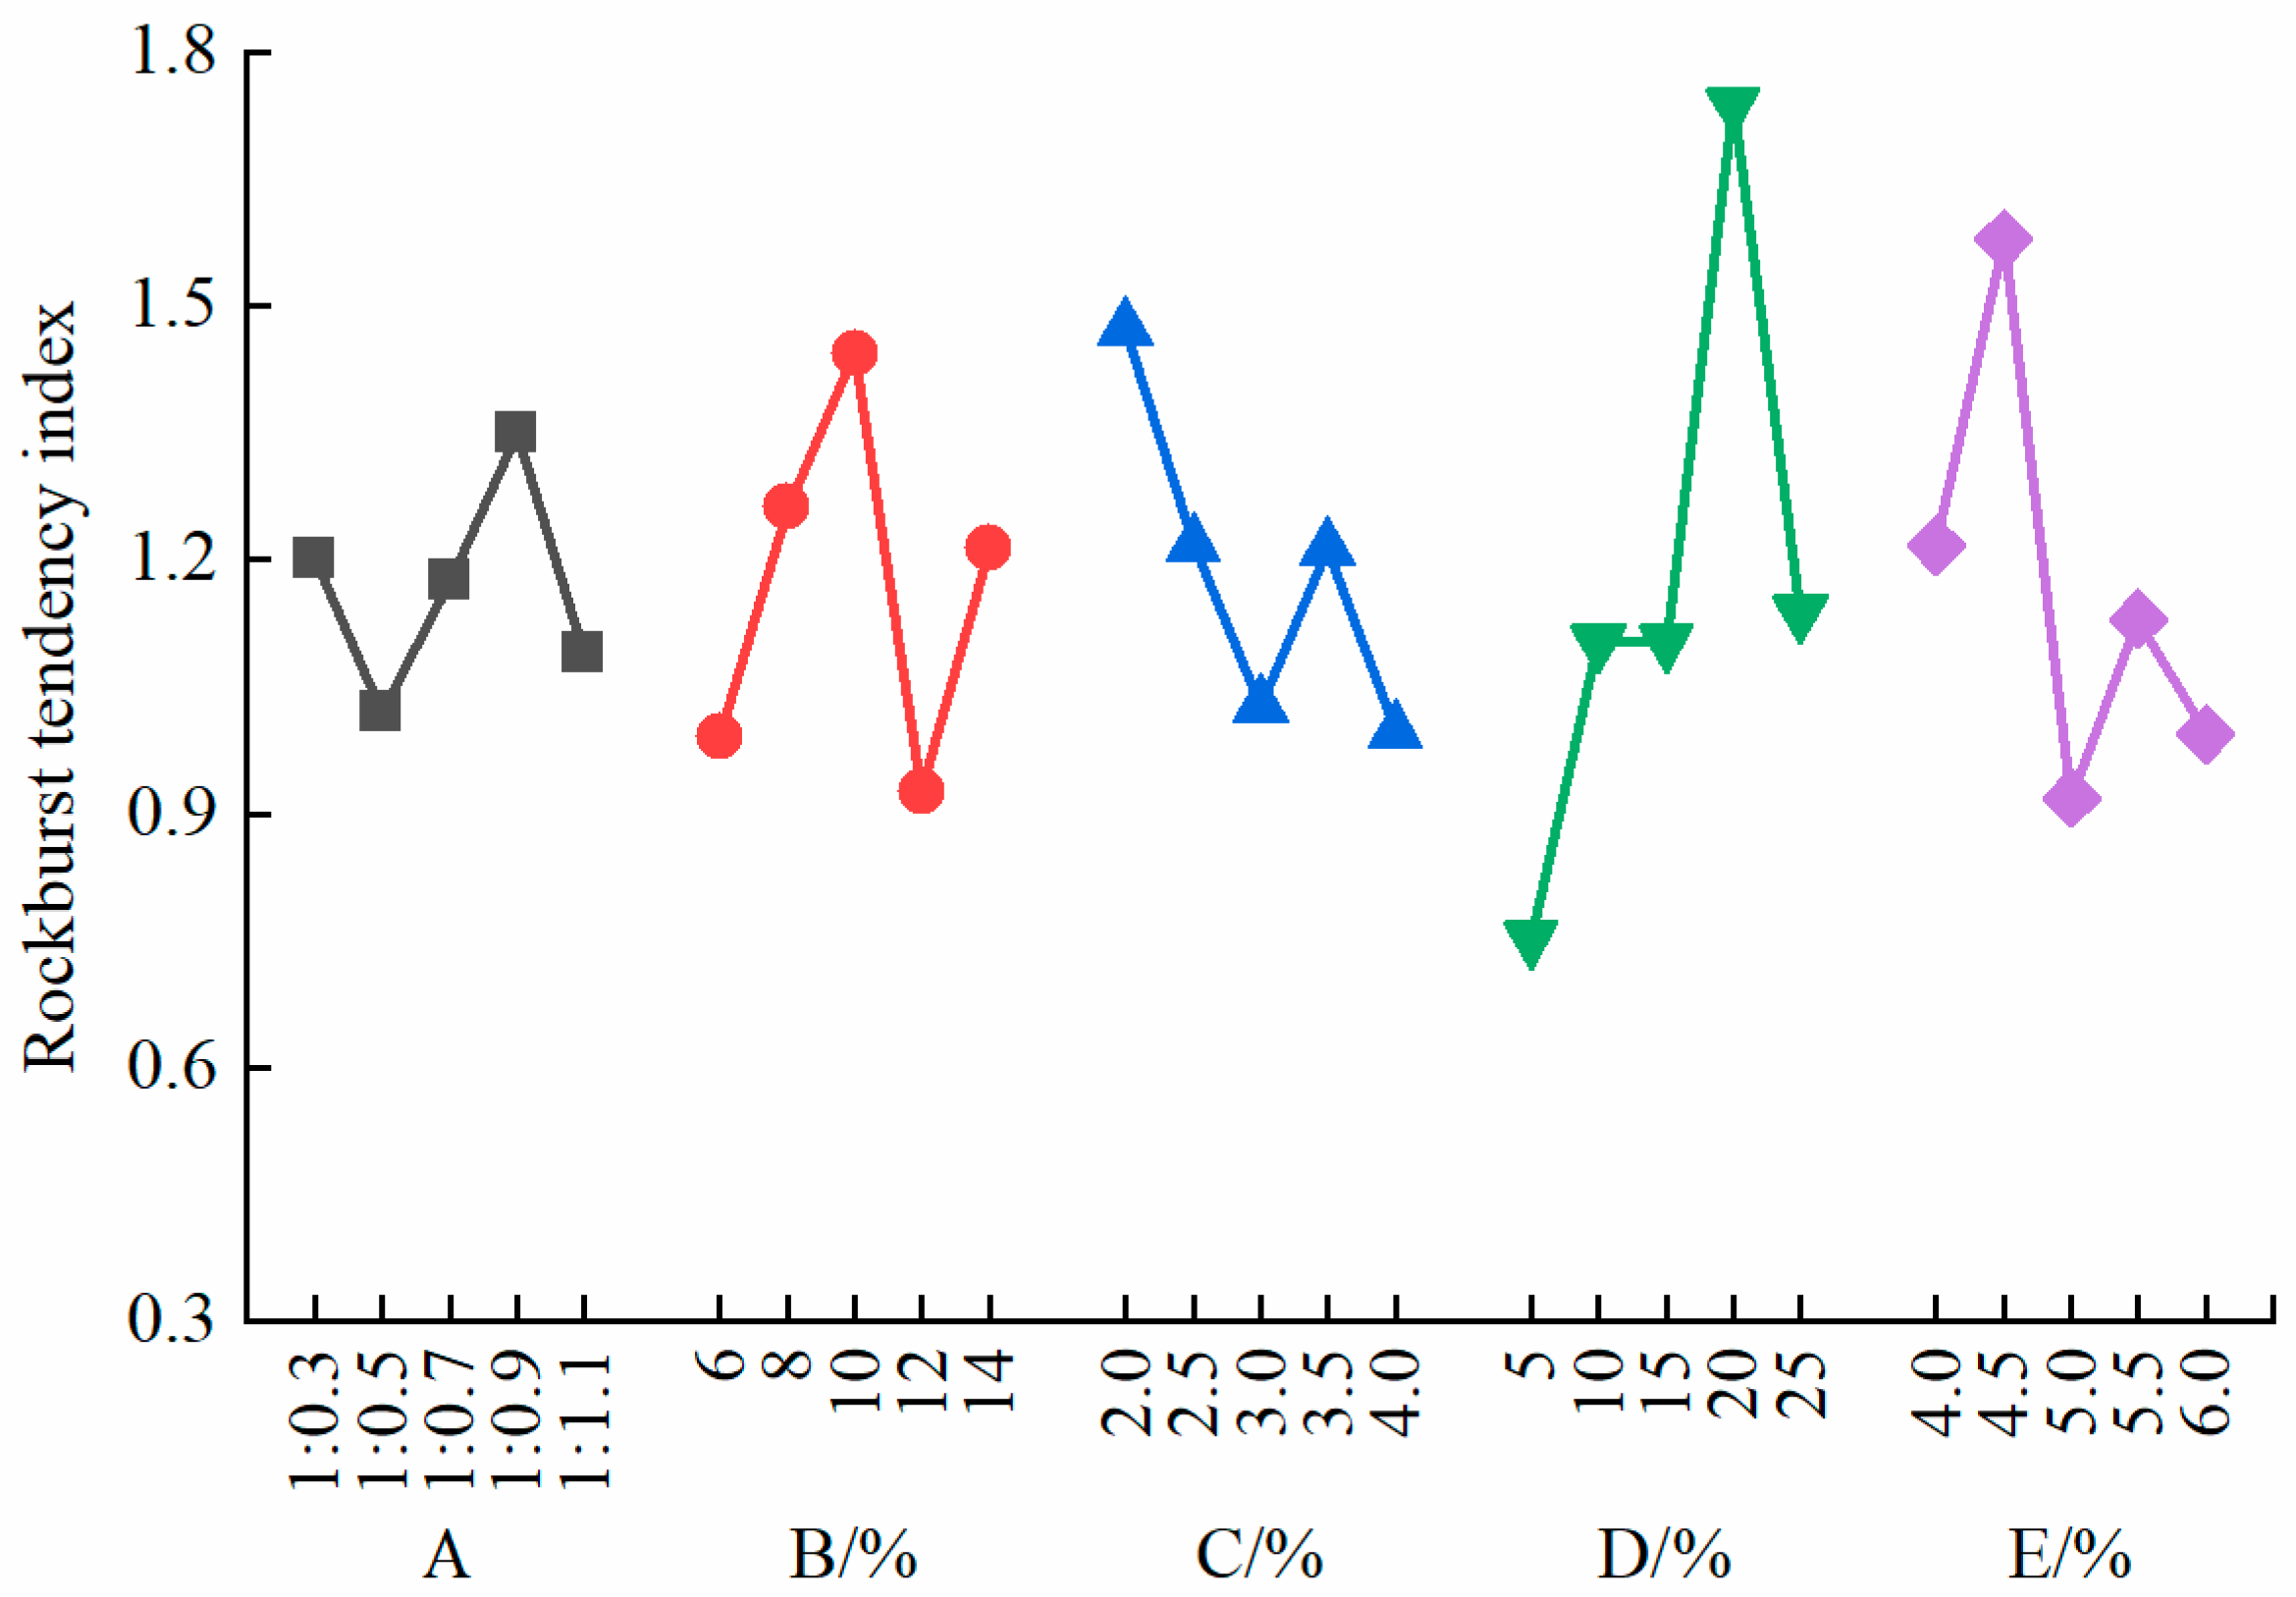
3.2.5. Sensitivity Analysis of the Rockburst Tendency Index

As shown in Figure 9, the rockburst tendency index of the specimens initially increased with an increase in the quartz sand content and the rosin–alcohol solution concentration and then gradually decreased. When the quartz sand content and the rosin–alcohol solution concentration reached 10% and 20%, respectively, the rockburst tendency index attained its maximum value. The overall trend indicated that the rockburst tendency index of the specimens decreased with increasing gypsum content and rosin–alcohol solution dosage, while the refined iron powder–barite powder ratio had no significant effect on the rockburst tendency index.
The rockburst tendency is closely related to the strength and deformation characteristics, microstructure, and energy storage and release capacity of the specimen, involving highly complex physical mechanisms. The cementing effect of the rosin–alcohol solution enhances the compressive strength, tensile strength, and elastic modulus of the specimen, facilitating elastic energy storage. As a result, increasing the solution concentration significantly raised the rockburst tendency of the specimen. However, the strong cementation effect also reduced the specimen’s brittleness, increasing energy dissipation through deformation. Consequently, a higher solution dosage reduced the likelihood of a sudden brittle failure, leading to an overall decline in the rockburst tendency. Gypsum increased the brittleness and elastic modulus of the specimen while exerting minimal influence on its strength. This resulted in a limited deformation of the specimen, restricting energy storage before reaching its peak strength.
Quartz sand, as a reinforcing material, enhances the overall stiffness of the specimen and improves its energy storage capacity. As the quartz sand content increases, an insufficient bonding strength or interface weakening between the particles may occur, leading to greater energy dissipation. When the quartz sand content reaches a higher threshold, the mutual support between particles is significantly enhanced, leading to an increase in the proportion of internal particle cracking and a higher porosity. This results in greater instability of the specimen’s skeletal structure and heightened destructiveness of the failure. These mechanisms collectively contribute to the nonlinear characteristics of rockburst tendency. Refined iron powder and barite powder, as fine aggregates, improve the strength and modulus of the specimen while also influencing its microstructure. However, their overall effect on rockburst tendency is not significant.
The range analysis of the rockburst tendency index (as shown in Table 8) indicated that the concentration of the rosin–alcohol solution had the most significant impact on the rockburst tendency index, with a range of 0.99. In contrast, the refined iron powder–barite powder ratio showed the least influence, with a range of 0.33. The sensitivity ranking of the factors affecting the rockburst tendency index is as follows: D > E > B > C > A.

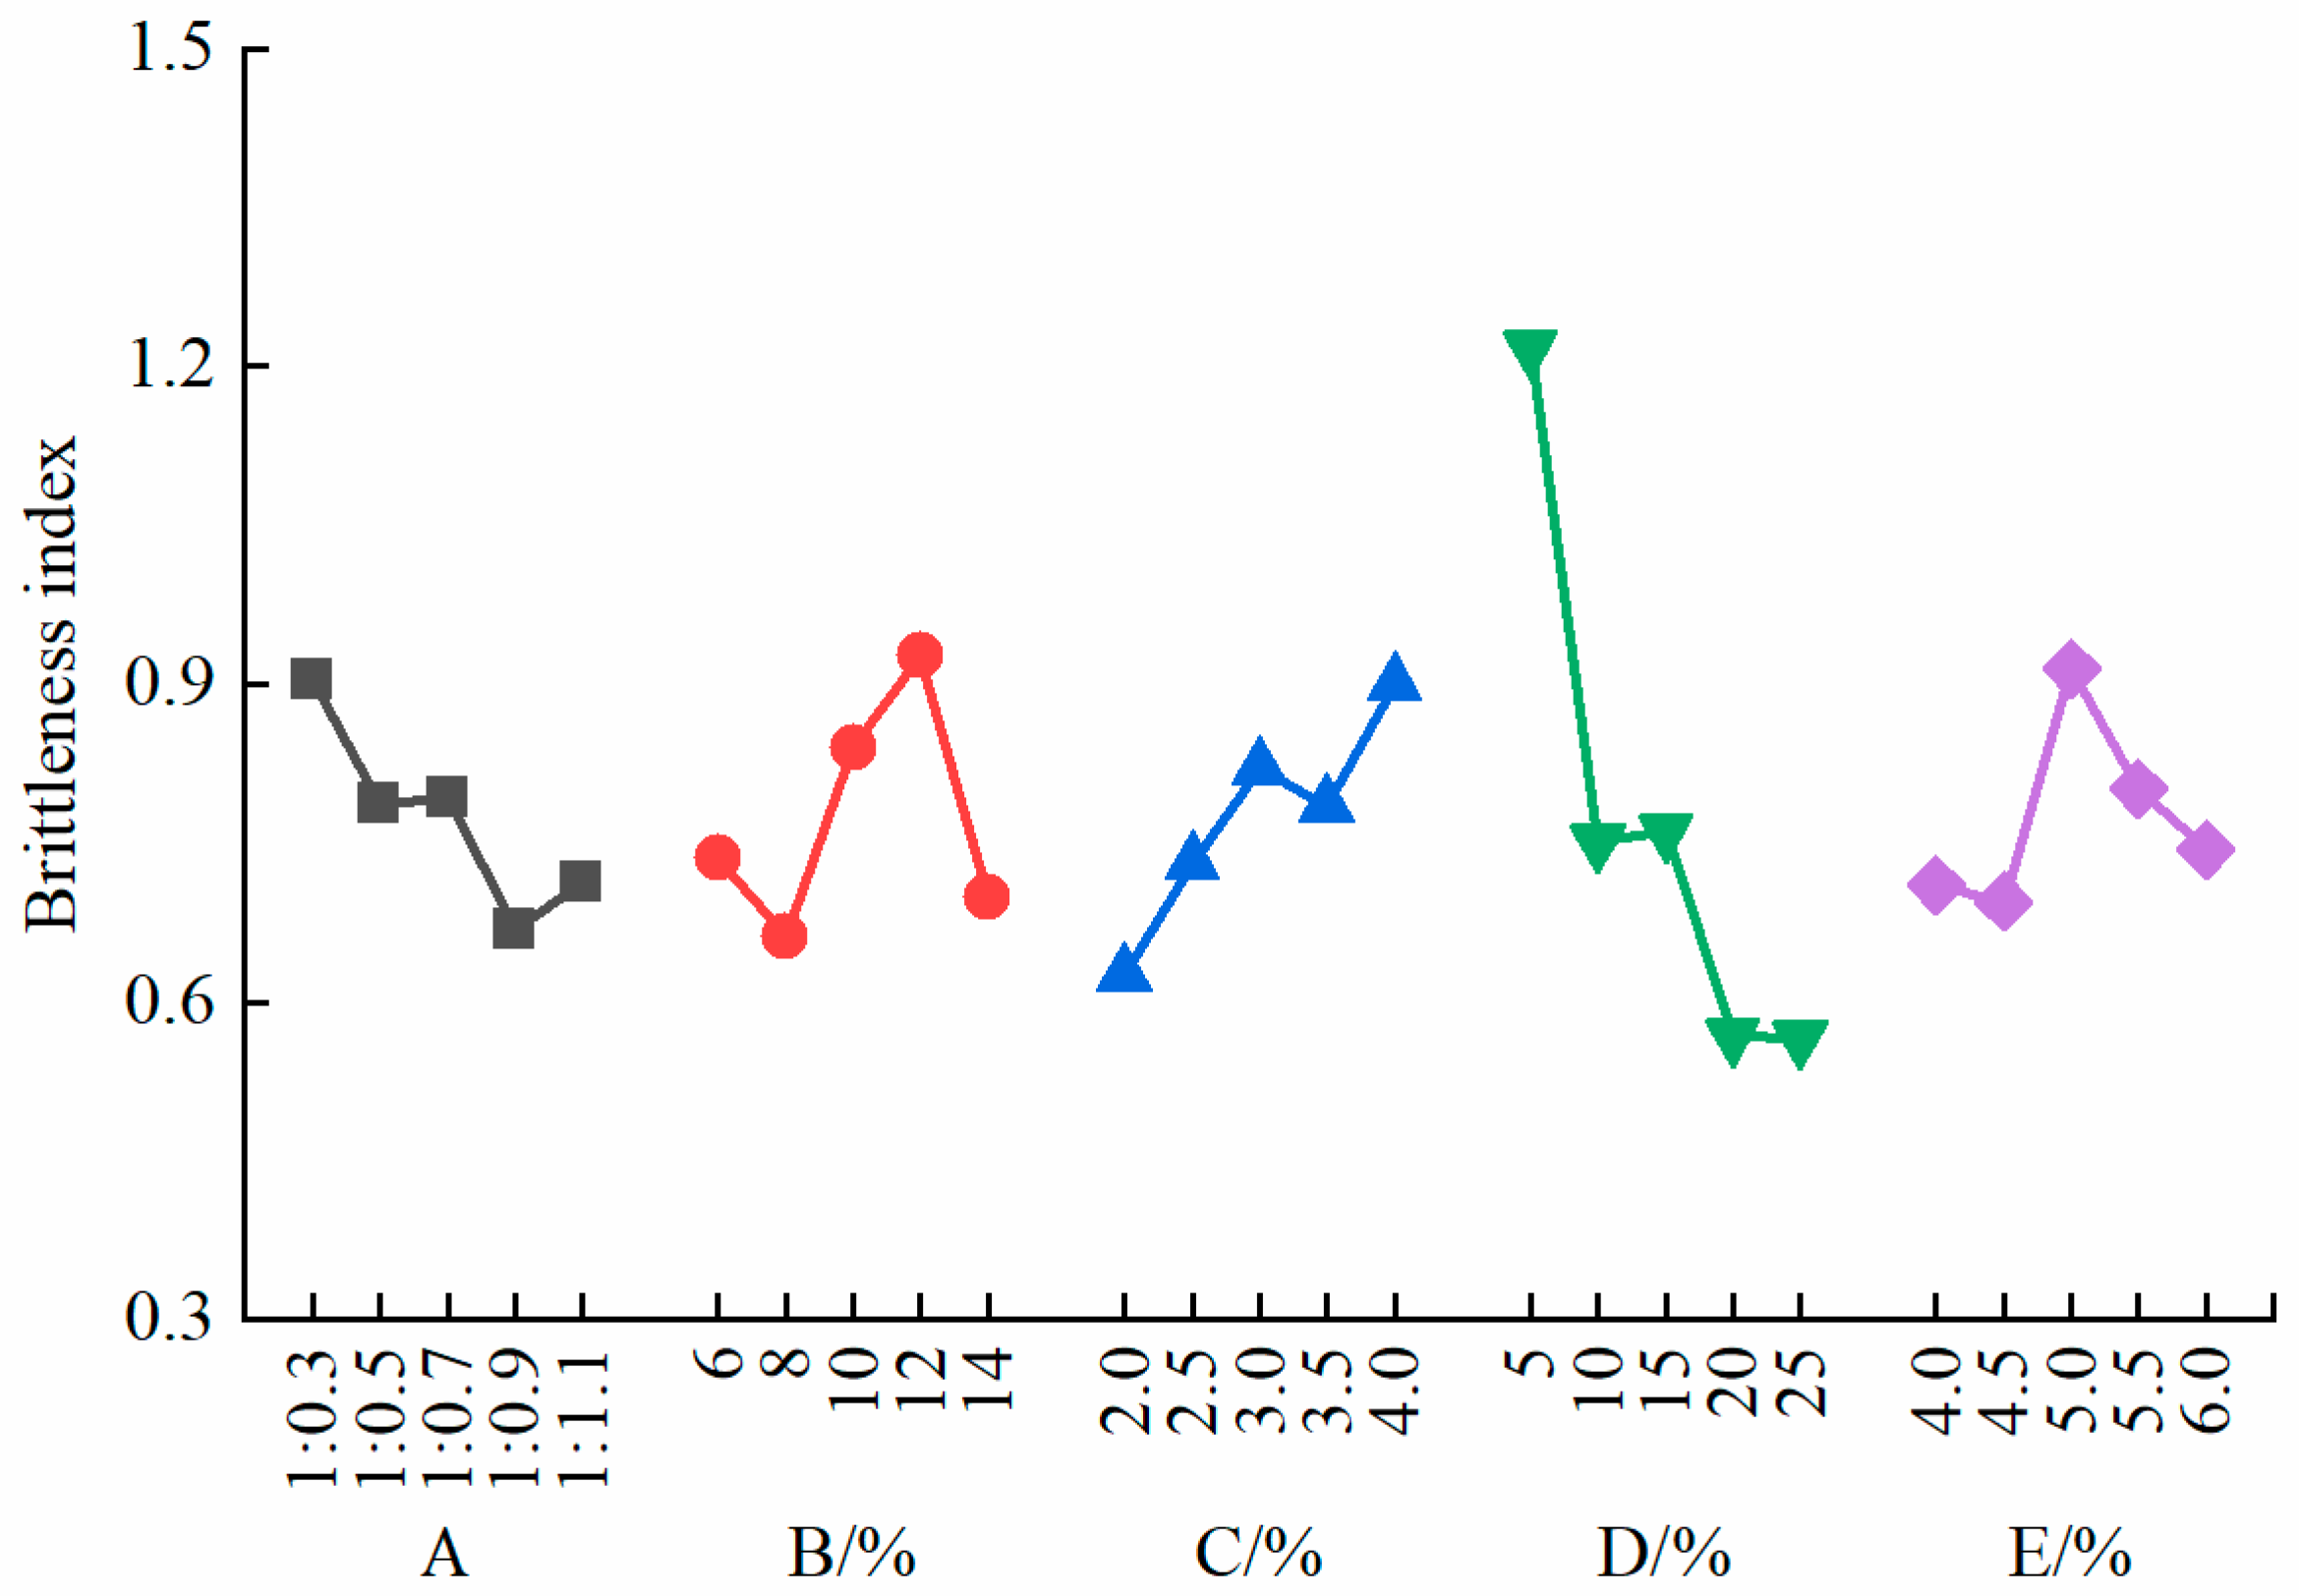
3.2.6. Sensitivity Analysis of the Brittleness Index

As shown in Figure 10, the brittleness index of the specimens decreased as the concentration of the rosin–alcohol solution increased and also decreased with a reduction in the refined iron powder–barite powder ratio. The brittleness index generally exhibited an initial increase followed by a decrease with an increase in both the quartz sand content and the rosin–alcohol solution dosage.
The brittleness index of the specimens increased with the increasing gypsum content, reaching its maximum value when the gypsum content was 4.0%, indicating the most pronounced brittle characteristics. Gypsum sets and hardens quickly, with a relatively low strength and slight volumetric expansion during hardening, which positively affects the adjustment of the specimen’s brittleness. In contrast, the rosin, as a binder, inhibits the formation of microcracks in the specimen. Therefore, the effects of the gypsum and the rosin–alcohol solution on the brittleness characteristics of the specimen show distinctly opposite trends.
According to the sensitivity analysis of the brittleness index of the specimens (see Table 9), the concentration of the rosin–alcohol solution had the greatest influence on the brittleness index, with a range of 0.651, while the dosage of the rosin–alcohol solution had the least effect, with a range of 0.220. The sensitivity ranking of the factors influencing the brittleness index of the specimens is as follows: D > C > B > A > E.

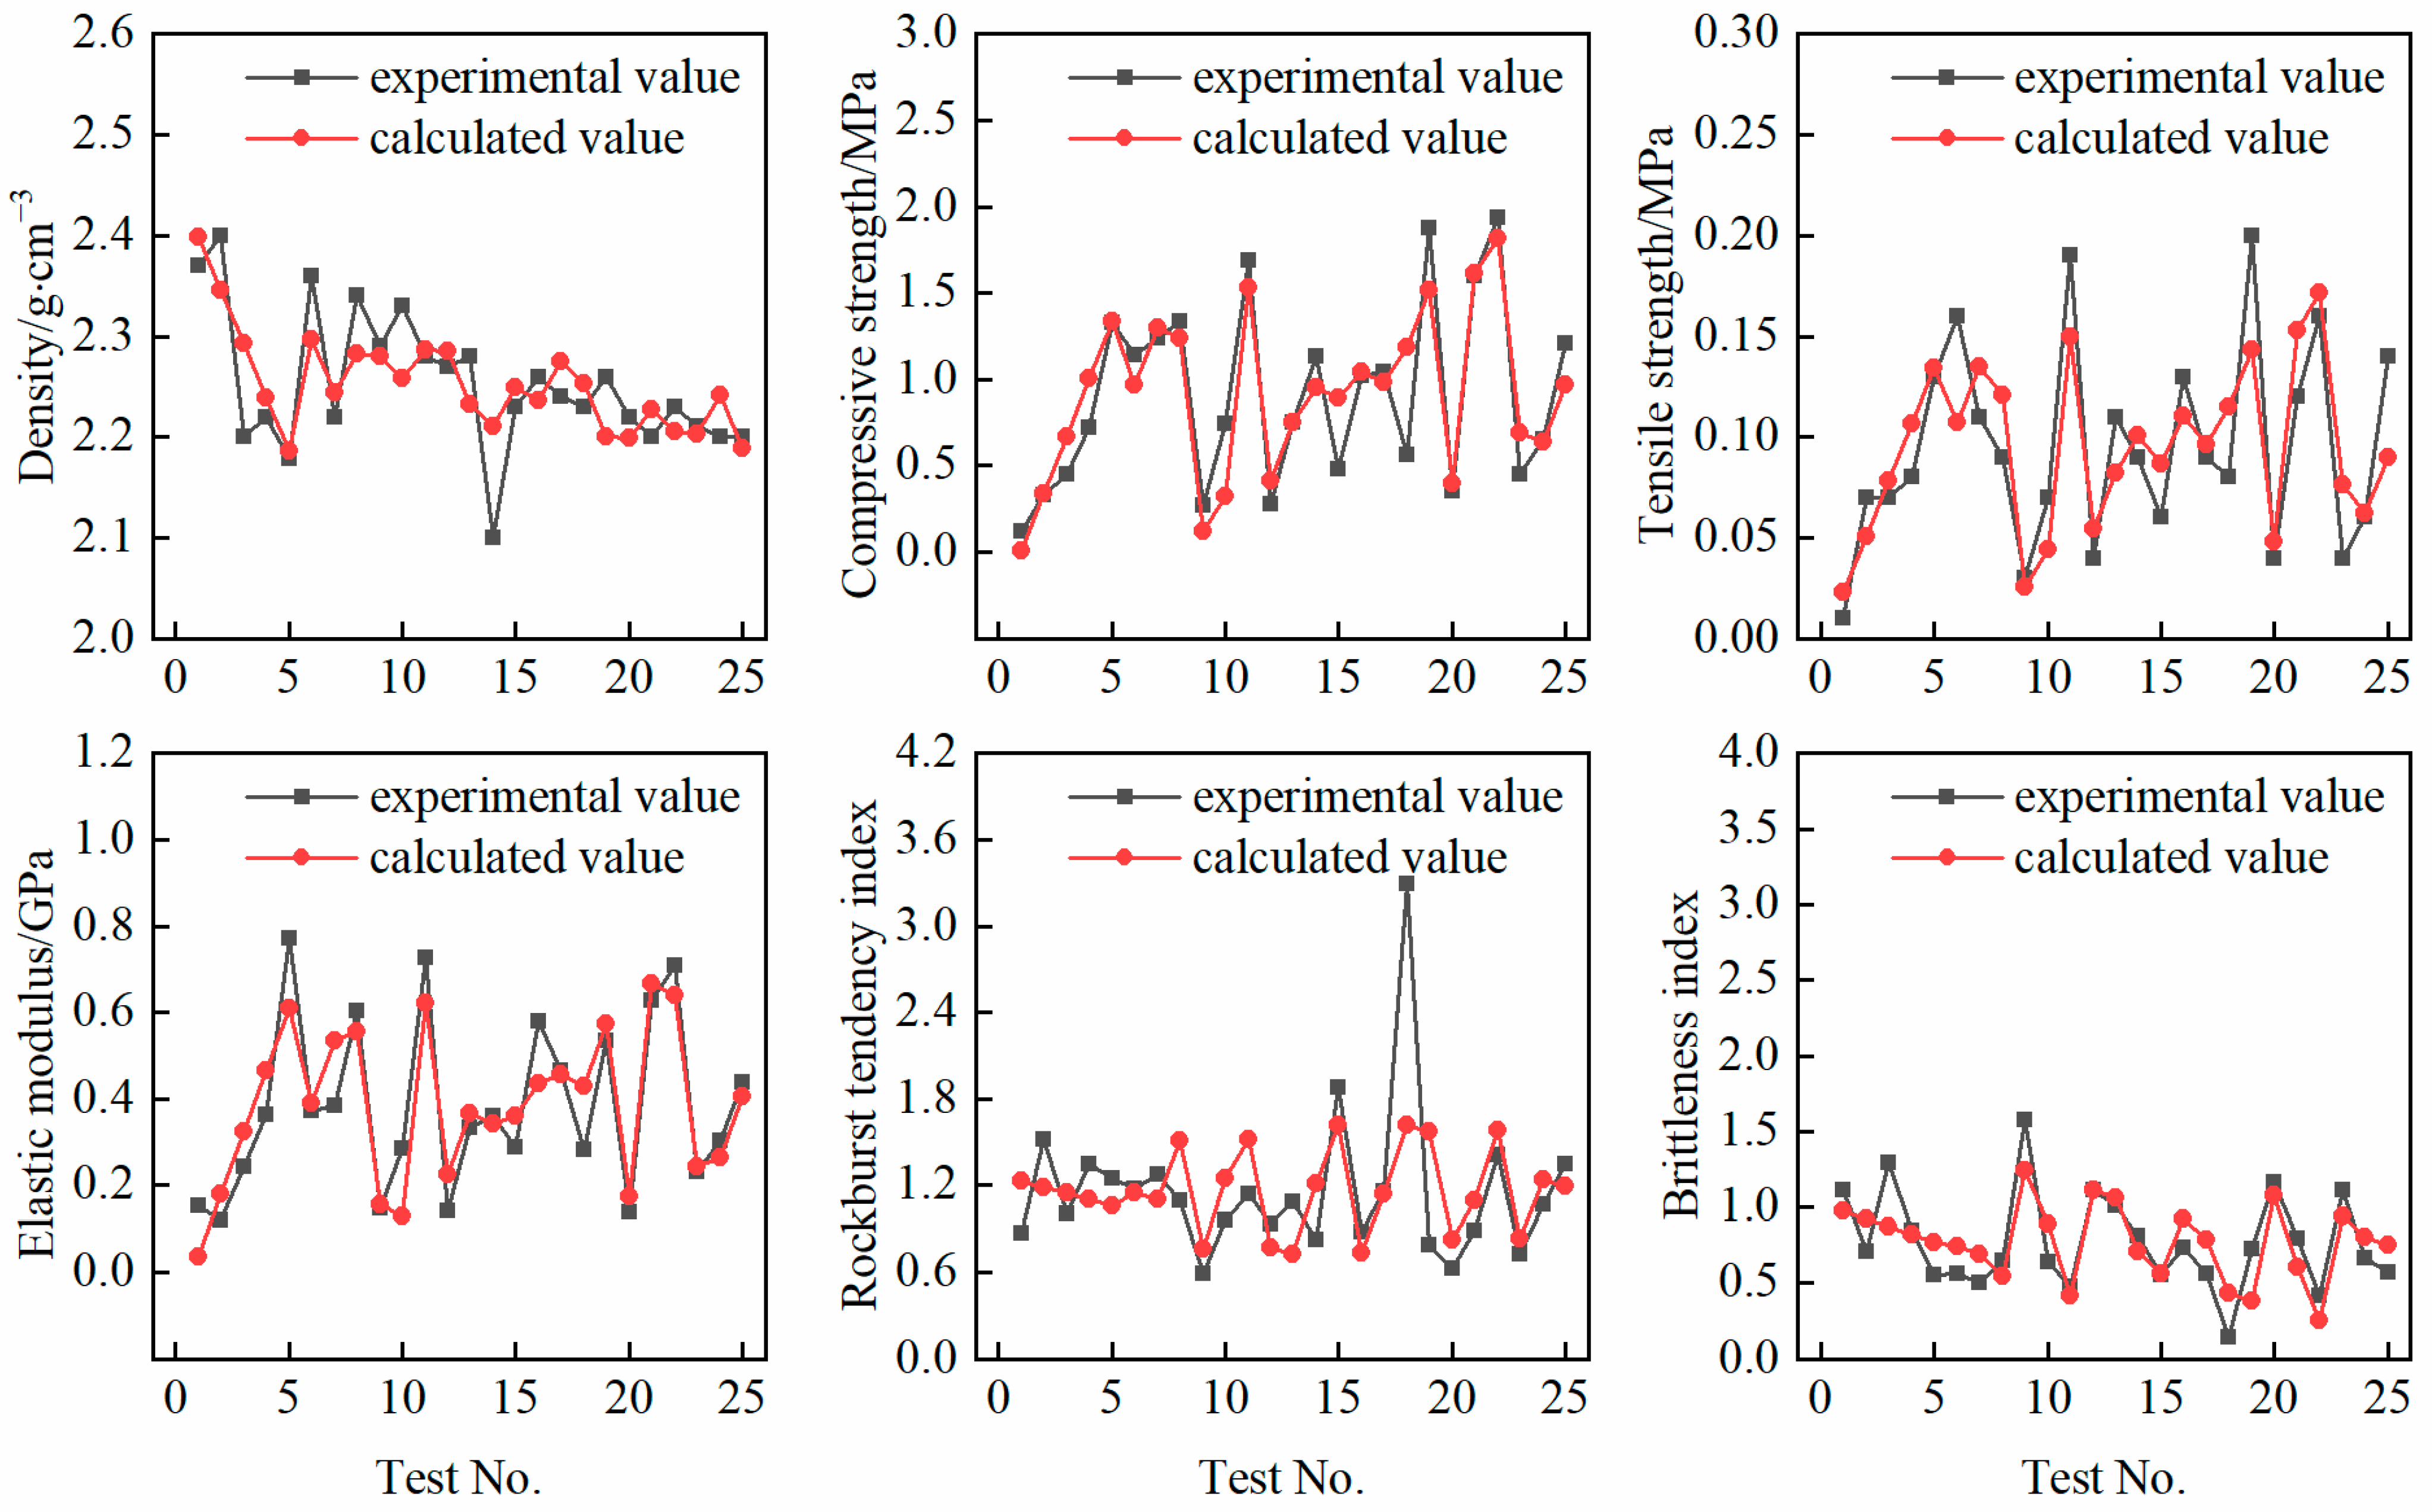
4. Multiple Linear Regression Analysis

Based on the experimental results, it is evident that each factor influences the physical and mechanical parameters of the analogous material specimens. The adjustments to the proportion of each material component consistently resulted in changes in these parameters. To enhance the efficiency of analogous material proportioning, this study applied a multiple linear regression analysis to the experimental data, aiming to establish correlations between various influencing factors and multiple physical and mechanical parameters.
A multiple linear regression analysis was performed on the experimental data, where x1 represents the barite powder–refined iron powder ratio, with 0.3 ≤ x1 ≤ 1.1; x2 is the quartz sand content (the percentage of the quartz sand mass in the total specimen mass), with 6% ≤ x2 ≤ 14%; x3 is the gypsum content (the percentage of the gypsum mass in the total specimen mass), with 2.0% ≤ x3 ≤ 4.0%; x4 is the concentration of the rosin–alcohol solution (the percentage of the rosin mass in the solution mass), with 5% ≤ x4 ≤ 25%; and x5 is the rosin–alcohol solution dosage (the percentage of the solution mass in the total specimen mass), with 4.0% ≤ x5 ≤ 6.0%. The resulting multiple linear regression equations for each physical and mechanical parameter are as follows:
ρ = 2.664 0.099 x 1 0.912 x 2 1.250 x 3 0.205 x 4 3.650 x 5 σ c = 1.007 + 0.592 x 1 3.100 x 2 + 5.160 x 3 + 5.812 x 4 + 15.680 x 5 σ t = 0.067 + 0.040 x 1 0.350 x 2 + 0.360 x 3 + 0.492 x 4 + 1.680 x 5 E = 0.377 + 0.151 x 1 1.181 x 2 + 6.780 x 3 + 2.160 x 4 + 4.908 x 5 W cf = 2.176 + 0.055 x 1 + 0.555 x 2 20.984 x 3 + 2.817 x 4 17.907 x 5 B i = 0.763 0.250 x 1 + 0.953 x 2 + 11.989 x 3 2.973 x 4 + 3.497 x 5
A statistical validation of the multiple linear regression analysis was conducted. As shown in Table 10, the regression equation fit the sample data well overall and explained most of the variation in the dependent variable. However, it also reflected the uncertainty and complexity of parameter selection in the proportioning of the geotechnical materials. The significance tests for the regression equation and its variables indicated that the model is statistically significant overall and that most independent variables have a significant impact. These findings are consistent with the results of the parameter sensitivity analysis conducted in Section 3.2.
A comparison between the experimental values of each physical and mechanical parameter of the specimens and the calculated values from the multiple linear regression equations is shown in Figure 11. The multiple linear regression equations provided a good approximation of the actual physical and mechanical parameters of the specimens, demonstrating strong predictive capability for these parameters.

5. Proportioning and Validation of Brittle Rock Analogs

5.1. Jinping Marble Analogous Material

The Jinping II Hydropower Station’s headrace tunnel crosses a typical stratigraphy of marble along its route, with the Baishan Formation (T2b) marble exhibiting better integrity and brittleness characteristics. The physical and mechanical parameters of T2b marble, obtained from these experiments, are shown in Table 11.
The material to simulate brittle rock prepared in this study is intended for large-scale true three-dimensional physical model testing. To ensure similarity between the physical model and the test prototype, similarity principles were followed, with a geometric scale ratio of 1:60 and a unit weight ratio of 1:1.1. Based on these similarity scales, the necessary parameters for the analogous material could be determined.
Based on the multiple linear regression equations obtained in Section 4 and the physical and mechanical parameters required by the similarity laws, extensive proportioning experiments were conducted. Through continuous optimization and adjustments, the optimal proportion for the T2b marble analogous material was determined, as shown in Table 12.
The standard specimens were prepared according to the material proportion determined, followed by mechanical testing. Table 13 compares the physical and mechanical parameters of the analogous material obtained through similarity theory calculations and the experiment, showing good agreement between the two.

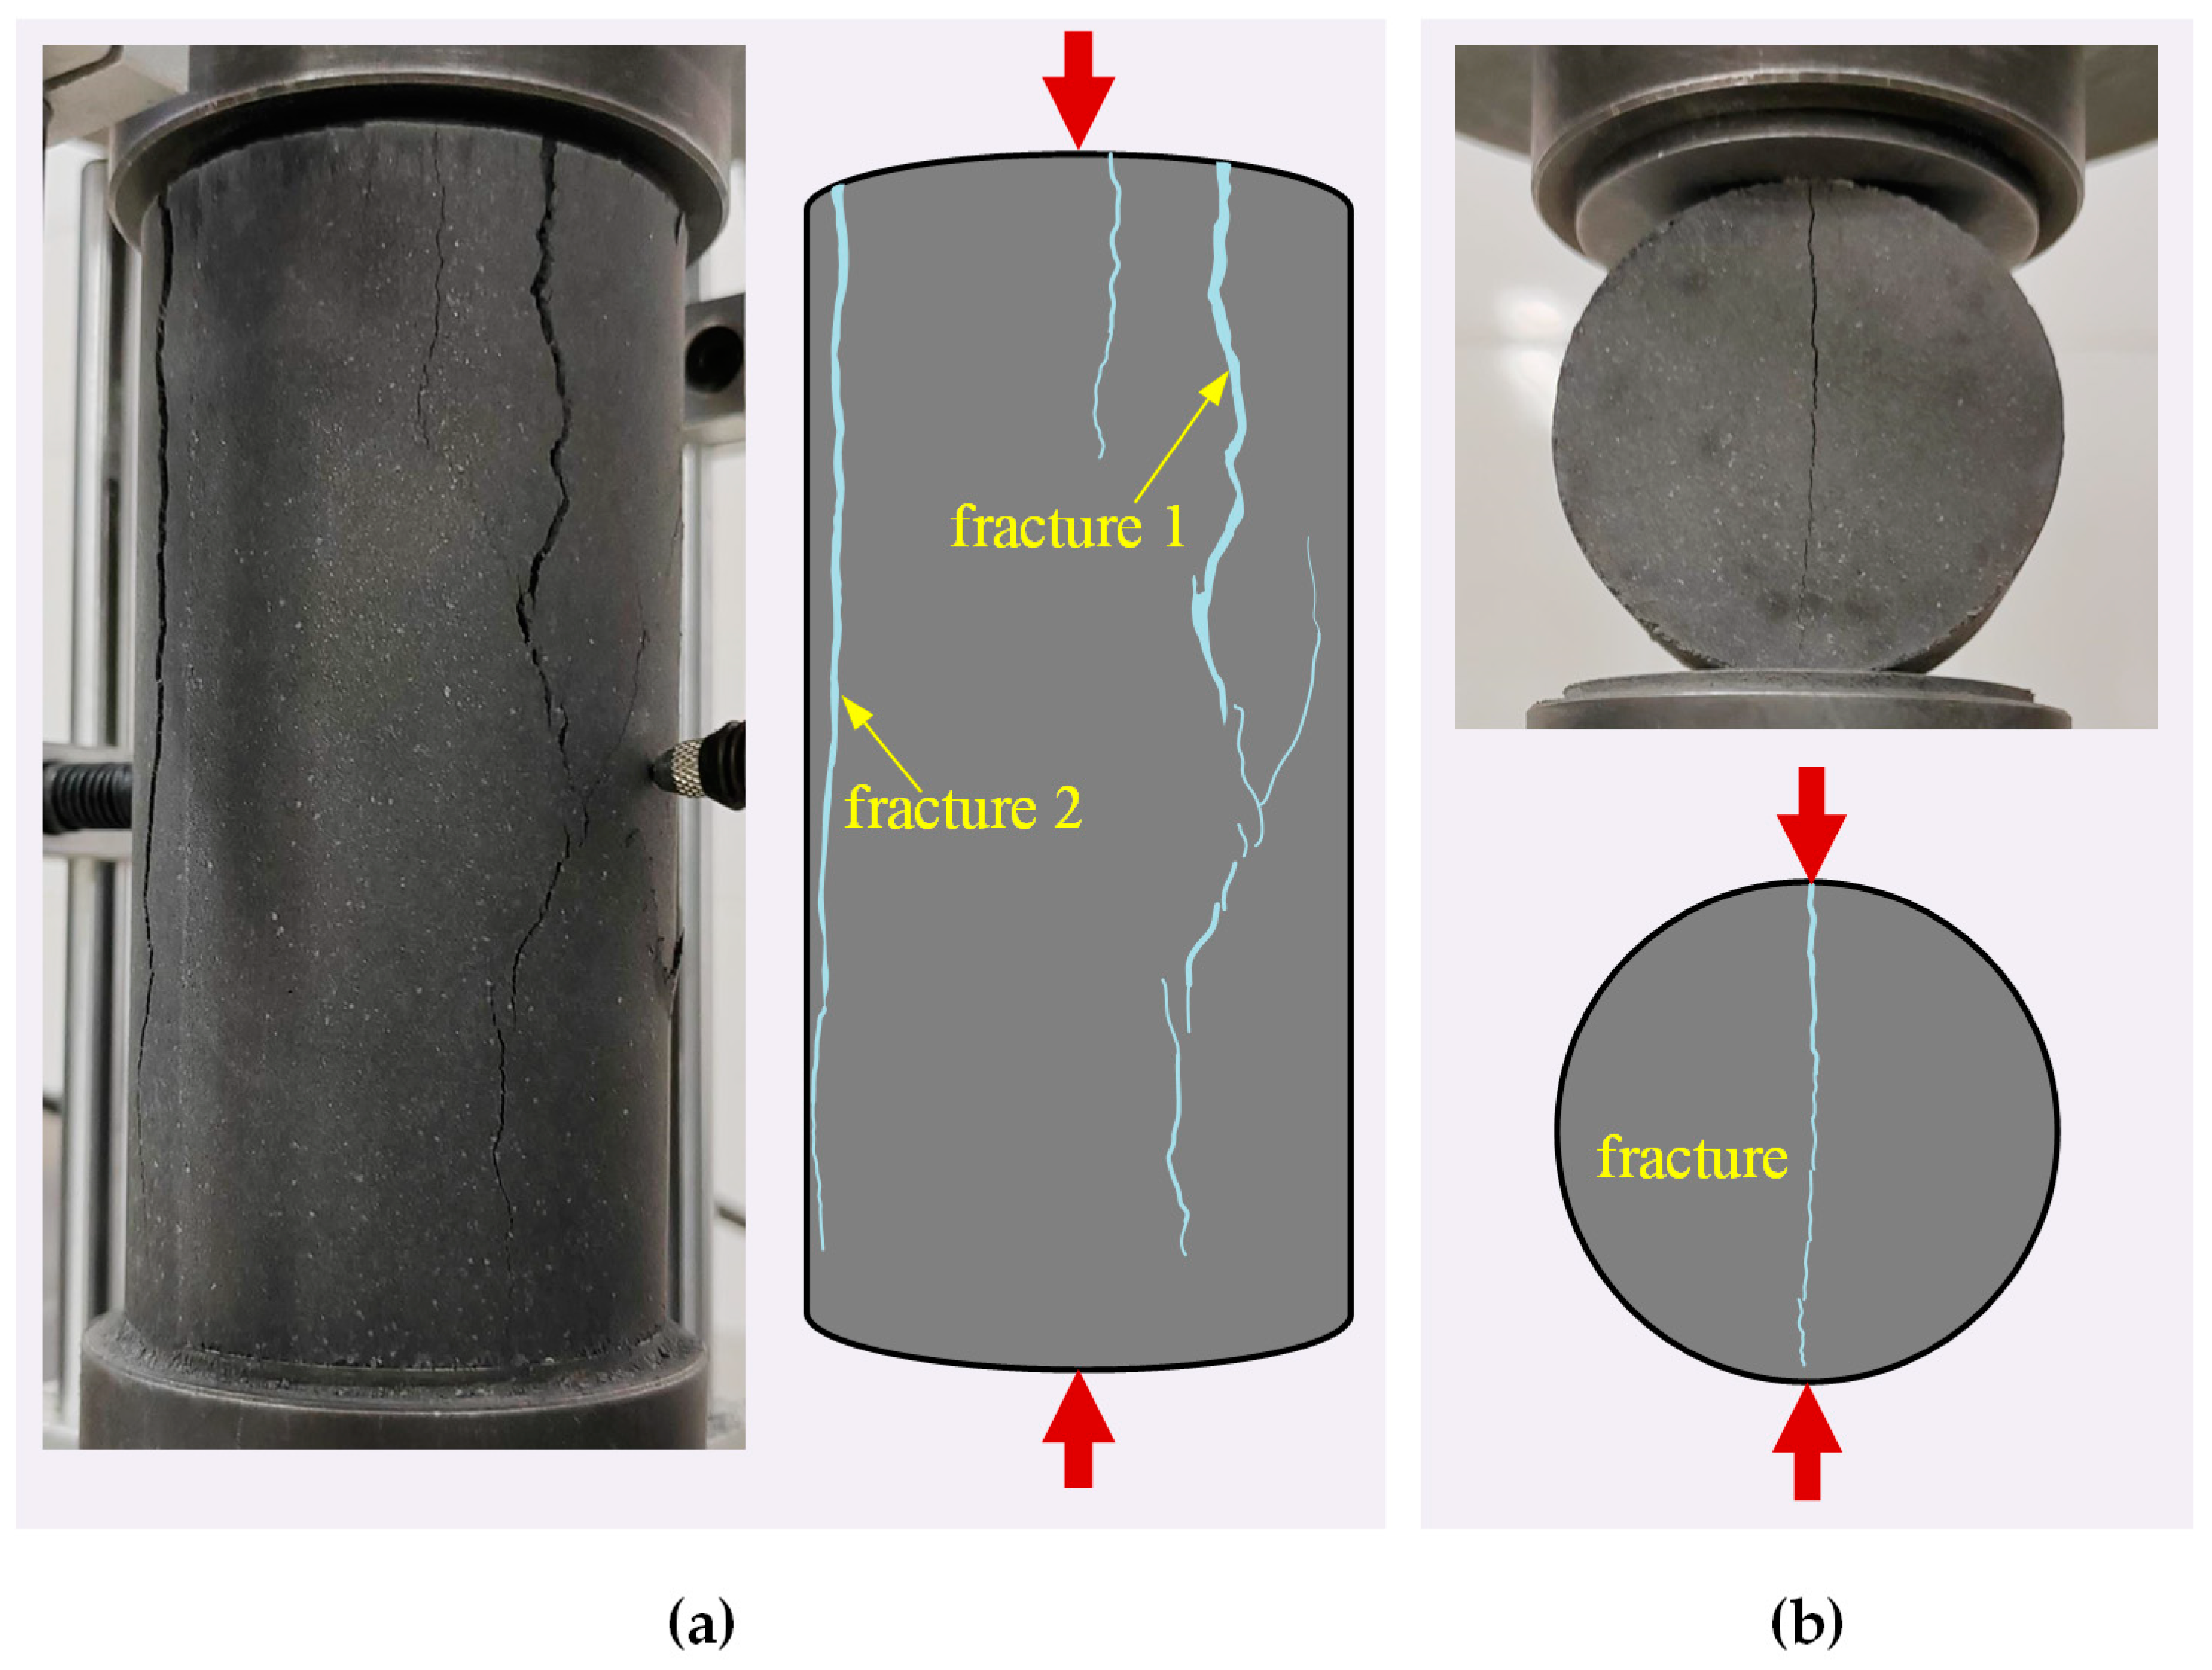
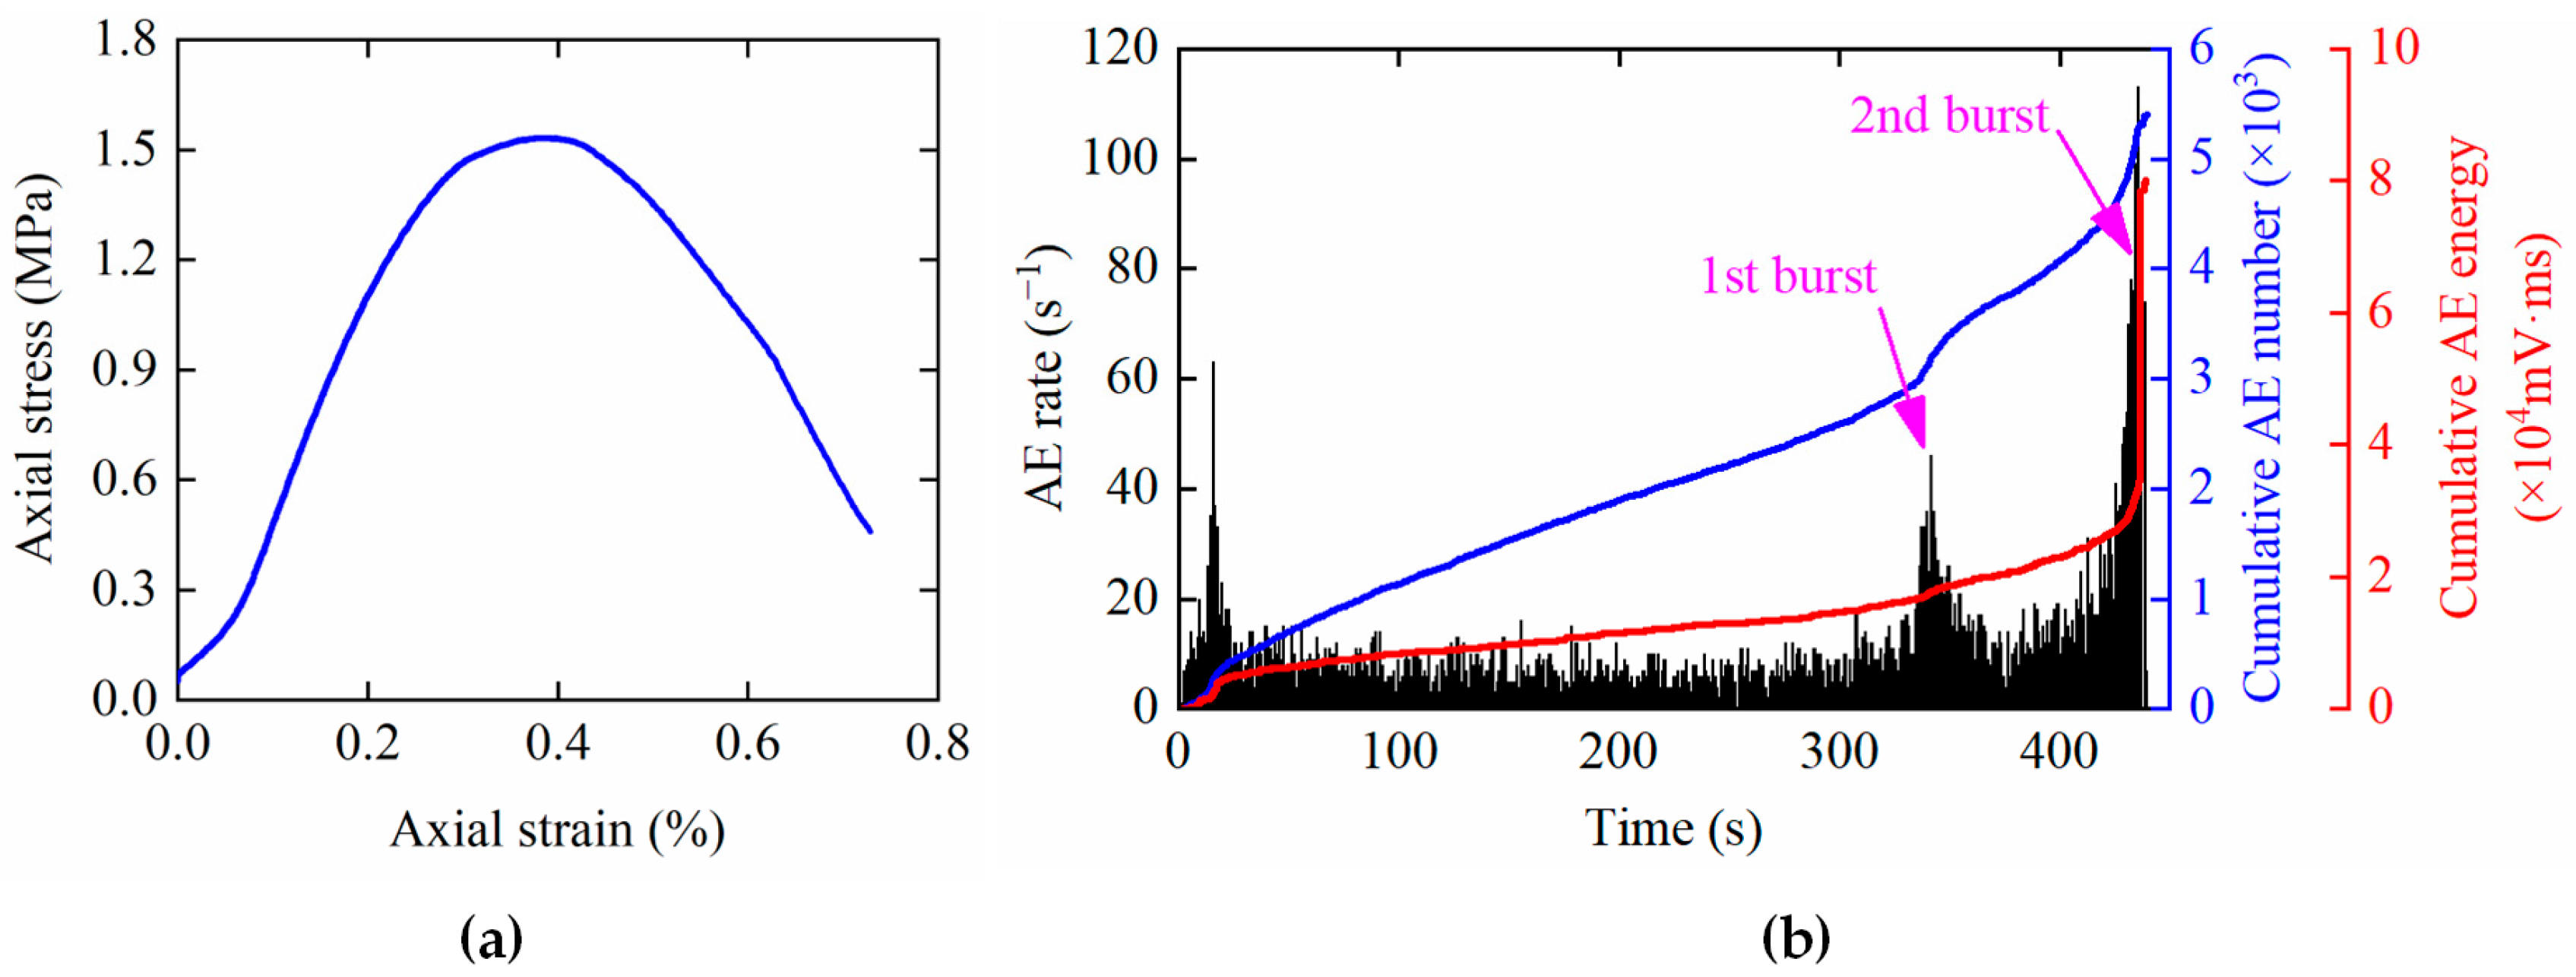
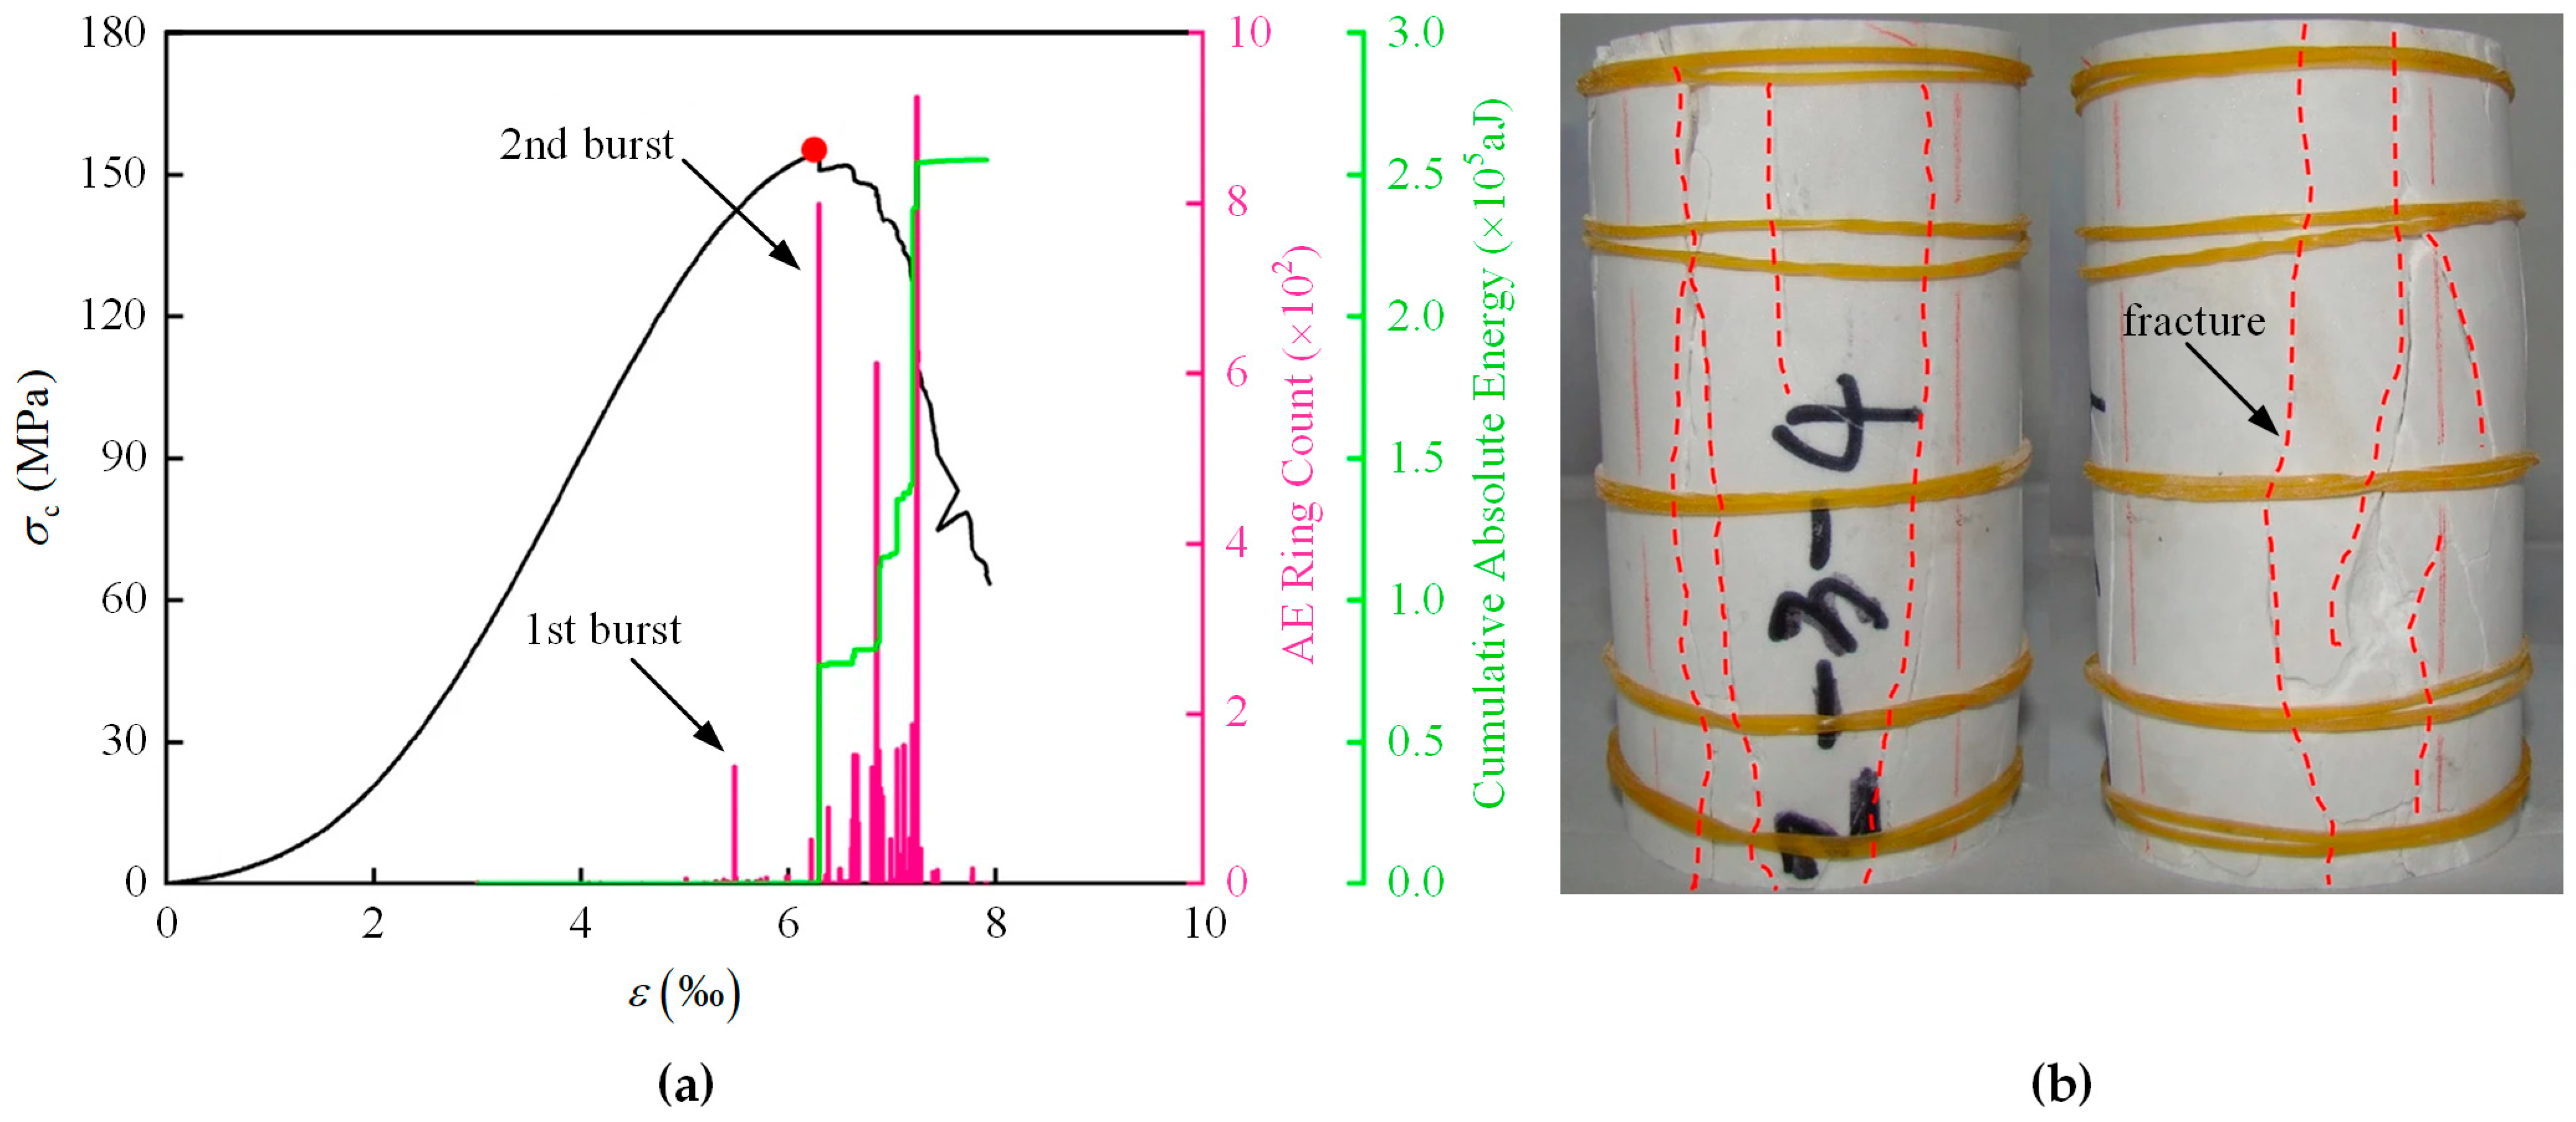
5.2. Failure Modes and Acoustic Emission Characteristics

In the proportioning tests for analogous materials for brittle rock, it was essential not only to consider the material’s physical and mechanical parameters but also to ensure that the specimen’s failure mode and acoustic emission characteristics reflected the typical deformation behavior of brittle rock.
The mechanical tests were conducted on the analogous material specimens prepared, and the final failure modes of the specimens under different loading conditions are shown in Figure 12. Under uniaxial compression, two prominent macrocracks formed along the loading direction in the specimen. In the initial loading phase, no microcracks appeared on the specimen’s surface. As loading approached the specimen’s peak strength, microcracks began to nucleate and cluster in the upper-mid portion of the specimen, rapidly propagating to trigger a sudden failure. The specimen primarily exhibited tensile fracturing, with pronounced brittle characteristics. Axial splitting failure is a typical fracture mode of brittle rocks under uniaxial compression, indicating that the prepared specimen exhibited fracture behavior consistent with that of brittle rock.
In the Brazilian splitting test, a macroscopic crack formed along the specimen’s diameter in the loading direction, initiating at the specimen center and rapidly extending toward the loading points at each end. This behavior aligns with the fundamental assumptions of the Brazilian splitting test. The fracture surface displayed a rough texture without any frictional scoring, indicating that tensile failure occurred in the specimen.
The stress–strain curve and acoustic emission characteristics of the analogous material specimens under uniaxial compression conditions are shown in Figure 13. In the initial loading stage, a small number of acoustic emission (AE) events occurred due to the compaction effect. As the axial load increased, at around 342 s, a cluster of AE events appeared, indicating the initiation and coalescence of internal microcracks. At this point, both the number of AE events and the AE energy showed a significant increase. As the stress approached the peak load, the number of AE events increased exponentially, indicating the rapid propagation and nucleation of internal cracks. Eventually, the specimen underwent instability failure.
For comparison, the typical stress–strain curve, acoustic emission characteristics, and failure mode of Jinping marble under uniaxial compression [34] are shown in Figure 14. During the pre-peak stage, the Jinping marble exhibited two concentrated bursts of acoustic emission (AE) events. The first AE burst corresponded to the initiation and nucleation of microcracks within the rock, while the second AE burst corresponded to macroscopic failure, displaying a distinct exponential growth trend.
Acoustic emission monitoring is an effective method for analyzing the evolution of microfractures within specimens. Before reaching the peak load, both types of specimens exhibited similar concentrated bursts of AE events, indicating that the analogous material specimens and the natural Jinping marble underwent comparable processes of microcrack initiation, propagation, and nucleation during loading. Ultimately, both types of specimens experienced axial splitting failure, demonstrating that the analogous material specimens effectively replicate the fracture behavior of the natural Jinping marble. This suggests that the two materials share a similar brittle fracture mode.
The macroscopic failure characteristics of the specimen and the acoustic emission (AE) monitoring results indicate that under uniaxial compression conditions, the analogous material specimen exhibited distinct brittle fracture characteristics, which are closely aligned with the AE features observed in brittle rocks. Furthermore, the feasibility of embedding AE sensors within the model to monitor internal fracture signals has been validated.

6. Conclusions

In this study, a brittle rock analogue was prepared using refined iron powder, barite powder, quartz sand, gypsum powder, and a rosin–alcohol solution. The rockburst tendency and brittleness indices were introduced to evaluate the material’s brittleness and rockburst potential. An orthogonal experimental design and a sensitivity analysis were used to evaluate the effects of the different components on the physical and mechanical properties of the analogous materials. Based on a multiple linear regression analysis, the material-proportioning scheme was optimized. Additionally, mechanical tests were conducted to examine the failure behavior and acoustic emission characteristics of the specimens, validating the effectiveness of the proportioning scheme. The main conclusions are as follows:
(1)
In the analogous material, the refined iron powder, barite powder, and quartz sand serve as aggregates; the rosin–alcohol solution acts as a binder; and the gypsum functions as a brittleness modifier. The orthogonal test results showed that the density of the specimen ranges from 2.10 to 2.40 g/cm3; the compressive strength ranges from 0.12 to 1.94 MPa; the tensile strength ranges from 0.01 to 0.20 MPa; the elastic modulus ranges from 0.120 to 0.772 GPa; the rockburst tendency index ranges from 0.59 to 3.29; and the brittleness index ranges from 0.141 to 1.578. The prepared material offers a wide range of parameter variability, rapid drying, stable performance, and a straightforward manufacturing process.
(2)
The sensitivity analysis indicated that the refined iron powder–barite powder ratio significantly impacts the density of the analogous material, while the concentration of the rosin–alcohol solution primarily controls the material’s compressive strength, tensile strength, elastic modulus, rockburst tendency index, and brittleness index. Therefore, when preparing the brittle rock analog, it is more effective to appropriately adjust the iron powder–barite powder ratio and the concentration of the rosin–alcohol solution.
(3)
The multiple linear regression equation effectively simulates and accurately predicts the physical and mechanical parameters of the specimen, improving the efficiency of material proportion and preparation. The equation provides a scientific basis and theoretical support for the rapid formulation of rock analogs.
(4)
An analogous material was prepared for T2b marble, and mechanical tests and acoustic emission monitoring were conducted on the specimens. Under uniaxial compression and Brazilian splitting conditions, the fracture mode and acoustic emission characteristics of the specimens were found to closely resemble those of brittle rock. This also validated the feasibility of the preparation method for rock analogs.

Author Contributions

Conceptualization, C.Z. and S.W.; methodology, C.Z.; software, R.P.; validation, C.Z., C.C. and S.W.; formal analysis, C.Z.; data curation, C.Z. and R.P.; writing—original draft preparation, C.Z.; writing—review and editing, S.W., C.Z., C.C., Z.X. and R.P.; visualization, C.Z. and R.P.; supervision, S.W. and C.C.; project administration, S.W.; funding acquisition, S.W. All authors have read and agreed to the published version of the manuscript.

Funding

This research was funded by the National Natural Science Foundation of China (51934003, 52334004, 42307233) and the Yunnan Major Scientific and Technological Projects (202202AG050014).

Institutional Review Board Statement

Not applicable.

Informed Consent Statement

Not applicable.

Data Availability Statement

The original contributions presented in this study are included in the article. Further inquiries can be directed to the corresponding authors.

Acknowledgments

We are grateful to Haiyong Cheng for his assistance during the experimental process.

Conflicts of Interest

The authors declare no conflicts of interest.

References

  1. Zhang, C.; Feng, X.; Zhou, H.; Qiu, S.; Wu, W. Case histories of four extremely intense rockbursts in deep tunnels. Rock Mech. Rock Eng. 2012, 45, 275–288. [Google Scholar] [CrossRef]
  2. Keneti, A.; Sainsbury, B. Review of published rockburst events and their contributing factors. Eng. Geol. 2018, 246, 361–373. [Google Scholar] [CrossRef]
  3. Gong, F.; Dai, J.; Xu, L. A strength-stress coupling criterion for rockburst: Inspirations from 1114 rockburst cases in 197 underground rock projects. Tunn. Undergr. Space Technol. 2023, 142, 105396. [Google Scholar] [CrossRef]
  4. Ortlepp, W.D.; Stacey, T.R. Rockburst mechanisms in tunnels and shafts. Tunn. Undergr. Space Technol. 1994, 9, 59–65. [Google Scholar] [CrossRef]
  5. Qian, Q.H. Definition, mechanism, classification and quantitative forecast model for rockburst and pressure bump. Rock Soil Mech. 2014, 35, 1–6. [Google Scholar]
  6. Li, C.C.; Zhao, T.; Zhang, Y.; Wan, W. A study on the energy sources and the role of the surrounding rock mass in strain burst. Int. J. Rock Mech. Min. Sci. 2022, 154, 105114. [Google Scholar] [CrossRef]
  7. Cook, N.G.W. The basic mechanics of rockbursts. J. S. Afr. Inst. Min. Metall. 1963, 64, 71–81. [Google Scholar]
  8. Askaripour, M.; Saeidi, A.; Rouleau, A.; Mercier-Langevin, P. Rockburst in underground excavations: A review of mechanism, classification, and prediction methods. Undergr. Space 2022, 7, 577–607. [Google Scholar] [CrossRef]
  9. Li, T.; Ma, C.; Zhu, M.; Meng, L.; Chen, G. Geomechanical types and mechanical analyses of rockbursts. Eng. Geol. 2017, 222, 72–83. [Google Scholar] [CrossRef]
  10. Xiao, P.; Li, D.; Zhao, G.; Zhu, Q. Characteristics and mechanism of rockburst at five deep gold mines in Jiaodong Peninsula of China. Int. J. Rock Mech. Min. Sci. 2023, 171, 105574. [Google Scholar] [CrossRef]
  11. Ortlepp, W.D. Observation of mining-induced faults in an intact rock mass at depth. Int. J. Rock Mech. Min. Sci. 2000, 37, 423–436. [Google Scholar] [CrossRef]
  12. Stacey, T.R. Addressing the consequences of dynamic rock failure in underground excavations. Rock Mech. Rock Eng. 2016, 49, 4091–4101. [Google Scholar] [CrossRef]
  13. Mazaira, A.; Konicek, P. Intense rockburst impacts in deep underground construction and their prevention. Can. Geotech. J. 2015, 52, 1426–1439. [Google Scholar] [CrossRef]
  14. Chen, L.; Bai, S.; Yin, X.; Zhao, Y. Plane-strain model tests on rock-burst of horseshoe section caverns in hard and brittle rockmass. Chin. J. Geotech. Eng. 2008, 30, 1520–1526. [Google Scholar]
  15. Kusui, A.; Villaescusa, E.; Funatsu, T. Mechanical behaviour of scaled-down unsupported tunnel walls in hard rock under high stress. Tunn. Undergr. Space Technol. 2016, 60, 30–40. [Google Scholar] [CrossRef]
  16. Feng, X.; Li, Z.; Mei, S.; Tian, J.; Yang, C.; Yao, Z.; Gao, J. A novel large-scale three-dimensional physical model experimental system for deep underground engineering. Rock Mech. Rock Eng. 2023, 56, 8395–8413. [Google Scholar] [CrossRef]
  17. Burgert, W.; Lippmann, H. Models of translatory rock bursting in coal. Int. J. Rock Mech. Min. Sci. Geomech. Abstr. 1981, 18, 285–294. [Google Scholar] [CrossRef]
  18. Pan, Y.; Zhang, M.; Wang, L.; Li, G. Study on rockburst by equivalent material simulation tests. Chin. J. Geotech. Eng. 1997, 19, 49–56. [Google Scholar]
  19. Li, T.; Wang, X.; Meng, L. Physical simulation study of similar materials for rockburst. Chin. J. Rock Mech. Eng. 2011, 30, 2610–2616. [Google Scholar]
  20. Xu, W.; Xu, Y.; Wang, Y.; Than, L.G.; Lee, P.K.K.; Tsui, Y. Experimental study on simulation materials of rockburst. Chin. J. Rock Mech. Eng. 2000, 19, 873–877. [Google Scholar]
  21. Chen, L.; Bai, S. Proportioning test study on similar material of rockburst tendency of brittle rockmass. Rock Soil Mech. 2006, 27, 1050–1054. [Google Scholar]
  22. Zhou, H.; Chen, J.; Zhang, C.; Zhu, Y.; Lu, J.; Jiang, Y. Experimental study of the rockburst model material with low-strength and high-brittleness. Rock Soil Mech. 2019, 40, 2039–2049. [Google Scholar]
  23. Wu, J.; Zhang, X.Y.; Yu, L.Y.; Zhang, L.W.; Wu, T. Rockburst mechanism of rock mass with structural planes in underground chamber excavation. Eng. Fail. Anal. 2022, 139, 106501. [Google Scholar] [CrossRef]
  24. Ma, C.; Zhu, Z.; Fang, Z.; Li, Z.; Liu, L. Optimal proportion of similar materials and rockburst tendency of white sandstone. Adv. Mater. Sci. Eng. 2021, 2021, 6590779. [Google Scholar] [CrossRef]
  25. Jiang, Y.Z.; Wang, R.H.; Tang, T.C.; Guo, J.L. Research on plane strain model test of rockburst of underground cavern in hard brittle rockmass. Appl. Mech. Mater. 2014, 501-504, 1810–1814. [Google Scholar] [CrossRef]
  26. Shi, Y.; Ye, Y.; Hu, N.; Jiao, Y.; Wang, X. Physical simulation test on surrounding rock deformation of roof rockburst in continuous tunneling roadway. Minerals 2021, 11, 1335. [Google Scholar] [CrossRef]
  27. Ma, F.; Li, Z.; Luo, G. NIOS model material and its use in geo-mechanical similarity model test. J. Hydroelectr. Eng. 2004, 23, 48–51. [Google Scholar]
  28. Zhang, Q.; Li, S.; Guo, X.; Li, Y.; Wang, H. Research and development of new typed cementitious geotechnical similar material for iron crystal sand and its application. Rock Soil Mech. 2008, 29, 2126–2130. [Google Scholar]
  29. Liu, R.; Zhang, Y.; Wen, C.; Tang, J. Study on the design and analysis methods of orthogonal experiment. Exp. Technol. Manag. 2010, 27, 52–55. [Google Scholar]
  30. Zhang, C.; Lu, J.; Chen, J.; Zhou, H.; Yang, F. Discussion on rock burst proneness indexes and their relation. Rock Soil Mech. 2017, 38, 1397–1404. [Google Scholar]
  31. Kidybiński, A. Bursting liability indices of coal. Int. J. Rock Mech. Min. Sci. Geomech. Abstr. 1981, 18, 295–304. [Google Scholar] [CrossRef]
  32. Tan, Y.A. Discussion on energy impact index of rock-bursting rock. Hydrogeol. Eng. Geol. 1992, 19, 10–12. [Google Scholar]
  33. Xia, Y.J.; Li, L.C.; Tang, C.A.; Li, X.Y.; Ma, S.; Li, M. A new method to evaluate rock mass brittleness based on stress–strain curves of class I. Rock Mech. Rock Eng. 2017, 50, 1123–1139. [Google Scholar] [CrossRef]
  34. Mei, S.; Feng, X.; Li, Z.; Yang, C.; Gao, J. A novel 3D printing technology for synthetic hard rock and the fabrication of Jinping marble. Rock Mech. Rock Eng. 2022, 55, 7695–7714. [Google Scholar] [CrossRef]
Figure 1. Components of analogous simulation materials.
Applsci 14 11694 g001
Figure 2. Partially prepared specimens: (a) standard cylindrical specimens and (b) Brazilian disc specimens.
Applsci 14 11694 g002
Figure 3. Mechanical testing of the analogous material specimens: (a) uniaxial compression test, (b) Brazilian splitting test, and (c) loading equipment and acoustic emission monitoring system.
Applsci 14 11694 g003
Figure 4. Schematic diagram of rockburst tendency index calculation.
Applsci 14 11694 g004
Figure 5. Sensitivity analysis of density.
Applsci 14 11694 g005
Figure 6. Sensitivity analysis of compressive strength.
Applsci 14 11694 g006
Figure 7. Sensitivity analysis of tensile strength.
Applsci 14 11694 g007
Figure 8. Sensitivity analysis of the elastic modulus.
Applsci 14 11694 g008
Figure 9. Sensitivity analysis of the rockburst tendency index.
Applsci 14 11694 g009
Figure 10. Sensitivity analysis of the brittleness index.
Applsci 14 11694 g010
Figure 11. Comparison chart of actual and regression parameters for specimens.
Applsci 14 11694 g011
Figure 12. Failure mode of the analogous material specimens: (a) uniaxial compression test and (b) Brazilian splitting test.
Applsci 14 11694 g012
Figure 13. Uniaxial compression test of the analogous material specimens: (a) stress–strain curve and (b) acoustic emission characteristics.
Applsci 14 11694 g013
Figure 14. Uniaxial compression test of Jinping marble (modified from [34]): (a) typical stress–strain curve (AE characteristics) and (b) failure mode.
Applsci 14 11694 g014
Table 1. Experimental factors and levels.
LevelA
Refined Iron Powder–Barite Powder Ratio
B
Quartz Sand (%)
C
Gypsum Powder (%)
D
Rosin–Alcohol Solution Concentration (%)
E
Rosin–Alcohol
Solution Dosage (%)
11:0.362.054.0
21:0.582.5104.5
31:0.7103.0155.0
41:0.9123.5205.5
51:1.1144.0256.0
Note: Mass fraction of refined iron powder + barite powder = 100%—B—C—E, with individual percentages calculated based on factor A.
Table 2. Material-proportioning scheme.
Test No.A
Refined Iron Powder–Barite Powder Ratio
B
Quartz Sand (%)
C
Gypsum Powder (%)
D
Rosin–Alcohol Solution Concentration (%)
E
Rosin–Alcohol
Solution Dosage (%)
11:0.362.054.0
21:0.382.5104.5
31:0.3103.0155.0
41:0.3123.5205.5
51:0.3144.0256.0
61:0.562.5155.5
71:0.583.0206.0
81:0.5103.5254.0
91:0.5124.054.5
101:0.5142.0105.0
111:0.763.0254.5
121:0.783.555.0
131:0.7104.0105.5
141:0.7122.0156.0
151:0.7142.5204.0
161:0.963.5106.0
171:0.984.0154.0
181:0.9102.0204.5
191:0.9122.5255.0
201:0.9143.055.5
211:1.164.0205.0
221:1.182.0255.5
231:1.1102.556.0
241:1.1123.0104.0
251:1.1143.5154.5
Table 3. Test results of the material-proportioning scheme.
Test No.ρ (g·cm−3)σc (MPa)σt (MPa)E (GPa)WcfBi
12.370.120.010.1520.871.111
22.400.330.070.1201.520.706
32.200.450.070.2431.011.292
42.220.720.080.3641.350.848
52.181.330.130.7721.250.556
62.361.140.160.3731.170.561
72.221.240.110.3851.280.500
82.341.340.090.6041.100.650
92.290.270.030.1480.591.578
102.330.740.070.2860.960.642
112.281.690.190.7271.140.475
122.270.280.040.1420.941.116
132.280.750.110.3331.091.006
142.101.130.090.3600.830.813
152.230.480.060.2891.880.555
162.261.020.130.5790.880.736
172.241.040.090.4641.160.567
182.230.560.080.2813.290.141
192.261.880.200.5360.790.727
202.220.350.040.1370.631.168
212.201.600.120.6280.890.791
222.231.940.160.7081.410.422
232.210.450.040.2300.731.113
242.200.650.060.3041.070.666
252.201.210.140.4381.350.570
Table 4. Range analysis of density.
Average ValueAB (%)C (%)D (%)E (%)
Average value 12.272.292.252.272.28
Average value 22.312.272.292.292.28
Average value 32.232.252.222.222.25
Average value 42.242.212.262.222.26
Average value 52.212.232.242.262.19
Range0.100.080.070.070.09
Table 5. Range analysis of compressive strength.
Average ValueAB (%)C (%)D (%)E (%)
Average value 10.591.110.900.290.73
Average value 20.950.970.860.700.81
Average value 30.870.710.880.990.99
Average value 40.970.930.910.920.98
Average value 51.170.821.001.641.03
Range0.650.400.141.340.31
Table 6. Range analysis of tensile strength.
Average ValueAB (%)C (%)D (%)E (%)
Average value 10.070.120.080.030.06
Average value 20.090.090.110.090.10
Average value 30.100.080.090.110.10
Average value 40.110.090.100.090.11
Average value 50.100.090.100.150.10
Range0.040.040.030.120.05
Table 7. Range analysis of the elastic modulus.
Average ValueAB (%)C (%)D (%)E (%)
Average value 10.3300.4920.3570.1620.363
Average value 20.3590.3640.3100.3240.343
Average value 30.3700.3380.3590.3760.367
Average value 40.3990.3420.4250.3890.383
Average value 50.4620.3840.4690.6690.465
Range0.1320.1540.1590.5070.122
Table 8. Range analysis of the rockburst tendency index.
Average ValueAB (%)C (%)D (%)E (%)
Average value 11.200.991.470.751.22
Average value 21.021.261.221.101.58
Average value 31.181.441.031.100.92
Average value 41.350.931.211.741.13
Average value 51.091.211.001.140.99
Range0.330.510.470.990.66
Table 9. Range analysis of the brittleness index.
Average ValueAB (%)C (%)D (%)E (%)
Average value 10.9030.7350.6261.2170.710
Average value 20.7860.6620.7320.7510.694
Average value 30.7930.8400.8200.7610.914
Average value 40.6680.9260.7840.5670.801
Average value 50.7120.6980.9000.5660.744
Range0.2350.2640.2740.6510.220
Table 10. Statistical model validation.
Statistical MetricsρσcσtEWcfBi
R20.6520.8090.6660.7980.5800.708
Adjusted R20.6230.7580.5790.7450.5230.682
F7.12416.0737.59015.0155.2409.220
p-Value<0.001<0.001<0.001<0.0010.003<0.001
Variablep-Value for coefficient
Constant<0.0010.0450.0290.0430.0360.022
Barite powder–refined iron powder ratio0.0140.0050.0320.0300.0580.031
Quartz sand0.0220.0360.0350.0370.0550.043
Gypsum powder0.0470.0490.0540.0260.0310.027
Rosin–alcohol solution concentration0.035<0.001<0.001<0.0010.021<0.001
Rosin–alcohol solution0.0220.0240.0270.0390.0370.046
Table 11. The physical and mechanical parameters of T2b marble.
Unit Weight (kN/m3)Uniaxial Compressive Strength (MPa)Tensile Strength (MPa)Elastic Modulus (GPa)Cohesion (MPa)Internal Friction Angle (°)Poisson’s Ratio
27.71016.0242.834.4729.00.26
Table 12. The final determined proportion of the analogous material.
Refined Iron Powder–Barite Powder RatioQuartz Sand (%)Gypsum Powder (%)Rosin–Alcohol Solution Concentration (%)Rosin–Alcohol
Solution Dosage (%)
1:0.5172105.1
Table 13. Comparison of calculated and measured values of analogous material parameters.
Unit Weight (kN/m3)Uniaxial Compressive Strength (MPa)Tensile Strength (MPa)Elastic Modulus (GPa)Cohesion (MPa)Internal Friction Angle (°)Poisson’s Ratio
Calculated value25.21.530.090.6490.52229.00.26
Measured value24.21.530.100.6590.42829.00.26
Disclaimer/Publisher’s Note: The statements, opinions and data contained in all publications are solely those of the individual author(s) and contributor(s) and not of MDPI and/or the editor(s). MDPI and/or the editor(s) disclaim responsibility for any injury to people or property resulting from any ideas, methods, instructions or products referred to in the content.

