Article

Modeling the Conditions of Occurrence and State of Radial Cracks in Rock Specimens Under Axial Compression with Lateral Pressure

by
Vitali Shekov
1,* and
Gennady Kolesnikov
2,*
1
Institute of Geology, KarRC RAS, Pushkinskaya St., 11, 185610 Petrozavodsk, Russia
2
Institute of Forestry, Mining and Construction Sciences, Petrozavodsk State University, Lenin Str., 33, 185910 Petrozavodsk, Russia
*
Authors to whom correspondence should be addressed.
Appl. Sci. 2024, 14(24), 11552; https://doi.org/10.3390/app142411552
Submission received: 21 October 2024 / Revised: 22 November 2024 / Accepted: 2 December 2024 / Published: 11 December 2024
(This article belongs to the Section Civil Engineering)

Abstract

:
This paper presents a model for predicting the thickness of the cracked surface layer in rock specimens subjected to axial compression with lateral pressure. The study focuses on radial cracks that are most prominently open on the lateral surface, manifesting as axial (or longitudinal) cracks on this surface. The research employs methods for analyzing mechanical and geotechnical systems. The proposed model determines the conditions under which damage to the surface layer decreases depending on Poisson’s ratio and lateral pressure. Radial cracks typically precede spalling, making it crucial to examine the conditions of their initiation and the potential for influencing their development, and this holds significant importance for mining and underground construction practices. A comparison indicated that the predicted values and those reported in the literature for the thickness of the damaged surface layer in rock pillars are within a similar range, varying from 44% to 70% of the initial cross-sectional radius. Although this study focuses on rock materials, the proposed model also offers potential applications in examining crack formation in cement and geopolymer concretes, serving as artificial analogs of rock, thereby helping to mitigate the risk of structural failure in building systems.

1. Introduction

Uniaxial compressive strength is a critical parameter in rock quality assessment systems [1,2,3,4,5]. This strength is measured experimentally using cube- or solid-cylinder-shaped specimens that are deformed to failure at a controlled rate of load or displacement of the testing machine’s loading plate. Data from applied external forces (load) and corresponding displacements provide essential insights for the subsequent analysis of rock properties and test results. The stress in the rock under uniaxial compression is derived from the ratio of the external force ( F ) to the initial cross-sectional area of the specimen   ( A 0 ), expressed as   σ = F / A 0 .
It is generally recognized that the ratio of the maximum load ( F p e a k ) to the initial cross-sectional area ( A 0 ) defines the uniaxial compressive strength of the rock ( σ p e a k = F p e a k / A 0 ). This assumption is valid, as specimen damage and the resulting reduction in cross-sectional area are typically minimal during the pre-peak stage. The stress-displacement curve for the monotonic deformation of a specimen, achieved through the controlled displacement of the loading device plate, typically features an ascending branch, a peak point, and a descending branch.
The inherent heterogeneity of the rock and the localized failure of its weaker particles create local maxima on this curve [6]. In this context, controlled displacement acts as an independent variable, meaning that each monotonic displacement on the load–displacement curve corresponds to a unique force value. The load–displacement curves for monotonic and cyclic loading are similar (Figure 1). This suggests that, under certain conditions, the cracking patterns of rocks in the surface layer under monotonic and cyclic loading will be similar (but not identical).
This paper focuses on the behavior of a cylindrical specimen during the pre-peak stage of monotonic deformation. The pre-peak branch of the stress–strain curve (Figure 2) illustrates four distinct stages of brittle material behavior: the closure of initial cracks (stages 0–1, representing 10% to 15% of σ p e a k ); nearly linear deformation (stages 1–2, covering approximately 15% to 70–90% of σ p e a k ); the initiation and stable growth of new cracks (stages 2–4, ranging from ~40–60% to ~70–90% of σ p e a k ); and unstable crack growth (stages 2–3, from ~70–90% to 100% of σ p e a k ) [2]. During the nearly linear deformation stage, an inflection point, denoted as point 4, emerges on the graph, at which the tangential modulus of elasticity (E) attains its maximum value.
If the equation expressing the dependence σ ( ε ) , is known, then the coordinates of the inflection point can be found from the condition d 2 σ d ε 2 = 0 ; a number of such equations are known, and form the basis of many models of uniaxial compression of rocks [6,7,8,9,10] and similar materials [11,12]. An acceptable option is Equation (1) [13], which is a product of the long-term evolution of the Furamura model and is a variant of the Blagojevich model [11].
If the equation describing the dependence of stress (σ) on strain (ε) is known, the coordinates of the inflection point can be determined by satisfying the condition   d 2 σ d ε 2 = 0 . Various such equations have been established, forming the basis of numerous models for the uniaxial compression of rocks [8,9,10,11,12] and analogous materials [13,14]. A viable approach is represented by the following Equation (1) [15], which is the result of an extended development of the Furamura model and serves as a variant of the Blagojevich model [13].
σ = σ p e a k ε ε p e a k e 1 n ( 1 ε n ε p e a k n ) B .
Since σ = F / A 0 and   ε = u / L 0 , where L 0 is the initial height of the specimen and u is the change in its length, Equation (1) can be reformulated in terms of force ( F ) and displacement (u) while retaining the same model parameters n and B :
F = F p e a k u u p e a k e 1 n ( 1 u n u p e a k n ) B .
The strain ε p e a k and the stress σ p e a k at the peak point are determined experimentally. The dimensionless model parameters n and B must be calibrated by fitting the theoretical curve (Equation (1)) to experimental data using methods such as least squares, as in [13]. Alternatively, applying a random search method [16] offers a more straightforward and generalized approach.
Preliminary analyses and test calculations have demonstrated that the values of parameters n and B in Equation (1) vary based on the rock’s physical and mechanical properties, but they generally change within narrow intervals for a given rock type. This is likely because Equation (1) does not explicitly incorporate material constants, such as the modulus of elasticity. Consequently, parameters n and B implicitly reflect rock characteristics. This suggests a potential link between these parameters and rock classification, warranting comprehensive studies of rocks from various deposits. Such research would involve analyzing the correlation between characteristic points and segments of the stress–strain curve and the mechanical response of rock specimens under uniaxial compression, considering their fracture patterns.
The analogy between rock and concrete, a widely accepted rock analog, facilitates this analysis by enabling the use of findings from recent studies [17] that reexamined traditional concepts of concrete’s compressive strength. Study [17] emphasizes two principal damage models for concrete under uniaxial compression: longitudinal tensile cracks and inclined shear cracks.
As noted above, failure mechanisms correlate with ultimate strength, defined by the peak stress. This parameter varies with the mode and nature of failure. Distinct mechanisms, such as hourglass or shear failure, display different patterns of damage accumulation and propagation within the material. These differences influence the normal and shear stresses needed to reach ultimate strength. The type of failure is influenced by deformation conditions, including strain rate and contact friction. Notably, peak stress decreases when friction between the specimen’s contact zone and the testing machine’s plates decreases [17] (Figure 3).
The boundaries of the above-mentioned intervals (Figure 2) outline the time sequence of destruction stages, recognizing that the tensile strength of rocks is considerably lower than their shear strength [2]. Therefore, tensile cracks emerge within the initial interval, followed by the formation and propagation of shear cracks at an external pressure of approximately ~70~90%   σ p e a k . Consequently, as external pressure increases during this pre-peak phase, the specimen exhibits a diminishing ability to resist deformation, which reflects a residual bearing capacity ranging from approximately 30 until ~10% of σ p e a k [18,19] (Figure 4).
Furthermore, we draw attention to experimental studies [20,21,22,23] which have demonstrated that the failure of brittle rocks is typically associated with a substantial number of tensile cracks and a comparatively smaller number of shear cracks at the macroscopic level. Significant progress has been made through both experimental and theoretical research, including with models addressing uniaxial compression with lateral pressure [1,2,3,8,17,19]. However, the balance between the accuracy of the results and the complexity of the algorithms often falls short of meeting the practical needs of engineering applications.
This work aims to develop a simplified model for predicting radial cracks within the surface layer of cylindrical rock specimens subjected to uniaxial compression combined with proportional lateral pressure. The model is anticipated to shed light on the primary research question regarding the conditions that lead to the emergence of radial cracks in the surface layer of cylindrical rock specimens and the feasibility of controlling these cracks through adjustments to lateral pressure.

2. Methodology and Results

2.1. Methodology

This section introduces a simplified model to describe the potential mechanism of crack formation within the surface layer of a cylindrical specimen subjected to uniaxial compression combined with lateral pressure. In the proposed model, the uniform lateral pressure is proportional to the axial stress, represented as σ c n f = s σ z ,   0 s 1 . One form of failure under consideration (as illustrated in Figure 4a) involves the localization of radial and annular cracks within a layer of thickness t (Figure 5), leading to the separation of fragments from the core of the specimen. The presence of radial cracks within this surface layer is indicative of tensile annular stresses   σ t . Consequently, the surface layer can be conceptualized as a virtual “hoop” or bandage, resembling a shell of wall thickness t , subjected to internal pressure σ R and external pressure σ c n f (Figure 5). The axial stress ( σ z ) is uniformly distributed across the areas of the upper and lower ends of the specimen. The proposed model assumes that the circumferential stresses within the surface layer are evenly distributed across vertical sections with an area of   t d z . This assumption minimally affects modeling accuracy under two conditions: (1) when the actual distribution of circumferential stresses is nearly uniform, and (2) when the thickness of the cracked surface layer is relatively small in comparison to the specimen radius. Subsequent comparisons with experimental data will help assess the validity and limitations of these simplifications.
The thickness of the layer, denoted as t, is initially unknown, and determining its value constitutes the primary objective of this study. In the current model, it is assumed that the material properties of the surface layer are identical to those of the original specimen. While adhesion between the surface layer and the core of the specimen is acknowledged, this analysis focuses solely on radial cracks present within the surface layer. The adhesion between the surface layer and the core of the sample may be insufficient under certain conditions, but the analysis of these conditions is a subject for further research, beyond the scope of this paper.
To proceed, we establish the equilibrium condition for a surface layer element by summing the projections of all forces along the x-axis. This condition ensures mechanical balance and serves as the basis for further analysis and modeling of stress distributions within the cracked surface layer:
σ R R t d φ d z 2 σ t t d z sin d φ 2 σ c n f R d φ d z = 0 .
This is due to the smallness of the angles   sin d φ 2 d φ 2 .
σ R R t σ t t σ c n f R = 0 ;
σ t = σ R R t σ c n f R t .
The model under consideration incorporates Poisson’s ratio, ν, within relation (6), which establishes a connection between the radial stress, ( σ R ), and the vertical pressure, ( σ z ), as per Dinnik’s hypothesis [24,25]. This relationship is pivotal in describing how lateral deformations influence stress distributions under uniaxial compression with lateral constraints:
σ R = n σ z ;   n = ν 1 ν .
If 0 ν 0.5 , then 0 n 1 .
In the model under consideration, the vertical pressure, represented as ( σ z = F / A 0 ,     A 0 = π R 2 ), determines the lateral pressure using a proportionality coefficient s:
σ c n f = s σ z ;   0 s 1 .
The user specifies the proportionality coefficient when analyzing the effect of lateral pressure on the bearing capacity of a column or pillar made of materials such as concrete or rock.
Substituting relations (6) and (7) into Equation (5) leads to Equation (8).
The user specifies the proportionality coefficient s when analyzing the effect of lateral pressure on the bearing capacity of a column or pillar composed of materials such as concrete or rock. By substituting relations (6) and (7) into Equation (5), we derive Equation (8):
σ t = σ z n R t s R t .
Radial cracks will not form if the circumferential stress remains below a threshold value equal to the tensile strength of the rock, denoted as   σ t ,   p e a k . In the limiting case, when σ t = σ t ,   p e a k , this condition, combined with Equation (8), provides an estimate for the thickness of the fractured layer, as expressed in Equation (9):
t = R σ z ( n s ) n σ z + σ t ,     p e a k   ;   s n .
Equation (9) demonstrates that the circumferential stress is directly proportional to the radius, indicating that the maximum values of circumferential stresses—and consequently the localization of radial cracks—occur within the surface layer of the specimen, as evidenced by experimental observations (refer to Figure 4). Equation (10) defines a dimensionless characteristic representing the thickness of this layer:
  t R = 1 s n 1 + σ t ,     p e a k n σ z ;   s n .
In this analysis, the accuracy of the modeling may be influenced by the following limitations.
The proposed model focuses on predicting the state of the material near the mid-height of the cylindrical specimen. This is because in this zone, edge effects are minimal, leading to the development of tensile circumferential stresses that increase with higher friction between the loading plates and the specimen ends [26]. Additionally, the hourglass fracture pattern (refer to Figure 4) highlights that the circumferential stresses and the thickness of the surface layer containing radial cracks reach their maximum approximately at the specimen’s mid-height.
Moreover, since both tensile and compressive stresses are present in the same specimen, a critical question arises: do these stresses reach their peak values simultaneously? Experimental evidence indicates that tensile cracks under uniaxial compression develop prior to the formation of shear cracks [2,17], as depicted in Figure 6. This phenomenon is attributed to the rock’s lower tensile strength compared to its compressive strength.
The sequence of failure (initial tension followed by shearing) is also indirectly represented in the stress–strain curve (Figure 2). After surpassing the inflection point 4, increased nonlinearity emerges and grows, likely attributed to the formation of radial tensile cracks. Tensile cracks initially form within the weakest particles of the material at a stress range of approximately 40% to 60% of   σ p e a k . Subsequently, when stress levels increase to approximately 70–90% or even 100% of   σ p e a k , these cracks grow unstably and coalesce. During this stage, the formation of shear microcracks within weak particle contacts in heterogeneous rock may also occur.
From a physical standpoint, it is reasonable to assume that the peak circumferential tensile stress reaches its maximum when the axial compressive stress is within the 70% to 90% to 100% σ p e a k range. Furthermore, the initial formation of tensile microcracks in the weakest particles of the material shortly after inflection point 4 on the stress–strain plot (Figure 2) is possible. However, this aspect warrants further experimental investigation, as indicated by previous studies [2,17,27,28,29]. In this paper, we analyze the influence of Poisson’s ratio, tensile strength, and confining pressure on the state of the surface layer containing radial cracks using Equations (8)–(10).

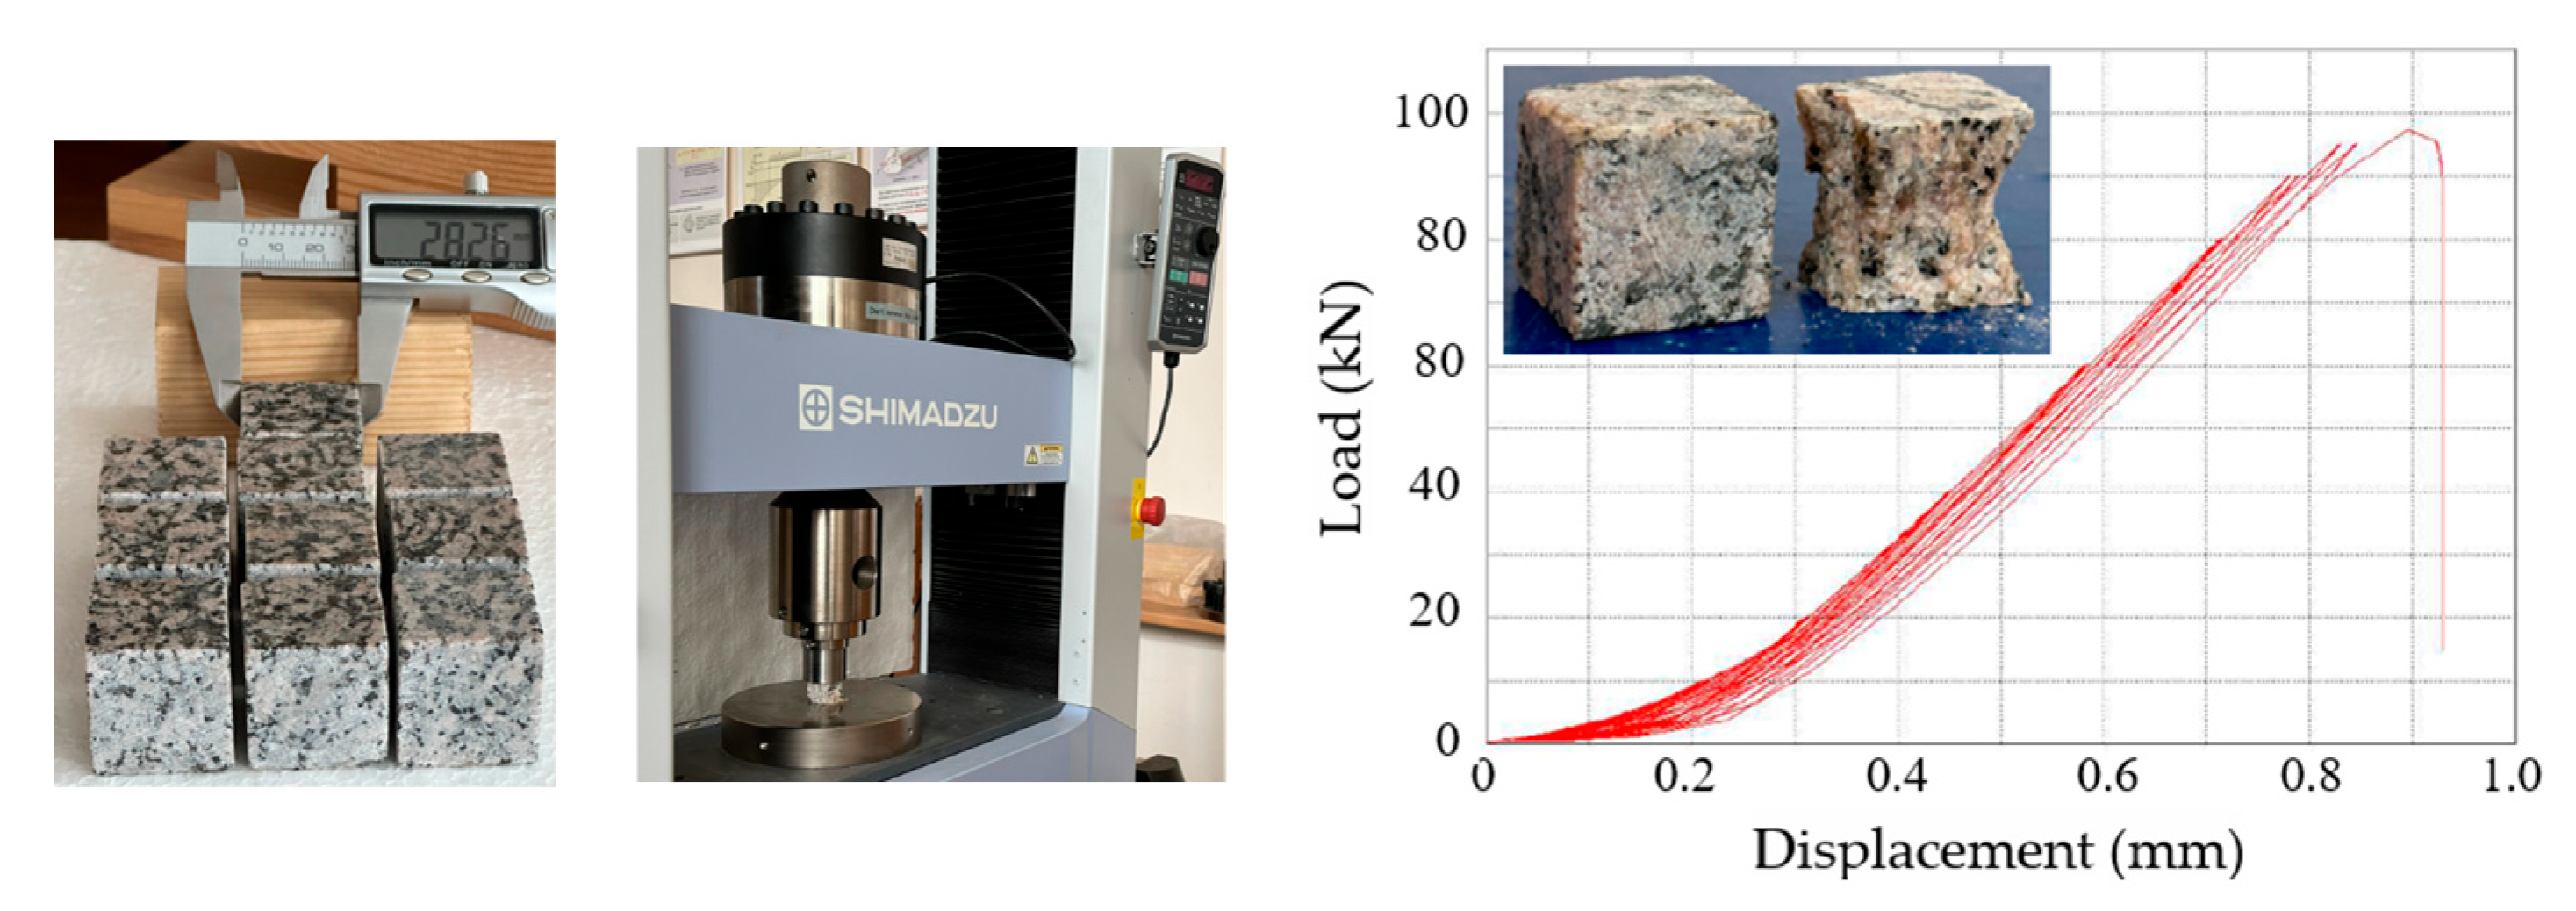
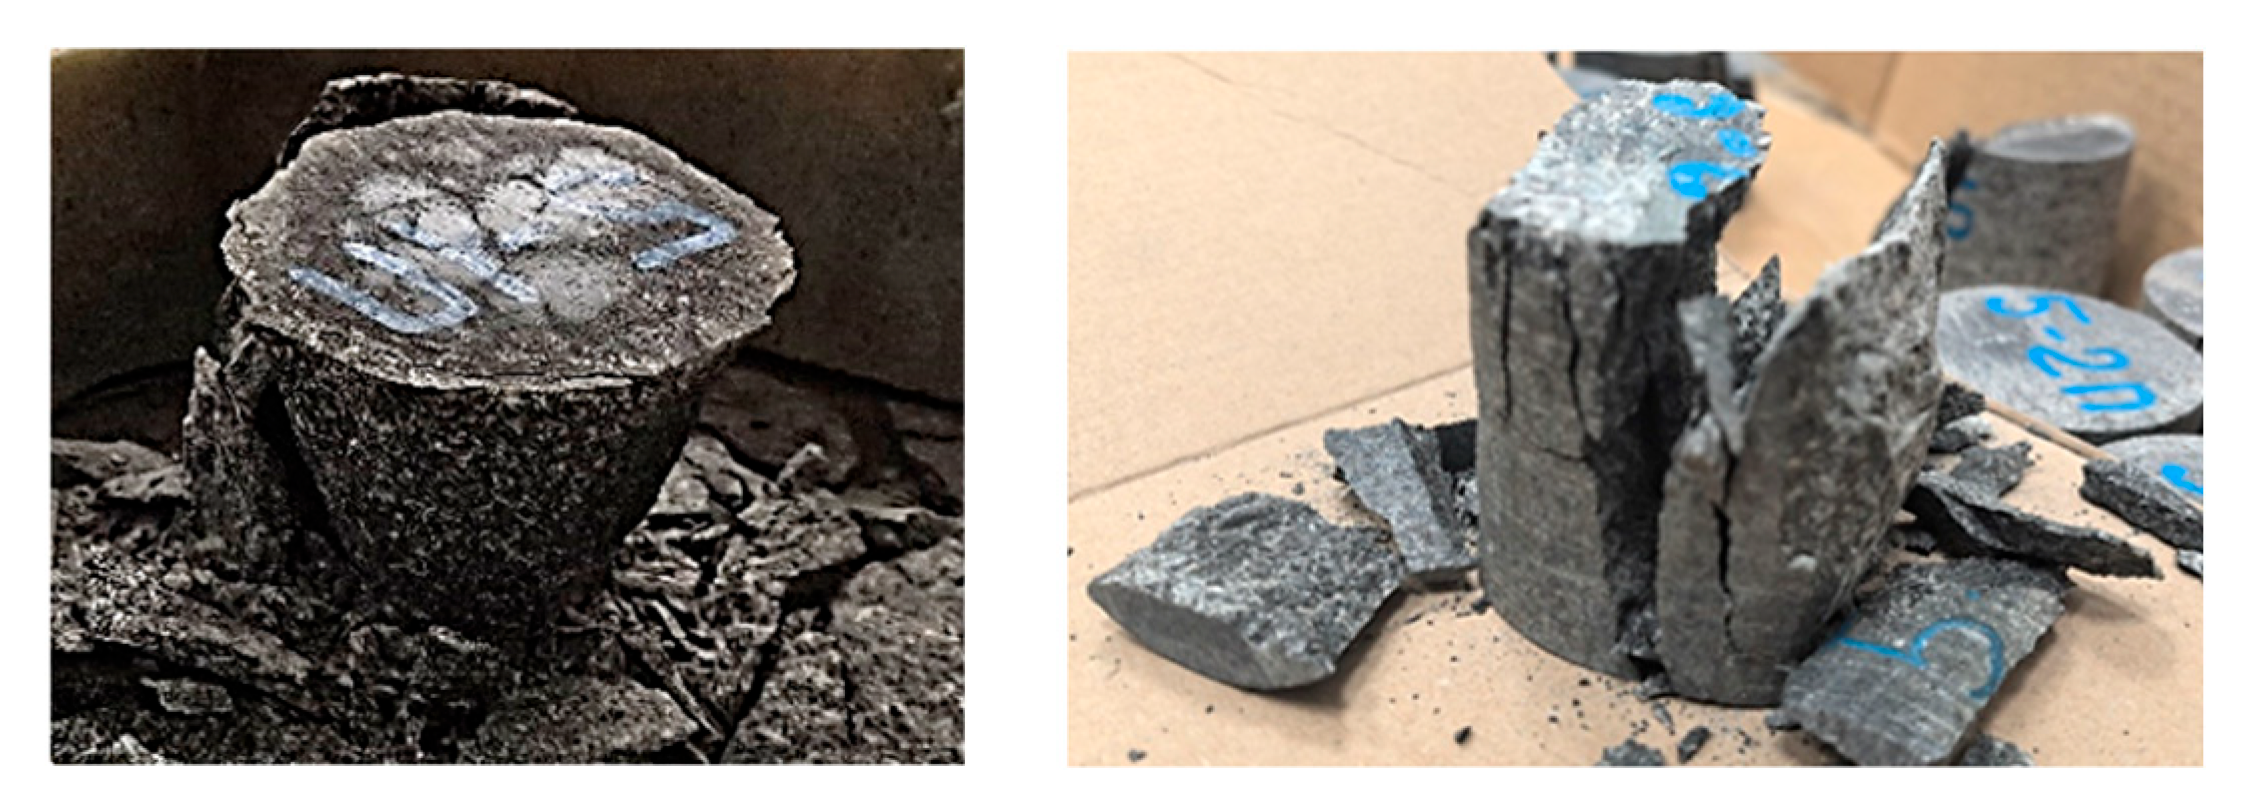
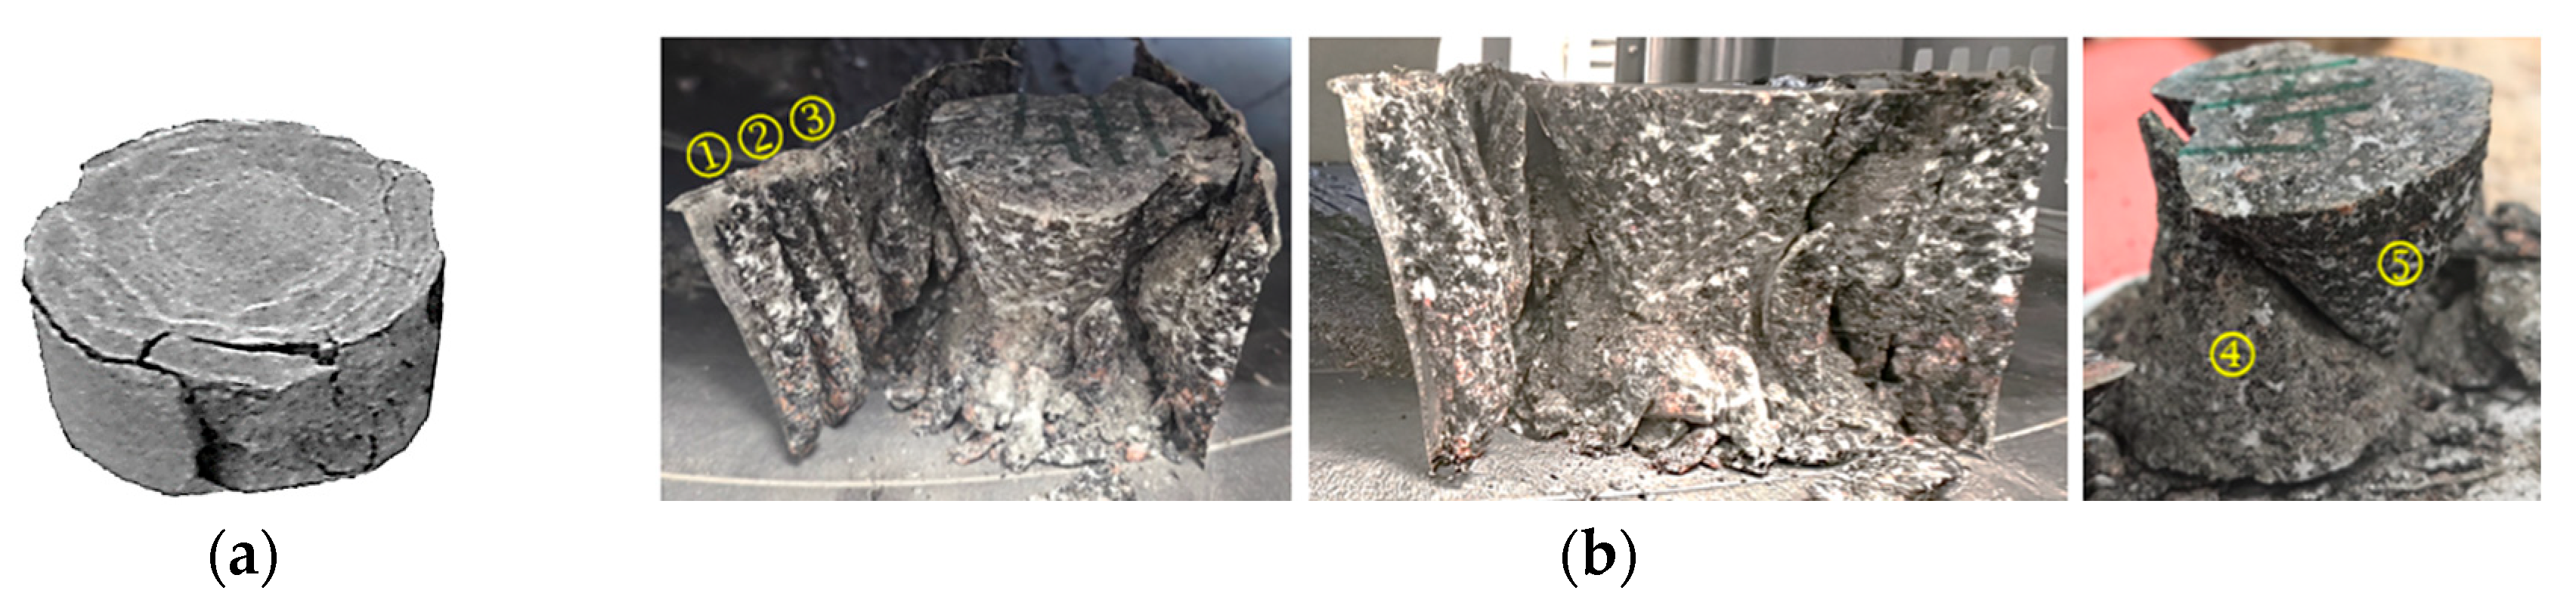
2.2. Unconfined Uniaxial Compression

For unconfined axial compression, s = 0 and Equation (10) takes the form
  t R = 1   1 +   σ t , p e a k n   σ z .
Figure 7 illustrates the variation in the relative thickness of the cracked layer (Equation (11)) as a function of axial and circumferential stresses for three distinct values of Poisson’s ratio: 0.05, 0.25, and 0.5.
From Equation (11), it follows that an increase in the coefficient n, which is related to the Poisson’s ratio, as shown by Relation (6), leads to an increase in the thickness of the layer containing radial cracks induced by circumferential stresses. These findings are consistent with the study in [26], which, using the finite element method, determined that higher Poisson’s ratios result in increased tensile stresses and a broader zone of their influence, given that all other factors remain unchanged. Figure 8 illustrates the influence of Poisson’s ratio on the thickness of the layer with radial cracks (calculated using Equation (11)) as a function of the ratio of peak stress to axial compressive stress.
As shown in Figure 8, small variations in Poisson’s ratio within the range of 0 to 0.25, and in the ratio σ t ,   p e a k σ z within the range of 0 to 0.2, lead to relatively significant changes in the thickness of the analyzed layer. Beyond the upper limits of these ranges, the response becomes more gradual and nearly linear. These trends highlight an increased sensitivity of relatively weak materials to minor alterations in their state, aligning with laboratory findings [28,29,30], which indicate that the external (bandage) reinforcement of columns in mining is more beneficial for weak rocks compared to strong ones. Given the practical relevance and importance of addressing these strength-related issues [31], a more detailed examination of the influence of lateral pressure on the thickness of the cracked surface layer under axial compression, as described by Equation (10), is warranted.

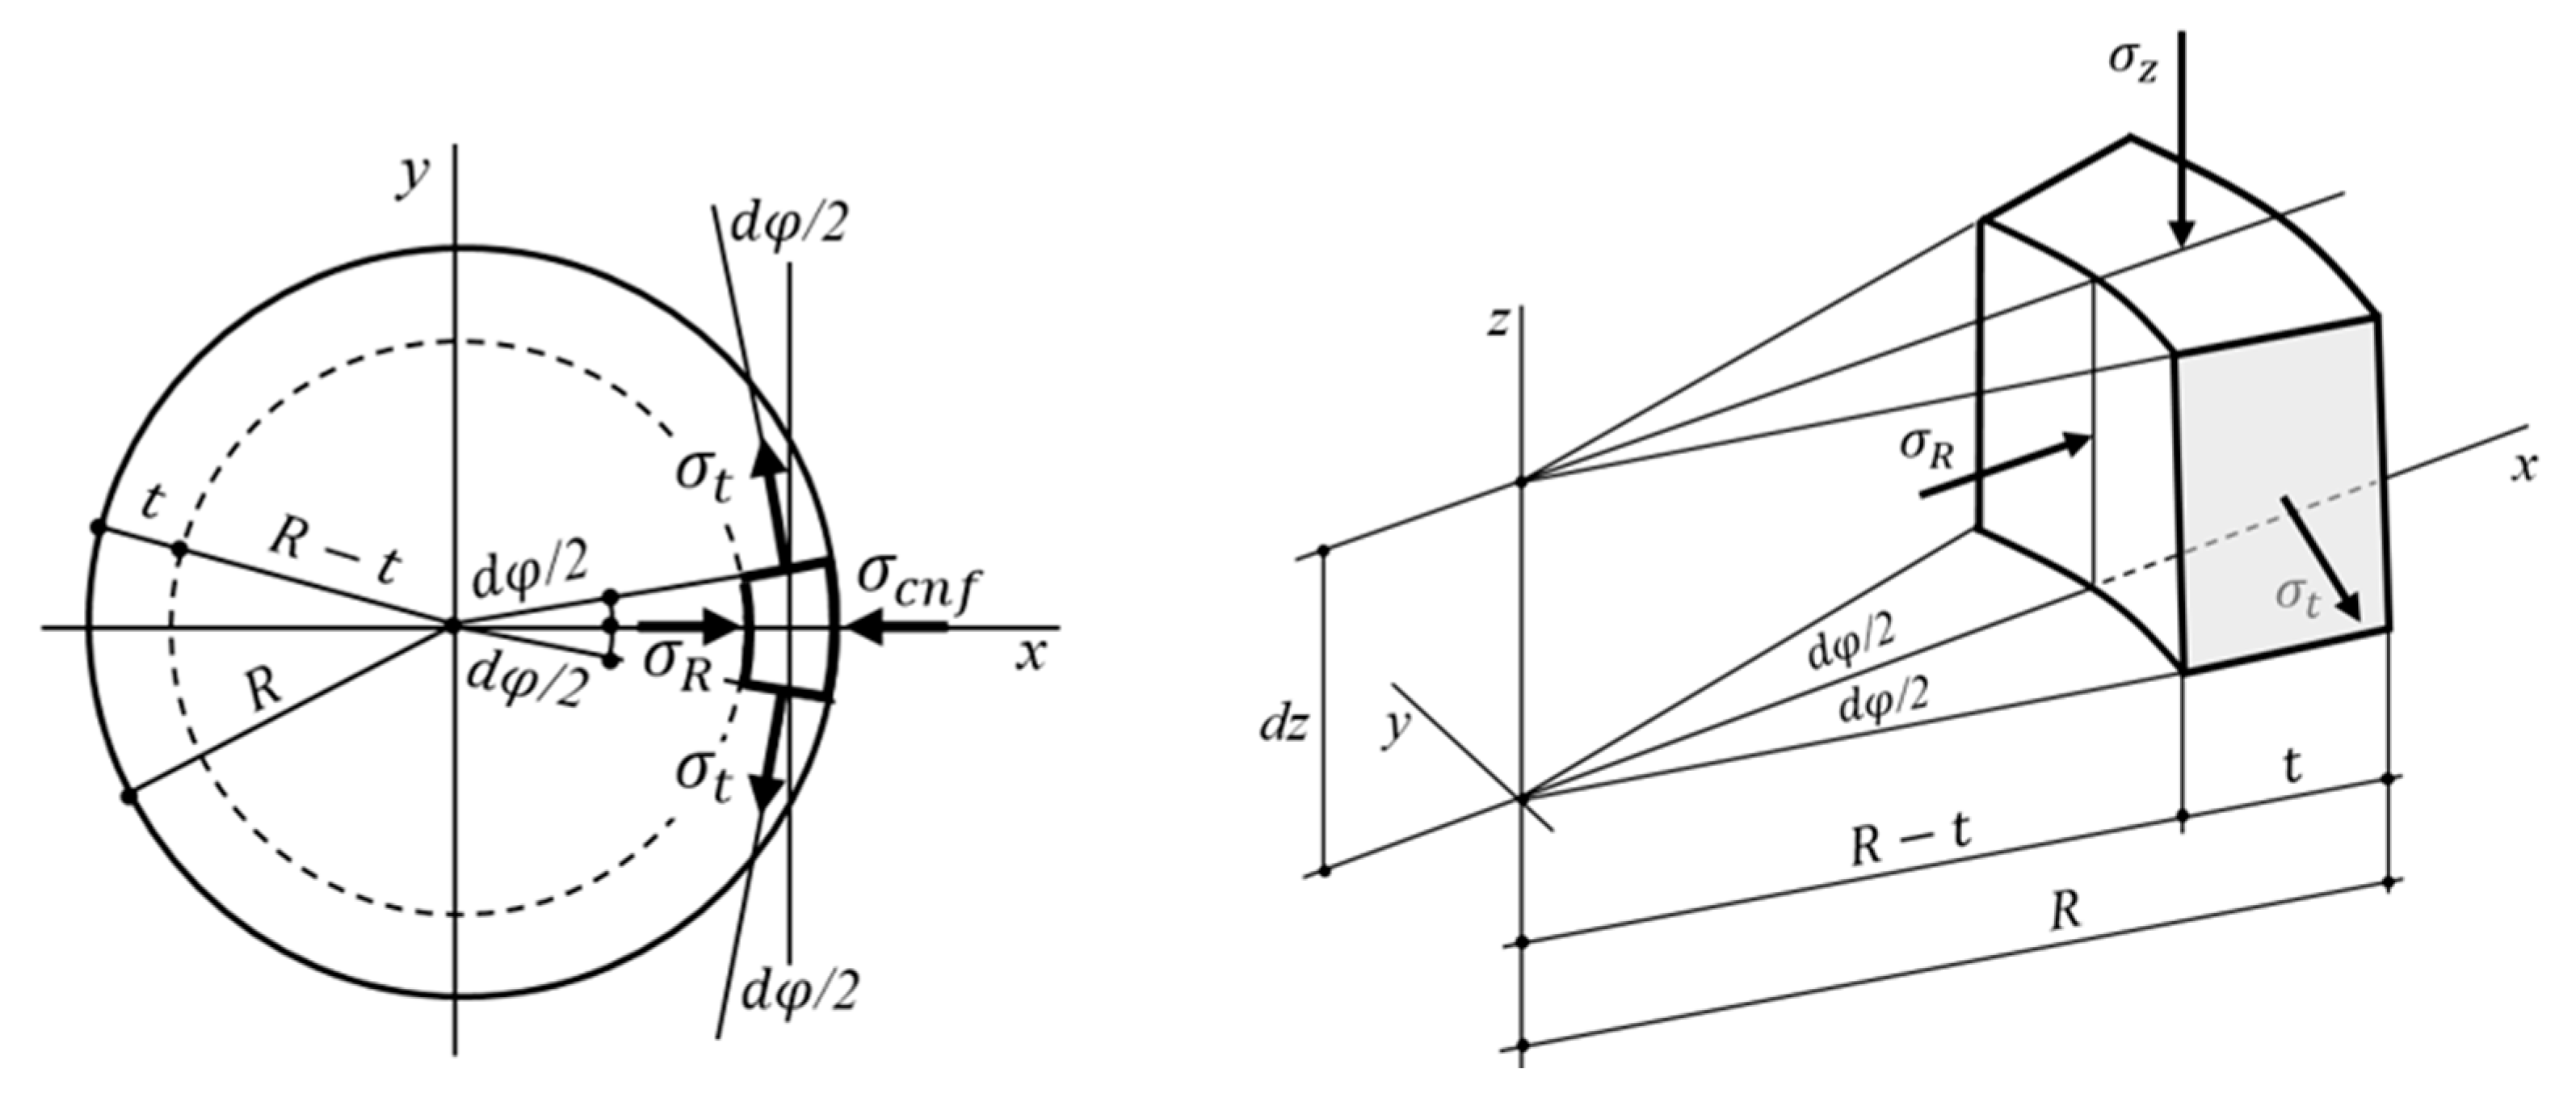
2.3. Effect of Lateral Pressure on the Thickness of a Layer with Radial Cracks

The plots in Figure 9 illustrate the variations in the thickness of the cracked layer, determined by Equation (10) as a function of axial and circumferential stresses for three different values of Poisson’s ratio (0.1, 0.3, and 0.5) and three scenarios of proportional lateral pressure ( σ c n f = s σ z ;   s = 0 ;   0.05 ;   0.1 ).
An analysis of the results shown in Figure 9 reveals several important observations.
An increase in lateral pressure corresponds to a reduction in the thickness of the layer with radial cracks.
The extent of change in the thickness of the cracked layer is influenced by the Poisson ratio. Specifically, lower values of Poisson’s ratio result in a more pronounced sensitivity of the protective layer to variations in proportional lateral pressure.
Within the range of axial compressive stress values from zero to approximately 100 MPa, the influence of lateral pressure on the thickness of the fractured layer increases more rapidly compared to higher axial stresses. This behavior is clearly depicted in Figure 8, where the surface becomes increasingly flattened along the σ z axis. Such a pattern aligns with previously mentioned experimental findings, indicating that external (bandage) reinforcement is more effective for weaker rocks as opposed to stronger ones [30,31].
When the lateral pressure (Equation (7)) and radial stress (Equation (6)) are equal in absolute magnitude, the thickness of the cracked layer (determined by Equation (9)) becomes zero. Under these conditions, the circumferential stresses, given by σ t = n σ z   (Equation (5)), induce compression, leading to the closure of cracks.
Figure 10 illustrates the influence of Poisson’s ratio on the thickness of the layer with radial cracks as a function of ultimate strength relative to axial compressive stress. The plot considers three scenarios of proportional lateral pressure ( σ c n f = s σ z ; s = 0 ;   0.05 ;   0.1 ) (calculated using Equation (10)).
The plots in Figure 10 reveal that the thickness of the cracked layer decreases as Poisson’s ratio decreases and tensile strength increases.

3. Discussion

3.1. Consistency with Examples from Previous Studies

As previously mentioned, the nature of rock failure under uniaxial compression is significantly influenced by friction at force contacts. The model of axial compression with maximum friction corresponds well to the behavior of rock columns (pillars), which are an essential component in underground mining. Pillars consist of unmined sections of ore that are retained to support the roof and overburden [30,31,32]. The damage patterns observed in these structures (illustrated in Figure 11) [33] are consistent with those documented in laboratory conditions, as seen in Figure 4.
The comparison of calculated results obtained using Equations (6), (8), and (10) and depicted in Figure 7 and Appendix A with experimental data from [33] (Figure 11) demonstrates that the relative thickness of the fractured surface layer in actual rock columns lies within the range of 0.44 to 0.70. The predicted average values of this layer also fall within this range. Thus, the developed model accurately represents the process of surface layer damage due to radial cracks while maintaining a satisfactory level of prediction accuracy.

3.2. The Effect of a Sharp Decrease in the Degree of Failure of the Surface Layer Depending on the Poisson’s Ratio and Lateral Pressure

The impact of lateral pressure on the mechanical state of pillars and their bearing capacity and failure predictions is discussed in [31,32]. According to [31], there is a threshold value of the confinement that causes a significant reduction in the failure rate. Analyzing this phenomenon has both scientific and practical implications. The sharp (high-gradient) reduction in cracking of the surface layer under a specific lateral pressure is a primary focus of this study within the proposed model framework.
Equation (10) elucidates and predicts the observed sharp reduction in surface layer damage as a function of Poisson’s ratio and lateral pressure. Specifically, Equations (6) and (9) indicate that the thickness of the cracked layer becomes zero when s = n , i.e., if σ c n f = σ R = n σ z = ν 1 ν σ z . Figure 12 illustrates the variation in relative thickness of the damaged layer in relation to lateral pressure and Poisson’s ratio.
A confining pressure σ c n f = ν 1 ν σ z can be induced through external (bandage) reinforcement. Practical applications involving external reinforcement using steel and polymer ropes and meshes are discussed in [31]. Reinforcement contributes to an increase in lateral pressure as transverse deformation escalates. This effect is captured in the proposed model, automatically simulating the proportional increase in lateral pressure relative to Poisson’s ratio and axial compressive stress through Equations (6) and (9).
As previously mentioned, lateral pressure diminishes the thickness of the layer damaged by radial cracks (as shown in Equation (10)). This effect is influenced by both the pressure magnitude and the Poisson’s ratio. Analysis using the proposed model and examples in Appendix A predict a rapid decrease in the thickness of the cracked surface layer when the lateral pressure σ c n f = s σ z and the proportionality coefficient sss falls within the range 0.9n to n, where n = ν/(1 − ν) and ν denotes the Poisson’s ratio of the rock. This prediction aligns with the aforementioned study [31]. Equation (10) enables the calculation of this critical threshold, as illustrated in Examples 12, 15, 18, 21, 24, 27, 31, and 35 in Appendix A. This threshold, ranging from 0.9n to n, defines the lateral pressure at which a rapid reduction in the thickness of the fractured layer occurs.

3.3. Axial Compression Without Lateral Pressure

The process of rock fracture comprises several stages [1,2] (Figure 2). This section focuses on two stages of the fracture process, distinguished by the differing tensile and shear strengths of rocks. The examples presented (Figure 11) demonstrate that significant damage to the surface layer of rock pillars under axial compression does not immediately lead to failure but elevates the risk of final failure to critical levels [33]. A comparison of the fracture patterns in Figure 4 and Figure 11 suggests that the initial stage of the fracture process involves the nucleation and growth of radial cracks—a necessary but not sufficient condition for spalling.
Damage to the surface layer and subsequent spalling considerably reduce the cross-sectional area (and consequently the radius) at the middle height of the rock pillar (Figure 11). The circumferential tensile stress inducing radial cracks is proportional to the radius and is described by Equation (8), rewritten below as (12) for the case where s = 0:
σ t = n σ z R t 1 ;   0 < t R .
An increase in axial load amplifies the destruction process, resulting in a greater thickness of the damaged layer and a reduction in the cross-sectional radius. This leads to a decrease in circumferential tensile stress, as described by Equation (12), down to a threshold value equivalent to the tensile strength of the rock. Consequently, when the tensile stress reaches this threshold, the propagation of radial cracks ceases, marking the completion of the first of the two aforementioned stages of destruction. At the conclusion of this first stage, the initial geometry of the rock column (Figure 11) and cylindrical rock specimen (Figure 4) transforms into an hourglass-like shape.
The second stage of the destruction process becomes more pronounced with a further increase in axial load. During this phase, in the mid-height region of the partially damaged column or specimen, circumferential stresses are lower than their peak values. However, the reduction in radius—and thus the cross-sectional area—causes an increase in shear stress, which in turn triggers shear failure (Figure 4).
It should also be noted that, according to Equations (6) and (12), an increase in Poisson’s ratio results in a proportional increase in circumferential stress during axial compression without lateral pressure.

3.4. Potential Applications and Developments

In conclusion, this paper introduces a model for predicting the thickness of the layer with radial cracks in cylindrical rock specimens subjected to uniaxial compression with lateral pressure. Sources of potential modeling inaccuracies have been analyzed, with examples demonstrating the model’s application and presenting calculation results in graphical and tabular formats (Figure 7, Figure 8, Figure 9, Figure 10 and Figure 12 and Appendix A). A comparison with experimental data revealed a strong correlation between the predicted and observed results concerning the cracked surface layer. All data pertain to rocks and focus solely on radial cracks, which appear visually as axial (or longitudinal) cracks on the lateral surface. However, applied studies on microcracks and surface-layer cracks are equally crucial for cement and geopolymer concrete due to their impact on the durability and safety of buildings and other engineering structures.
Since radial cracks precede spalling, studying the conditions that promote their occurrence and methods for controlling their state holds significant importance in mining and underground construction practices [34]. Therefore, further research is required to enhance models for accurately predicting crack formation and propagation [35]. Such models would allow for the prediction of primary damage within the surface layer before it evolves into macroscopic damage, which can ultimately lead to reinforcement corrosion and structural failure in concrete [36]. As such, the proposed model offers a valuable tool for applied research on crack formation in brittle materials [37,38,39].
This paper is focused on a relatively small but practically significant problem: predicting cracks within the surface layer of pillars (Figure 11). As mentioned, longitudinal cracks on the lateral surface precede specimen spalling, and spalling, in turn, precedes shearing and ultimate failure (Figure 4). Consequently, the appearance and coalescence of longitudinal cracks serve as precursors to failure. Monitoring crack evolution and predicting the state of a brittle-material column using methods such as acoustic emission analysis [40,41] and fractal analysis [42,43], and using equally important results [44,45,46,47,48,49,50], expands the scientific basis for addressing this issue comprehensively.

4. Conclusions

This paper presents an analytical model and simulation results for predicting the thickness of the cracked surface layer in cylindrical rock specimens under uniaxial compression with lateral pressure. The simulation results are verified using experimental data from the literature. The verification showed that the developed method allows the thickness of the cracked layer to be predicted. The new modeling approach achieved good agreement between predicted and actual fracture layer thickness. The innovative nature of the approach lies in the fact that the surface layer of the rock at the model level functions as a virtual “hoop” or “bandage”, resembling a shell under internal pressure. To determine the internal pressure, Dinnik’s hypothesis is adapted, which expresses the horizontal pressure of the rock as a function of the vertical pressure through a nonlinear relationship including Poisson’s ratio. There are no analogs of this approach to modeling cracks in the surface layer of cylindrical specimens under axial compression in the literature known to us. In addition, the novelty of the model is in the separation of the functions of the outer and inner surfaces of the mentioned virtual shell. Namely, the inner surface of this shell is subject to internal pressure (according to Dinnik’s hypothesis [24,25]), and cracks are initiated on the outer surface (as shown by well-known literature reviews of damage to rock pillars). The distance between the inner and outer surfaces is equal to the predicted thickness of the layer with potential cracks. The thickness of the layer with potential cracks is determined as the solution of the equilibrium equation.
The developed model assumes that there are no initial cracks in the mentioned surface layer (natural microcracks in the rock are not taken into account). The condition for the initiation of new cracks in the surface layer is the growth of circumferential stresses to values equal to the tensile strength of the rock.
The above-mentioned new aspects of rock behavior analysis led to the creation of a simple but accurate model, which made it possible to obtain new results.
Examples of the use of the model are given; tables and graphs reflect the results of calculations for various initial data.
The comparison showed that the predicted values and literature values for the thickness of the damaged surface layer in rock pillars are in a similar range, varying from 44% to 70% of the initial cross-sectional radius depending on the axial load, Poisson’s ratio, and tensile strength of the rock.
The model not only predicts the thickness of the specified cracked surface layer, but also allows us to determine the lateral pressure required to reduce the thickness of this layer and thereby increase the bearing capacity of the rock pillars. However, as the literature analysis showed, the problem of increasing the bearing capacity of rock pillars using ropes, steel mesh, and shotcrete to create lateral pressure requires additional research.
Finally, despite the fact that all the data obtained were only for rock formations, applied studies of cracks in the surface layer are no less important for cement concrete and geopolymer concrete, as artificial analogs of rock formations, since cracks affect the durability and safety of buildings and other engineering structures of above-ground and underground construction. Therefore, this topic requires additional research to improve models for the more accurate prediction of crack formation and propagation in concrete. These same models will allow for the prediction of initial damage in the surface layer before it develops into macroscopic damage and eventually leads to the corrosion of reinforcement elements and concrete failure. Thus, the proposed model is a potentially useful tool in applied research on crack formation aspects.

Author Contributions

Conceptualization, V.S. and G.K.; methodology, V.S. and G.K.; software, V.S. and G.K.; validation, V.S.; formal analysis, G.K.; investigation, V.S. and G.K.; resources V.S.; data curation, V.S. and G.K.; writing—original draft preparation, G.K.; writing—review and editing, V.S.; visualization, G.K.; supervision, V.S.; project administration, V.S.; funding acquisition, V.S. All authors have read and agreed to the published version of the manuscript.

Funding

This research was funded by the Ministry of Education and Science of the Russian Federation, according to the Research Program of the Institute of Geology of the Karelian Research Center, reg. number 1022040100088-4-1.5.7;1.5.1.

Institutional Review Board Statement

Not applicable.

Informed Consent Statement

Not applicable.

Data Availability Statement

All data are contained in the text of this article, including Appendix A.

Conflicts of Interest

The authors declare no conflicts of interest.

Appendix A

Table A1. Relative thickness of the layer damaged by radial cracks, depending on axial stress, uniform pressure, ultimate strength of rocks, and Poisson’s ratio. Calculated using Equations (6)–(8) and (10).
Example Number σ z
MPa
σ t , p e a k
MPa
ν n σ R
MPa
s σ c n f
MPa
t R
13630.30.42915.43000.837
23630.30.42915.430.27.20.447
33630.30.42915.430.310.80.251
43650.30.42915.43000.755
53650.30.42915.430.27.20.433
63650.30.42915.430.310.80.227
73680.30.42915.43000.659
83680.30.42915.430.27.20.351
93680.30.42915.430.310.80.198
103630.250.33312000.800
113630.250.333120.27.20.320
123630.250.333120.310.80.080
133650.250.33312000.706
143650.250.333120.27.20.282
153650.250.333120.310.80.071
163680.250.33312000.600
173680.250.333120.27.20.240
183680.250.333120.310.80.060
193630.20.259000.750
203630.20.2590.27.20.150
213630.20.2590.259.00
223650.20.259000.643
233650.20.2590.27.20.129
243650.20.2590.259.00
253680.20.259000.529
263680.20.2590.27.20.106
273680.20.2590.259.00
2812050.20.2530000.857
2912050.20.25300.1120.514
3012050.20.25300.2240.171
3112050.20.25300.25300
32120100.20.2530000.75
33120100.20.25300.1120.45
34120100.20.25300.2240.15
35120100.20.25300.25300

References

  1. Bieniawski, Z.T. Engineering classification of jointed rock masses. Trans. South. Afr. Inst. Civ. Eng. 1973, 15, 335–344. Available online: https://journals.co.za/doi/pdf/10.10520/AJA10212019_17397 (accessed on 12 May 2024).
  2. Hoek, E.; Martin, C.D. Fracture initiation and propagation in intact rock—A review. J. Rock. Mech. Geotech. Eng. 2014, 6, 287–300. [Google Scholar] [CrossRef]
  3. Kaiser, P.K.; Moss, A. Deformation-based support design for highly stressed ground with a focus on rockburst damage mitigation. J. Rock. Mech. Geotech. Eng. 2022, 14, 50–66. [Google Scholar] [CrossRef]
  4. Meng, Q.; Chen, Y.; Zhang, M.; Han, L.; Pu, H.; Liu, J. On the Kaiser Effect of Rock under Cyclic Loading and Unloading Conditions: Insights from Acoustic Emission Monitoring. Energies 2019, 12, 3255. [Google Scholar] [CrossRef]
  5. Niu, G.; He, X.; Xu, H.; Dai, S. Development of Rock Classification Systems: A Comprehensive Review with Emphasis on Artificial Intelligence Techniques. Eng 2024, 5, 217–245. [Google Scholar] [CrossRef]
  6. Guo, W.-Y.; YU, F.-H.; Qiu, Y.; Zhao, T.-B.; Tan, Y.-L. Experimental Investigation of the Mechanical Behavior of Layer-Crack Specimens Under Cyclic Uniaxial Compression. Symmetry 2019, 11, 465. [Google Scholar] [CrossRef]
  7. Shekov, V. (Institute of Geology, Karelian Research Centre, Russian Academy of Sciences, Petrozavodsk, Russia). Compression testing of rock specimens. Personal communication, 2024.
  8. Xie, W.Q.; Liu, X.L.; Zhang, X.P.; Liu, Q.S.; Wang, E.Z. A review of test methods for uniaxial compressive strength of rocks: Theory, apparatus and data processing. J. Rock. Mech. Geotech. Eng. 2024, in press. [Google Scholar] [CrossRef]
  9. Chen, S.; Tang, J.; Pan, Y. Constitutive Model of Uniaxial Compression for Rock (Coal) and Bursting Liability Index Based on the Structure Ensemble Dynamics Theory. Rock. Mech. Rock. Eng. 2024, 57, 10831–10848. [Google Scholar] [CrossRef]
  10. Yan, L.; Chang, J.; Manda, E.; Li, H.L.; Wang, Q.; Jing, Y.F. Rock crack initiation triggered by energy digestion. Sci. Rep. 2024, 14, 15222. [Google Scholar] [CrossRef]
  11. Yuan, S.; Du, B.; Shen, M. Experimental and numerical investigation of the mechanical properties and energy evolution of sandstone-concrete combined body. Sci. Rep. 2024, 14, 5214. [Google Scholar] [CrossRef]
  12. Cheng, Y.; Zhang, L. Study on Rock Failure Criterion Based on Elastic Strain Energy Density. Appl. Sci. 2023, 13, 8435. [Google Scholar] [CrossRef]
  13. Stojković, N.; Perić, D.; Stojić, D.; Marković, N. New stress–strain model for concrete at high temperatures. Teh. Vjesn. 2017, 24, 863–868. [Google Scholar] [CrossRef]
  14. Shi, M.; Xu, G.; Zhao, J.; Xu, L.; Yuan, J.; Chen, M. The study on uniaxial compression constitutive model of shape memory alloy fiber-reinforced concrete. J. Build. Eng. 2024, 89, 109317. [Google Scholar] [CrossRef]
  15. Shekov, V.; Kolesnikov, G. Differential Energy Criterion for Brittle Fracture: Conceptualization and Application to the Analysis of Axial and Lateral Deformation in Uniaxial Compression of Rocks. Materials 2023, 16, 4875. [Google Scholar] [CrossRef] [PubMed]
  16. Arora, J.S.; Elwakeil, O.A.; Chahande, A.I.; Hsieh, C.C. Global optimization methods for engineering applications: A review. Struct. Multidiscip. Optim. 1995, 9, 137–159. [Google Scholar] [CrossRef]
  17. Yankelevsky, D.Z. The uniaxial compressive strength of concrete: Revisited. Mater. Struct. 2024, 57, 144. [Google Scholar] [CrossRef]
  18. Fakhimi, A.; Hemami, B. Axial splitting of rocks under uniaxial compression. Int. J. Rock. Mech. Min. Sci. 2015, 79, 124–134. [Google Scholar] [CrossRef]
  19. Liu, K.; Jin, S.; Rui, Y.; Huang, J.; Zhou, Z. Effect of Lithology on Mechanical and Damage Behaviors of Concrete in Concrete-Rock Combined Specimen. Mathematics 2022, 10, 727. [Google Scholar] [CrossRef]
  20. Cheng, Y.; Wong, L.N.Y. Microscopic characterization of tensile and shear fracturing in progressive failure in marble. J. Geophys. Res. Solid. Earth 2018, 123, 204–225. [Google Scholar] [CrossRef]
  21. Morgan, S.P.; Johnson, C.A.; Einstein, H.H. Cracking processes in Barre granite: Fracture process zones and crack coalescence. Int. J. Fract. 2013, 180, 177–204. [Google Scholar] [CrossRef]
  22. Goldsmith, W.; Sackman, J.L.; Ewerts, C. Static and dynamic fracture strength of Barre granite. Int. J. Rock. Mech. Min. Sci. Geomech. Abstr. 1976, 13, 303–309. [Google Scholar] [CrossRef]
  23. Jin, Y.; He, C.; Yao, C.; Sun, Z.; Wang, J.; Zhang, X.; Yang, J.; Jiang, Q.; Zhou, C. Experimental and numerical simulation study on the evolution of mechanical properties of granite after thermal treatment. Comput. Geotech. 2024, 172, 106464. [Google Scholar] [CrossRef]
  24. Olovyanny, A.G. Lateral earth pressure in rock mass. J. Min. Inst. 2010, 185, 141–147. (In Russian). Available online: https://cyberleninka.ru/article/n/bokovoy-raspor-v-massive-gornyh-porod (accessed on 12 May 2024).
  25. Khomenko, O.; Kononenko, M.; Bilegsaikhan, J. Classification of theories about rock pressure. Solid State Phenom. 2018, 277, 157–167. [Google Scholar] [CrossRef]
  26. Wang, H.; Dyskin, A.; Pasternak, E.; Dight, P. Possible mechanism of spallation in rock samples under uniaxial compression. Eng. Fract. Mech. 2022, 269, 108577. [Google Scholar] [CrossRef]
  27. Fadhil, A.I.; Al-Adly, A.I.F.; Fattah, M.Y. Estimation of uniaxial compressive and indirect tensile strengths of intact rock from Schmidt hammer rebound number. J. Mech. Behav. Mater. 2023, 32, 20220255. [Google Scholar] [CrossRef]
  28. Fener, M.; Kahraman, S.; Bilgil, A.; Gunaydin, O. A comparative evaluation of indirect methods to estimate the compressive strength of rocks. Rock. Mech. Rock. Eng. 2005, 38, 329–343. [Google Scholar] [CrossRef]
  29. de Alencar, A.T.S.; Muñiz-Menéndez, M.; Galindo, R.A. Ring Test: A New Interpretation to Estimate Tensile Strength of Rock. Rock. Mech. Rock. Eng. 2024, 57, 8911–8921. [Google Scholar] [CrossRef]
  30. Qiao, Q.; Nemcik, J.; Porter, I.; Baafi, E. Laboratory investigation of support mechanism of thin spray-on liner for pillar reinforcement. Géotechnique Lett. 2014, 4, 317–321. [Google Scholar] [CrossRef]
  31. Esterhuyse, J.C.; Malan, D.F. Simulating pillar reinforcement using a displacement discontinuity boundary element code. J. South. Afr. Inst. Min. Metall. 2023, 123, 211–222. [Google Scholar] [CrossRef]
  32. Le Bron, K.B.; Gardner, L.J.; van Zyl, J. Beyond the empirical pillar design method: The strain criterion and the pillar load inversion concepts. J. South. Afr. Inst. Min. Metall. 2024, 124, 293–302. [Google Scholar] [CrossRef]
  33. Zheng, Q.; Qian, J.; Zhang, H.; Chen, Y.; Zhang, S. Velocity tomography of cross-sectional damage evolution along rock longitudinal direction under uniaxial loading. Tunn. Undergr. Space Technol. 2024, 143, 105503. [Google Scholar] [CrossRef]
  34. Tian, J.; Kang, H.; Zhang, D.; Fan, G.; Zheng, X. Study of the Constraint Pillar Test and the Application in Gob-Side Entry Retaining. Appl. Sci. 2024, 14, 8673. [Google Scholar] [CrossRef]
  35. Golewski, G.L. The Phenomenon of Cracking in Cement Concretes and Reinforced Concrete Structures: The Mechanism of Cracks Formation, Causes of Their Initiation, Types and Places of Occurrence, and Methods of Detection—A Review. Buildings 2023, 13, 765. [Google Scholar] [CrossRef]
  36. Caliendo, C.; Genovese, G.; Russo, I. A Simultaneous Analysis of the User Safety and Resilience of a Twin-Tube Road Tunnel. Appl. Sci. 2022, 12, 3357. [Google Scholar] [CrossRef]
  37. Guo, W.; Ma, X.; Wen, Y.; Cao, X. Stress Evolution and Rock Burst Prevention in Triangle Coal Pillars under the Influence of Penetrating Faults: A Case Study. Appl. Sci. 2024, 14, 8585. [Google Scholar] [CrossRef]
  38. Beßling, M.; Groh, M.; Koch, V.; Auras, M.; Orlowsky, J.; Middendorf, B. Repair and Protection of Existing Steel-Reinforced Concrete Structures with High-Strength, Textile-Reinforced Mortars. Buildings 2022, 12, 1615. [Google Scholar] [CrossRef]
  39. Carpinteri, A.l.; Lacidogna, G.; Pugno, N. Structural damage diagnosis and life-time assessment by acoustic emission monitoring. Eng. Fract. Mech. 2007, 74, 273–289. [Google Scholar] [CrossRef]
  40. Niccolini, G.; Potirakis, S.M.; Lacidogna, G.; Borla, O. Criticality Hidden in Acoustic Emissions and in Changing Electrical Resistance during Fracture of Rocks and Cement-Based Materials. Materials 2020, 13, 5608. [Google Scholar] [CrossRef]
  41. Jing, G.; Marin Montanari, P.; Lacidogna, G. Study of Time–Frequency Domain of Acoustic Emission Precursors in Rock Failure During Uniaxial Compression. Signals 2024, 5, 105–117. [Google Scholar] [CrossRef]
  42. Huang, J.; Wei, X.; Zheng, Z.; Su, X.; Zuo, J. Linear fractal evolution characteristics of rock crack distributions during loading process. Sci. Rep. 2024, 14, 18303. [Google Scholar] [CrossRef] [PubMed]
  43. Feng, G.L.; Ma, Q.; Lacidogna, G.; Pan, P.Z.; Wang, Z.F.; Su, G.S. Experimental study on the failure characteristic and mechanism of granite time-delayed rockburst under true triaxial condition. Geomech. Geophys. Geo-Energy Geo-Resour. 2023, 9, 164. [Google Scholar] [CrossRef]
  44. Luo, L.; Rui, Y.; Qiu, J.; Li, C.; Liu, X.; Chen, C. Exploring Dynamic Spalling Behavior in Rock–Shotcrete Combinations: A Theoretical and Numerical Investigation. Mathematics 2024, 12, 1346. [Google Scholar] [CrossRef]
  45. Chen, J.; Tong, J.; Rui, Y.; Cui, Z.; Pu, Y.; Du, J.; Derek, B.A. Step-path failure mechanism and stability analysis of water-bearing rock slopes based on particle flow simulation. Theor. Appl. Fract. Mech. 2024, 131, 104370. [Google Scholar] [CrossRef]
  46. Zhang, Y.; Sun, Y.; Zhong, W.; Fan, L. A Real-Time Study on the Cracking Characteristics of Polyvinyl Alcohol Fiber-Reinforced Geopolymer Composites Under Splitting Tensile Load Based on High-Speed Digital Image Correlations. Buildings 2024, 14, 1986. [Google Scholar] [CrossRef]
  47. Guo, W.B.; Wang, B.B.; Tan, Y.; Zhao, G.B.; Bai, E.H.; Guo, M.J.; Wen, P.; Ma, Z.B.; Yang, W.Q.; Wu, D.T. Experimental study on failure characteristics and rheological properties of pillar-like rock samples with different shapes. Sci. Rep. 2023, 13, 22393. [Google Scholar] [CrossRef]
  48. Nasyrov, R.S.; Tretyak, A.V.; Neugomonov, S.S.; Mazhitov, A.M. Developing a technology of driving and supporting mine workings in tectonically weakened rock zones. Gorn. Promyshlennost. 2024, 3, 126–130. (In Russian) [Google Scholar] [CrossRef]
  49. Ahrami, O.; Javaheri Koupaei, H.; Ahangari, K. Determination of deformation modulus and characterization of anisotropic behavior of blocky rock masses. Min. Sci. Technol. 2024, 9, 116–133. [Google Scholar] [CrossRef]
  50. Meng, F.; Wong, L.N.Y.; Zhou, H. Rock Brittleness Indices and Their Applications to Different Fields of Rock Engineering: A Review. J. Rock. Mech. Geotech. Eng. 2021, 13, 221–247. [Google Scholar] [CrossRef]
Figure 1. Gneiss granite specimens, testing machine, and load–displacement plot (explanations in text).
Applsci 14 11552 g001
Figure 2. Dependence of axial strain on stress for a cylindrical specimen of garnet amphibolite. D = H = 50   m m ; σ p e a k = 75   M P a .
Applsci 14 11552 g002
Figure 3. Patterns of specimen’s destruction depending on the friction on the surfaces of force con-tact: high friction (left); low friction (right). Garnet amphibolite.
Applsci 14 11552 g003
Figure 4. Longitudinal tensile cracks on the lateral surface and spalling of fragments during compression of cylindrical specimens: (a) sandstone (modified after [18]); (b) garnet amphibolite. Stages of failure of the same specimen under uniaxial compression. D = H = 50 mm. Circumferential tensile stresses in the surface layer led to the formation of fragments 1, 2, and 3. Shear stresses caused the formation of fragments 4 and 5.
Applsci 14 11552 g004
Figure 5. Stresses in the surface layer.
Applsci 14 11552 g005
Figure 6. The failure of a gabbro-dolerite specimen from the Khauki-5 deposit, Republic of Karelia, Russian Federation. The shear crack runs through a zone with a discontinuous failure pattern, breaking the specimen in a cone-shaped way.
Applsci 14 11552 g006
Figure 7. Effect of Poisson’s ratio and circumferential σ t , p e a l and axial σ z stresses on the relative thickness of a cracked layer under uniaxial compression without lateral pressure.
Applsci 14 11552 g007
Figure 8. Dependence of the relative thickness of a layer with radial cracks on Poisson’s ratio and the ratio of circumferential to axial stresses.
Applsci 14 11552 g008
Figure 9. Changes in the relative thickness of the cracked layer (determined by Equation (10)) as a function of axial and circumferential stresses for three values of Poisson’s ratio (0.1, 0.3, and 0.5).
Applsci 14 11552 g009
Figure 10. Dependence of the relative layer thickness (Equation (10)) on the Poisson’s ratio and the ratio of circumferential and axial stresses for three scenarios of proportional lateral pressure ( σ c n f = s σ z ; s = 0 ;   0.05 ;   0.1 ). Values where t / R ~ 1 indicate a completely destroyed specimen, as exemplified in Figure 3.
Applsci 14 11552 g010
Figure 11. The damaged layer: (a) t R = 0.7 1.0 = 0.7 ; (b) t R = 0.60 1.37 = 0.44 (modified after [33]).
Applsci 14 11552 g011
Figure 12. Changes in relative thickness of the fractured layer as a function of confining pressure and Poisson’s ratio (for s n ) .
Applsci 14 11552 g012
Disclaimer/Publisher’s Note: The statements, opinions and data contained in all publications are solely those of the individual author(s) and contributor(s) and not of MDPI and/or the editor(s). MDPI and/or the editor(s) disclaim responsibility for any injury to people or property resulting from any ideas, methods, instructions or products referred to in the content.

