Article

Stability Analysis of the Landfill Slope with an Engineered Berm Under Composite Failure Mode

1
School of Automotive and Transportation Engineering, Hefei University of Technology, Hefei 230009, China
2
Shanghai Shen Yuan Geotechnical Engineering Co., Ltd., Shanghai 200031, China
*
Author to whom correspondence should be addressed.
Appl. Sci. 2024, 14(24), 11515; https://doi.org/10.3390/app142411515
Submission received: 4 October 2024 / Revised: 26 November 2024 / Accepted: 6 December 2024 / Published: 10 December 2024
(This article belongs to the Special Issue Advanced Technologies in Landfills)

Abstract

:
In order to increase the capacity of landfills while ensuring a certain degree of stability of such structures, an engineered berm is typically constructed at the front slope of the landfill. For this type of landfill slopes, this paper primarily focuses on the construction and verification of stability assessment models for such structures. Initially, the calculation models of the safety factor were established, considering over and under berm failure modes separately. Subsequently, through error analysis, it was determined that it is feasible to evaluate the stability of this type of landfills by substituting the true safety factor with the average safety factor obtained from the calculation model. The analysis for parameters and slip surfaces was then conducted to investigate the impact of parameters associated with the engineered berm on the landfill slope stability. Finally, a visual comparison and brief discussion were conducted on the average safety factors under translational and composite failure modes. Thus, the critical failure modes under specific working conditions can be reasonably ascertained, which holds significant practical implications for enhancing the reliability of stability assessment of such landfill slopes.

1. Introduction

The engineered berm is frequently built at the front slope of landfills, which can not only increase the storage capacity of the landfill but also improve the stability of the landfill slope [1,2,3]. Theoretically, it can be said that maintaining the stable operation of this type of landfill inevitably requires reliable design of berms. The specific design of a berm needs to consider which failure mode this type of landfill slopes may resist. From a practical perspective, the failure of landfill slopes is mainly dominated by translational failure along the liner system [4]. Considering the existence of the berm, however, the failure of landfill slopes can be divided into two types, namely over-berm and under-berm failure modes [5,6]. Furthermore, the limit equilibrium method is commonly used to establish a stability assessment model for landfill slopes based on specific failure modes [7,8,9], and it is also used to analyze the structural stability in tunnels and deep excavations [10]. Meanwhile, due to the existence of the berm, the evaluation model is strongly correlated with the geometric shape of this structure. From the perspective of the cross-sectional shape of berms, they can be thus divided into two categories, namely triangular and trapezoidal berms [11].
Regardless of the geometric shape of the berm constructed in the landfill, the three-wedge method is often used to analyze the stability of such landfill slopes. This method was developed from the two-wedge method proposed by Qian et al. [12,13] and further extended to consider the effects of leachate level and seismic load on the slope stability [14,15]. Feng et al. [16,17,18] divided the sliding body with a triangular berm into three parts, i.e., active, passive and block wedges, and then proposed the three-wedge method based on the principle of limit equilibrium when that type of landfill slopes occurred the under-berm failure. Considering the effect of earthquakes on structural stability, Feng and Gao [19] used the pseudo-static method to introduce horizontal seismic loads to construct an assessment model for seismic stability of landfill slopes, and further Sun and Ruan [11] extended the above-mentioned model by increasing the effect of vertical seismic loads. For the failure mode of the over berm, Gao et al. [20] used the three-wedge method to build up a stability analysis model for this type of landfill slopes. When conducting seismic design of this structure in earthquake prone areas, Chen et al. [21] extended the above analysis model based on the Newmark method to carry out engineering design considering permanent seismic displacement.
When designing the landfill slope with an engineering berm, considering only the over-berm or under-berm failure mode may lead to unreliable design results. Therefore, it is necessary to analyze the stability of the landfill slope simultaneously under both failure modes. For the landfill slope with a trapezoidal berm, Qian and Koerner [6], respectively, established safety factor calculation models to resist the two types of failure modes mentioned above and conducted slope stability analysis using the three-wedge method. Subsequently, Choudhury and Savoikar [22] developed these calculation models by introducing seismic loads using the pseudo-static method, and furthermore, considering the dynamic characteristics of seismic loads, Ruan et al. [23,24] investigated the pseudo-dynamic stability of this type of landfill slopes. Apart from seismic loads, blasting vibration loads may also affect the stability of landfill slopes for dynamic loads due to the rapid development of transportation infrastructure construction. Considering the above practical situation, Chen et al. [25] studied the influence of this type of loads on the stability of the landfill slope with a trapezoidal berm. Currently, reinforced soil retaining walls are used as berms, and the cross-sectional shape of the structure is generally rectangular. Under these conditions, the stability analysis of landfill slopes usually only considers the under-berm failure mode. Considering the effect of leachate pressure, Mahapatra et al. [26] carried out reliability design for this type of berms.
The above studies are all based on the scenario where the instability of the landfill is a translational failure mode. Although this failure mode is commonly seen in the on-site investigation results of instability in large landfills [4], there is another failure mode, the composite failure mode, that may either lead to translational failure or occur directly, which is often overlooked [27]. In this failure mode, the critical slip surface consists of two parts, one is a log-spiral slip surface in the waste mass and the other is a translational slip surface along the liner system. This may be due to the different creep characteristics of the waste mass and liners, just as accurately simulating the creep process of rocks may require two contact models [28]. For this failure mode, Thiel [29] and Fowmes et al. [30] mentioned it in their research, but did not provide an analytical model. Ruan et al. [31] introduced the log-spiral mechanism into the internal failure of landfills, and then constructed a safety factor calculation model to evaluate the static stability of the landfill cell against the composite failure mode based on the limit equilibrium principle. Additionally, Ruan et al. [32] expanded the stability evaluation model by considering the effect of seismic loads.
Based on the above analysis and engineering practice requirements, it can be seen that when evaluating the stability of the landfill slope with an engineering berm, in addition to considering the stability performance of the structure against translational failure modes, it is also necessary to analyze the safety redundancy of the structure against composite failure modes. In the paper, first, the implicit function equations of the safety factor were derived under the failure modes of over berm and under berm, respectively. Second, through error analysis, the feasibility of using the average safety factor instead of the true safety factor to evaluate the stability of the landfill slope was verified. Then the influence of the geometric parameters of the engineered berm and the shear strength index at the interface of liners over berm and under berm on the stability of the landfill slope was analyzed. Finally, a comparative analysis was conducted on the stability of the landfill slope, including different failure modes such as composite and translational failure modes.

2. Computational Model

2.1. Basic Assumptions

When analyzing static stability of the landfill slope with an engineered berm against the composite failure mode, the failure body in the limit equilibrium state can be divided into three parts: the block wedge (region L0LL1, as in Figure 1; or region L0LL1L2L3, as in Figure 2), the passive wedge (region OKLL0, as in Figure 1a and Figure 2a; or region OKJLL0, as in Figure 1b and Figure 2b), and the log-spiral failure body (region OGJK, as in Figure 1a and Figure 2a; or region OGK, as in Figure 1b and Figure 2b). The limit equilibrium analysis of the block wedge, log-spiral failure body, and passive wedge is carried out sequentially, and equilibrium equations are established separately to obtain the calculation formulas for normal force from passive wedge acting on block wedge (i.e., EHPB) and normal force from passive wedge acting on log-spiral failure body (i.e., EHPL), as well as the expression for the relationship between normal forces from block wedge and log-spiral failure body acting on passive wedge (i.e., EHBP and EHLP). Based on the relationship between EHPB = EHBP and EHPL = EHLP, the implicit function equation for evaluating the safety factor of the landfill with an engineered berm against the composite failure mode is constructed.
Considering the geometric parameters of the landfill slope studied, the limit equilibrium analysis for sliding bodies can be divided into two situations, namely (a): B < Hcotα (as in Figure 1a and Figure 2a) and (b): B  Hcotα (as in Figure 1b and Figure 2b). In Figure 1 and Figure 2, O(0, 0) is the origin of Cartesian coordinates; (xc, yc) is the pole of polar coordinates in Cartesian coordinates; WB, WL and WP are the weights of block wedge, log-spiral failure body, and passive wedge, respectively; NP and FP are the normal and frictional forces, respectively, acting on the bottom of passive wedge; NB and FB are the normal and frictional forces, respectively, acting on the bottom of block wedge; EHLP and EVLP are the normal and frictional forces, respectively, acting on the passive wedge from log-spiral failure body; EHPL and EVPL are the normal and frictional forces, respectively, acting on the log-spiral failure body from passive wedge; EHPB and EVPB are the normal and frictional forces, respectively, acting on the block wedge from passive wedge; EHBP and EVBP are the normal and frictional forces, respectively, acting on the passive wedge from block wedge; H is the height of back slope; HB is the height of engineered berm; B is the top width of waste mass; DB is the top width of the engineered berm; ω is the angle of the front slope measured from the horizontal; α is the angle of the back slope measured from the horizontal; θ is the angle of the bottom of the passive wedge measured from the horizontal; ξ is the angle of the back slope of the engineered berm measured from the horizontal; η is the angle of the front slope of the engineered berm measured from the horizontal; β1 and β2 are the angles of point O and point G in the polar coordinates, respectively.
To successfully build up an analytical model for analyzing static stability of the landfill with an engineered berm against composite failure mode, it is necessary to make some reasonable assumptions. The specific assumptions are as follows: (1) the waste mass belongs to homogeneous Coulomb material, and its failure and the failure at the liner interface meet the Mohr–Coulomb strength criterion; (2) the potential slip surface runs along a log-spiral inside the landfill and enters the bottom lining system of the landfill after passing through the toe of the back slope (i.e., point O); (3) the potential slip surface appears within the range of JD at the top of the landfill; (4) the line of action of EHPL or EHLP is at one-third of the height (i.e., OK) from the bottom of the interface between passive wedge and log-spiral failure body; (5) the line of action of EHBP or EHPB is at one-third of the height (i.e., L0L) from the bottom of the interface between block wedge and passive wedge; (6) the safety factor on the potential slip surface is equal everywhere.

2.2. Equations of Equilibrium When Over-Berm Failure Occurs

The frictional forces acting on the bottom of block and passive wedges, respectively, in Figure 1 and Figure 2 are as follows:
F B = C B / F S + N B tan δ B / F S
F P = C P / F S + N P tan δ P / F S
where FS is the safety factor on potential slip surface; δP is the interface friction angle of liner components beneath passive wedge; CP is the apparent cohesive force between liner components beneath passive wedge, i.e., cP × OL0, cP is the apparent cohesion between liner components beneath passive wedge; δB is the interface friction angle of liner components beneath block wedge; when over-berm failure occurs in Figure 1, CB is the apparent cohesive force between liner components beneath the block wedge, i.e., cB × L0L1; when under-berm failure occurs in Figure 2, CB is equal to cB × L0L3; cB is the apparent cohesion between liner components beneath the block wedge.
The frictional forces acting on the side of the block wedge and the log-spiral failure body, respectively, next to the passive wedge, EVPB and EVPL, and the side of the passive wedge next to the log-spiral failure body and the block wedge, respectively, EVLP and EVBP, in Figure 1 and Figure 2 are as follows:
E V P B = C P B / F S V + E H P B tan ϕ S W / F S V
E V P L = C P L / F S V + E H P L tan ϕ S W / F S V
E V L P = C P L / F S V + E H L P tan ϕ S W / F S V
E V B P = C P B / F S V + E H B P tan ϕ S W / F S V
where FSV is the safety factor at the interface between two adjacent wedges; ϕSW is the internal friction angle of waste mass; CPB is the apparent cohesive force at the interface between passive and block wedges, i.e., CPB = cSW × LL0, and cSW is the apparent cohesion of waste mass; CPL is the apparent cohesive force at the interface between passive wedge and log-spiral failure body, i.e., CPL = cSW × OK.

2.2.1. Equations of Equilibrium About Block Wedge

In accordance with the equilibrium condition of the vertical force acting on the block wedge, i.e., F Y = 0 , as shown in Figure 3, it can be determined that
N B cos ξ = W B + F B sin ξ + E VPB
Substituting Equations (1) and (3) into Equation (7) offers
N B cos ξ sin ξ tan δ B / F S C B sin ξ / F S = W B + C P B / F S V + E HPB tan ϕ SW / F S V
According to the equilibrium condition of the horizontal force acting on the block wedge, i.e., F X = 0 , as shown in Figure 3, the equilibrium equation is as follows:
N B sin ξ + F B cos ξ = E HPB
Substituting Equation (1) into Equation (9) and rearranging for NB yields
N B = E HPB C B cos ξ / F S sin ξ + cos ξ tan δ B / F S
Substituting Equation (10) into Equation (8) and rearranging for EHPB produces
E HPB = W B   +   C P B / F S V sin ξ + cos ξ tan δ B / F S + C B / F S cos ξ sin ξ tan δ B / F S sin ξ + cos ξ tan δ B / F S tan ϕ SW / F S V
Based on the geometrical characteristics of the engineering berm, the following formulas for CB, CPB and WB can be derived:
C B = c B H B / sin ξ
C PB = c SW H B 1 + cos ξ tan ω
W B = 0.5 γ SW H B 2 1 + cot ξ tan ω cot ξ

2.2.2. Equations of Equilibrium About Log-Spiral Failure Body

We perform limit equilibrium analysis on the log-spiral failure body under the over-berm failure mode and establish a moment equilibrium equation. The schematic diagrams of limit equilibrium analysis for log-spiral failure body are shown in Figure 4. Moreover, the mathematical equation of the log-spiral slip surface in polar coordinates and the definition of related parameters can be found in the paper of Ruan et al. [31]. The moment equilibrium equation about the log-spiral failure body for the poles (xc, yc) can therefore be written as follows:
M W L = M E HPL + M E VPL + M C L
where M W L is the moment stemmed from weight of the log-spiral failure body, W L ; M E HPL is the moment generated by normal force from the passive wedge acting on the log-spiral failure body, E HPL ; M E VPL is the moment produced by frictional force acting on the side of the log-spiral failure body next to the passive wedge, E VPL ; M C L is the moment resulted from apparent cohesive force acting on the log-spiral slip surface, C L .
In Equation (15), M W L represents the driving moment responsible for the occurrence of failure, while M E HPL , M E VPL , and M C L denote the resisting moments counteracting the trend of instability. M W L can be calculated by modifying the result of Leshchinsky and San [33] and combining the two different scenarios in Figure 4 to obtain the calculation formula of M W L , which can be written as Equations (18) and (20), respectively. M E VPL and M E HPL can be derived directly from the geometric relationships in Figure 4, namely Equations (16), (19), and (21). M C L can be obtained by reorganizing the derivation result of Ruan et al. [34], as shown in Equation (17). Here are the specific forms of these equations:
M E VPL = E VPL A e ψ β 1 sin β 1
M C L = c SW F S β 1 β 2 A e ψ β 2 d β
There are two calculation formulas for M W L and M E HPL , which are shown as follows:
(1) when B < Hcotα
M W L = γ SW β 1 β 2 A e ψ β cos β A e ψ β 2 cos β 2 A e ψ β sin β A e ψ β cos β ψ sin β d β 0.5 γ SW H cot α B 2 tan ω A e ψ β 1 sin β 1 + H cot α B / 3
M E HPL = E HPL A e ψ β 1 cos β 1 H H cot α tan ω + B tan ω / 3
(2) when B Hcotα
M W L = γ SW β 1 β 2 A e ψ β cos β A e ψ β 2 cos β 2 A e ψ β sin β A e ψ β cos β ψ sin β d β
M E HPL = E HPL A e ψ β 1 cos β 1 H / 3
Substituting Equation (4) into Equation (16) and rearranging it, we can obtain
M E VPL = C PL A e ψ β 1 sin β 1 / F S V + E HPL tan ϕ SW A e ψ β 1 sin β 1 / F S V
When B < Hcotα, substituting Equations (17)–(19) and (22) into Equation (15) and rearranging it, the calculation formula for EHPL can be attained as follows:
E HPL = γ SW β 1 β 2 A e ψ β cos β A e ψ β 2 cos β 2 A e ψ β sin β A e ψ β cos β ψ sin β d β 0.5 γ SW H cot α B 2 tan ω × A e ψ β 1 sin β 1 + H cot α B / 3 c SW F S β 1 β 2 A e ψ β 2 d β C PL F S V A e ψ β 1 sin β 1 / A e ψ β 1 cos β 1 H H cot α tan ω + B tan ω / 3 + A e ψ β 1 sin β 1 tan ϕ SW / F S V
When B Hcotα, substituting Equations (17) and (20)–(22) into Equation (15) and rearranging it, the calculation formula for EHPL can be obtained as follows:
E HPL = γ SW β 1 β 2 A e ψ β cos β A e ψ β 2 cos β 2 A e ψ β sin β A e ψ β cos β ψ sin β d β c SW F S β 1 β 2 A e ψ β 2 d β C PL F S V A e ψ β 1 sin β 1 / A e ψ β 1 cos β 1 H / 3 + A e ψ β 1 sin β 1 tan ϕ SW / F S V

2.2.3. Equations of Equilibrium About Passive Wedge

In accordance with the equilibrium condition of the vertical force acting on the passive wedge, i.e., F Y = 0 , as shown in Figure 5, we can obtain
W P + E VLP = N P cos θ + F P sin θ + E VBP
Substituting Equation (2) into Equation (25) yields
N P cos θ + sin θ tan δ P / F S = W P + E HLP E HBP tan ϕ SW / F S V + C P L C P B / F S V C P sin θ / F S
In line with the equilibrium condition of the horizontal force acting on the passive, i.e., F X = 0 , as shown in Figure 5, the equilibrium equation is as follows:
E HBP + F P cos θ = E HLP + N P sin θ
Substituting Equation (2) into Equation (27) and rearranging it, we can derive
N P = E HBP E HLP + C P cos θ / F S sin θ cos θ tan δ P / F S
Substituting Equation (28) into Equation (26) produces
E HLP E HBP cos θ + sin θ tan δ P / F S + sin θ cos θ tan δ P / F S tan ϕ SW / F S V = W P + C P L C P B / F S V sin θ cos θ tan δ P / F S C P / F S
where the calculation formulas for CP, CPL, and WP can be derived based on the geometric parameters of the landfill. The specific formula is as follows:
C P = c P H H cot α B tan ω H B 1 + cot ξ tan ω / tan ω tan θ cos θ
However, CPL and WP have two types of calculation formulas due to the geometric characteristics of the landfill, which can be written as
(1) when B < Hcotα
C PL = c SW H H cot α B tan ω
W P = 0.5 γ SW H H cot α B tan ω 2 H B 1 + cot ξ tan ω 2 / tan ω tan θ
(2) when B Hcotα
C PL = c SW H
W P = 0.5 γ SW H H cot α B tan ω 2 H B 1 + cot ξ tan ω 2 / tan ω tan θ 0.5 γ SW B H cot α 2 tan ω

2.3. Equations of Equilibrium When Under-Berm Failure Occurs

Similar to the derivation process in Section 2.2.1, based on the equilibrium condition of the vertical force acting on the block wedge, i.e., F Y = 0 , as shown in Figure 6, we can obtain
N B = W B + E VPB
According to the equilibrium condition of the horizontal force acting on the block wedge, i.e., F X = 0 , as shown in Figure 6, the equilibrium equation is as follows:
F B = E HPB
Substituting Equation (1) into Equation (36) and rearranging it, we can obtain
N B = E HPB C B / F S tan δ B / F S
Substituting Equation (37) into Equation (35) and rearranging it, it can be determined that
E HPB = W B + C P B / F S V tan δ B / F S + C B / F S 1 tan δ B tan ϕ SW / F S V F S
In terms of the geometric characteristics of the engineered berm, it can be concluded that the calculation formula for CPB is the same as Equation (13). The calculation formulas for CB and WB are written as follows:
C B = c B D B + H B cot η + cot ξ
W B = 0.5 γ SW H B 2 1 + cot ξ tan ω cot ξ + 0.5 γ B H B 2 D B + H B cot η + cot ξ
Because the equilibrium conditions for the log-spiral failure body and passive wedge shown in Figure 7 and Figure 8 are identical to those in Figure 4 and Figure 5, the equations regarding EHPL and its relationship with EHBP are derived; however, these are exactly the same as Equations (23), (24), and (29).

2.4. Implicit Function Equations of the Safety Factor

The safety factor at the interface between two wedges, FSV, must not be less than one so as to meet the shear strength criteria for the waste soil, and it should not be less than the safety factor for entire structure of the landfill slope [35]. Therefore, the maximum and minimum safety factors can be determined by the following assumptions: (1) the implicit function equation of the maximum safety factor, FSmax, can be derived when assuming FSV = FSmax; however, if the calculated result of FSmax is less than one, it is necessary to assume FSV = 1 and recalculate FSmax; (2) the implicit function equation about the minimum safety factor, FSmin, can be obtained when assuming FSV = ∞.

2.4.1. Implicit Function Equations When Over-Berm Failure Occurs

(1) when B < Hcotα
By assuming FSV = ∞, substituting Equations (11) and (23) into Equation (29) and rearranging it, an implicit function equation of FSmin can be obtained as follows:
W B sin ξ + cos ξ tan δ B / F S min + C B / F S min / cos ξ sin ξ tan δ B / F S min γ SW β 1 β 2 A e ψ β cos β A e ψ β 2 cos β 2 × A e ψ β sin β A e ψ β cos β ψ sin β d β 0.5 γ SW H cot α B 2 tan ω A e ψ β 1 sin β 1 + H cot α B / 3 c SW F S min β 1 β 2 A e ψ β 2 d β / A e ψ β 1 cos β 1 H H cot α tan ω + B tan ω / 3 cos θ + sin θ tan δ P / F S min W P sin θ cos θ tan δ P / F S min + C P / F S min = 0
By assuming FSV = FS, substituting Equations (11) and (23) into Equation (29) and rearranging it, an implicit function equation of FSmax can be obtained as follows:
W B + C PB / F S max sin ξ + cos ξ tan δ B / F S max + C B / F S max / cos ξ sin ξ tan δ B / F S max sin ξ + cos ξ tan δ B / F S max × tan ϕ SW / F S max γ SW β 1 β 2 A e ψ β cos β A e ψ β 2 cos β 2 × A e ψ β sin β A e ψ β cos β ψ sin β d β 0.5 γ SW H cot α B 2 × tan ω A e ψ β 1 sin β 1 + H cot α B / 3 c SW F S max β 1 β 2 A e ψ β 2 d β C PL F S max A e ψ β 1 sin β 1 / A e ψ β 1 cos β 1 H H cot α tan ω + B tan ω / 3 + A e ψ β 1 sin β 1 tan ϕ SW / F S max cos θ + sin θ tan δ P / F S max + sin θ cos θ tan δ P / F S max tan ϕ SW / F S max W P + C PL C PB / F S max sin θ cos θ tan δ P / F S max + C P / F S max = 0
If FSmax calculated by solving Equation (42) is less than one, the implicit function equation for FSmax needs to be redefined. Assuming FSV = 1 and rearranging Equation (42), the implicit function equation about FSmax can be rewritten as follows:
W B + C PB sin ξ + cos ξ tan δ B / F S max + C B / F S max / cos ξ sin ξ tan δ B / F S max sin ξ + cos ξ tan δ B / F S max × tan ϕ SW γ SW β 1 β 2 A e ψ β cos β A e ψ β 2 cos β 2 × A e ψ β sin β A e ψ β cos β ψ sin β d β 0.5 γ SW H cot α B 2 × tan ω A e ψ β 1 sin β 1 + H cot α B / 3 c SW F S max β 1 β 2 A e ψ β 2 d β C PL A e ψ β 1 sin β 1 / A e ψ β 1 cos β 1 H H cot α × tan ω + B tan ω / 3 + A e ψ β 1 sin β 1 tan ϕ SW cos θ + sin θ tan δ P / F S max + sin θ cos θ tan δ P / F S max tan ϕ SW W P + C PL C PB / F S max sin θ cos θ tan δ P / F S max + C P / F S max = 0
(2) when B Hcotα
By assuming FSV = ∞ and substituting Equations (11) and (24) into Equation (29), an implicit function equation of FSmin can be obtained as follows:
W B sin ξ + cos ξ tan δ B / F S min + C B / F S min / cos ξ sin ξ tan δ B / F S min γ SW β 1 β 2 A e ψ β cos β A e ψ β 2 cos β 2 × A e ψ β sin β A e ψ β cos β ψ sin β d β c SW F S min β 1 β 2 A e ψ β 2 d β / A e ψ β 1 cos β 1 H / 3 cos θ + sin θ tan δ P / F S min W P sin θ cos θ tan δ P / F S min + C P / F S min = 0
By assuming FSV = FS and substituting Equations (11) and (24) into Equation (29) and rearranging it, an implicit function equation of FSmax can be obtained as follows:
W B + C PB / F S max sin ξ + cos ξ tan δ B / F S max + C B / F S max / cos ξ sin ξ tan δ B / F S max sin ξ + cos ξ tan δ B / F S max × tan ϕ SW / F S max γ SW β 1 β 2 A e ψ β cos β A e ψ β 2 cos β 2 × A e ψ β sin β A e ψ β cos β ψ sin β d β c SW F S max β 1 β 2 A e ψ β 2 d β C PL F S max A e ψ β 1 sin β 1 / A e ψ β 1 cos β 1 H / 3 + A e ψ β 1 sin β 1 tan ϕ SW / F S max cos θ + sin θ tan δ P / F S max + sin θ cos θ × tan δ P / F S max tan ϕ SW / F S max W P + C PL C PB / F S max sin θ cos θ tan δ P / F S max + C P / F S max = 0
If FSmax calculated by solving Equation (45) is less than one, the implicit function equation for FSmax needs to be rebuilt. Assuming FSV = 1 and rearranging Equation (45), the implicit function equation for FSmax can be improved as follows:
W B + C PB sin ξ + cos ξ tan δ B / F S max + C B / F S max / cos ξ sin ξ tan δ B / F S max sin ξ + cos ξ tan δ B / F S max × tan ϕ SW γ SW β 1 β 2 A e ψ β cos β A e ψ β 2 cos β 2 × A e ψ β sin β A e ψ β cos β ψ sin β d β c SW F S max β 1 β 2 A e ψ β 2 d β C PL A e ψ β 1 sin β 1 / A e ψ β 1 cos β 1 H / 3 + A e ψ β 1 sin β 1 tan ϕ SW cos θ + sin θ tan δ P / F S max + sin θ cos θ × tan δ P / F S max tan ϕ SW W P + C PL C PB / F S max sin θ cos θ tan δ P / F S max + C P / F S max = 0

2.4.2. Implicit Function Equations When Under-Berm Failure Occurs

(1) when B < Hcotα
By assuming FSV = ∞ and substituting Equations (38) and (23) into Equation (29), an implicit function equation of FSmin can be determined as follows:
W B tan δ B / F S min + C B / F S min γ SW β 1 β 2 A e ψ β cos β A e ψ β 2 cos β 2 A e ψ β sin β A e ψ β cos β ψ sin β d β 0.5 γ SW H cot α B 2 tan ω A e ψ β 1 sin β 1 + H cot α B / 3 c SW F S min β 1 β 2 A e ψ β 2 d β / A e ψ β 1 cos β 1 H H × cot α tan ω + B tan ω / 3 cos θ + sin θ tan δ P / F S min W P sin θ cos θ tan δ P / F S min + C P / F S min = 0
By assuming FSV = FS and substituting Equations (38) and (23) into Equation (29) and rearranging it, an implicit function equation of FSmax can be obtained as follows:
W B + C PB / F S max tan δ B / F S max + C B / F S max / 1 tan δ B tan ϕ SW / F S max 2 γ SW β 1 β 2 A e ψ β cos β A e ψ β 2 cos β 2 × A e ψ β sin β A e ψ β cos β ψ sin β d β 0.5 γ SW H cot α B 2 tan ω A e ψ β 1 sin β 1 + H cot α B / 3 c SW F S max × β 1 β 2 A e ψ β 2 d β C PL F S max A e ψ β 1 sin β 1 / A e ψ β 1 cos β 1 H H cot α tan ω + B tan ω / 3 + A e ψ β 1 sin β 1 tan ϕ SW / F S max × cos θ + sin θ tan δ P / F S max + sin θ cos θ tan δ P / F S max tan ϕ SW / F S max W P + C PL C PB / F S max × sin θ cos θ tan δ P / F S max + C P / F S max = 0
If FSmax fixed on by solving Equation (48) is less than one, the implicit function equation for FSmax needs to be redefined. Assuming FSV = 1 and rearranging Equation (48), the implicit function equation about FSmax can be obtained as follows:
W B + C PB / F S max tan δ B / F S max + C B / F S max / 1 tan δ B tan ϕ SW / F S max 2 γ SW β 1 β 2 A e ψ β cos β A e ψ β 2 cos β 2 × A e ψ β sin β A e ψ β cos β ψ sin β d β 0.5 γ SW H cot α B 2 tan ω A e ψ β 1 sin β 1 + H cot α B / 3 c SW F S max × β 1 β 2 A e ψ β 2 d β C PL A e ψ β 1 sin β 1 / A e ψ β 1 cos β 1 H H cot α tan ω + B tan ω / 3 + A e ψ β 1 sin β 1 tan ϕ SW × cos θ + sin θ tan δ P / F S max + sin θ cos θ tan δ P / F S max tan ϕ SW W P + C PL C PB sin θ cos θ tan δ P / F S max + C P / F S max = 0
(2) when B Hcotα
By assuming FSV = ∞ and substituting Equations (38) and (24) into Equation (29), an implicit function equation of FSmin can be obtained as follows:
W B tan δ B / F S min + C B / F S min γ SW β 1 β 2 A e ψ β cos β A e ψ β 2 cos β 2 A e ψ β sin β A e ψ β cos β ψ sin β d β c SW F S min β 1 β 2 A e ψ β 2 d β / A e ψ β 1 cos β 1 H / 3 cos θ + sin θ tan δ P / F S min W P sin θ cos θ tan δ P / F S min + C P / F S min = 0
By assuming FSV = FS and substituting Equations (38) and (24) into Equation (29) and rearranging it, an implicit function equation of FSmax can be determined as follows:
W B + C PB / F S max tan δ B / F S max + C B / F S max / 1 tan δ B tan ϕ SW / F S max 2 γ SW β 1 β 2 A e ψ β cos β A e ψ β 2 cos β 2 × A e ψ β sin β A e ψ β cos β ψ sin β d β c SW F S max β 1 β 2 A e ψ β 2 d β C PL F S max A e ψ β 1 sin β 1 / A e ψ β 1 cos β 1 H / 3 + A e ψ β 1 sin β 1 tan ϕ SW / F S max cos θ + sin θ tan δ P / F S max + sin θ cos θ tan δ P / F S max tan ϕ SW / F S max W P + C PL C PB / F S max sin θ cos θ tan δ P / F S max + C P / F S max = 0
If FSmax obtained from solving Equation (51) is less than one, the implicit function equation for FSmax needs to be recalculated. Assuming FSV = 1 and rearranging Equation (51), the implicit function equation about FSmax can be obtained as follows:
W B + C PB tan δ B / F S max + C B / F S max / 1 tan δ B tan ϕ SW / F S max γ SW β 1 β 2 A e ψ β cos β A e ψ β 2 cos β 2 × A e ψ β sin β A e ψ β cos β ψ sin β d β c SW F S max β 1 β 2 A e ψ β 2 d β C PL A e ψ β 1 sin β 1 / A e ψ β 1 cos β 1 H / 3 + A e ψ β 1 sin β 1 tan ϕ SW cos θ + sin θ tan δ P / F S max + sin θ cos θ tan δ P / F S max tan ϕ SW W P + C PL C PB sin θ cos θ tan δ P / F S max + C P / F S max = 0

2.5. Calculation of the Safety Factor

To ensure the minimum and maximum values of the safety factor calculated by the constructed model under the composite failure mode of the landfill slope with an engineered berm are reasonable, certain judgment conditions should be defined in programming to eliminate unreasonable values. Readers can refer to the paper by Ruan et al. [31].
A calculation program can be developed using MATLAB software (https://www.mathworks.com/products/matlab.html, accessed on 3 October 2024) to determine the FSmax and FSmin for two types of berm failure modes. The calculation flowchart can be designed with reference to the flowchart presented in the paper of Ruan et al. [31].

3. Results

3.1. Error Analysis

The average safety factor, FSave, is defined as (FSmax + FSmin)/2. Qian et al. [12] proved that the upper limit of the relative error between the true safety factor, FStrue, and FSave is less than the relative error, Δ, between FSave and FSmin, that is, Δ = (FSaveFSmin)/FSmin. And it is explained that when the relative error between FStrue and FSave is not greater than 5%, FSave can be used as a substitute for FStrue to assess the degree of stability of landfill slopes.
For the sake of a thorough analysis of the range variation of Δ regarding the engineered berm, the characteristic parameters related to that berm are investigated. The basic parameters are as follows: (1) Geometric parameters: H = 30 m, B = 40 m, HB = 7.5 m, DB = 3 m, ω = 14° (i.e., 4[H]:1[V]), α = 18.4° (i.e., 3[H]:1[V]), θ = 1.1° (i.e., the slope is 2%), ξ = 26.6° (i.e., 2[H]:1[V]), η = 63.4° (i.e., 0.5[H]:1[V]); (2) Mechanical parameters of waste mass and berm: γSW = 10.20 kN/m3, ϕSW = 30°, cSW = 3.0 kN/m2, γB = 18 kN/m3; (3) Shear strength between liner components beneath passive wedge: δP = 18°, cP = 11.5 kN/m2; (4) Shear strength between liner components beneath block wedge: (i) δB = 18°, cB = 11.5 kN/m2 under the over-berm failure mode and (ii) δB = 32°, cB = 8 kN/m2 under the under-berm failure mode.

3.1.1. Analysis of the Safety Factor When Over-Berm Failure Occurs

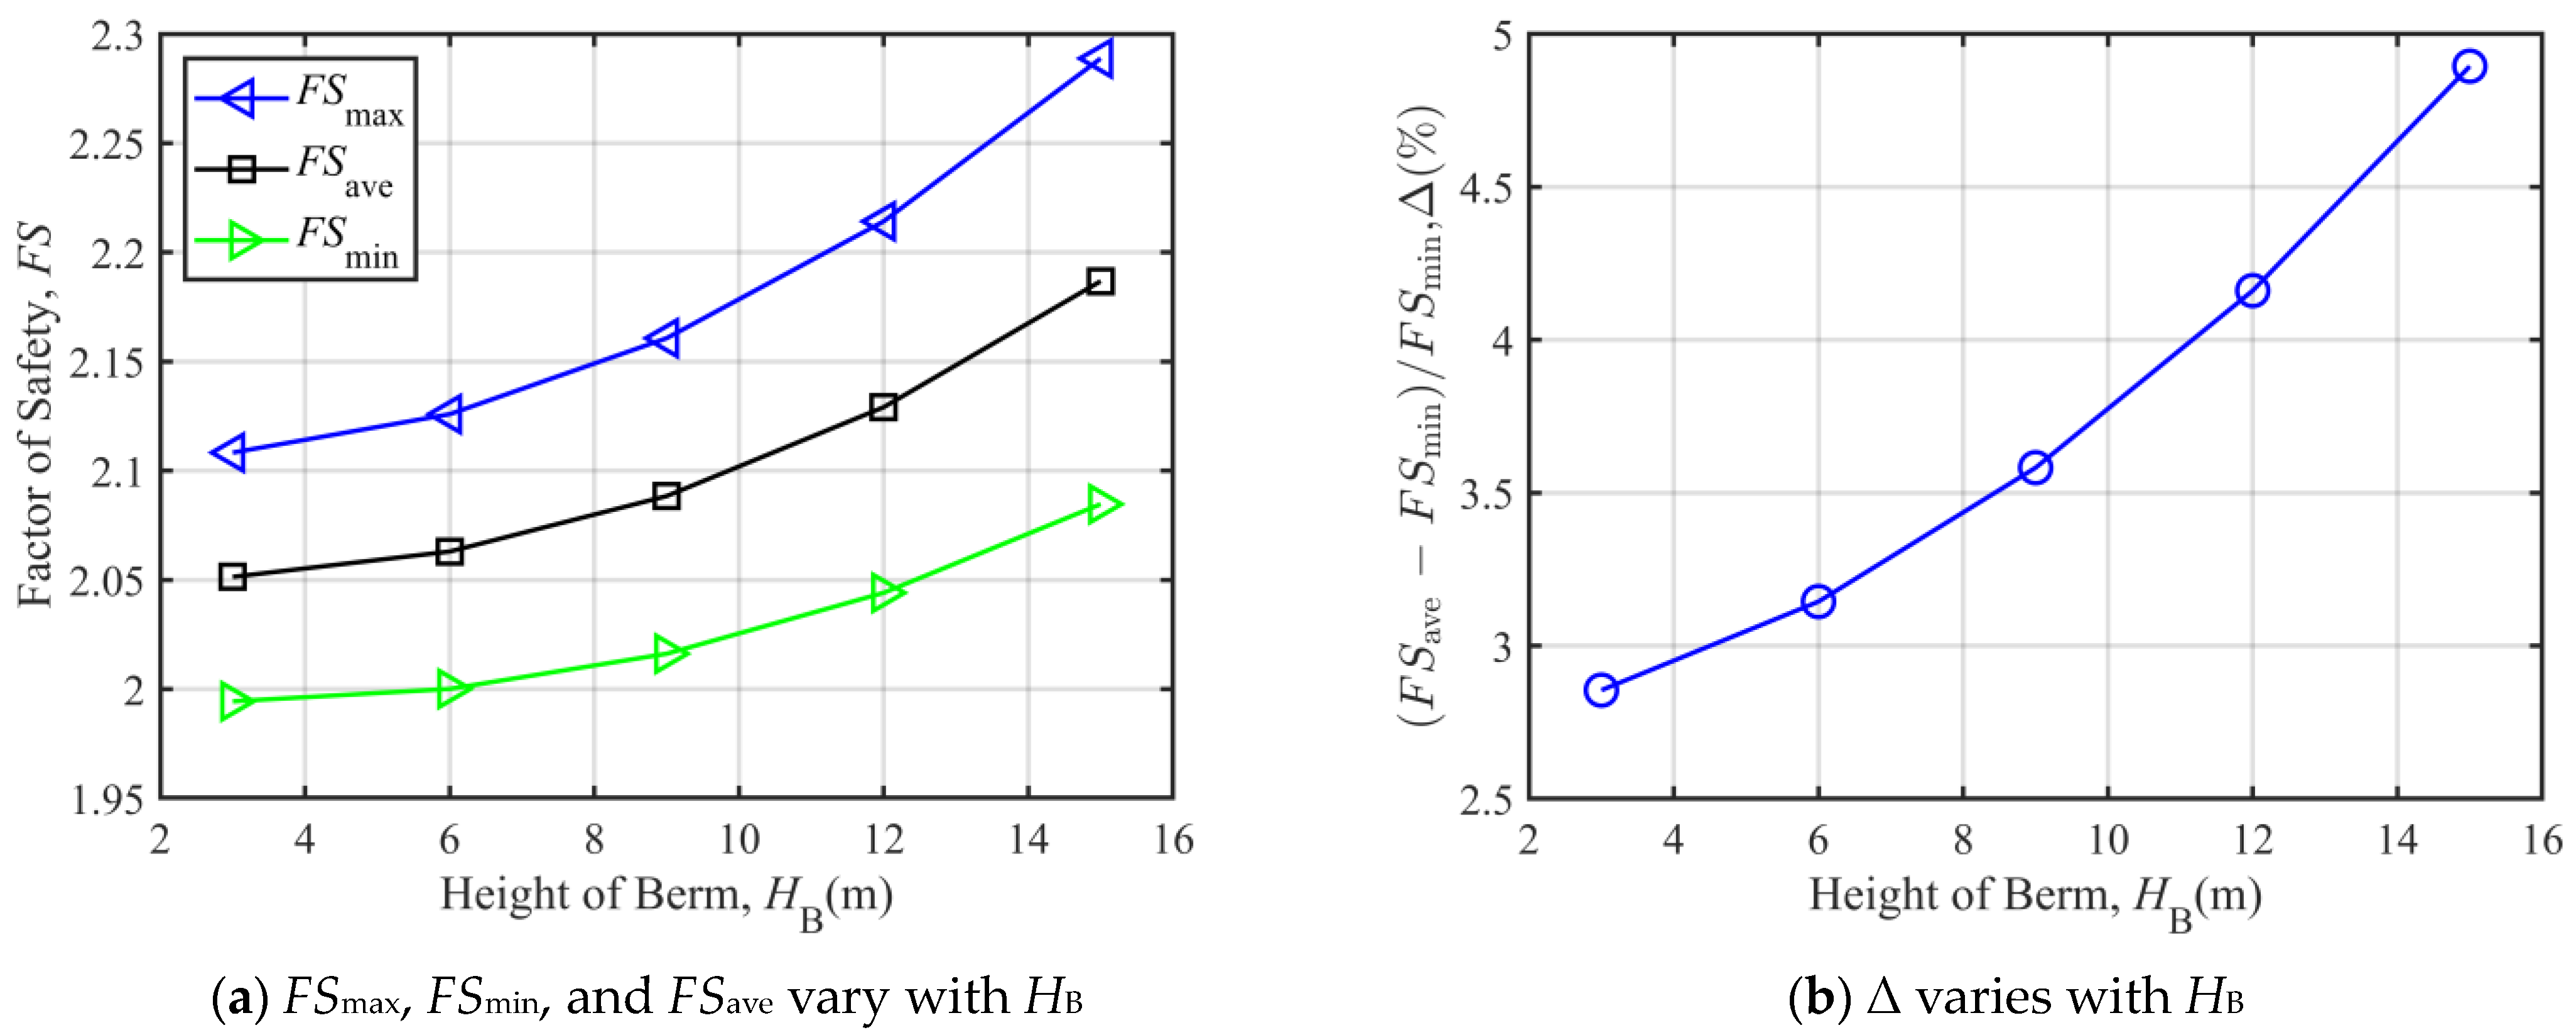
From Figure 9a, it can be seen that FSmax, FSmin, and FSave all increase with the increase in HB. When HB increases from 3 m to 15 m, FSmax increases by 8.56%, FSave increases by 6.60%, and FSmin increases by 4.53%. It can be seen that the increase in the above three types of safety factors gradually decreases.%
Figure 9b shows that that Δ increases with the increase in HB. Specifically, when HB = 3 m, 6 m, 9 m, 12 m, and 15 m, Δ is 2.86%, 3.14%, 3.58%, 4.16%, and 4.89%, respectively. Thus, the maximum value of Δ is 4.89%.
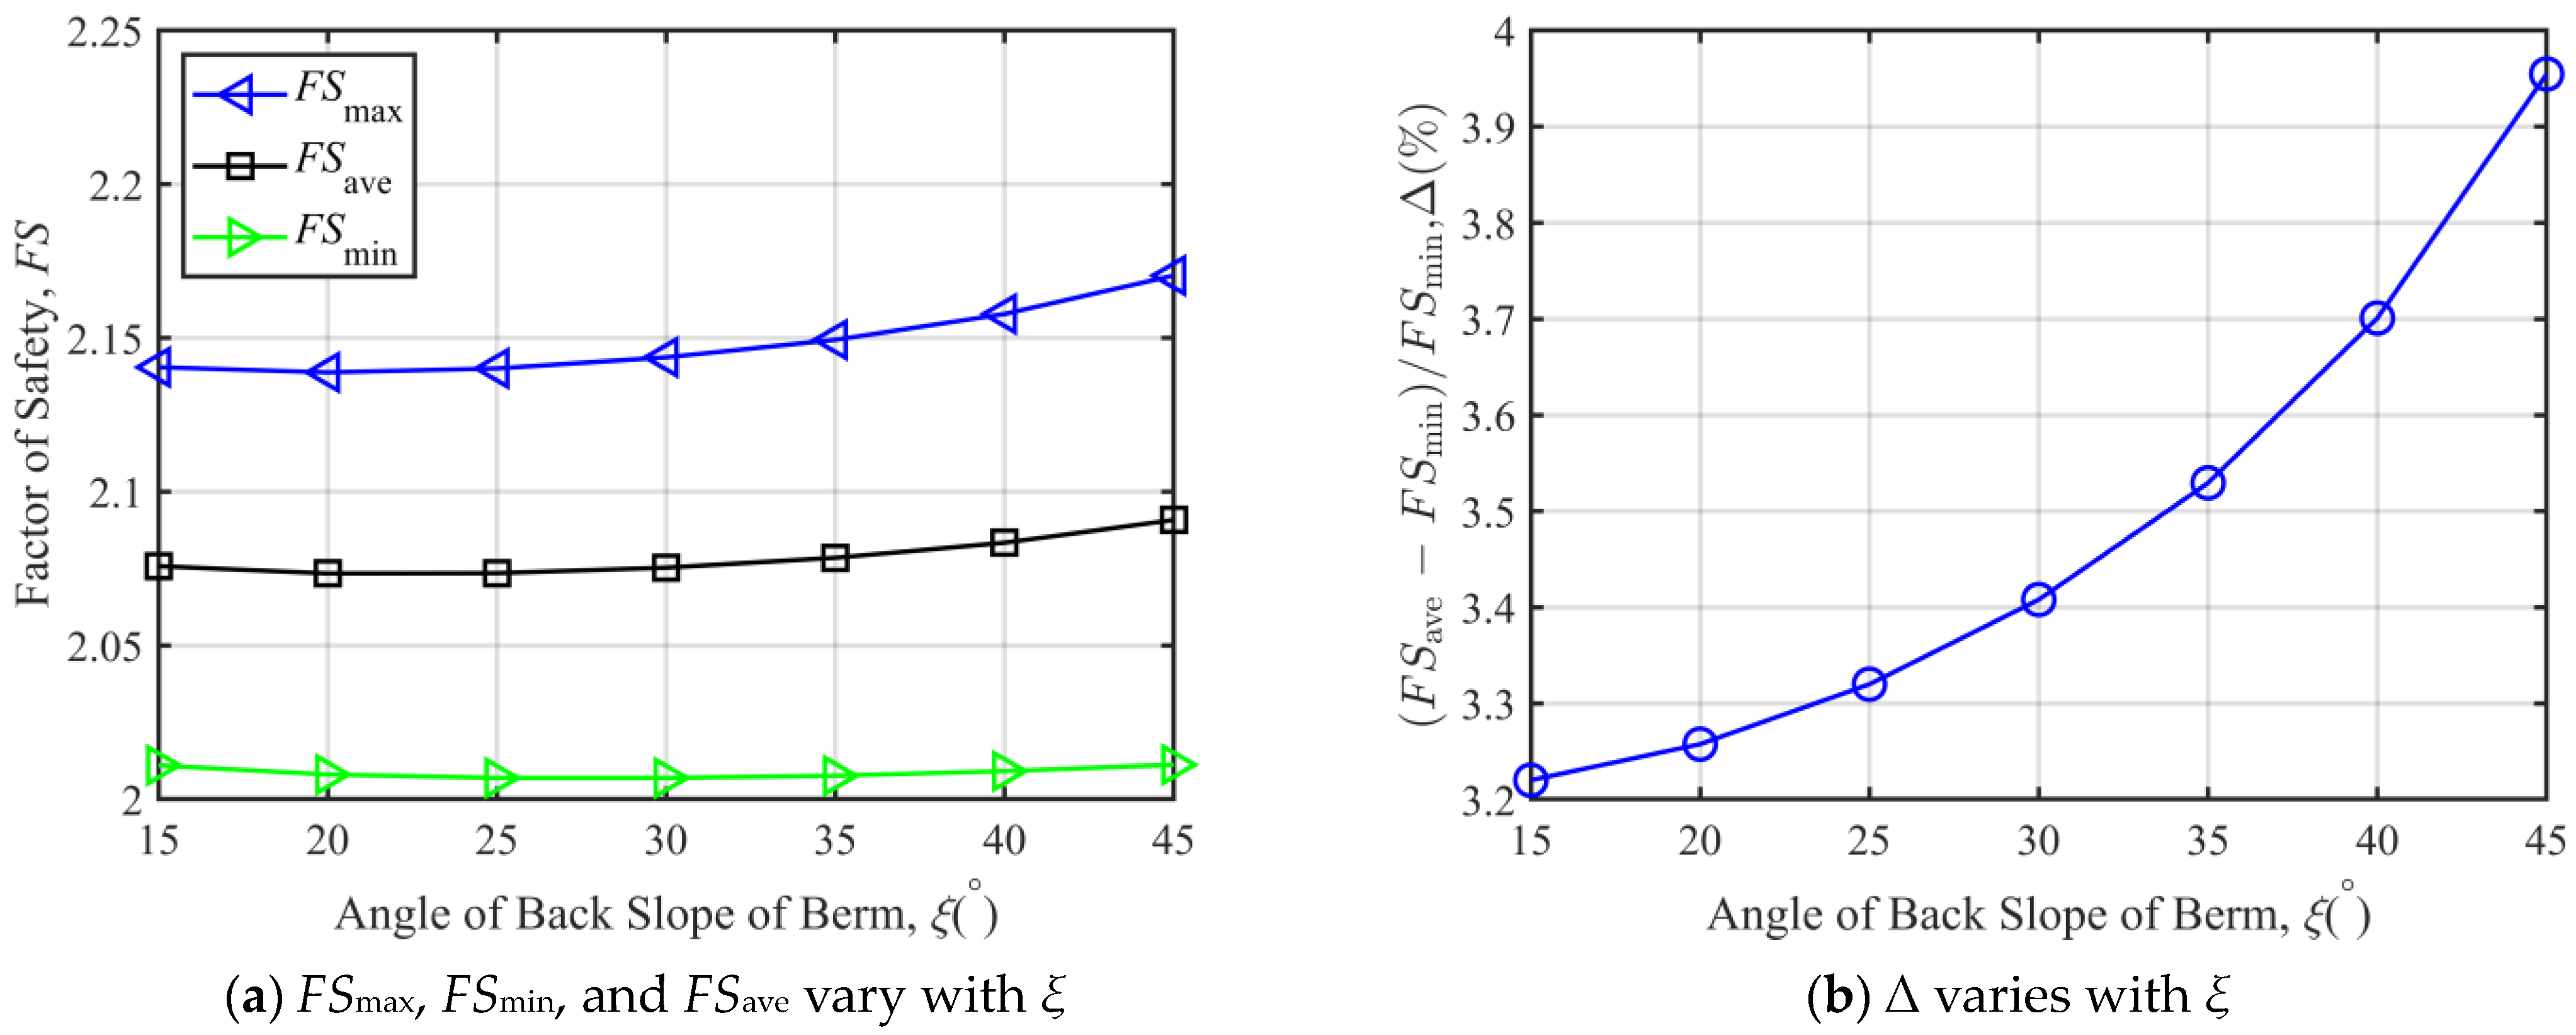
From Figure 10a, it can be seen that FSmax, FSmin, and FSave all slightly decrease and then increase with the increase in ξ.
Figure 10b shows that that Δ increases with the increase in α. And it can be determined that when ξ = 15°, 20°, 25°, 30°, 35°, 40°, 45°, Δ = 3.22%, 3.26%, 3.32%, 3.41%, 3.53%, 3.71%, 3.95%. It can be concluded that the maximum value of Δ is 3.95%.
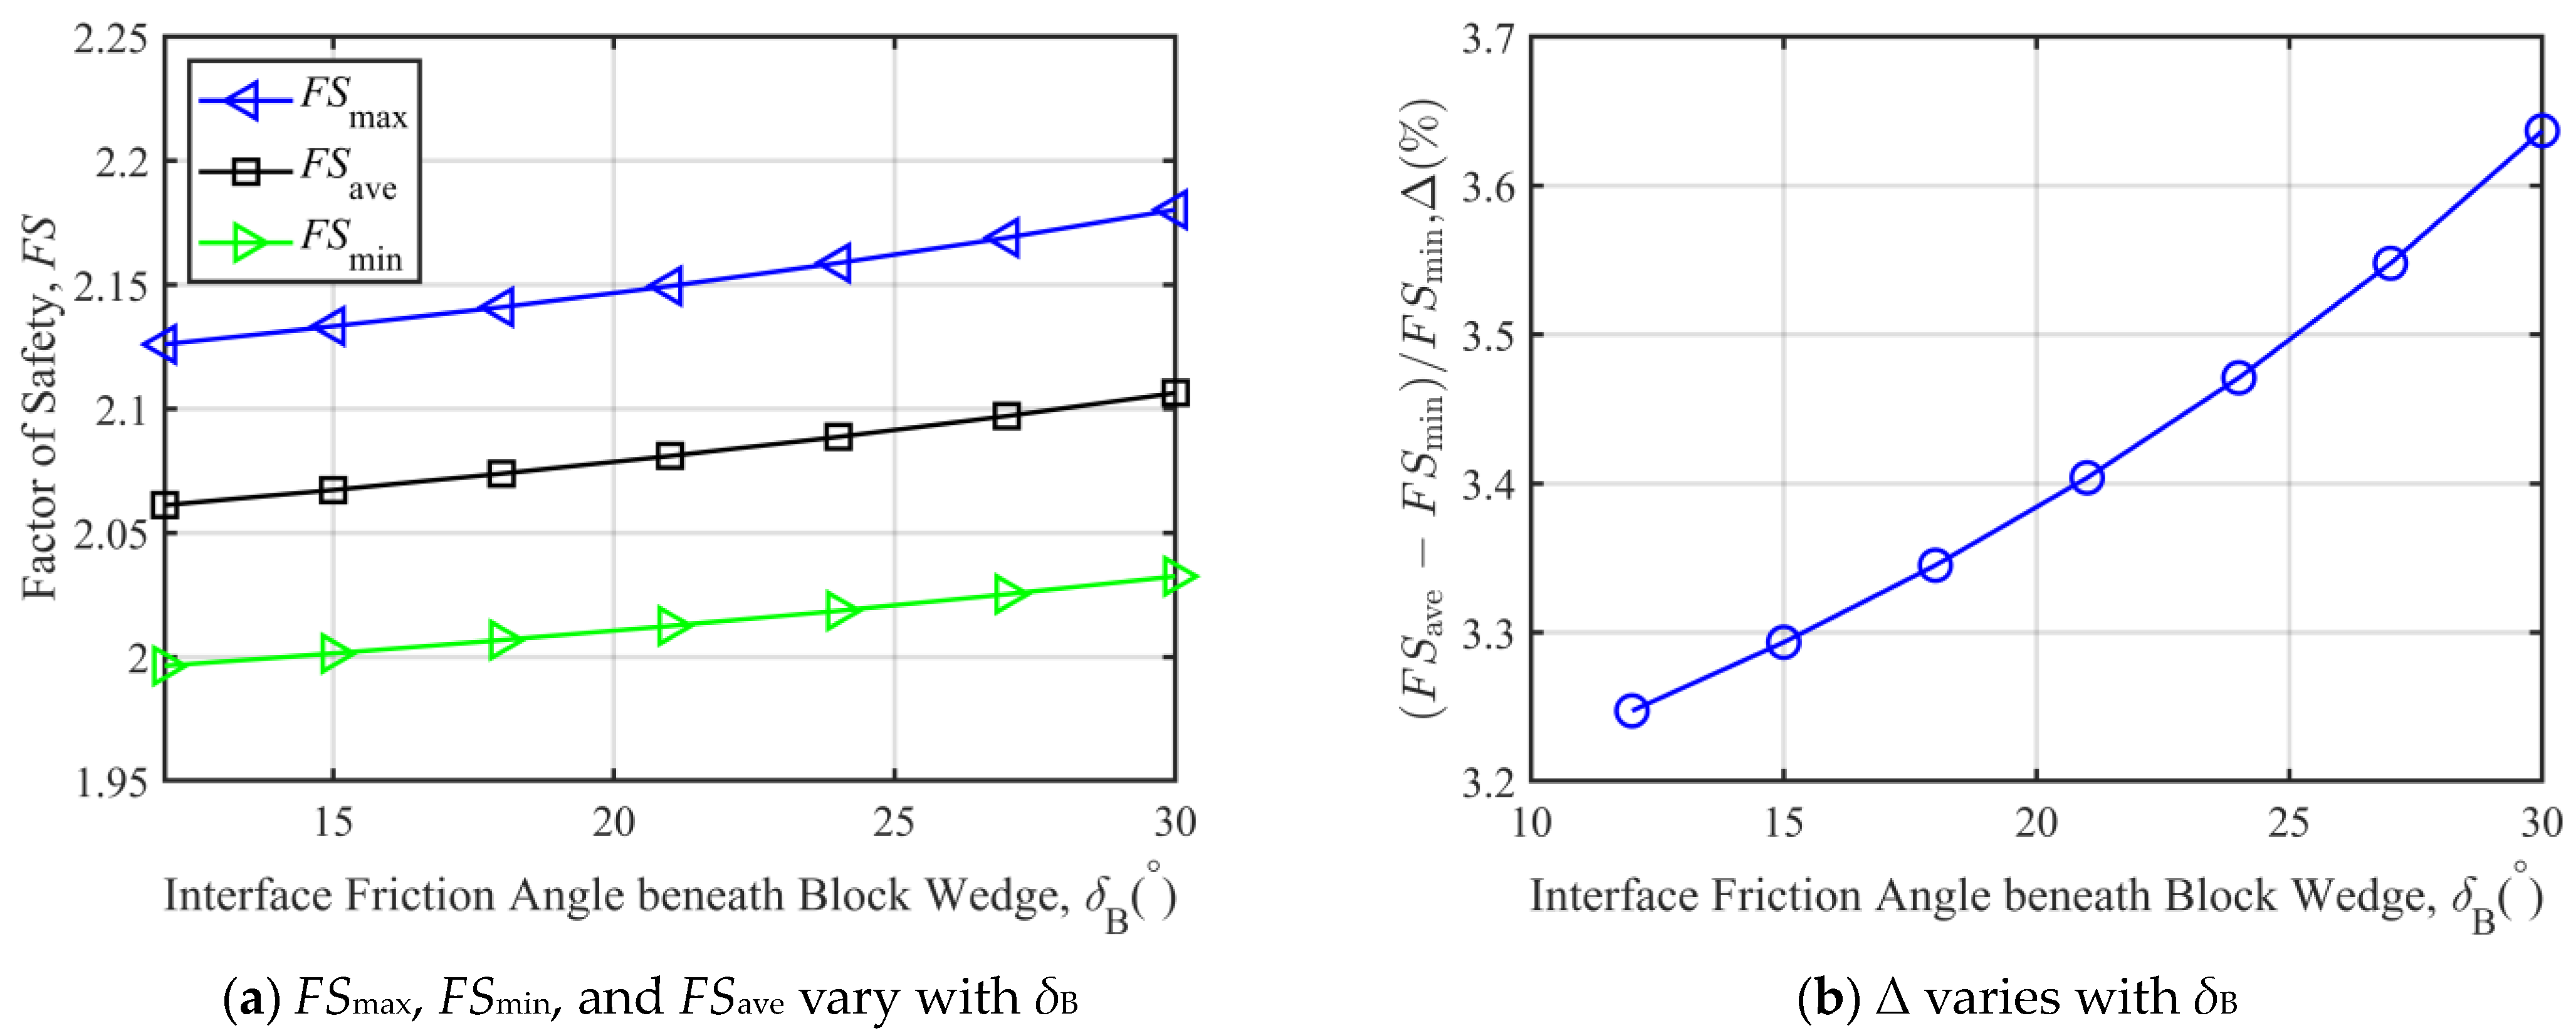
From Figure 11a, it can be seen that FSmax, FSmin and FSave all increase with the increase in δB. When δB increases from 12° to 30°, FSmax, FSave, and FSmin increase by 2.55%, 2.19%, and 1.81%, respectively. The changing trend of the safety factor is the same as the effect of HB on the safety factor.
Figure 11b shows that Δ increases as δB increases. Specifically, when δB = 12°, 15°, 18°, 21°, 24°, 27°, and 30°, Δ is 3.25%, 3.29%, 3.35%, 3.40%, 3.47%, 3.55%, and 3.64%, respectively. Thus, the maximum value of Δ is 3.64%.
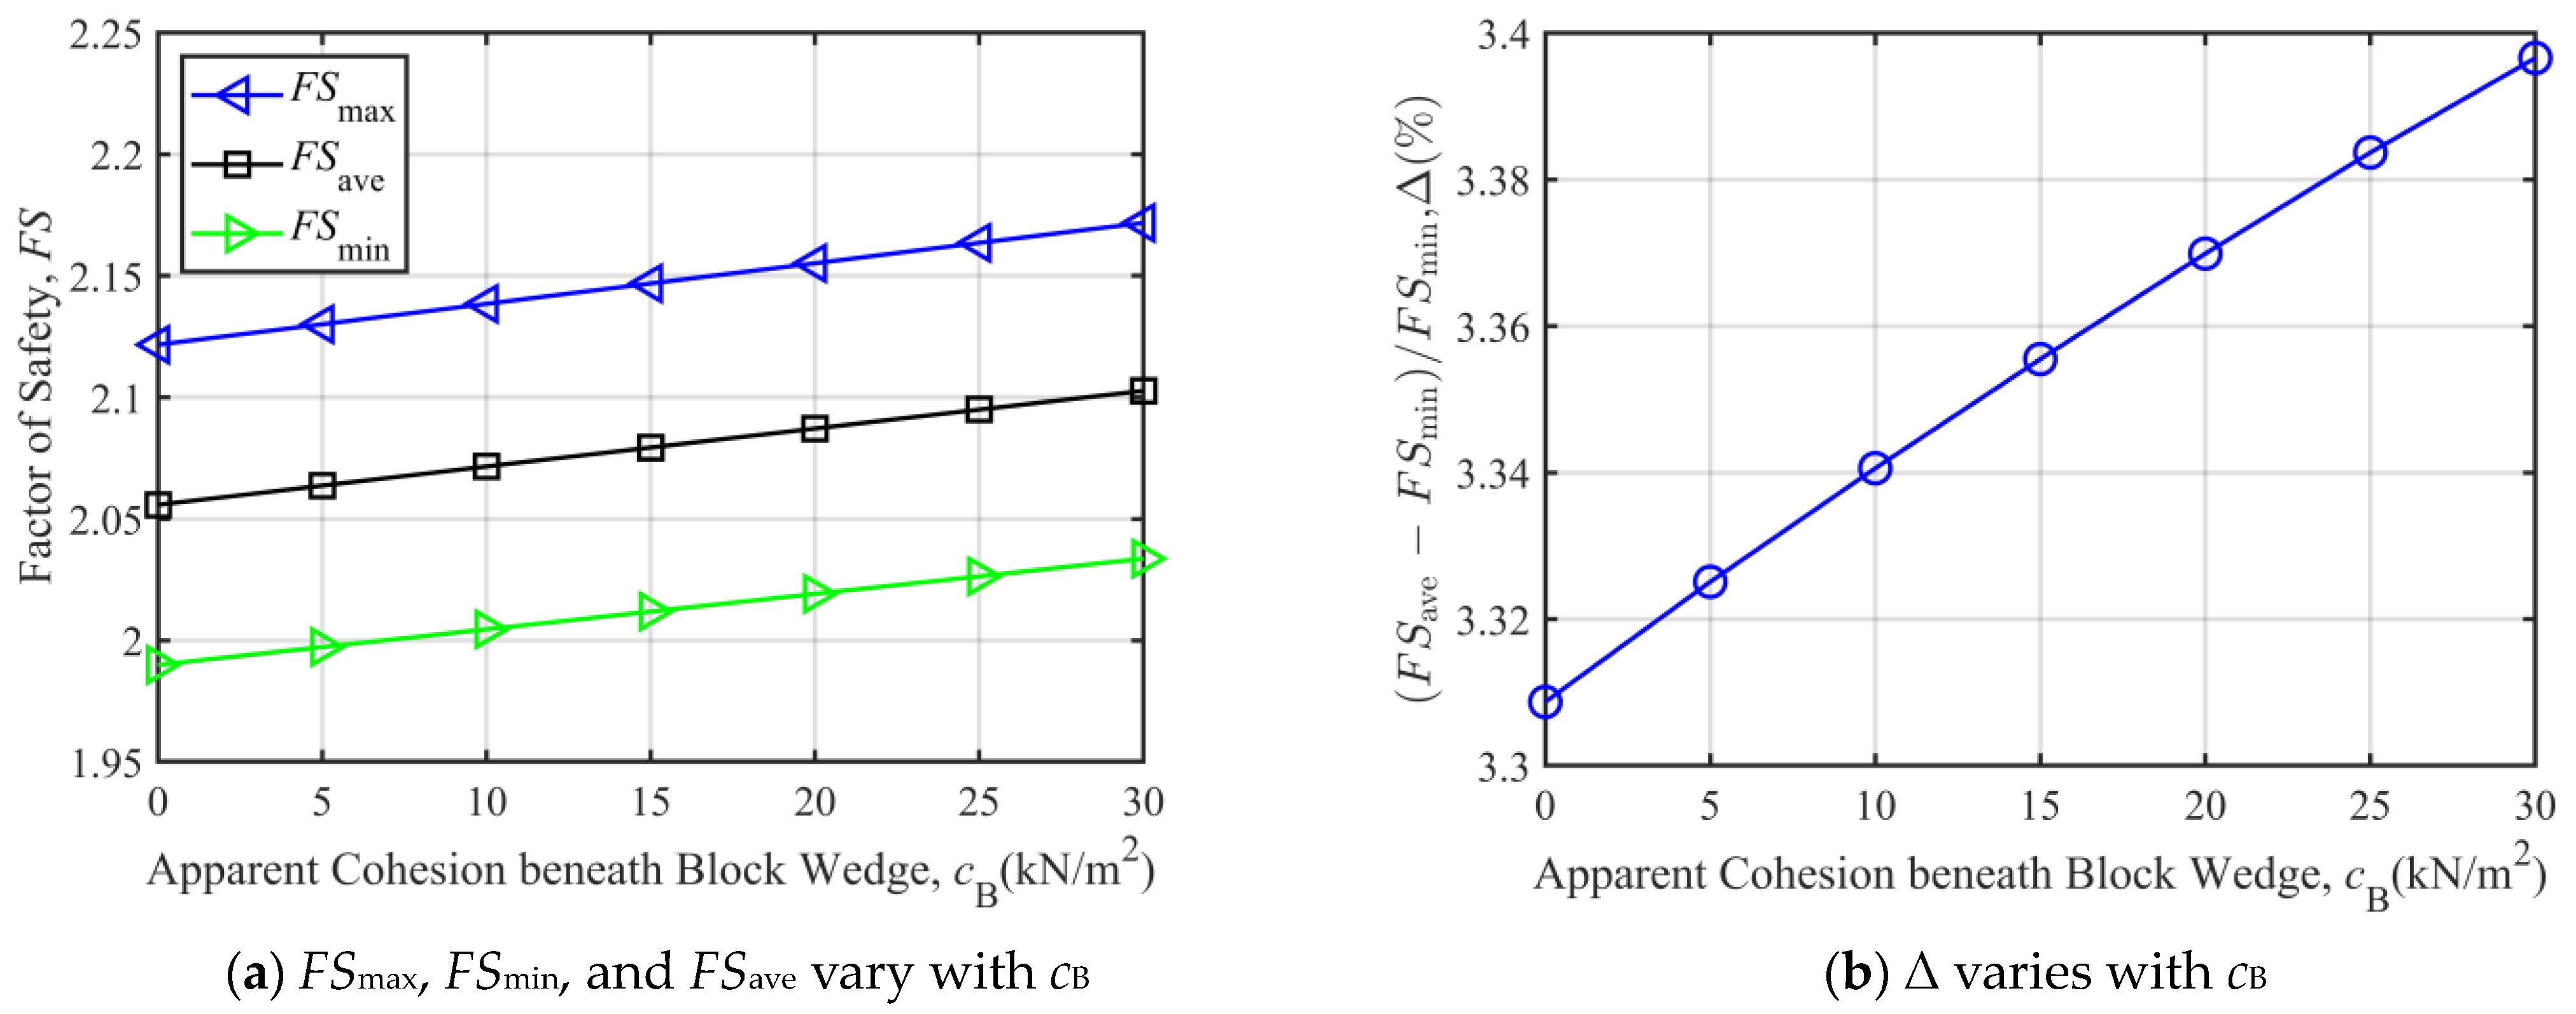
From Figure 12a, it can be seen that FSmax, FSmin and FSave all increase with the increase in cB. When cB increases from 0 to 30 kN/m2, FSmax, FSave, and FSmin increase by 2.36%, 2.28%, and 2.20%, respectively. It can be seen that the increase above three safety factors gradually decreases, but the difference among those not significant.
Figure 12b shows that Δ increases with the increase in cB. And it can be determined that when cB = 0, 5 kN/m2, 10 kN/m2, 15 kN/m2, 20 kN/m2, 25 kN/m2, 30 kN/m2, Δ = 3.31%, 3.33%, 3.34%, 3.36%, 3.37%, 3.38%, 3.40%. It can be concluded that the maximum value of Δ is 3.40%.

3.1.2. Analysis of the Safety Factor When Under-Berm Failure Occurs

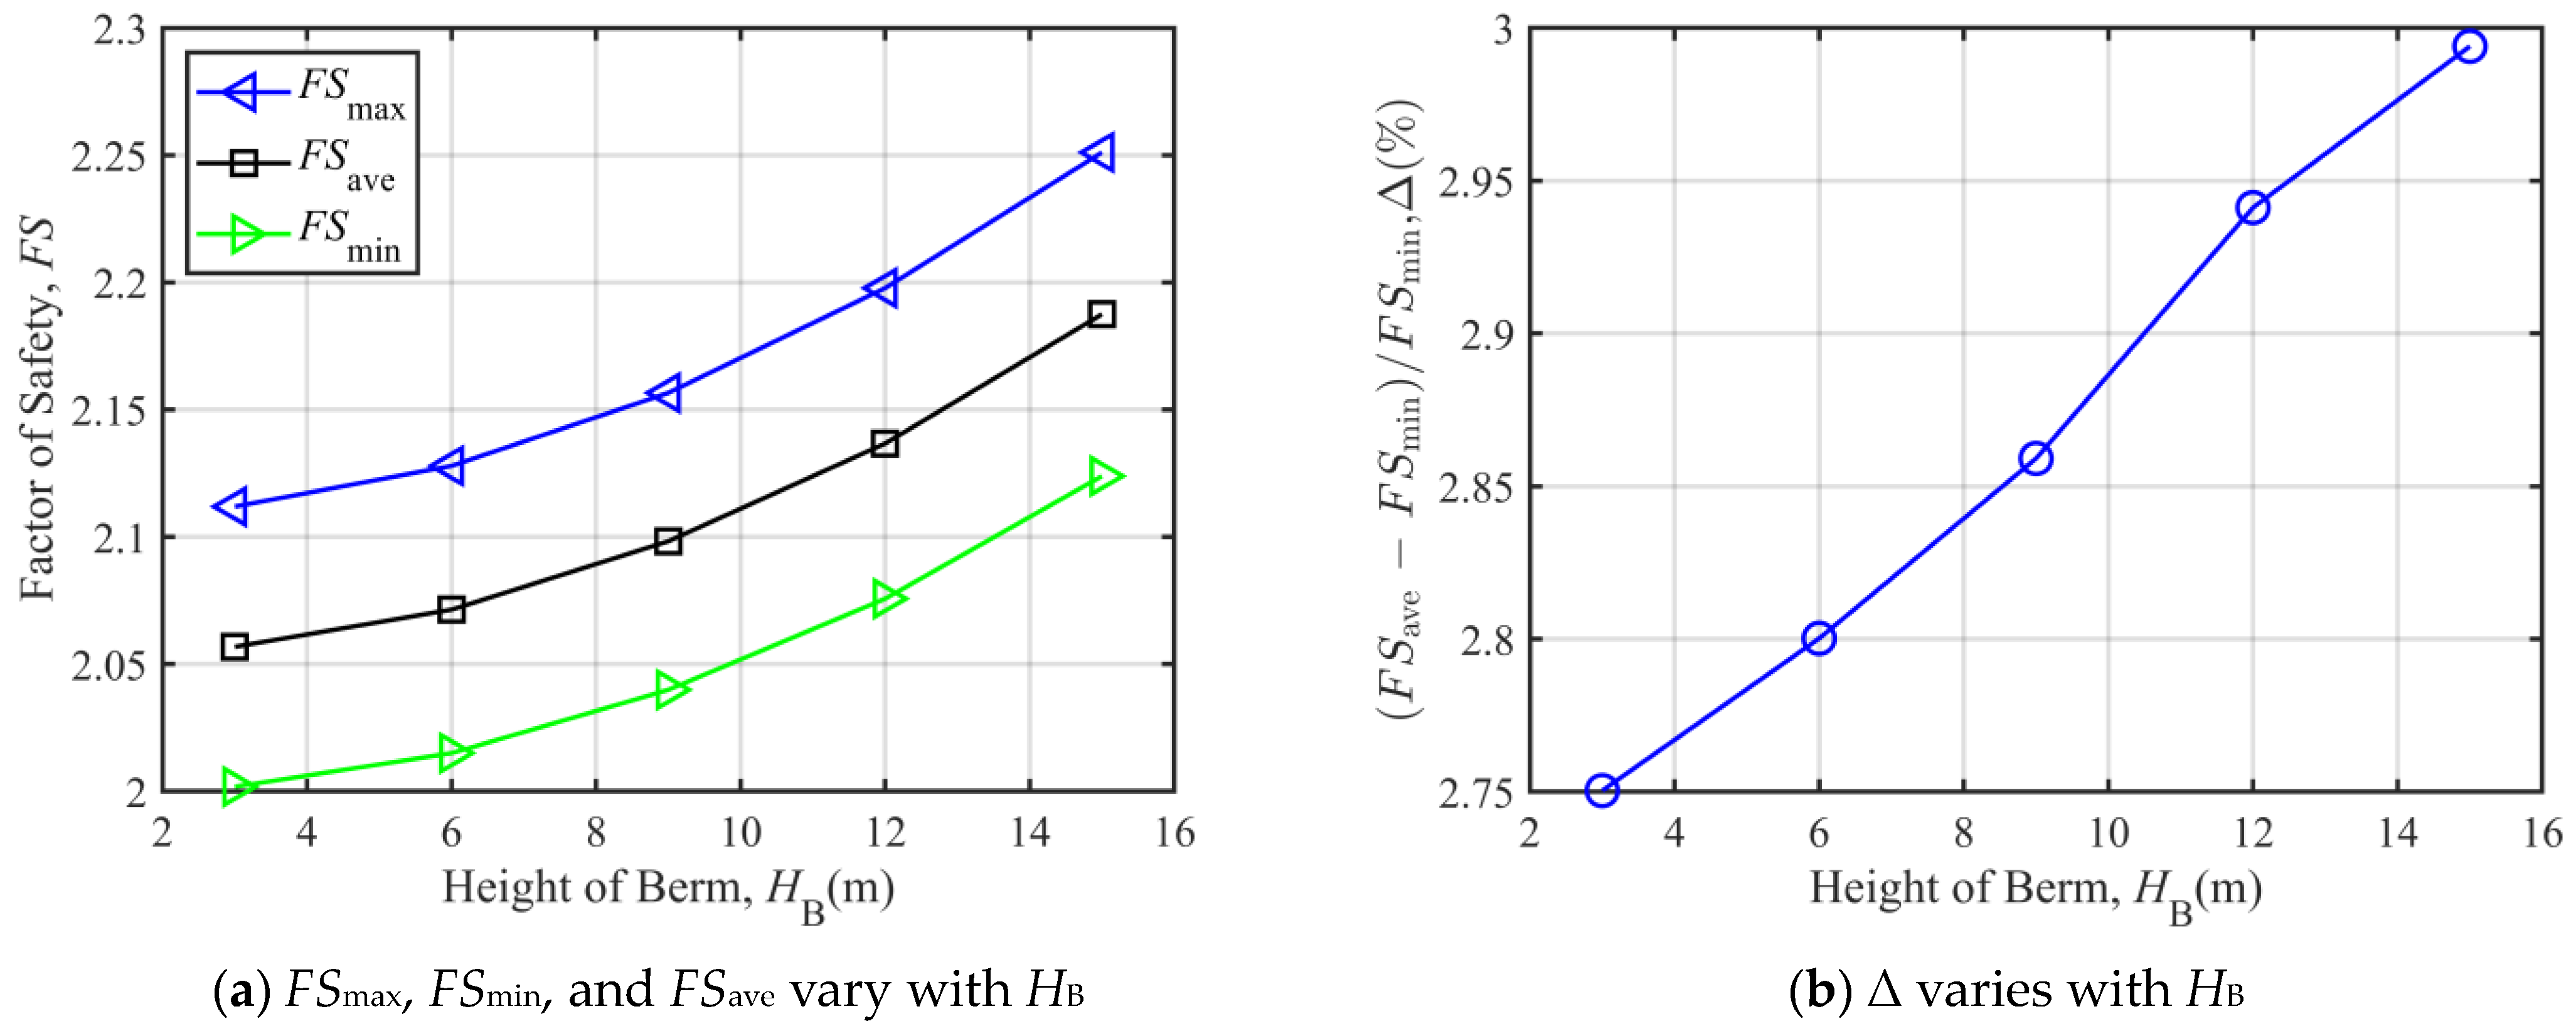
Figure 13a shows that FSmax, FSmin, and FSave all increase as HB increases. When HB increases from 3 m to 15 m, FSmax, FSave, and FSmin increase by 6.59%, 6.35%, and 6.10%, respectively. The rate of increase in these safety factors gradually diminishes, but the differences in their rates are not significant.
From Figure 13b, it can be seen that Δ increases with the increase in HB. And it can be determined that when HB = 3 m, 6 m, 9 m, 12 m, 15 m, Δ = 2.75%, 2.80%, 2.86%, 2.94%, 2.99%. It can be concluded that the maximum value of Δ is 2.99%.
Figure 14a shows that that FSmax, FSmin and FSave all decrease with the increase in ξ. When ξ increases from 15° to 45°, FSmax, FSave, and FSmin decrease by 3.62%, 3.57%, and 3.53%, respectively. It can be seen that the increase above three safety factors is gradually decreasing, but their decrease rates is similar to the impact of HB on the safety factor.
From Figure 14b, it can be seen that Δ increases with the increase in ξ. And it can be determined that when ξ = 15°, 20°, 25°, 30°, 35°, 40°, 45°, Δ = 2.867%, 2.837%, 2.831%, 2.826%, 2.822%, 2.818%, 2.815%. It can be concluded that the maximum value of Δ is 2.867%.
Figure 15a shows that FSmax, FSmin, and FSave all increase as δB increases. When δB increases from 15° to 40°, FSmax, FSave, and FSmin increase by 5.38%, 5.19%, and 4.98%, respectively. The rate of increase in these safety factors gradually diminishes, but the differences between them are not significant.
From Figure 15b, it can be seen that Δ first slightly decreases and then increases with the increase in δB. And it can be determined that when δB = 15°, 20°, 25°, 30°, 35°, 40°, Δ = 2.742%, 2.741%, 2.792%, 2.815%, 2.855%, 2.938%. It can be concluded that the maximum value of Δ is 2.938%.
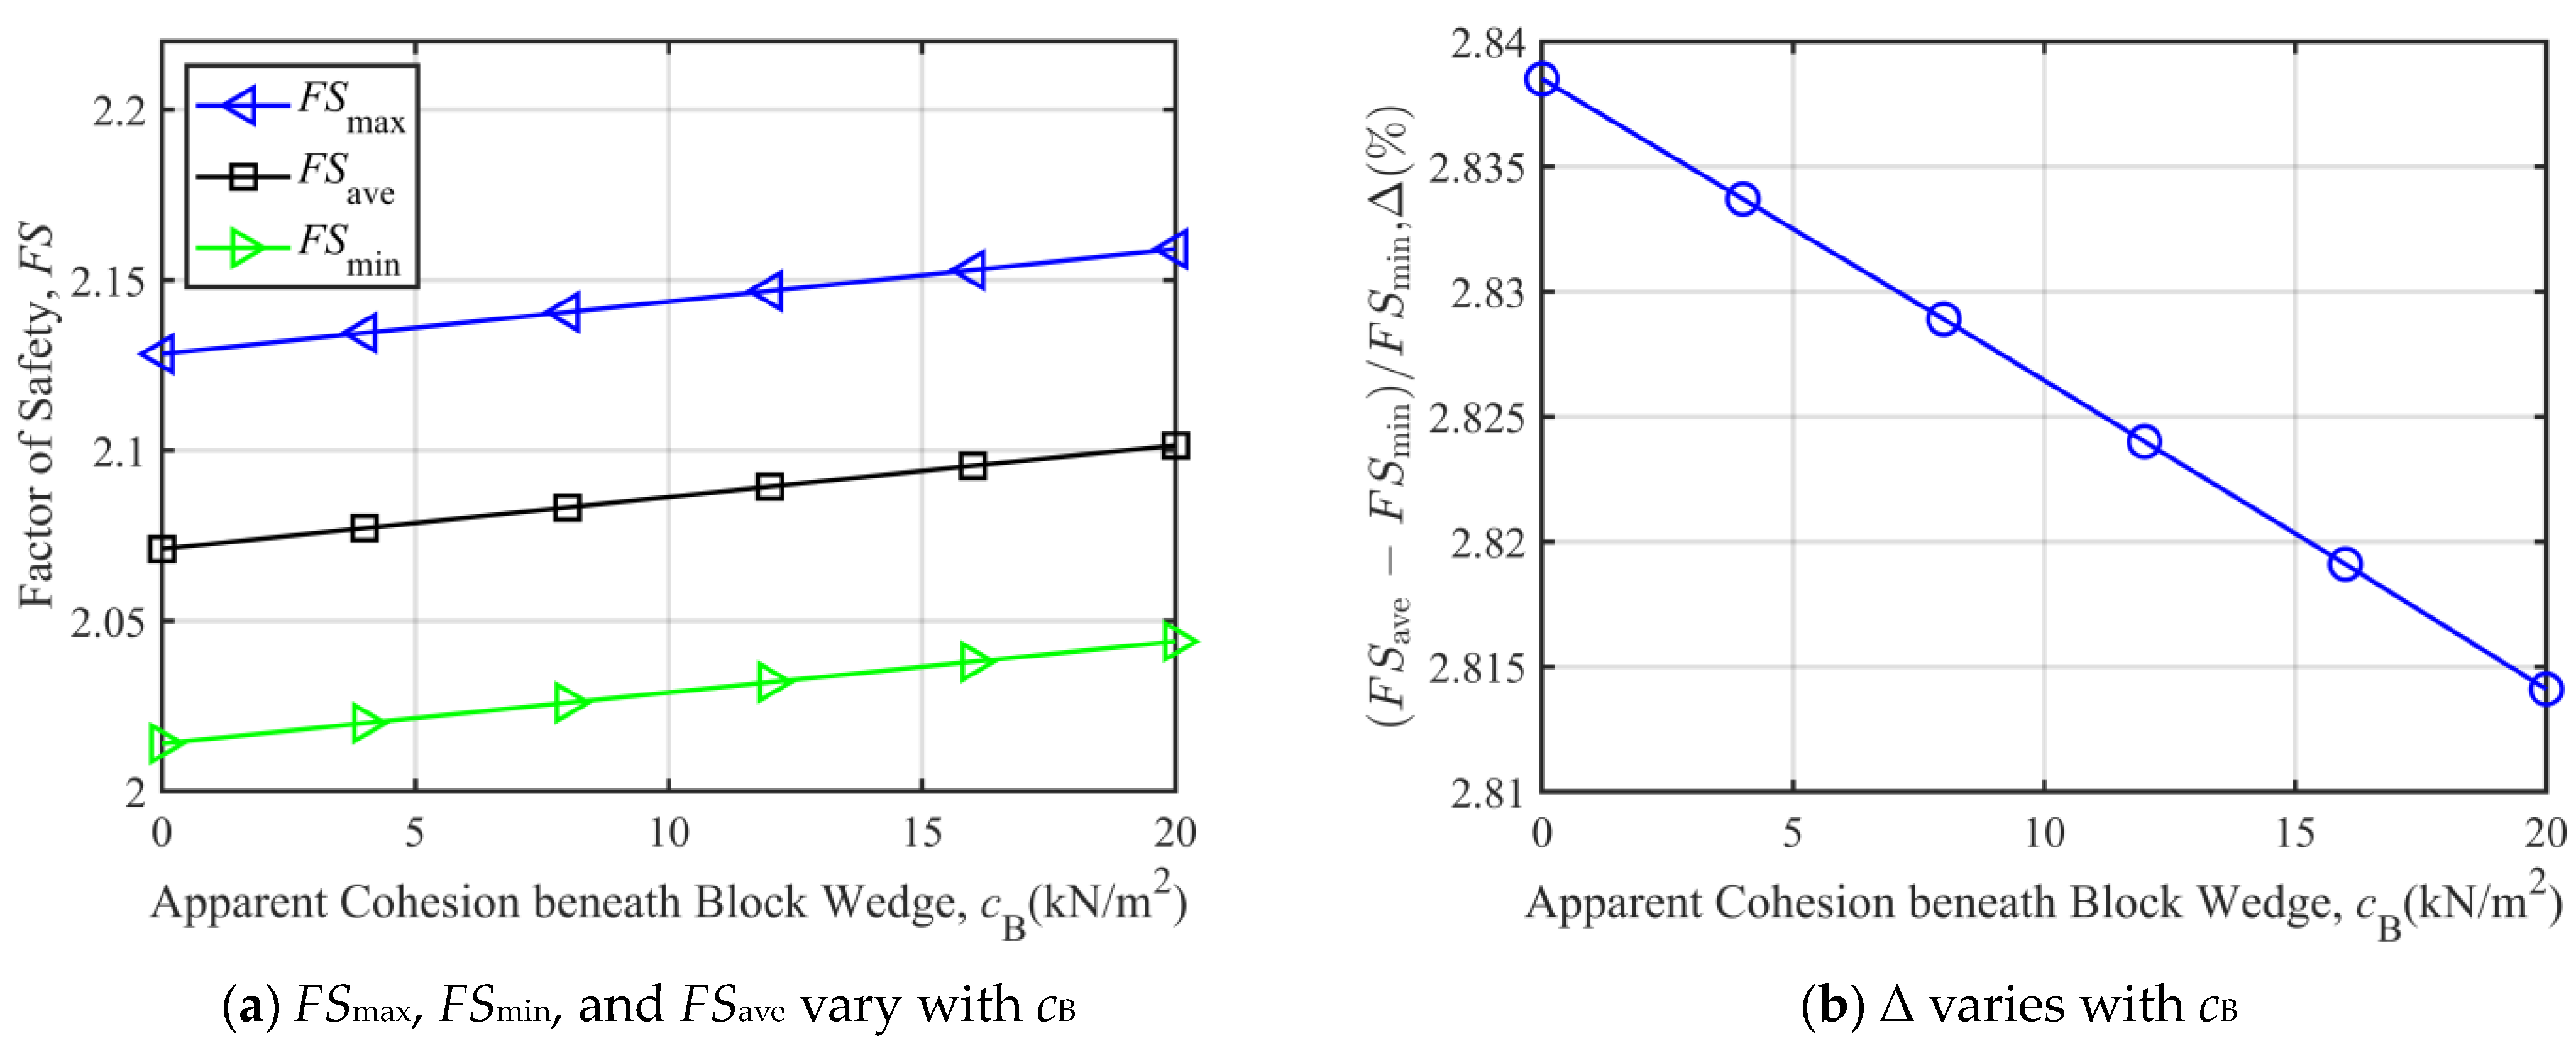
Figure 16a shows that FSmax, FSmin and FSave all increase with the increase in cB. When cB increases from 0 to 20 kN/m2, FSmax, FSave, and FSmin increase by 1.45%, 1.47%, and 1.49%, respectively. It can be seen that there is almost no difference in the increase in the above three safety factors.
From Figure 16b, it can be seen that Δ decreases approximately linearly with the increase in cB. And it can be determined that when cB = 0, 4 kN/m2, 8 kN/m2, 12 kN/m2, 16 kN/m2, 20 kN/m2, Δ = 2.839%, 2.834%, 2.829%, 2.824%, 2.819%, 2.814%. It can be concluded that the maximum value of Δ is 2.839%.
Through the analysis of Δ above, it can be found that the maximum value of Δ is 4.89%. In other words, the values of Δ are all within 5%. Therefore, it is feasible to use FSave to approximate FStrue to evaluate the degree of stability of the landfill with an engineered berm against composite failure modes.

3.2. Parametric Analysis

To analyze the influence of related parameters of the engineered berm on the average safety factor, FSave, the parametric analysis was conducted, and the basic parameter values are shown in Section 3.1.

3.2.1. Parametric Analysis When Over-Berm Failure Occurs

It can be seen from Figure 17 that as HB increases, FSave increases, and as ξ increases, FSave also increases. When HB changes from 3 m to 15 m, FSave increases by 6.60% when ξ = 25°; when ξ = 30°, FSave increases by 6.69%; when ξ = 35°, FSave increases by 7.02%; when ξ = 40°, FSave increases by 7.61%. Therefore, it can be found that with the increase in ξ, the influence of HB on FSave gradually becomes stronger.
It can be clearly observed in Figure 18 that as cB increases, FSave increases, and as δB increases, FSave also increases. When cB varies from 0 to 20 kN/m2, FSave increases by 1.44% when δB = 12°; when δB = 15°, FSave increases by 1.51%; when δB = 18°, FSave increases by 1.53%; when δB = 21°, FSave increases by 1.55%. It can be thus summarized that the influence of cB on FSave slightly increases as δB increases.

3.2.2. Parametric Analysis When Under-Berm Failure Occurs

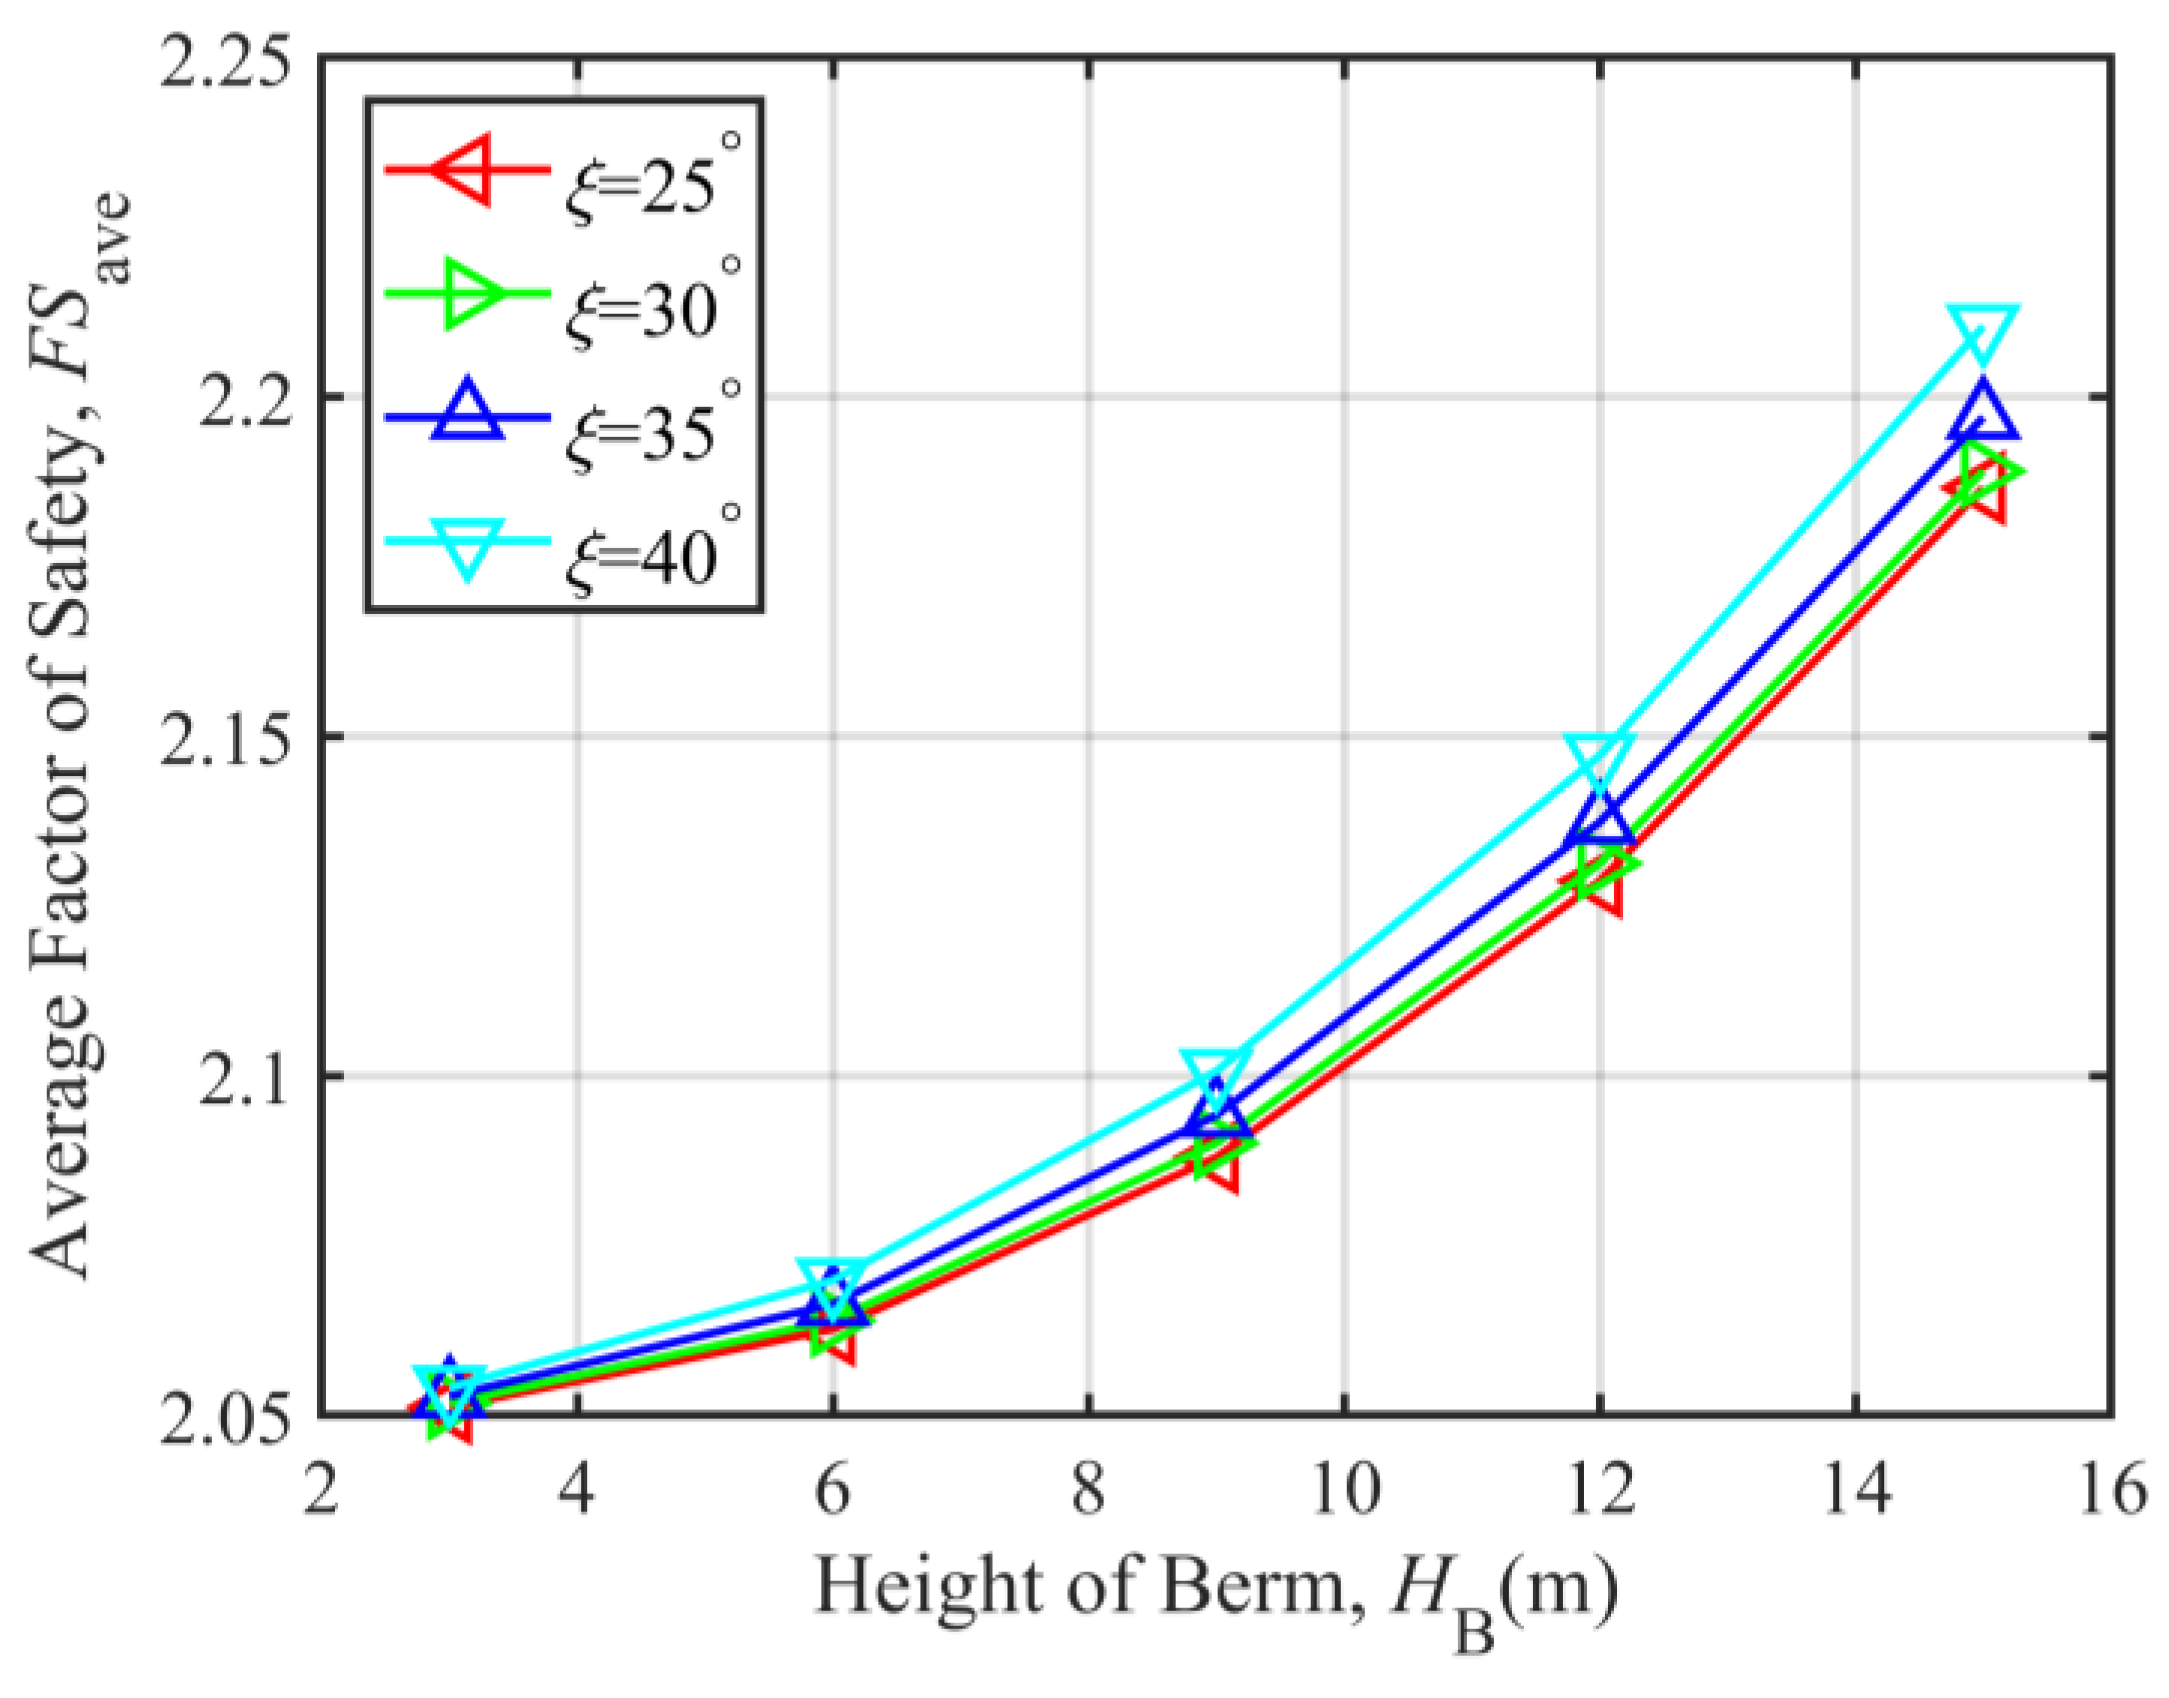
It can be found out from Figure 19 that as HB increases, FSave increases, while as ξ increases, FSave decreases accordingly. When HB varies from 3 m to 15 m, FSave increases by 7.12% when ξ = 25°; when ξ = 30°, FSave increases by 5.01%; when ξ = 35°, FSave increases by 3.50%; when ξ = 40°, FSave increases by 2.39%. As a result, it can be concluded that as ξ increases, the effect of HB on FSave gradually weakens.
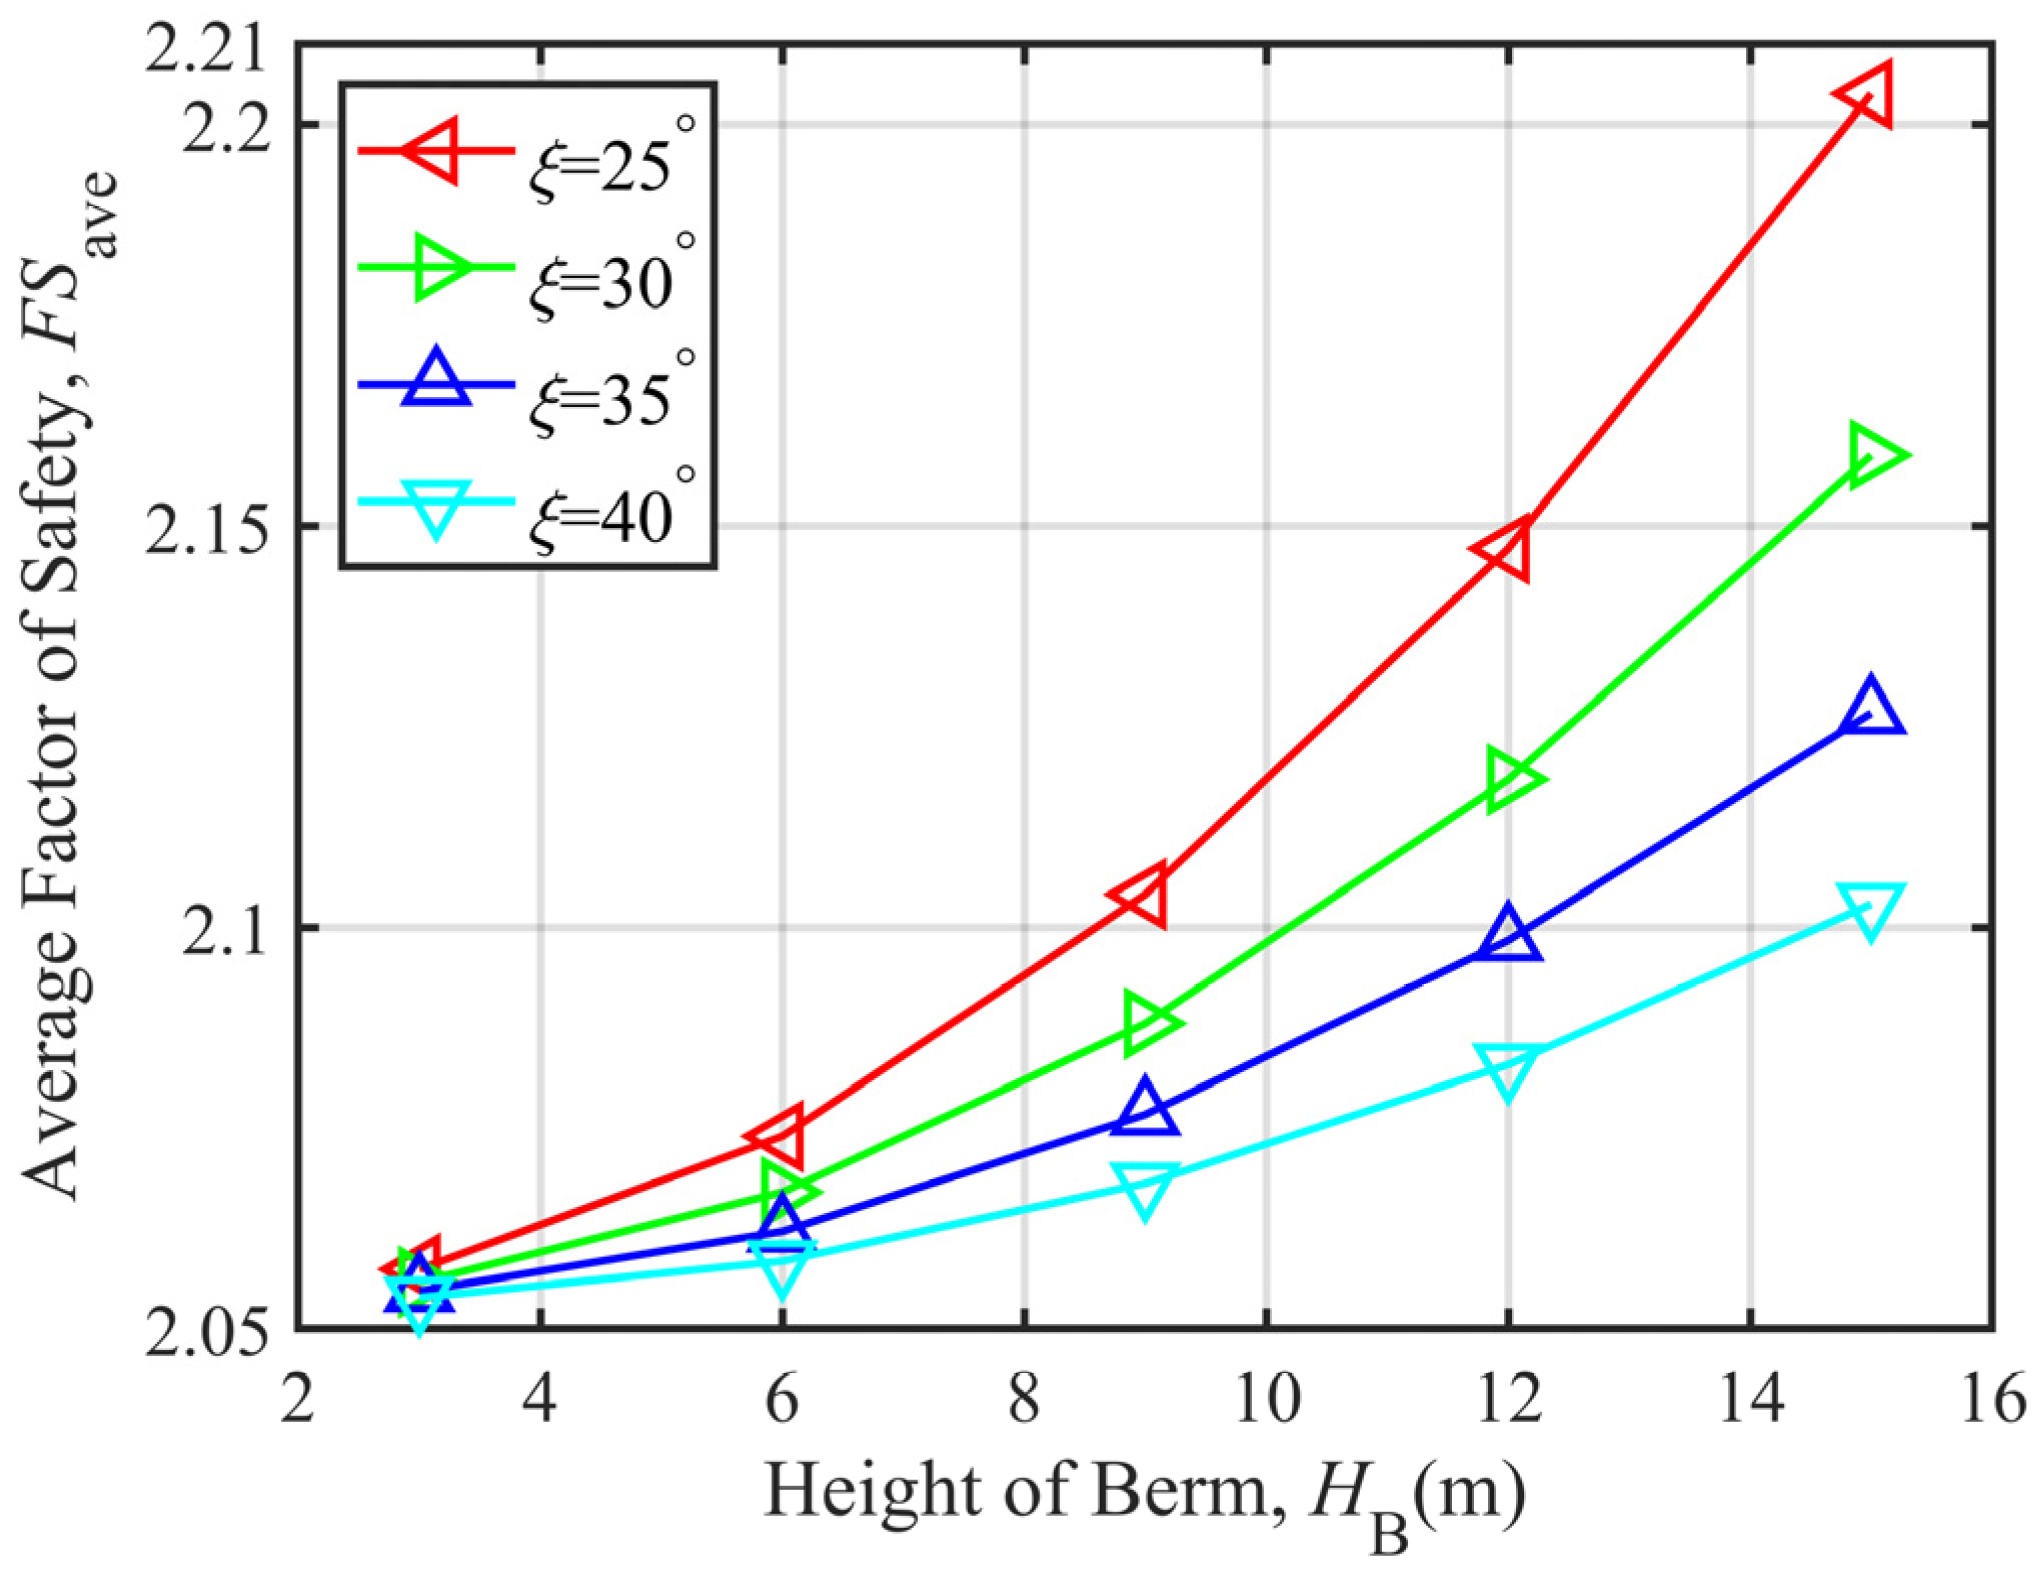
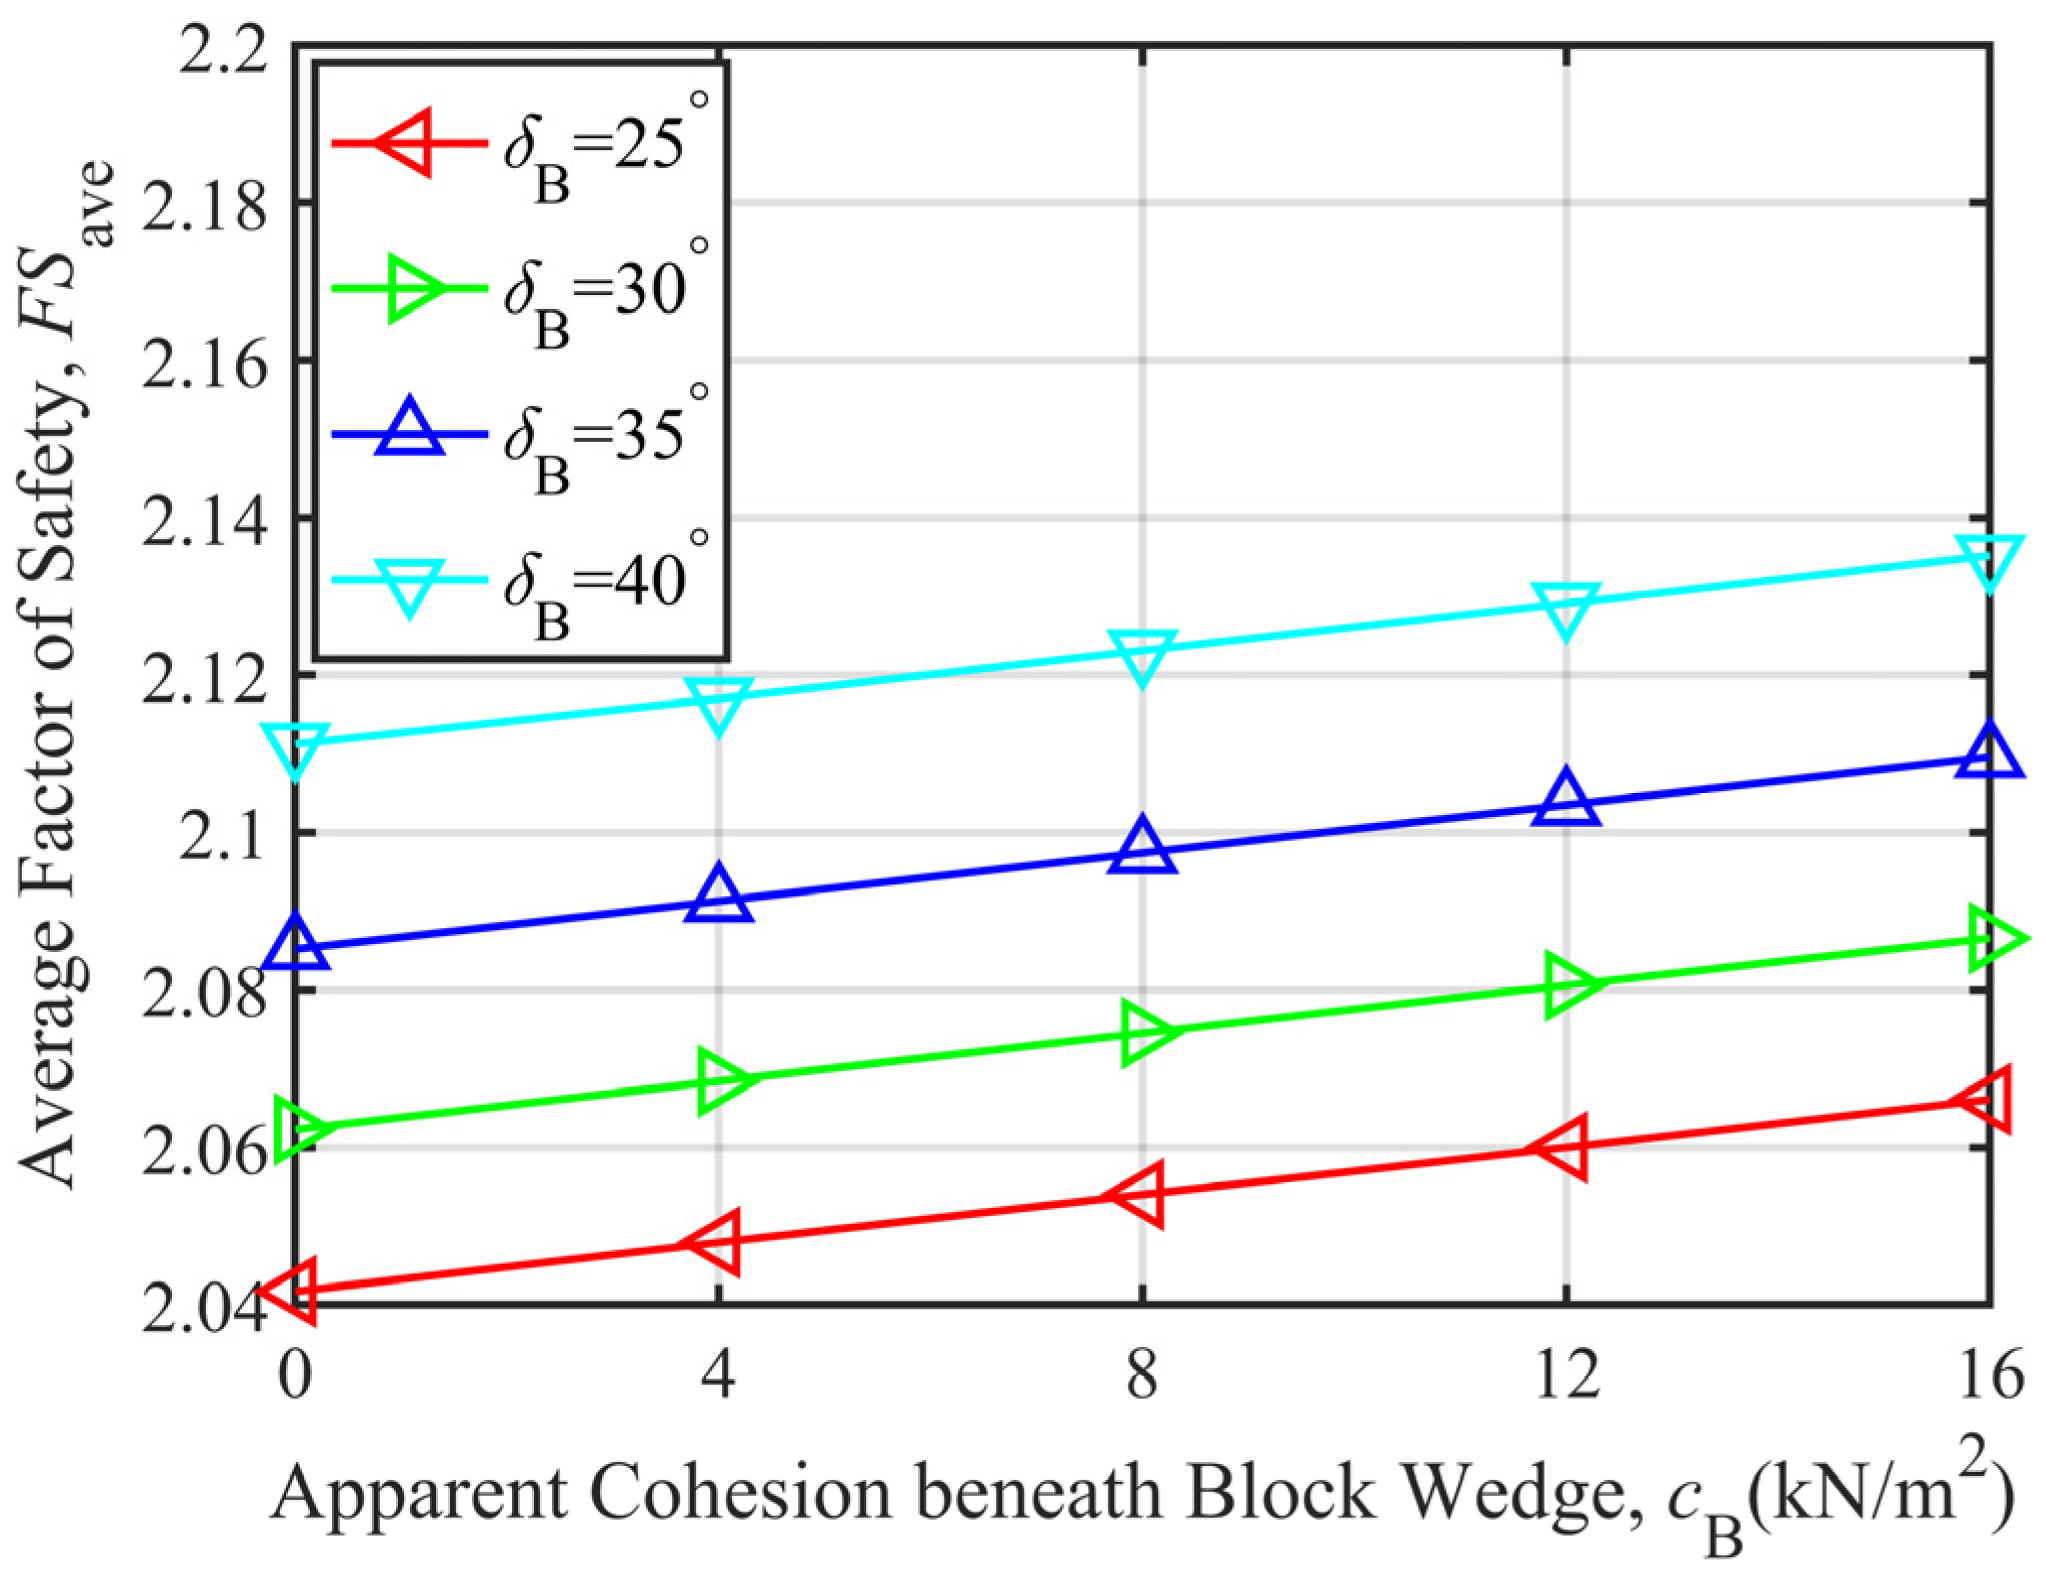
Figure 20 shows that FSave either increases with cB or increases with δB. When cB changes from 0 to 16 kN/m2, FSave increases by 1.20% for δB = 25°, 1.18% for δB = 30°, 1.17% for δB = 35°, and 1.13% for δB = 40°. Thus, it can be judged that with the increase in δB, the influence of cB on FSave slightly weakens.

3.3. Slip Surface Analysis

The analysis of the critical log-spiral slip surface considers two failure modes of the engineered berm, and for the basic parameter values, one needs to refer to Section 3.1.

3.3.1. Slip Surface Analysis When Over-Berm Failure Occurs

The influence of δB on the critical log-spiral slip surface is as shown in Figure 21a. In this figure, (I) represents the working condition of δB = 12° and (II) represents the working condition of δB = 30°. In (I), FSmin = 1.996, FSmax = 2.126, and FSmin = 2.033; FSmax = 2.180 in (II). From Figure 21a, it can be clearly seen that as δB increases, the critical log-spiral slip surface gradually shifts to the right.
The influence of cB on the critical slip surface is as shown in Figure 21b. In this figure, (I) represents the working condition of cB = 0 and (II) represents the working condition of cB = 30 kN/m2. In (I), FSmin = 1.990 and FSmax = 2.122, and in (II), FSmin = 2.034, FSmax = 2.172. It can be easily observed from Figure 21b that as cB increases, the critical log-spiral slip surface gradually shifts to the right.
From Figure 21a,b, it can be determined that as δB or cB increases, the horizontal spacing between the critical log-spiral slip surfaces generated by FSmin and FSmax, respectively, increases accordingly.

3.3.2. Slip Surface Analysis When Under-Berm Failure Occurs

The influence of δB on the critical log-spiral slip surface is as shown in Figure 21c. In this figure, (I) represents the working condition of δB = 15° and (II) represents the working condition of δB = 40°. In (I), FSmin = 1.965 and FSmax = 2.073, FSmin = 2.063, FSmax = 2.184 in (II). From Figure 21c, it can be seen that as δB increases, the critical log-spiral slip surface gradually shifts to the right.
The influence of cB on the critical log-spiral slip surface is as shown in Figure 21d. In the figure, (I) represents the working condition of cB = 0; (II) represents the working condition of cB = 20 kN/m2. In (I), FSmin = 2.014 and FSmax = 2.128; in (II), FSmin = 2.044, FSmax = 2.159. From Figure 21d, it can be seen that as cB increases, the critical log-spiral slip surface gradually shifts to the right.
From Figure 21c,d, the horizontal spacing between the critical log-spiral slip surfaces generated by FSmin and FSmax, respectively, only undergo slight changes.

4. Discussion

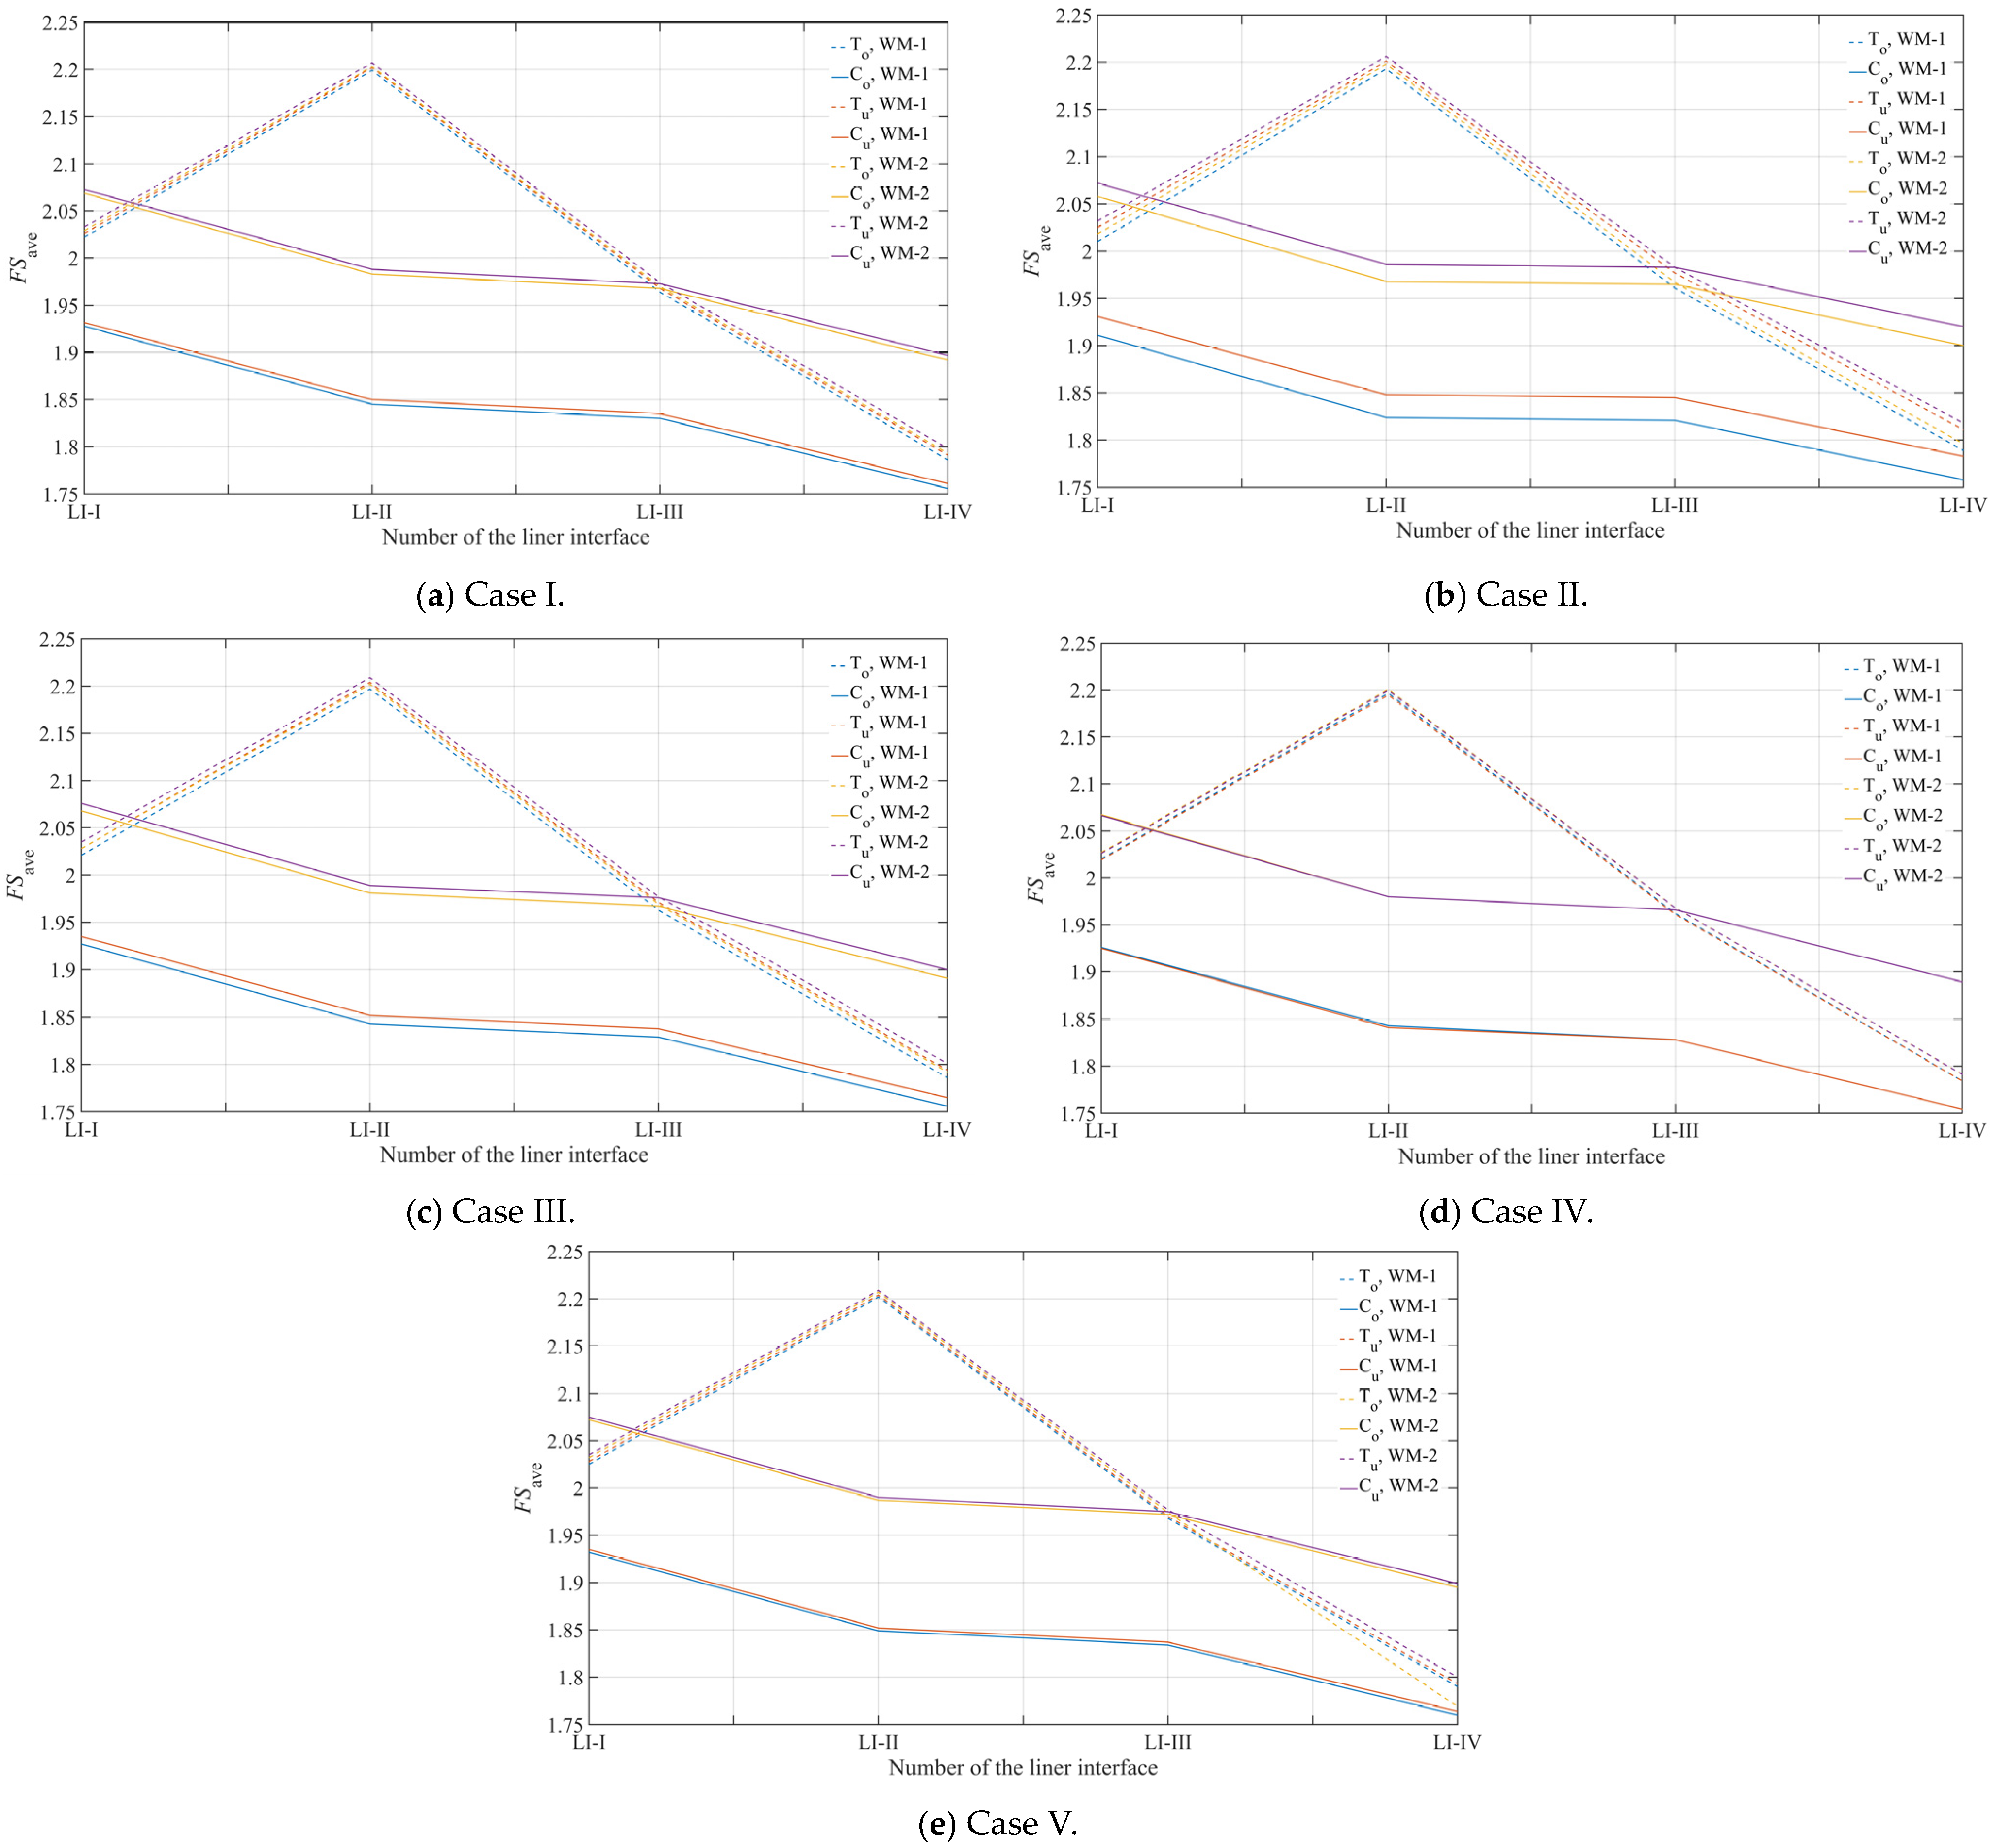
In order to investigate the reliability of the method proposed in this paper in analyzing the stability of the landfill with an engineered berm, the average safety factor, FSave, against composite failure mode was compared with that against translational failure mode. Referring to Technical code [36], the shear strength values of four types of liner interfaces are shown in Table 1. The shear strength of the liner interface can generally reach its peak value at the bottom of the landfill slope, while only residual values can be exerted at its back slope [29]. For the shear strength value of waste mass, any type can be selected according to Technical code [34], i.e., ϕSW = 12°, cSW = 15 kN/m2 (WM-1), while the other type can be selected according to the paper by Chen et al. [37], i.e., ϕSW = 17°, cSW = 6 kN/m2 (WM-2).
For the comparison of safety factors under the action of the engineered berm, the over-berm and under-berm failure modes were considered separately. Under these two failure modes, parameter value combinations for five working conditions are provided as shown in Table 2 and Table 3, respectively. The other unchanged parameter values are as follows: H = 70 m, B = 100 m, α = 18.4°, ω = 14°, θ = 1.1°, DB = 3 m, η = 63.4°, γSW = 10.2 kN/m3, γB = 18 kN/m3.
When analyzing the stability of the landfill slope in Figure 22, T indicates translational failure while C indicates composite failure. In addition, considering the type of failure of the engineered berm, Subscript o represents the over-berm failure mode, and Subscript u represents the under-berm failure mode. The bold font in the above tables suggests that the safety factor calculated for resisting the composite failure mode is lower than the value calculated for resisting the translational failure mode, and the italic bold font implies that the safety factors calculated for resisting the two failure modes are no different.
From Figure 22a–e, it can be seen that FSave calculated against the composite failure mode is smaller than that against the translational failure mode when using WM-1 for waste mass, regardless of whether the instability to the engineered berm is over-berm failure or under-berm failure. In other words, the critical failure mode of the landfill slope at this time is composite. In Figure 22b, when WM-2 is used for waste mass and under-berm failure mode is considered to occur, it can be observed that FSave produced by Cu is almost equal to that produced by Tu under the working condition of LI-III. In other working conditions with WM-2, it can be seen that the critical failure modes of the landfill under conditions of LI-II and LI-III are consistent with the above situation.
For the stability analysis of landfill slopes currently containing composite liner systems, it is necessary to conduct translational failure analysis. However, simultaneously verifying the stability under the composite failure mode can obviously reduce the risk of instability.

5. Conclusions

This paper established a static calculation model for evaluating the stability of a landfill with an engineered berm against composite failure mode. Through relevant assumptions, implicit function equations for the maximum and minimum safety factors under different failure modes of the engineered berm were obtained. The maximum and minimum safety factor values were calculated through MATLAB programming. Through error analysis, it was verified that using the average safety factor instead of the true safety factor to evaluate the static stability of the landfill with an engineered berm against composite failure modes is feasible. Furthermore, the influence of relevant parameters of the engineered berm on the landfill stability and the critical slip surface was analyzed, and the following conclusions were drawn:
(1) When the height of berm remains constant, the ability of the landfill slope to resist over-berm failure can be improved by increasing the value of the angle of the back slope of the berm. In addition, for the over-berm failure mode, a larger value of interface friction angle of liner components beneath the block combined with appropriate apparent cohesion between liner components beneath the block is more conducive to improving the stability of the landfill slope.
(2) Unlike the situation when over-berm failure occurs, a specific height of berm requires a smaller value of the angle of the back slope of the berm to resist under-berm failure. At this point, the combination of the interface friction angle of liner components beneath the block and the apparent cohesion between liner components beneath the block has the opposite effect on the stability of the landfill slope compared to the situation when over-berm failure occurs.
(3) Regardless of over-berm failure or under-berm failure, as the interface friction angle of liner components beneath the block or the apparent cohesion between liner components beneath the block increases, the critical log-spiral slip surface gradually shifts to the right. In addition, the changes in the mechanical parameters of the engineered berm have a significant impact on the horizontal spacing of the critical log-spiral slip surfaces corresponding to the maximum and minimum safety factors in the over-berm failure mode while having little effect on the corresponding horizontal spacing in the under-berm failure mode.
(4) Whether it is over-berm failure or under-berm failure, the geometric and mechanical parameters of the engineered berm have little effect on the transition between translational and composite failure of the landfill slope, while the mechanical parameters of the waste mass have a significant effect.

Author Contributions

Conceptualization, X.R. and Y.-S.L.; methodology, X.R. and H.W.; software, Y.L. and H.W.; validation, Y.L., Y.-S.L. and H.W.; writing—original draft preparation, X.R. and Y.L.; writing—review and editing, Y.-S.L., J.C. and Z.D.; supervision, X.R.; funding acquisition, Y.-S.L. All authors have read and agreed to the published version of the manuscript.

Funding

This research was funded by the Shanghai Rising-Star Program, grant number 21QB1404400.

Institutional Review Board Statement

Not applicable.

Informed Consent Statement

Not applicable.

Data Availability Statement

Data can be acquired upon reasonable request.

Conflicts of Interest

Yu-Shan Luo was employed by the Shanghai Shen Yuan Geotechnical Engineering Co., Ltd. The remaining authors declare that the research was conducted in the absence of any commercial or financial relationships that could be construed as a potential conflict of interest.

References

  1. De Stefano, M.; Gharabaghi, B.; Clemmer, R.; Jahanfar, M.A. Berm design to reduce risks of catastrophic slope failures at solid waste disposal sites. Waste Manag. Res. 2016, 34, 1117–1125. [Google Scholar] [CrossRef] [PubMed]
  2. Jiang, H.; Zhou, X.; Xiao, W. Stability of extended earth berm for high landfill. Appl. Sci. 2020, 10, 6281. [Google Scholar] [CrossRef]
  3. Sheng, H.; Ren, Y.; Huang, M.; Zhang, Z.; Lan, J. Vertical expansion stability of an existing landfill: A case study of a landfill in Xi’an, China. Adv. Civ. Eng. 2021, 2021, 5574238. [Google Scholar] [CrossRef]
  4. Qian, X.; Koerner, R.M. Translational Failure Analysis of Solid Waste Landfills Including Seismicity and Leachate Head Calculations; GRI Report No. 33; Geosynthetic Research Institute, Drexel University: Philadelphia, PA, USA, 2007. [Google Scholar]
  5. Tu, F.; Wu, X.; Wang, Q. Consistent model of translational failure analysis of sanitary landfills with refuse dam. Chin. J. Rock Mech. Eng. 2009, 28, 1928–1935. (In Chinese) [Google Scholar]
  6. Qian, X.; Koerner, R.M. Stability analysis when using an engineered berm to increase landfill space. J. Geotech. Geoenviron. Eng. 2009, 135, 1082–1091. [Google Scholar] [CrossRef]
  7. Liu, C.; Shi, J.; Lv, Y.; Shao, G. A modified stability analysis method of landfills dependent on gas pressure. Waste Manag. Res. 2021, 39, 784–794. [Google Scholar] [CrossRef]
  8. Annapareddy, V.S.R.; Pain, A.; Sufian, A.; Godas, S.; Scheuermann, A. Influence of heterogeneity and elevated temperatures on the seismic translational stability of engineered landfills. Waste Manag. 2023, 158, 1–12. [Google Scholar] [CrossRef]
  9. Li, J.; Chen, R.; Lin, H. Limit equilibrium analysis of landfill instability based on actual failure surface. Appl. Sci. 2023, 13, 10498. [Google Scholar] [CrossRef]
  10. Zhang, W.; Han, L.; Gu, X.; Wang, L.; Chen, F.; Liu, H. Tunneling and deep excavations in spatially variable soil and rock masses: A short review. Undergr. Space 2022, 7, 380–407. [Google Scholar] [CrossRef]
  11. Sun, S.L.; Ruan, X.B. Seismic stability for landfills with a triangular berm using pseudo-static limit equilibrium method. Environ. Earth Sci. 2013, 68, 1465–1473. [Google Scholar] [CrossRef]
  12. Qian, X.; Koerner, R.M.; Gray, D.H. Translational failure analysis of landfills. J. Geotech. Geoenviron. Eng. 2003, 129, 506–519. [Google Scholar] [CrossRef]
  13. Qian, X.; Koerner, R.M. Effect of apparent cohesion on translational failure analyses of landfills. J. Geotech. Geoenviron. Eng. 2004, 130, 71–80. [Google Scholar] [CrossRef]
  14. Qian, X. Limit equilibrium analysis of translational failure of landfills under different leachate buildup conditions. Water Sci. Eng. 2008, 1, 44–62. [Google Scholar]
  15. Qian, X.; Koerner, R.M. Modification to translational failure analysis of landfills incorporating seismicity. J. Geotech. Geoenviron. Eng. 2010, 136, 718–727. [Google Scholar] [CrossRef]
  16. Feng, S.J.; Chen, Y.M.; Gao, G.Y. Analysis on translational failure of landfill along the underlying liner system. Chin. J. Geotech. Eng. 2007, 29, 20–25. (In Chinese) [Google Scholar]
  17. Feng, S.; Chen, Y.; Gao, G.; Zhang, J.X. Effects of retaining wall and interface strength on translational failure of landfill along underlying liner system. Chin. J. Rock Mech. Eng. 2007, 26, 149–155. (In Chinese) [Google Scholar]
  18. Feng, S.J.; Chen, Y.M.; Gao, L.Y.; Gao, G.Y. Translational failure analysis of landfill with retaining wall along the underlying liner system. Environ. Earth Sci. 2010, 60, 21–34. [Google Scholar] [CrossRef]
  19. Feng, S.J.; Gao, L.Y. Seismic analysis for translational failure of landfills with retaining walls. Waste Manag. 2010, 30, 2065–2073. [Google Scholar] [CrossRef]
  20. Gao, D.; Zhu, B.; Chen, Y. Three-part wedge method for tanslational sliding analyses of landfills retained by a toe dam. Chin. J. Rock Mech. Eng. 2007, 26 (Suppl. S2), 4378–4385. (In Chinese) [Google Scholar]
  21. Chen, Y.M.; Gao, D.; Zhu, B.; Chen, R.P. Seismic stability and permanent displacement analysis of a solid waste landfill along geosynthetic interface. Sci. China Technol. 2008, 38, 79–94. [Google Scholar]
  22. Choudhury, D.; Savoikar, P. Seismic stability analysis of expanded MSW landfills using pseudo-static limit equilibrium method. Waste Manag. Res. 2011, 29, 135–145. [Google Scholar] [CrossRef] [PubMed]
  23. Ruan, X.B.; Sun, S.L.; Liu, W.L. Effect of the amplification factor on seismic stability of expanded municipal solid waste landfills using the pseudo-dynamic method. J. Zhejiang Univ.-Sci. A 2013, 14, 731–738. [Google Scholar] [CrossRef]
  24. Ruan, X.B.; Lin, H. Relationship between shear wave wavelength and pseudo-dynamic seismic safety factor in expanded landfill. Arab. J. Sci. Eng. 2015, 40, 2271–2288. [Google Scholar] [CrossRef]
  25. Chen, D.; Chen, Y.; Ye, W.; Ye, D.; Lai, Q. Calculation and analysis of stability of landfills under blasting vibration loads. Chinese J. Geotech. Eng. 2024, 46, 1067–1076. [Google Scholar]
  26. Mahapatra, S.; Basha, B.M.; Manna, B. Leachate Pressure Effect on a System Reliability-Based Design of Reinforced Soil Walls for a Vertical Expansion of MSW Landfills. Int. J. Geomech. 2023, 23, 04023027. [Google Scholar] [CrossRef]
  27. Koerner, R.M.; Soong, T.Y. Leachate in landfills: The stability issues. Geotext. Geomembr. 2000, 18, 293–309. [Google Scholar] [CrossRef]
  28. Zhang, W.; Lin, S.; Wang, L.; Jiang, X.; Wang, S. A novel creep contact model for rock and its implement in discrete element simulation. Comput. Geotech. 2024, 167, 106054. [Google Scholar] [CrossRef]
  29. Thiel, R.S. Peak vs. residual shear strength for landfill bottom liner stability analyses. In Proceedings of the 15th Annual GRI Conference Hot Topics in Geosynthetics—II, Houston, TX, USA, 13–14 December 2001; Geosynthetics Institute: Folsom, PA, USA, 2001. [Google Scholar]
  30. Fowmes, G.; Dixon, N.; Jones, D.R.V. Landfill stability and integrity: The UK design approach. Proc. Inst. Civ. Eng. Waste Resour. Manag. 2007, 160, 51–61. [Google Scholar] [CrossRef]
  31. Ruan, X.B.; Wang, H.W.; Luo, Y.S.; Hou, C. Composite failure analysis of municipal solid waste landfill cell stability. Iran. J. Sci. Technol. Trans. Civ. Eng. 2022, 46, 2325–2343. [Google Scholar] [CrossRef]
  32. Ruan, X.B.; Yue, Q.S.; Zhu, D.Y.; Sun, S. Seismic stability analysis for composite failure of landfills. In Proceedings of the IACGE 2018, Philadelphia, PA, USA, 23–25 October 2018; pp. 549–556. [Google Scholar]
  33. Leshchinsky, D.; San, K.C. Pseudostatic seismic stability of slopes: Design charts. J. Geotech. Eng. 1994, 120, 1514–1532. [Google Scholar] [CrossRef]
  34. Ruan, X.; Luo, Y.-S.; Yan, J.; Zhang, L. Seismic internal stability of bilinear geosynthetic-reinforced slopes with cohesive backfills. Soil Dyn. Earthq. Eng. 2021, 143, 106599. [Google Scholar] [CrossRef]
  35. Whitman, R.V.; Bailey, W.A. Use of computers for slope stability analysis. J. Soil Mech. Found. Div. 1967, 93, 475–498. [Google Scholar] [CrossRef]
  36. Ministry of Housing and Urban-Rural Development of the People’s Republic of China. Technical Code for Geotechnical Engineering of Municipal Solid Waste Sanitary Landfill; CJJ 176-2012; China Architecture & Building Press: Beijing, China, 2012. (In Chinese)
  37. Chen, Y.M.; Wang, L.Z.; Hu, Y.Y.; Wu, S.M.; Zhang, Z.Y. Stability analysis of a solid waste landfill slope. China Civ. Eng. J. 2000, 33, 92–97. (In Chinese) [Google Scholar]
Figure 1. Forces acting on three wedges in the landfill when over-berm failure occurs.
Applsci 14 11515 g001
Figure 2. Forces acting on three wedges in the landfill when under-berm failure occurs.
Applsci 14 11515 g002
Figure 3. Forces acting on the block wedge when over-berm failure occurs.
Applsci 14 11515 g003
Figure 4. Forces acting on the log-spiral failure body when over-berm failure occurs.
Applsci 14 11515 g004
Figure 5. Forces acting on the passive wedge when over-berm failure occurs.
Applsci 14 11515 g005
Figure 6. Forces acting on the block wedge when under-berm failure occurs.
Applsci 14 11515 g006
Figure 7. Forces acting on the log-spiral failure body when under-berm failure occurs.
Applsci 14 11515 g007
Figure 8. Forces acting on the passive wedge when under-berm failure occurs.
Applsci 14 11515 g008
Figure 9. FSmax, FSmin, FSave, and Δ vary with HB when over-berm failure occurs.
Applsci 14 11515 g009
Figure 10. FSmax, FSmin, FSave, and Δ vary with ξ when over-berm failure occurs.
Applsci 14 11515 g010
Figure 11. FSmax, FSmin, FSave, and Δ vary with δB when over-berm failure occurs.
Applsci 14 11515 g011
Figure 12. FSmax, FSmin, FSave, and Δ vary with cB when over-berm failure occurs.
Applsci 14 11515 g012
Figure 13. FSmax, FSmin, FSave, and Δ vary with HB when under-berm failure occurs.
Applsci 14 11515 g013
Figure 14. FSmax, FSmin, FSave, and Δ vary with ξ when under-berm failure occurs.
Applsci 14 11515 g014
Figure 15. FSmax, FSmin, FSave, and Δ vary with δB when under-berm failure occurs.
Applsci 14 11515 g015
Figure 16. FSmax, FSmin, FSave, and Δ vary with cB when under-berm failure occurs.
Applsci 14 11515 g016
Figure 17. The effect of ξ and HB on FSave when over-berm failure occurs.
Applsci 14 11515 g017
Figure 18. The effect of δB and cB on FSave when over-berm failure occurs.
Applsci 14 11515 g018
Figure 19. The effect of ξ and HB on FSave when under-berm failure occurs.
Applsci 14 11515 g019
Figure 20. The effect of δB and cB on FSave when under-berm failure occurs.
Applsci 14 11515 g020
Figure 21. The influence of δB and cB on critical log-spiral slip surface, respectively.
Applsci 14 11515 g021
Figure 22. FSave against translational and composite failure modes, respectively, in different cases.
Applsci 14 11515 g022
Table 1. Peak and residual shear strength values of four types of liner interfaces at bottom and back slope, respectively.
NoLiner InterfacePeak Shear StrengthResidual Shear Strength
δP (°)cP (kN/m2)δA (°) cA (kN/m2)
LI-IGMX1/GT2305152
LI-IIGMX/CCL327101810
LI-IIIGMX/GCL283160
LI-IVGT/GN4270140
Table 2. Geometric and mechanical parameters for the engineered berm when over-berm failure occurs.
Case ICase IICase IIICase IVCase V
HB (m) 310333
ξ (°) 26.626.618.426.626.6
δB (°) 1818181018
cB (kN/m2) 11.511.511.511.520
Table 3. Geometric and mechanical parameters for the engineered berm when under-berm failure occurs.
Case ICase IICase IIICase IVCase V
HB (m) 310333
ξ (°) 26.626.618.426.626.6
δB (°) 3232322032
cB (kN/m2) 888812
Disclaimer/Publisher’s Note: The statements, opinions and data contained in all publications are solely those of the individual author(s) and contributor(s) and not of MDPI and/or the editor(s). MDPI and/or the editor(s) disclaim responsibility for any injury to people or property resulting from any ideas, methods, instructions or products referred to in the content.