
MuIm: Analyzing Music–Image Correlations from an Artistic Perspective


Abstract
1. Introduction
- Exploring Multilayered Music–Image Correlation: To the best of our knowledge, we are pioneers in exploring the correlation of music–image data from an artistic perspective, incorporating multilayered information that encompasses both semantic and emotional dimensions within these modalities.
- Introduction of the MuIm Dataset: We introduce a novel, comprehensive dataset named MuIm, which is divided into two segments: artistic Music–Art and realistic Music–Image datasets. This dataset enables the study of music–image correlations by integrating both semantic and emotional data, utilizing a hybrid emotion model to capture complex, layered emotions within artistic content.
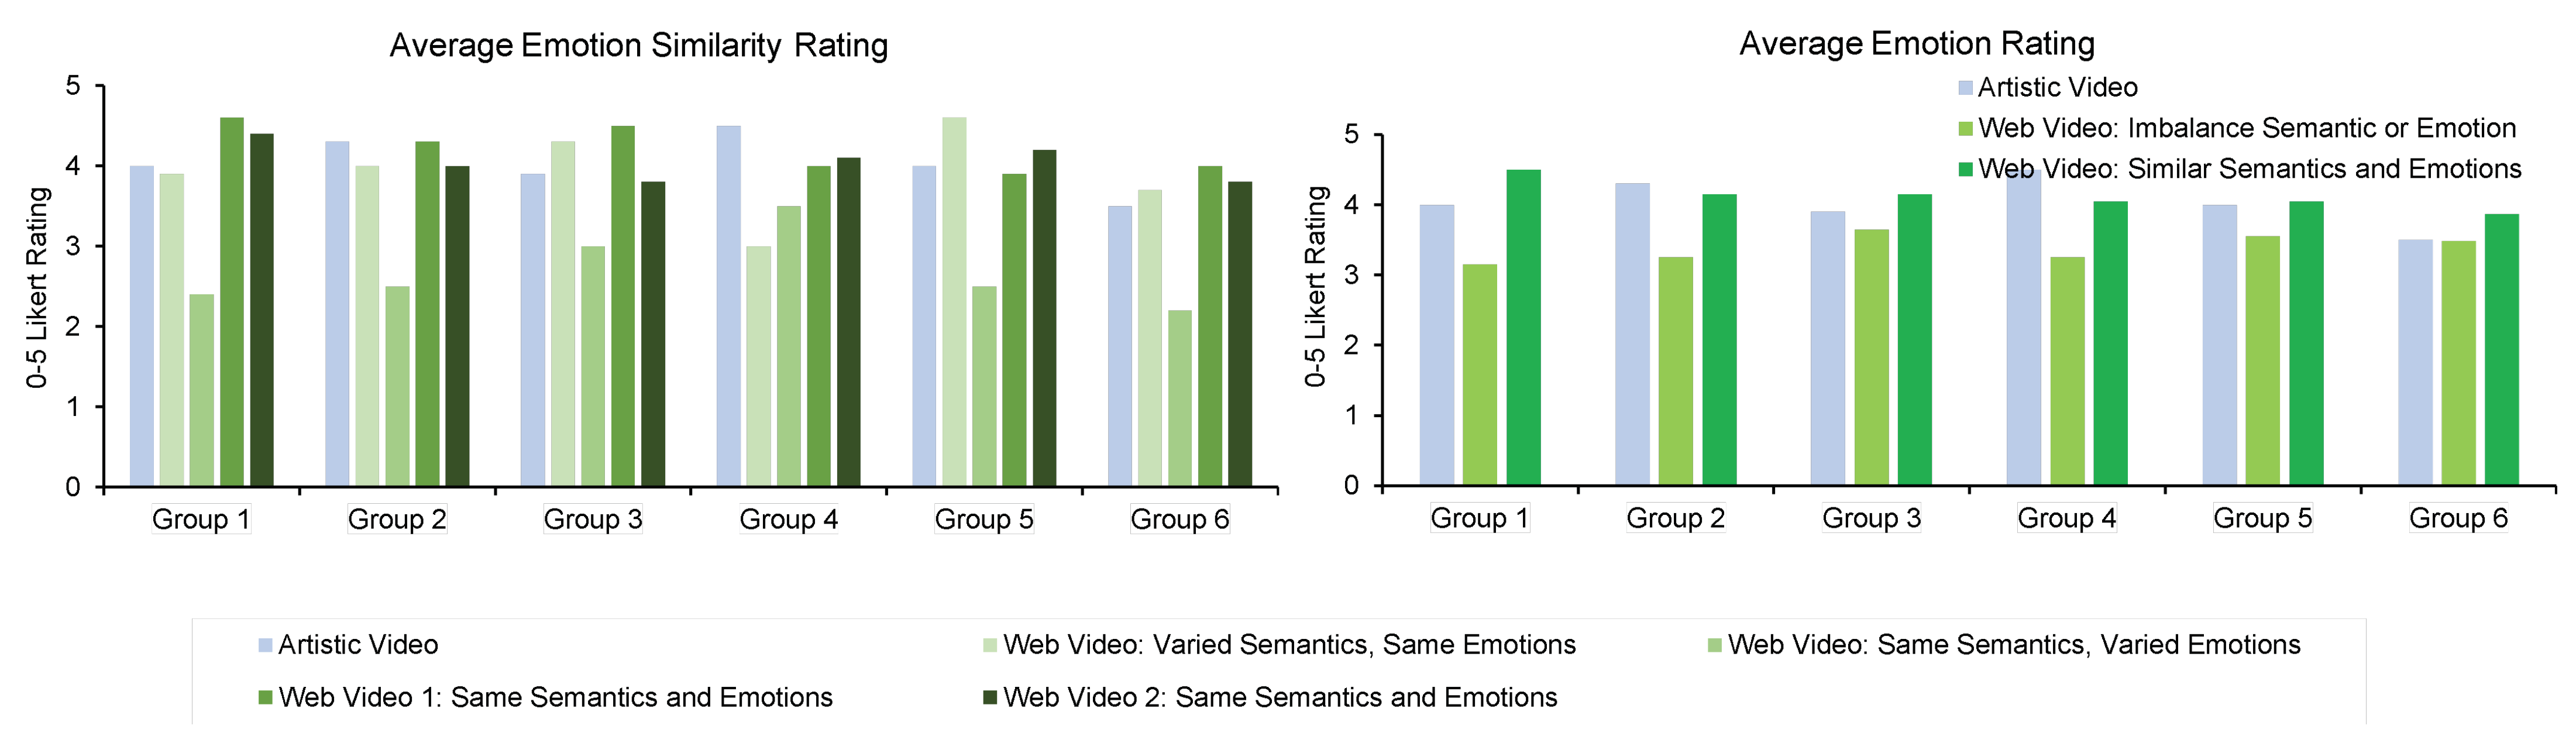
- Evaluation and Validation of the Dataset: Our statistical analysis validated the dataset’s balanced emotional and semantic diversity, emphasizing its superiority over existing datasets. A user study further confirmed the strong emotional alignment, particularly with multi-dimensional emotion vectors, and high participant ratings for pairs with well-matched semantic and emotional content.
2. Related Work
2.1. State-of-the-Art Methods in Music–Image Correlation
2.1.1. Semantic Relation
2.1.2. Non-Semantic Relation
2.2. Emotional Models in Art and Music
3. Multi-Layered Music–Image Correlation
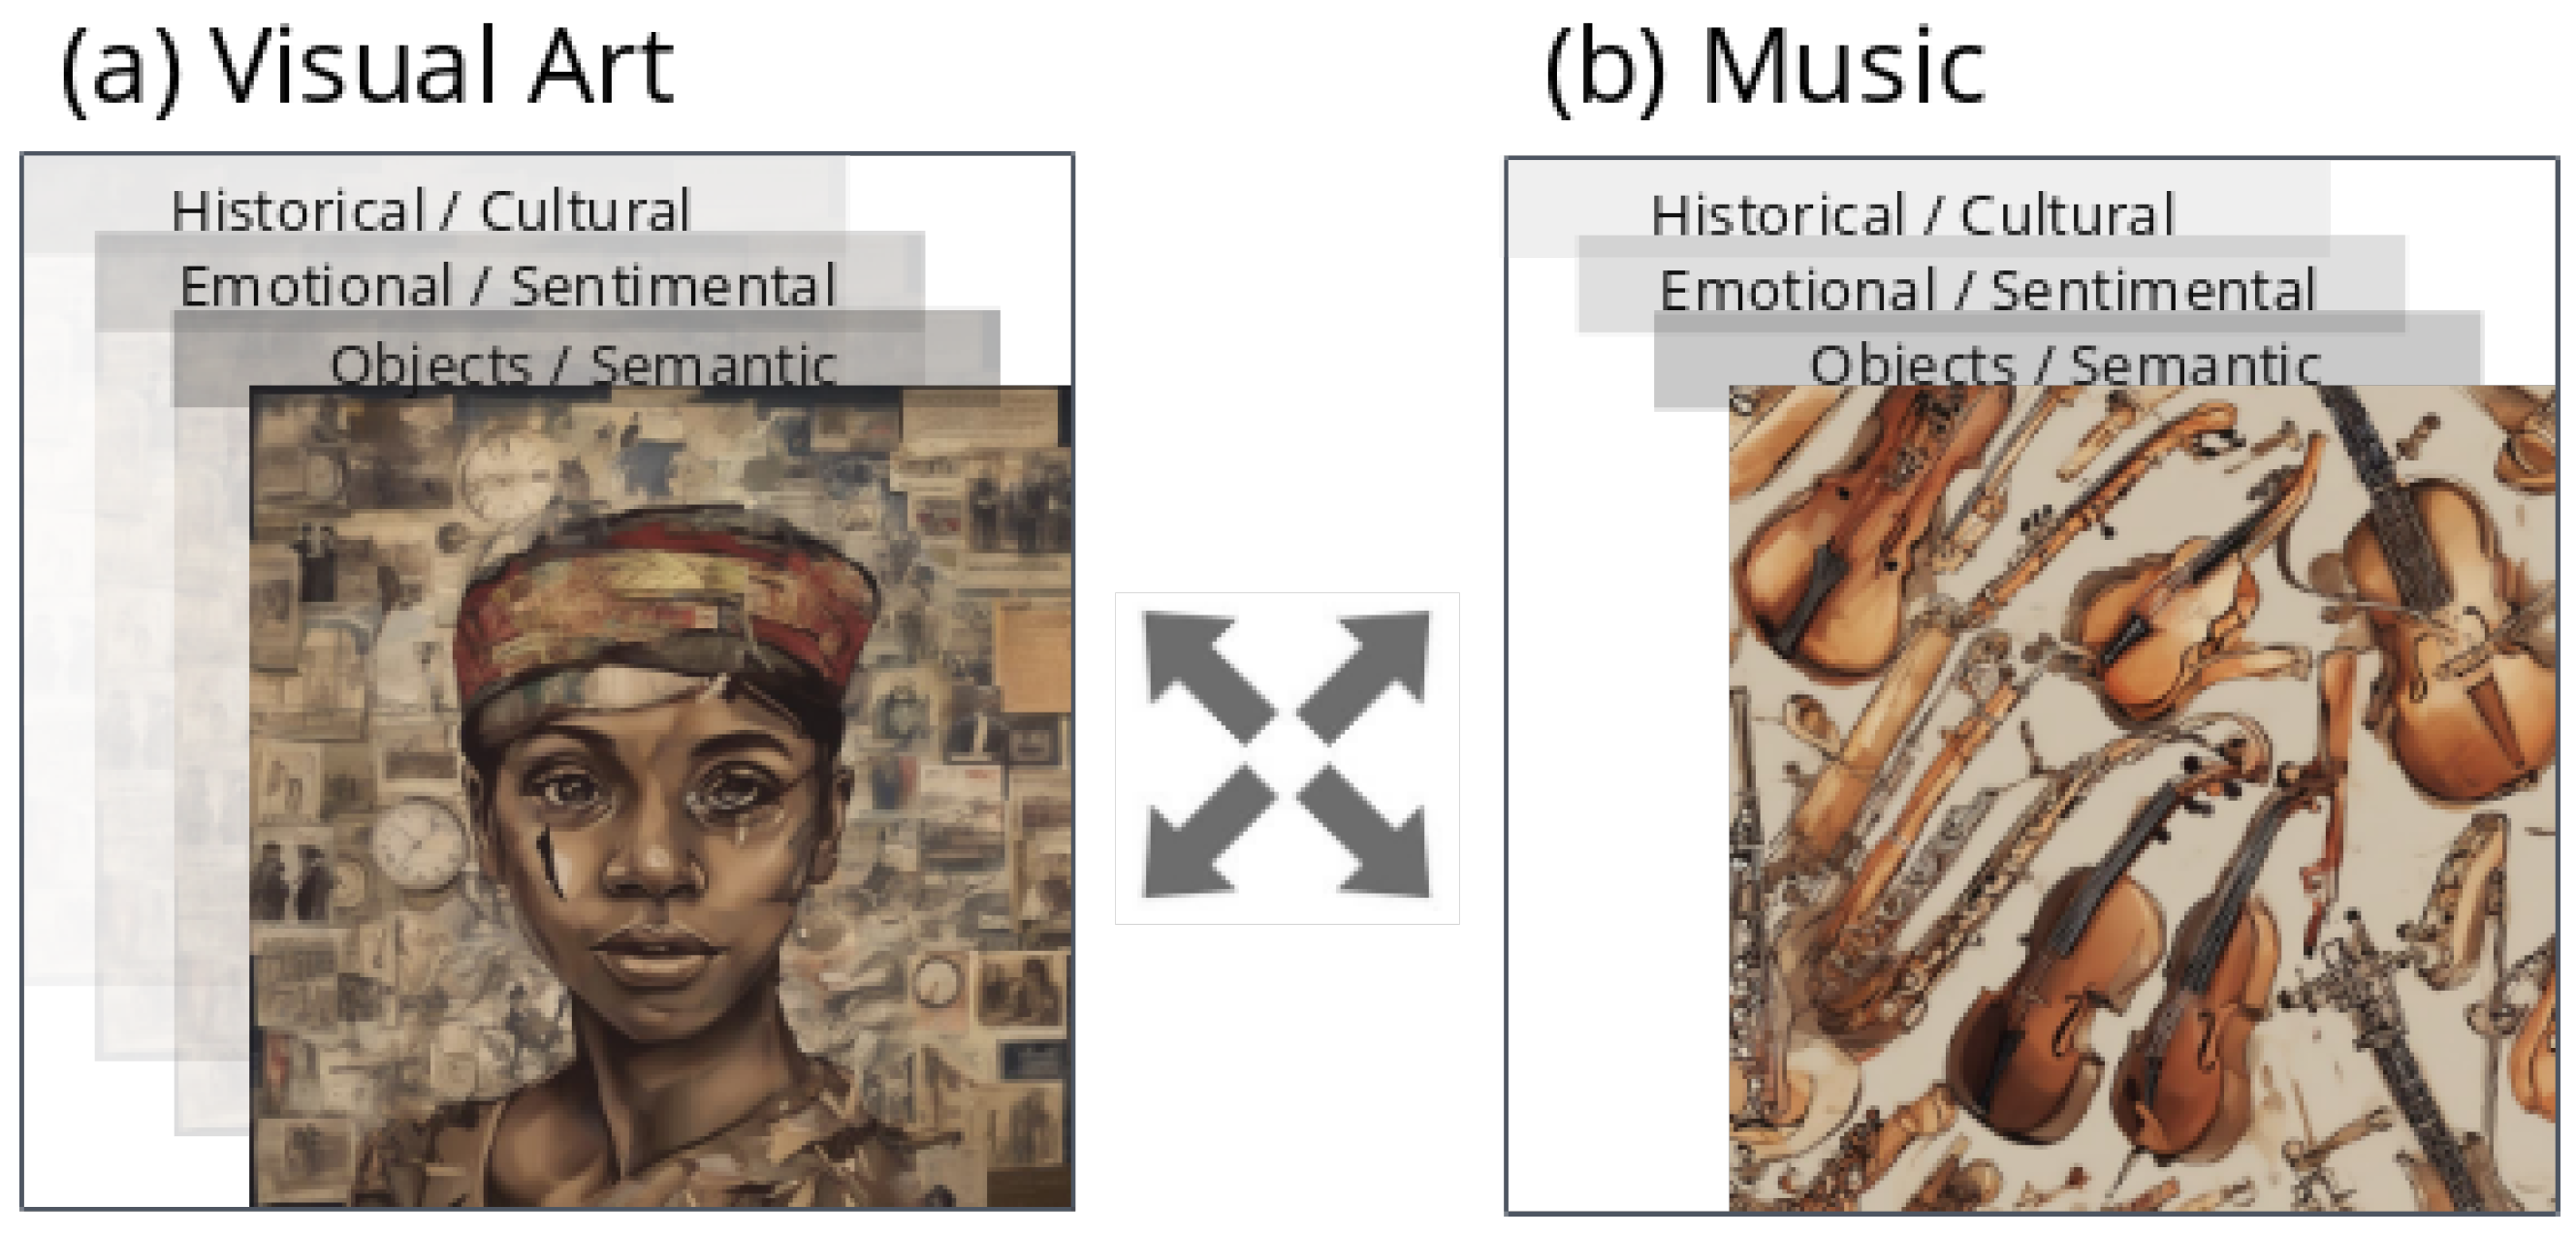
3.1. Analysis of Multilayered Information
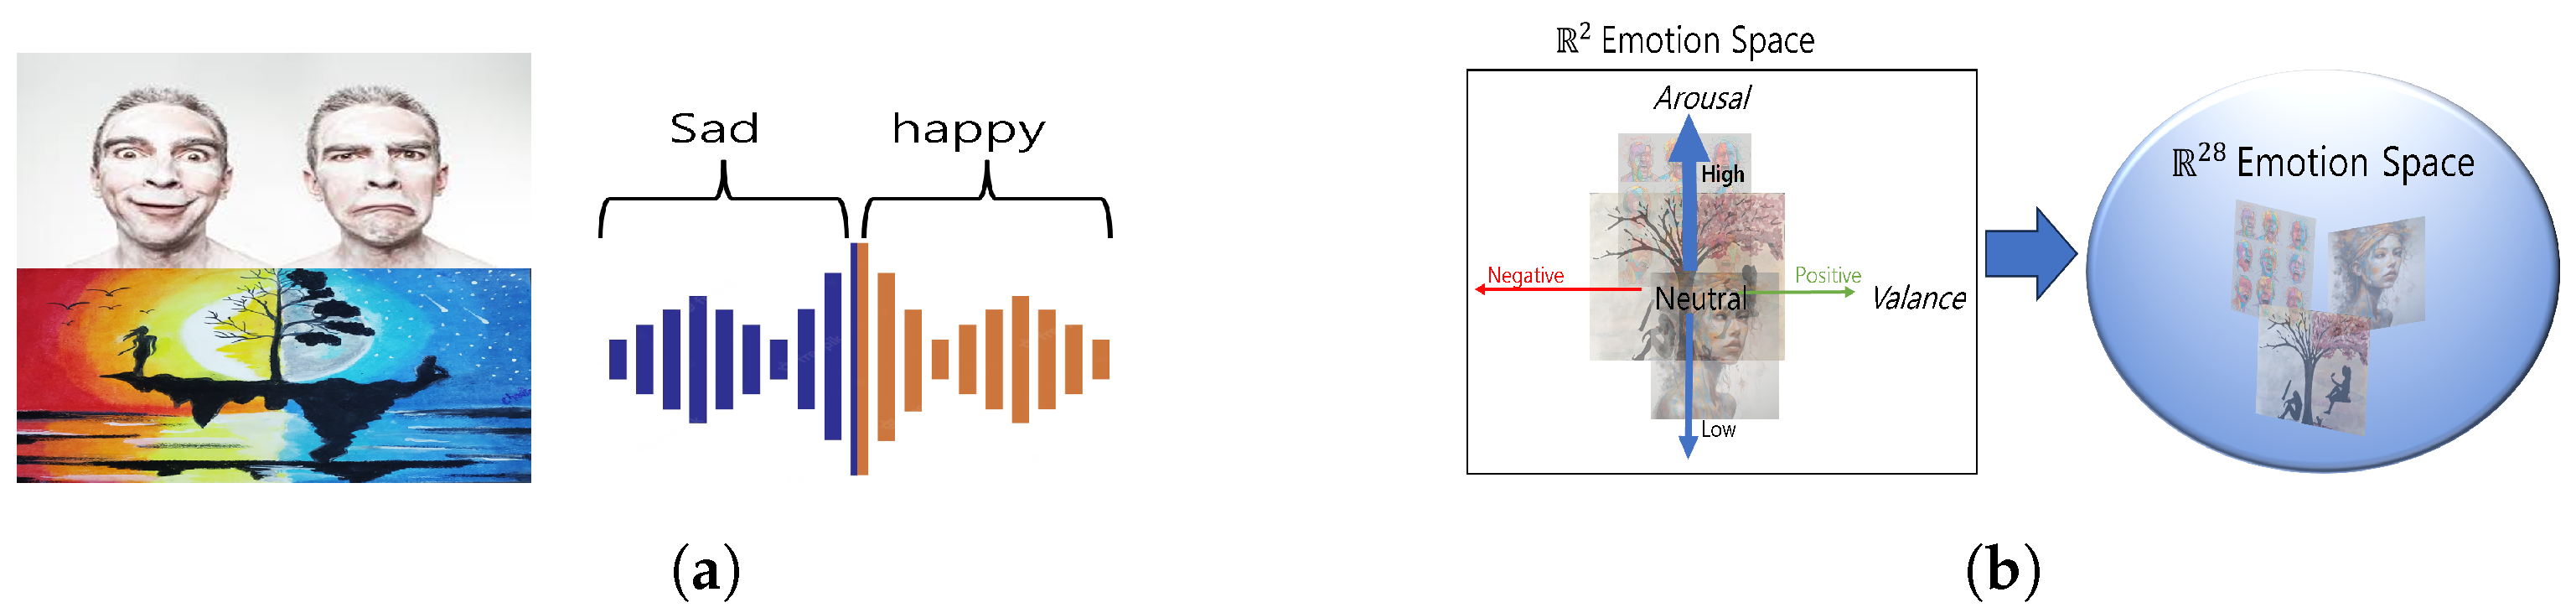
3.2. Artistic Media: Emotional Complexity
- Categorical Component: Utilizes 28 distinct emotions, aligning with CES by defining clear emotion categories.
- Dimensional Component: Adds a 9-point Likert scale to capture emotion intensity, similarly to VA-DES, for nuanced representation.
- Hybrid Nature: Supports multiple emotions per input, blending categorical and intensity-based approaches for complex overlapping emotional states.
Realistic Media: Layered Information
- Contextual/Historical Layer [44]: While providing insights into the origin, significance, or intention of the content, such as historical periods or social concepts, this layer was not included in this study to maintain simplicity.
3.3. Limitations of Current State-of-the-Art Methods
4. MuIm Dataset
4.1. Data Acquisition and Labeling
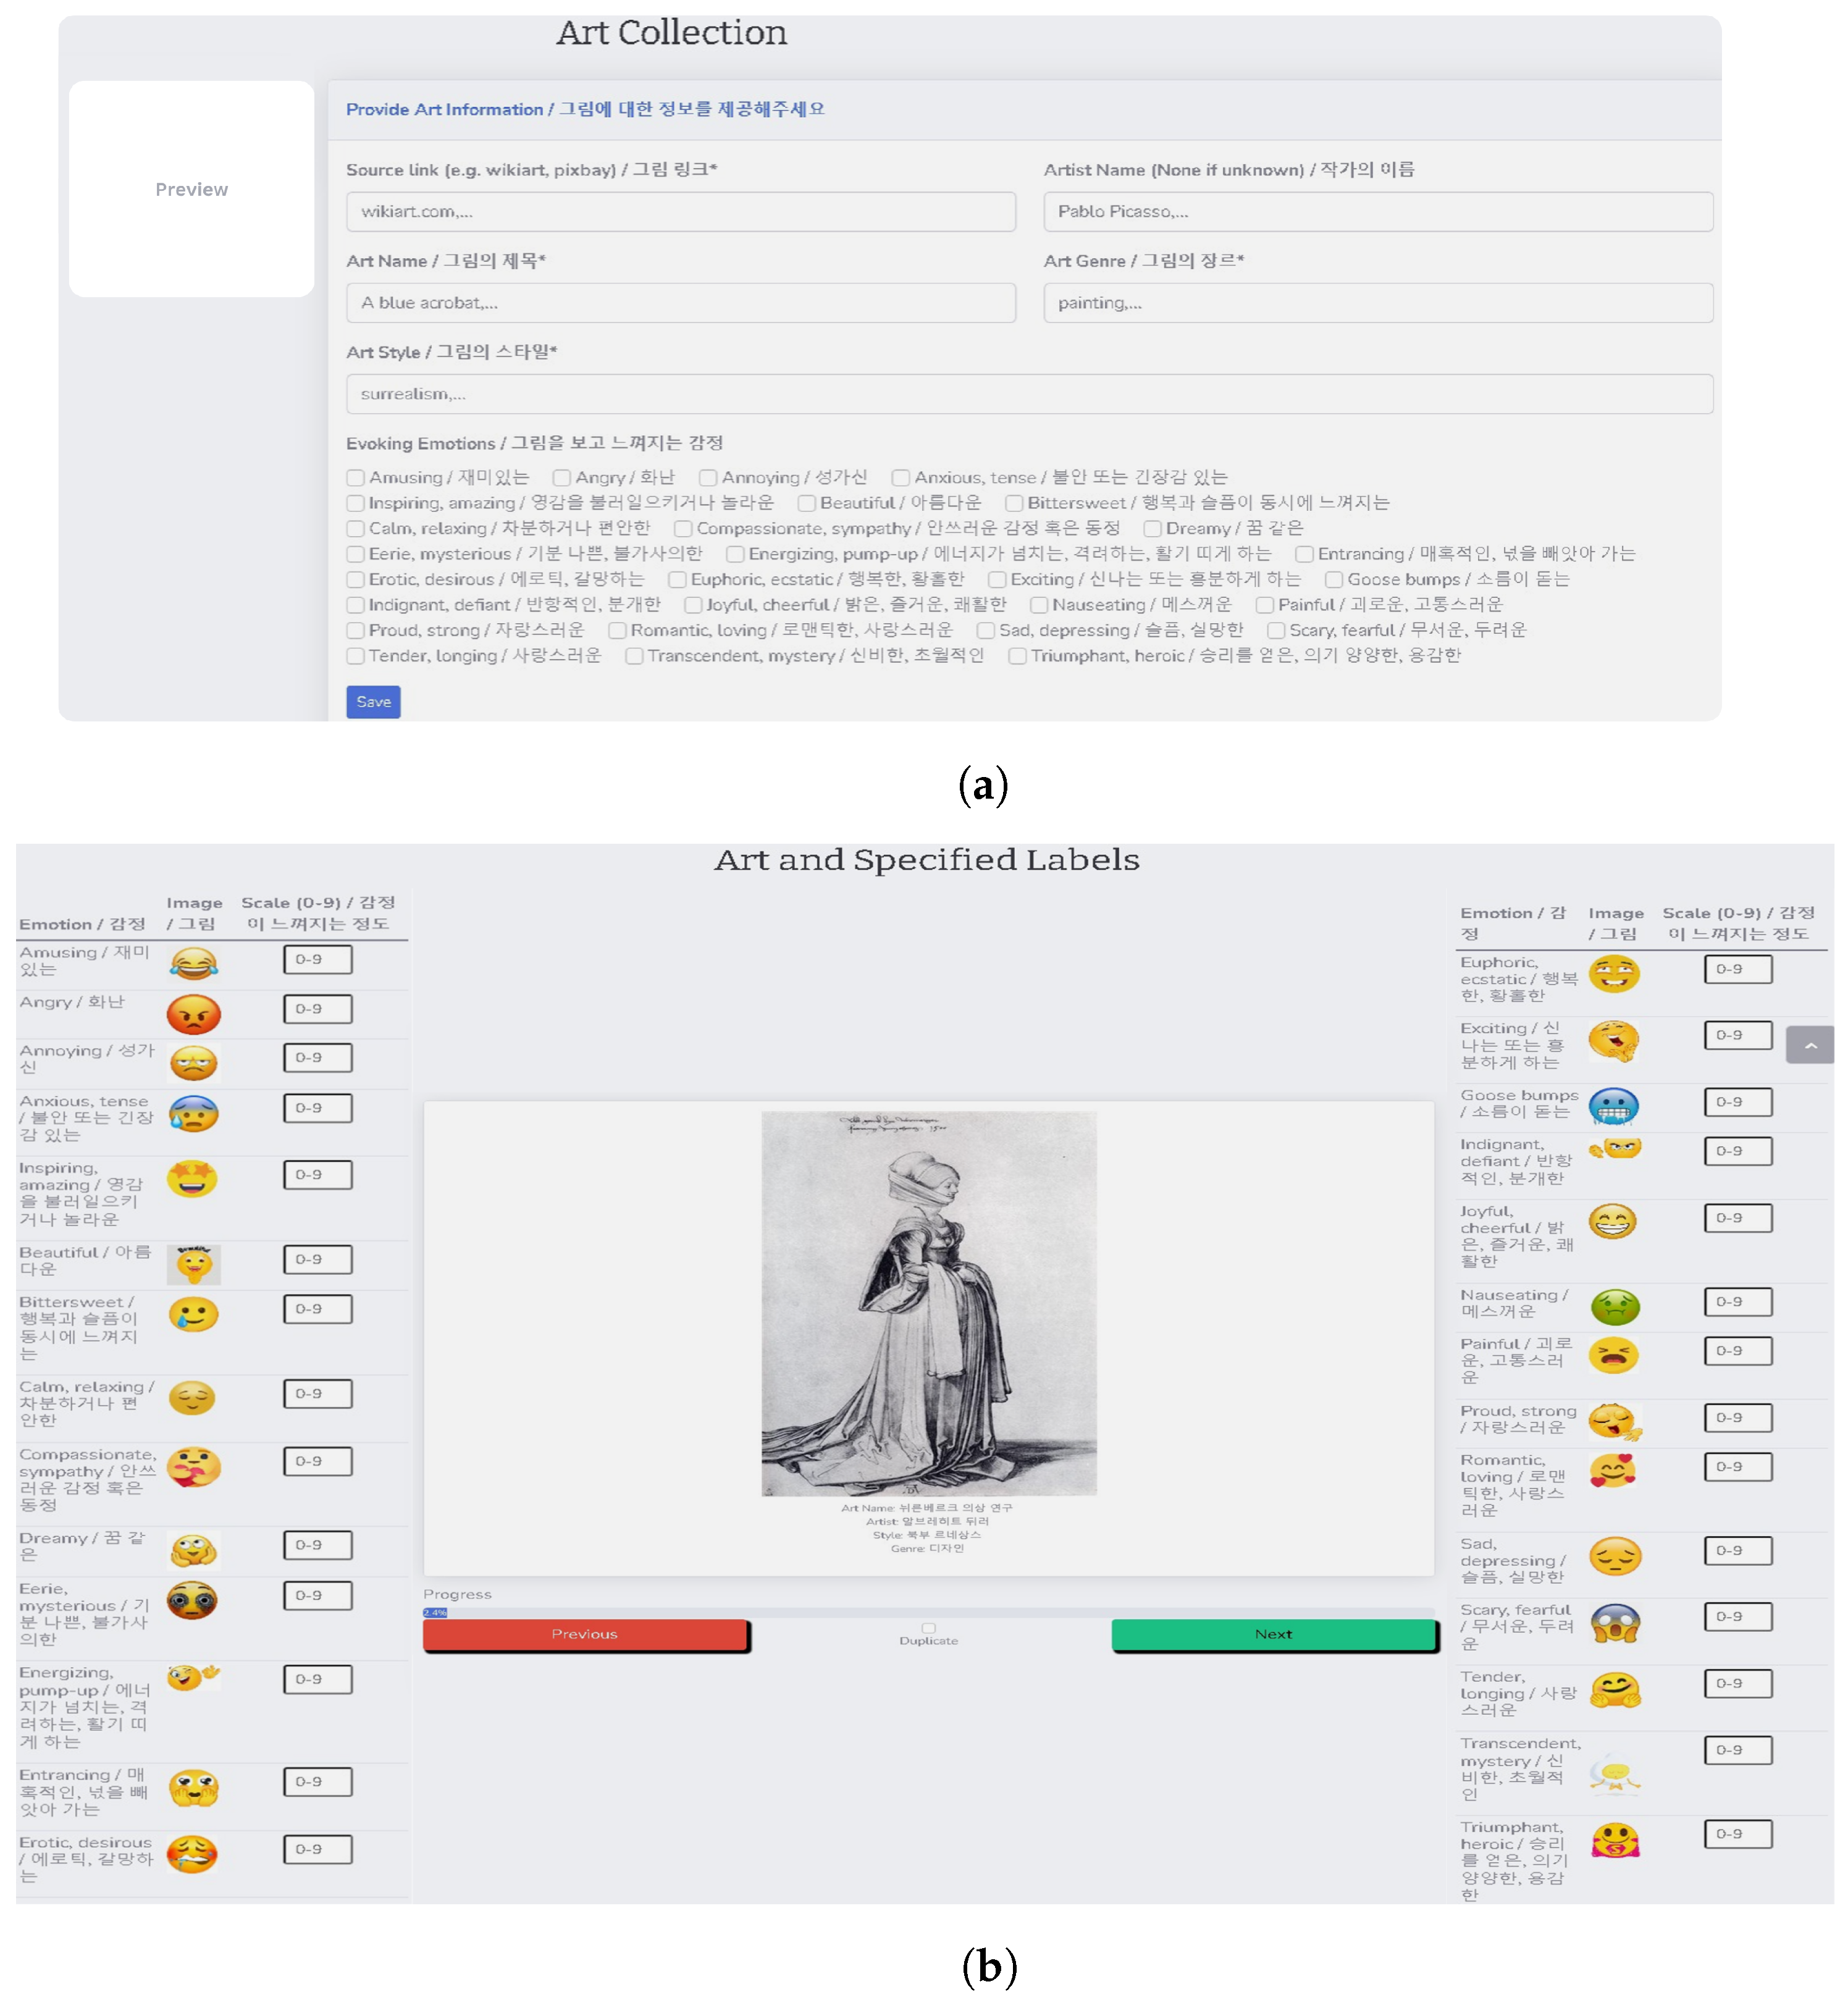
4.1.1. Artistic Segment
4.1.2. Realistic Segment
- Web Media Metadata Collection: Due to the large volume of web data and limitations imposed by the hardware and bandwidth, URLs and human-defined tags were gathered to provide initial metadata, ensuring that only relevant data for our task were downloaded and processed.
- Tag Pre-processing: Media URLs without tags were filtered out, and word tags were validated using transformer models, such as GPT-3, to ensure semantic accuracy and remove invalid tags.
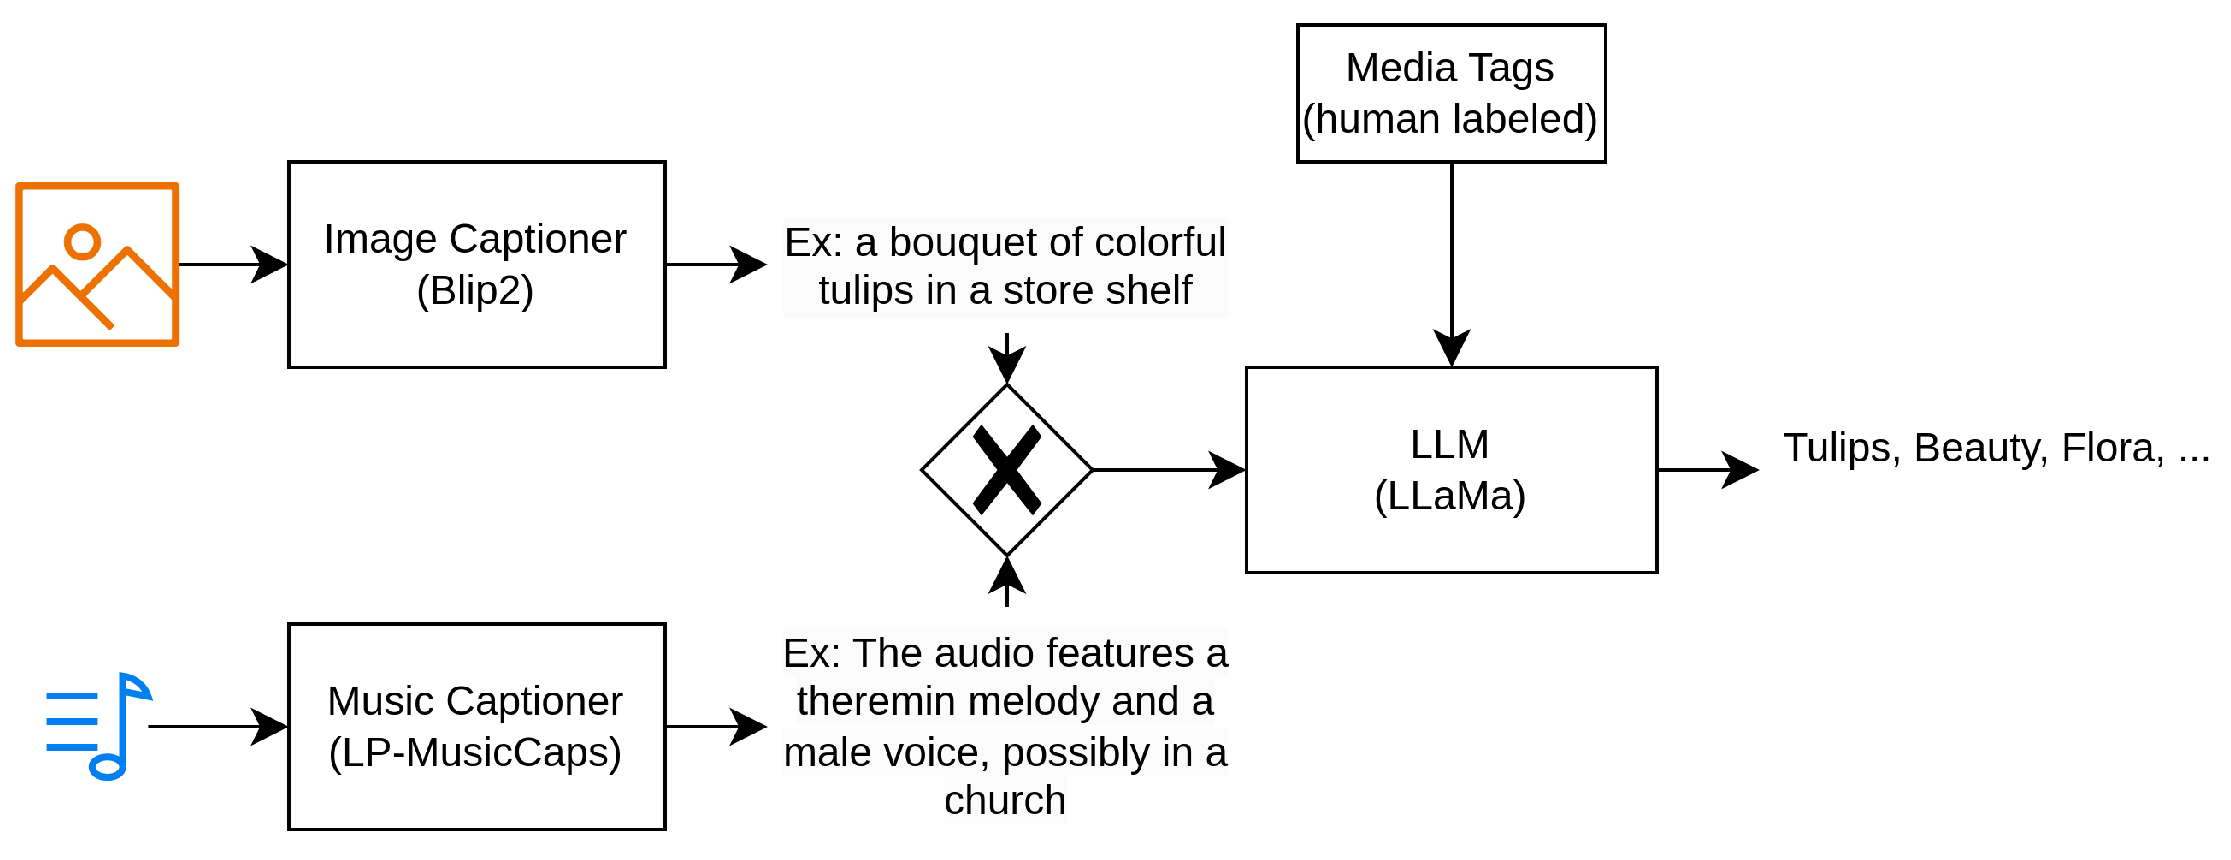
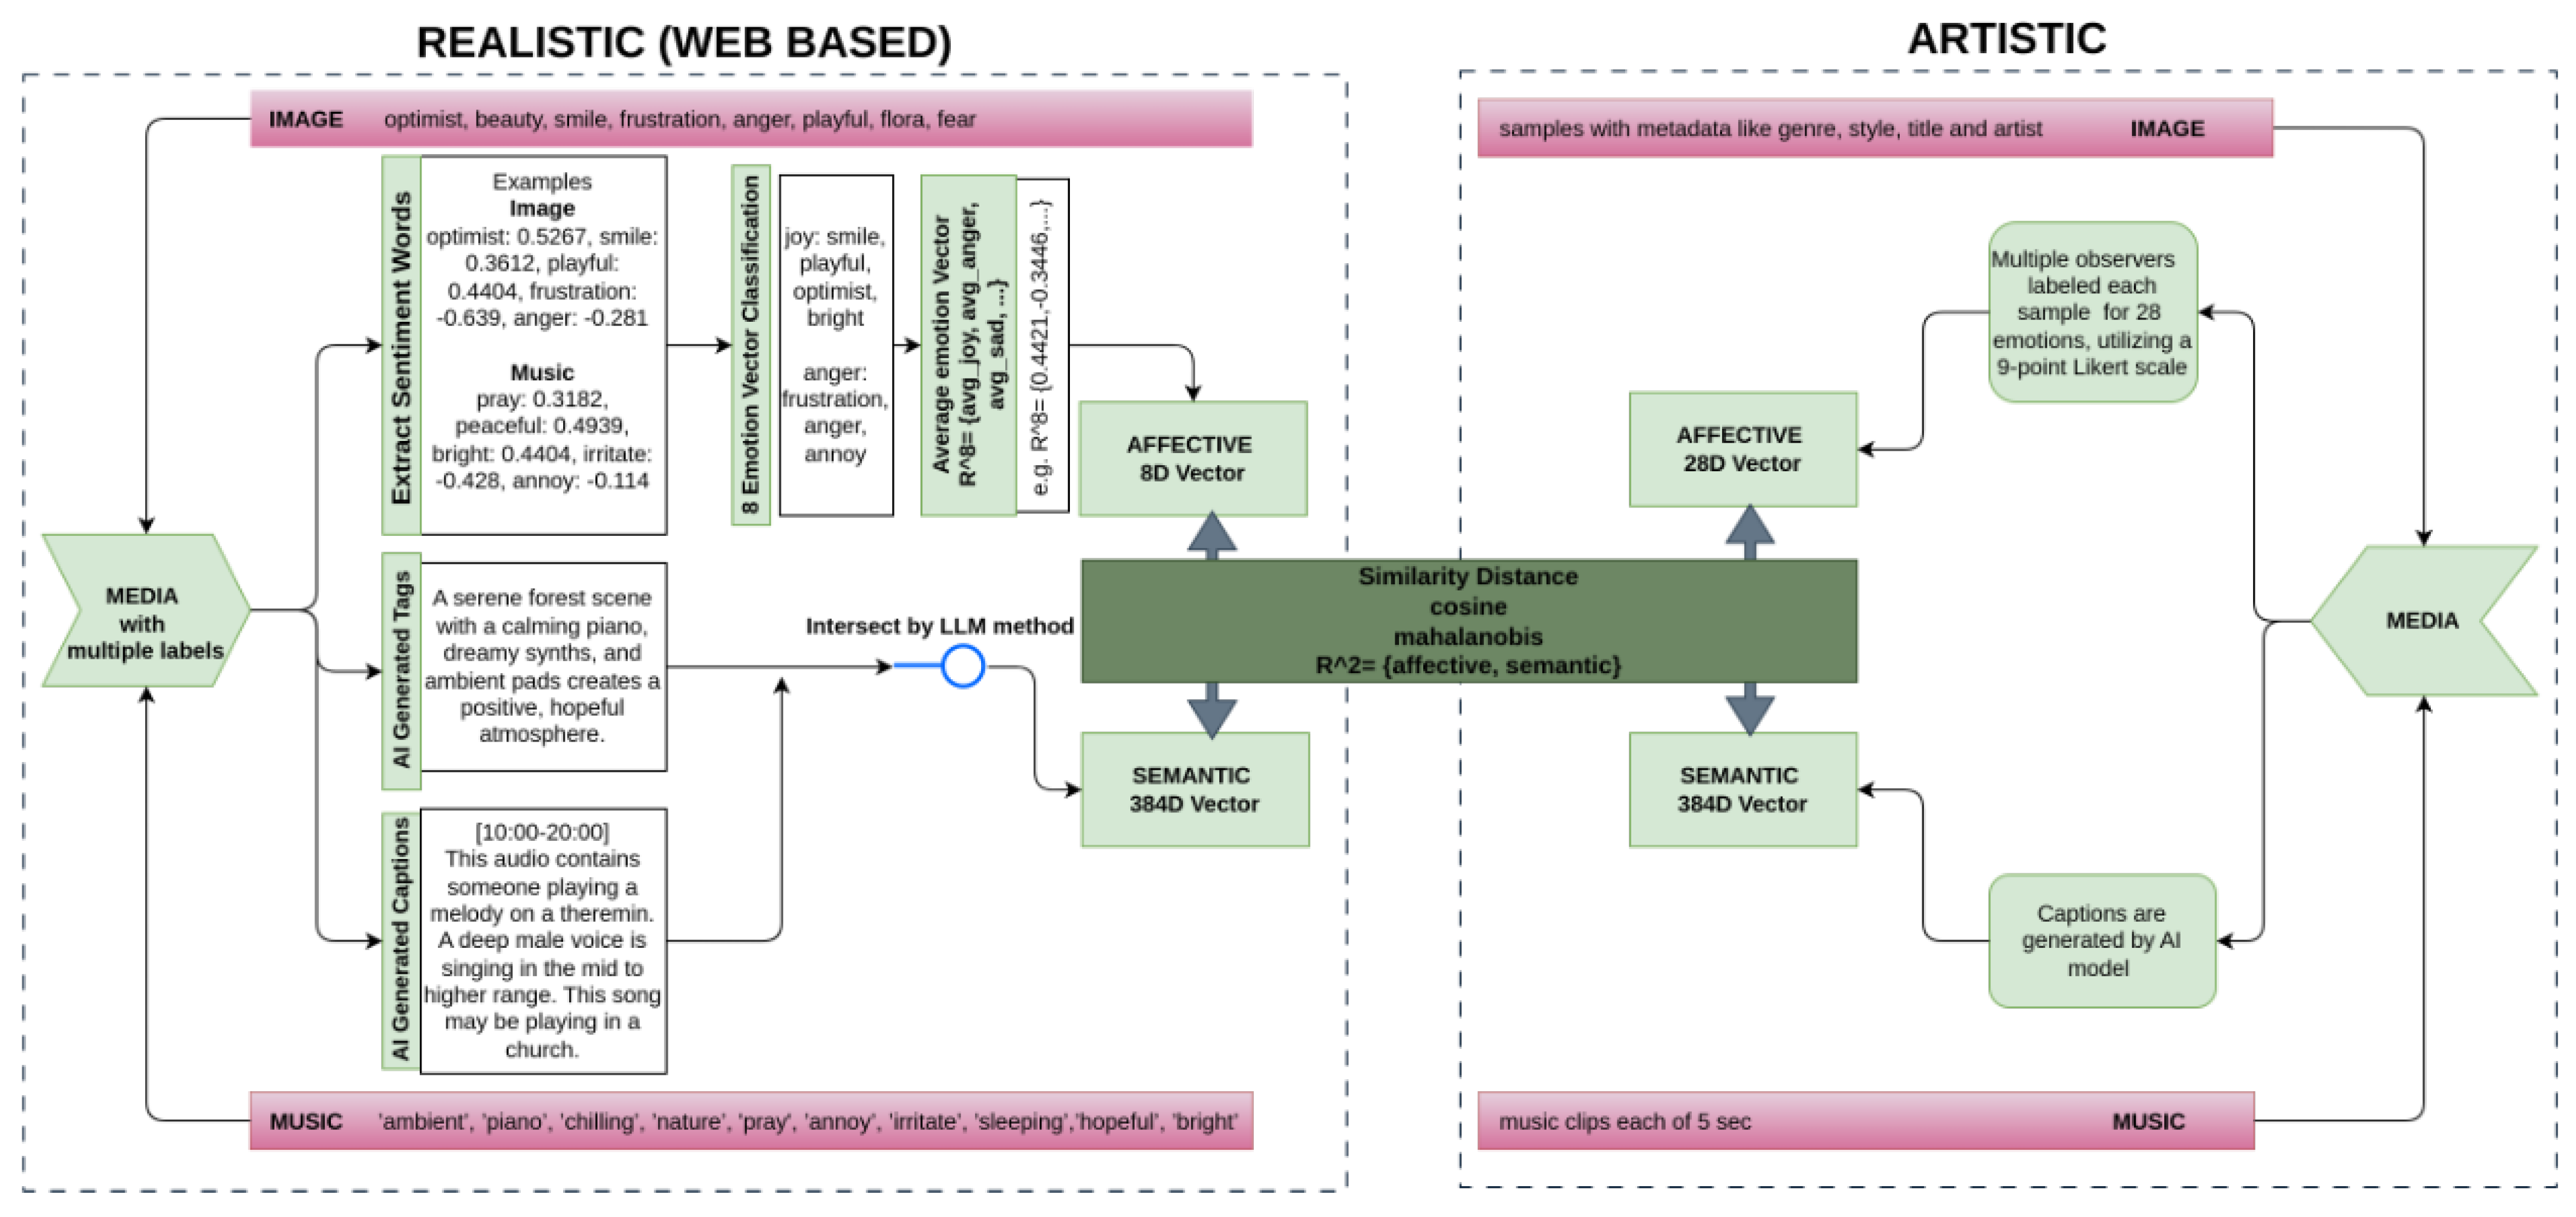
- Assurance of Emotional and Semantic Tags: Music data included separate mood tags, which, when combined with user-defined tags, provided accurate emotional information, while semantic tagging relied primarily on user-defined tags. In contrast, image data depended solely on user-defined tags for both emotional and semantic labeling. Due to potential noise, contextual variability, or inaccuracies in user-defined tags, a processing pipeline was implemented to refine and extract accurate semantic and emotional information for both image and music data. This pipeline, illustrated in Figure 4, consists of the following main components:
- Multi-Layer Information: To obtain media with dual-layer information (emotional and semantic), sentiment analysis frameworks [56,57] were used to select media that contained at least one sentimental tag in its user-defined tag list. This was particularly crucial for the image data, as they relied solely on user-defined tags.
- Information Consistency: Finally, to ensure label consistency across the tags, a large-language model (LLM) [54] was used to determine the intersection between the human labels and AI-generated captions, ensuring consistency and accuracy. Examples of the image and music datasets for this process can be found in Table 4 and Table 5.
- Data Post-processing: Based on the metadata processing, only relevant media (music/images) were downloaded. For the final pre-processing, a vision transformer (ViT) was employed to filter out duplicate images, and an NSFW detection model [58] was used to filter out NSFW content in the images.
4.1.3. Data Diversity and Balance
4.2. Music–Visual Pairing Methodology
4.2.1. Artistic Segment Pairing
4.2.2. Realistic Segment Pairing
- Sentiment Analysis: Sentiment analysis was performed on the tags to identify words that express positive or negative sentiments using the VADER sentiment analysis model [60].
- Emotional Vector Creation: Emotionally similar word sentiments were averaged to generate an 8-dimensional affective vector. This strategy aimed to capture nuanced emotional undertones, potentially spanning multiple emotions represented in the media tags.
5. Dataset Analysis
5.1. Statistical Analysis
5.1.1. Artistic Data
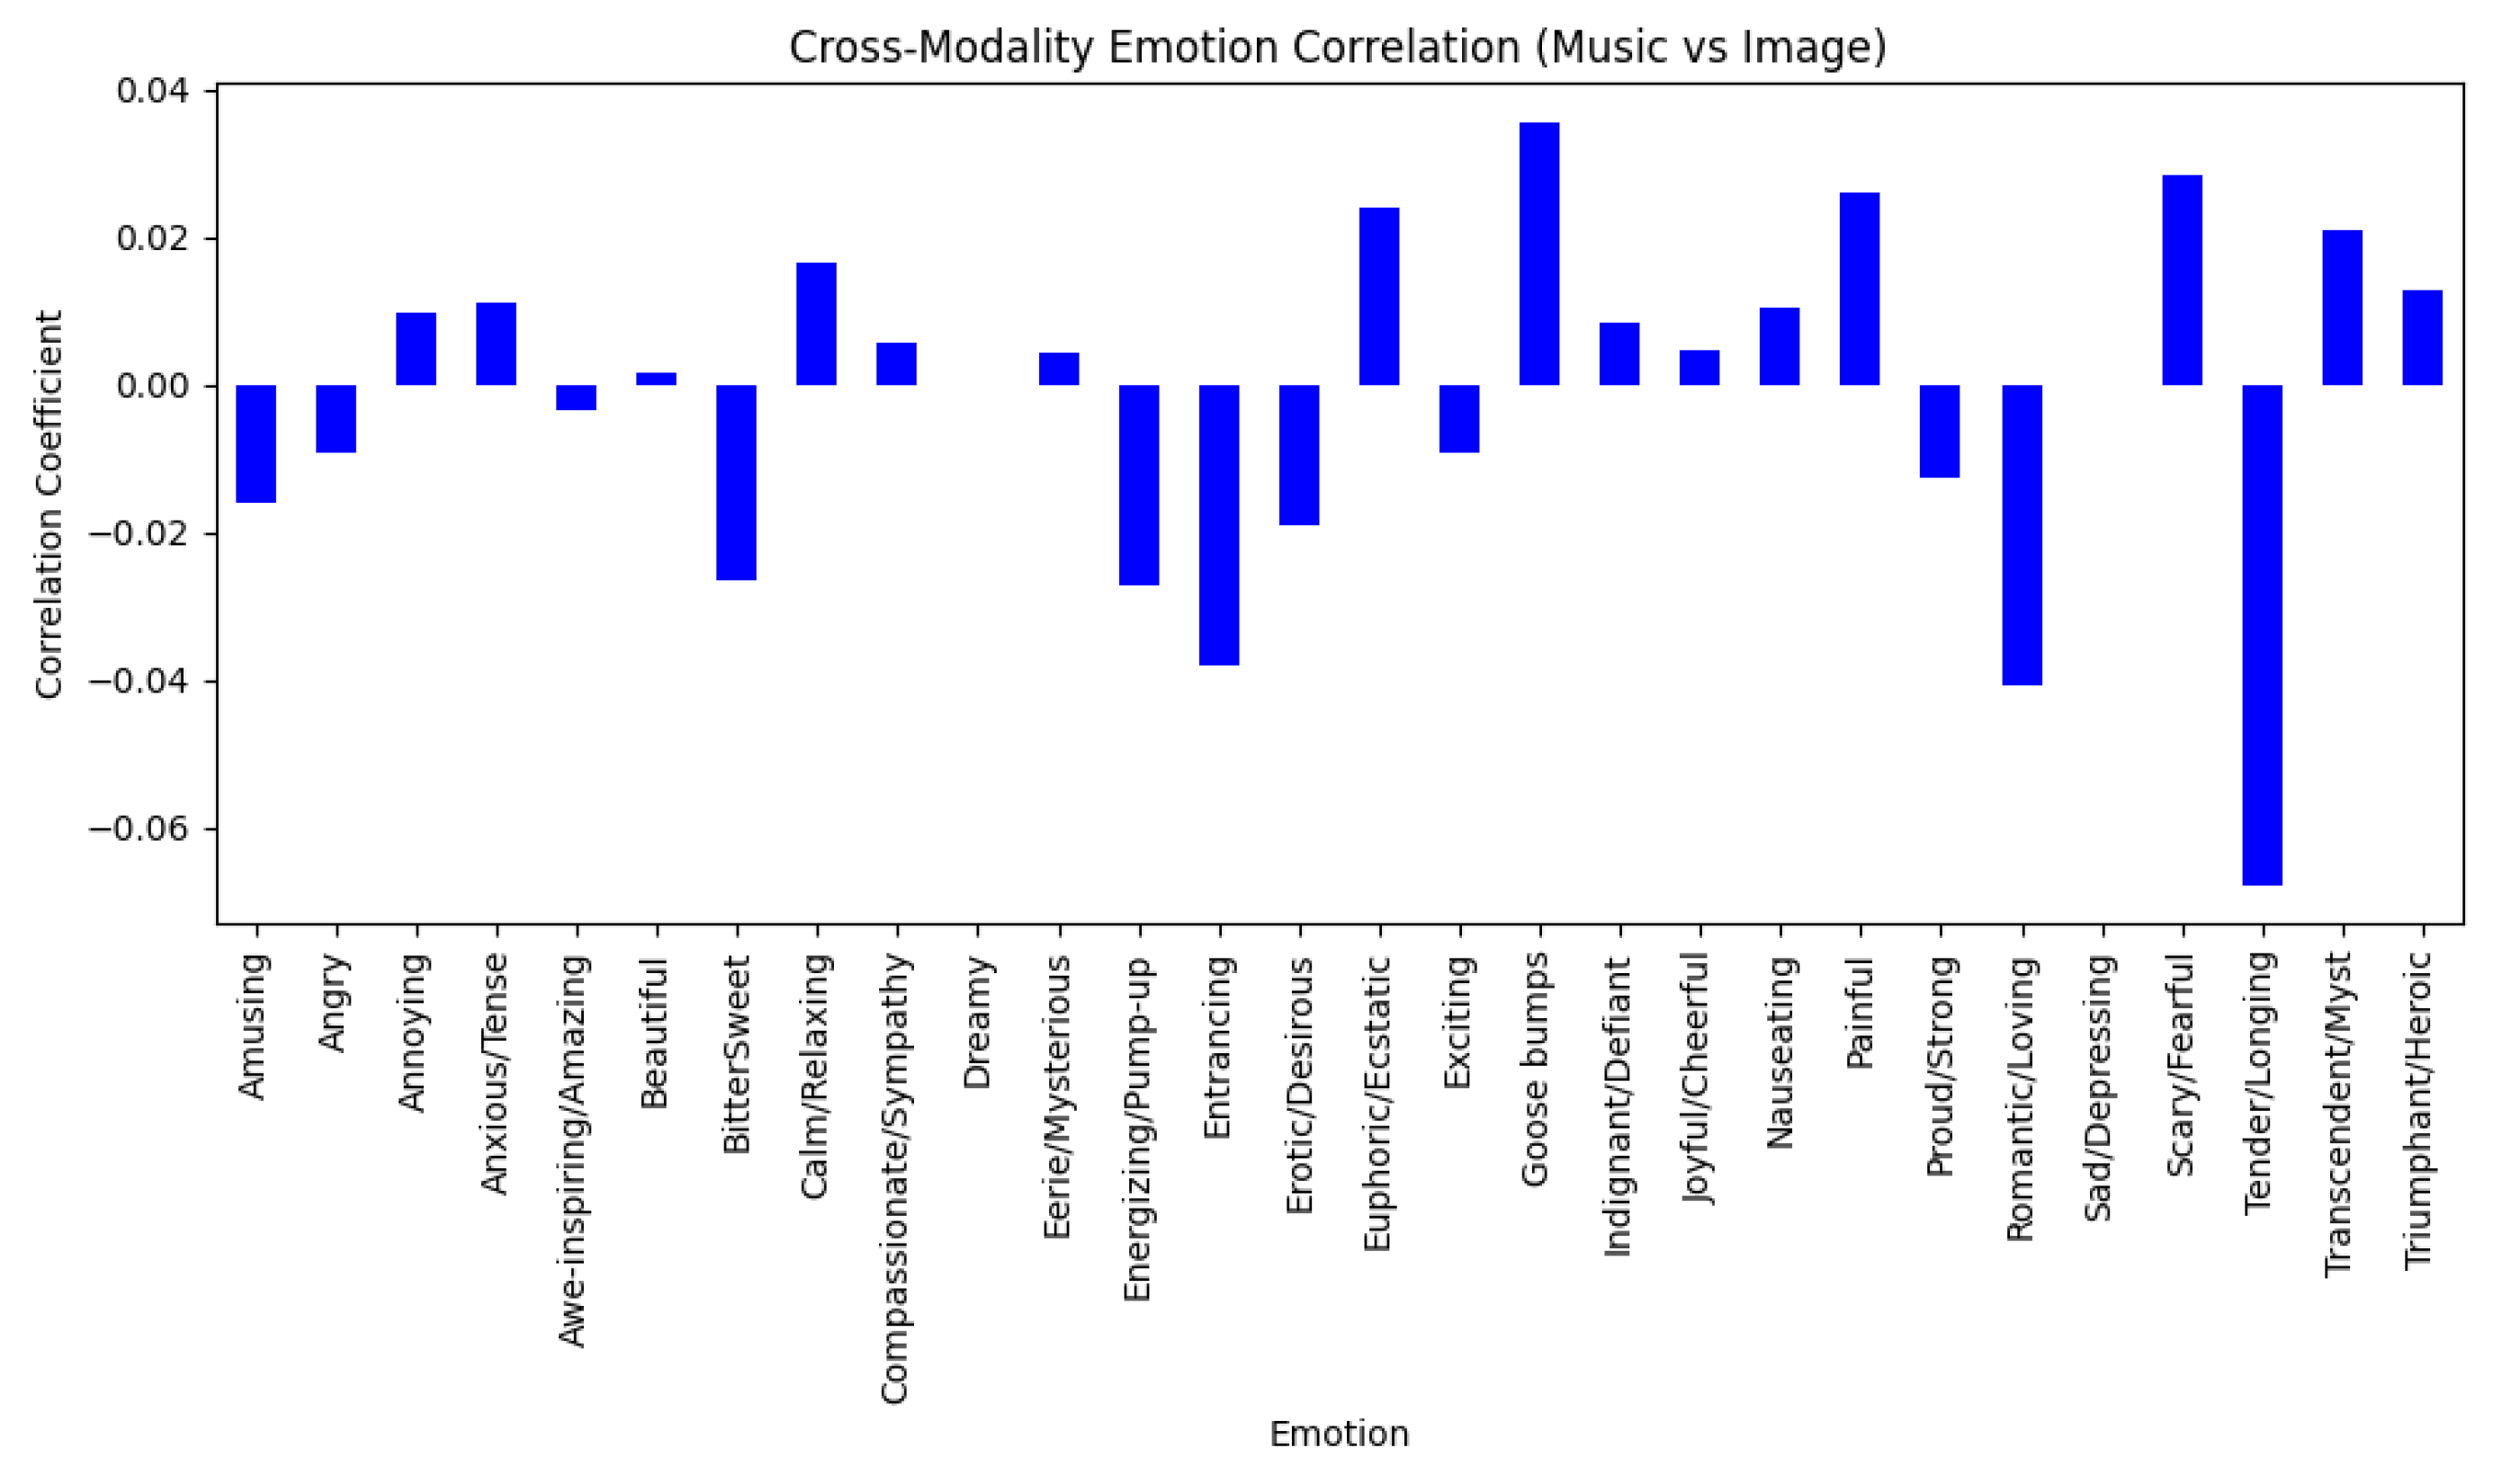
- Some emotions demonstrated positive correlation values, such as ‘Goose bumps’ and ‘Scary/Fearful’, indicating a relatively strong alignment between the emotions evoked by the music and images. This suggests that similar emotional responses may be consistently induced across both modalities.
- Certain emotions showed negative correlations, such as ‘Tender/Longing’ and ‘Romantic/Loving’, implying that music and images can evoke these emotions differently, potentially leading to distinct variations in their emotional impact.
- Emotions with correlations close to zero suggest little to no observable alignment between how music and images evoke these specific emotional responses.
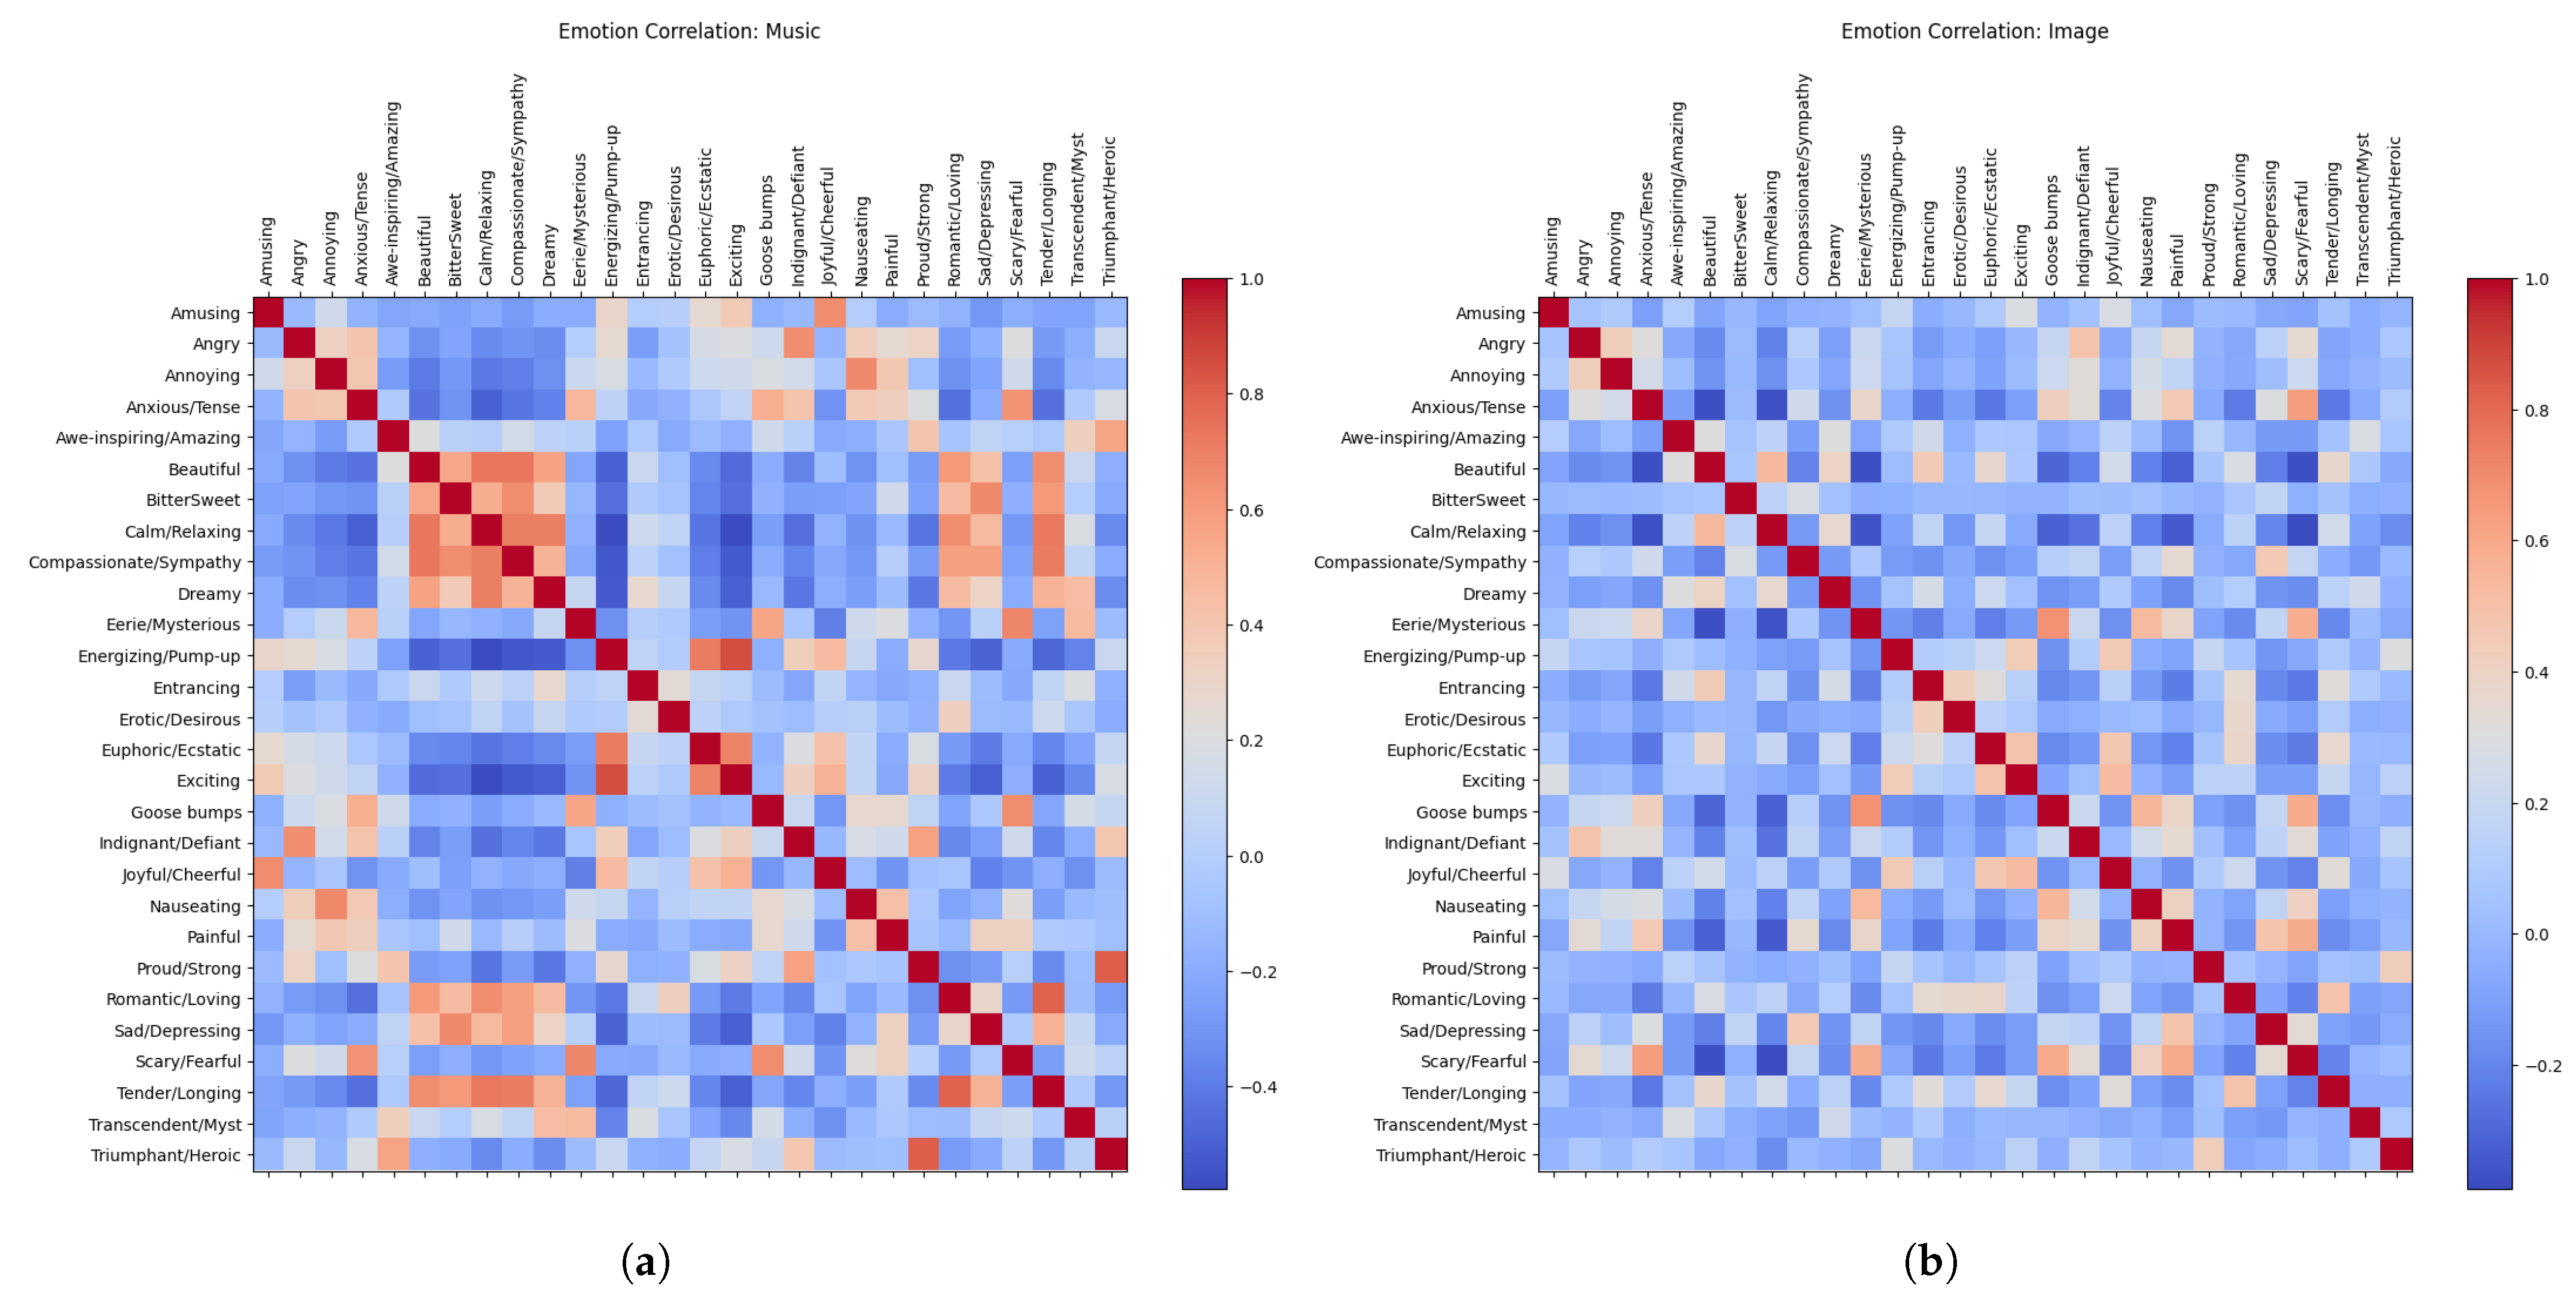
- For images, emotions exhibit a broad distribution of correlations, indicating that each emotion carries distinct and meaningful information. This suggests that a diverse range of emotions are necessary to fully capture the emotional responses elicited by images.
- For music, certain emotions display strong correlations, suggesting that a smaller number of broader emotional categories may be sufficient to capture music-induced emotional experiences. This reflects a more condensed emotional response structure.
- This difference in emotional correlation patterns highlights the modality-specific nature of emotional responses, where images evoke a wider range of distinct emotions, while music tends to elicit a more interconnected or overlapping set of emotional responses.
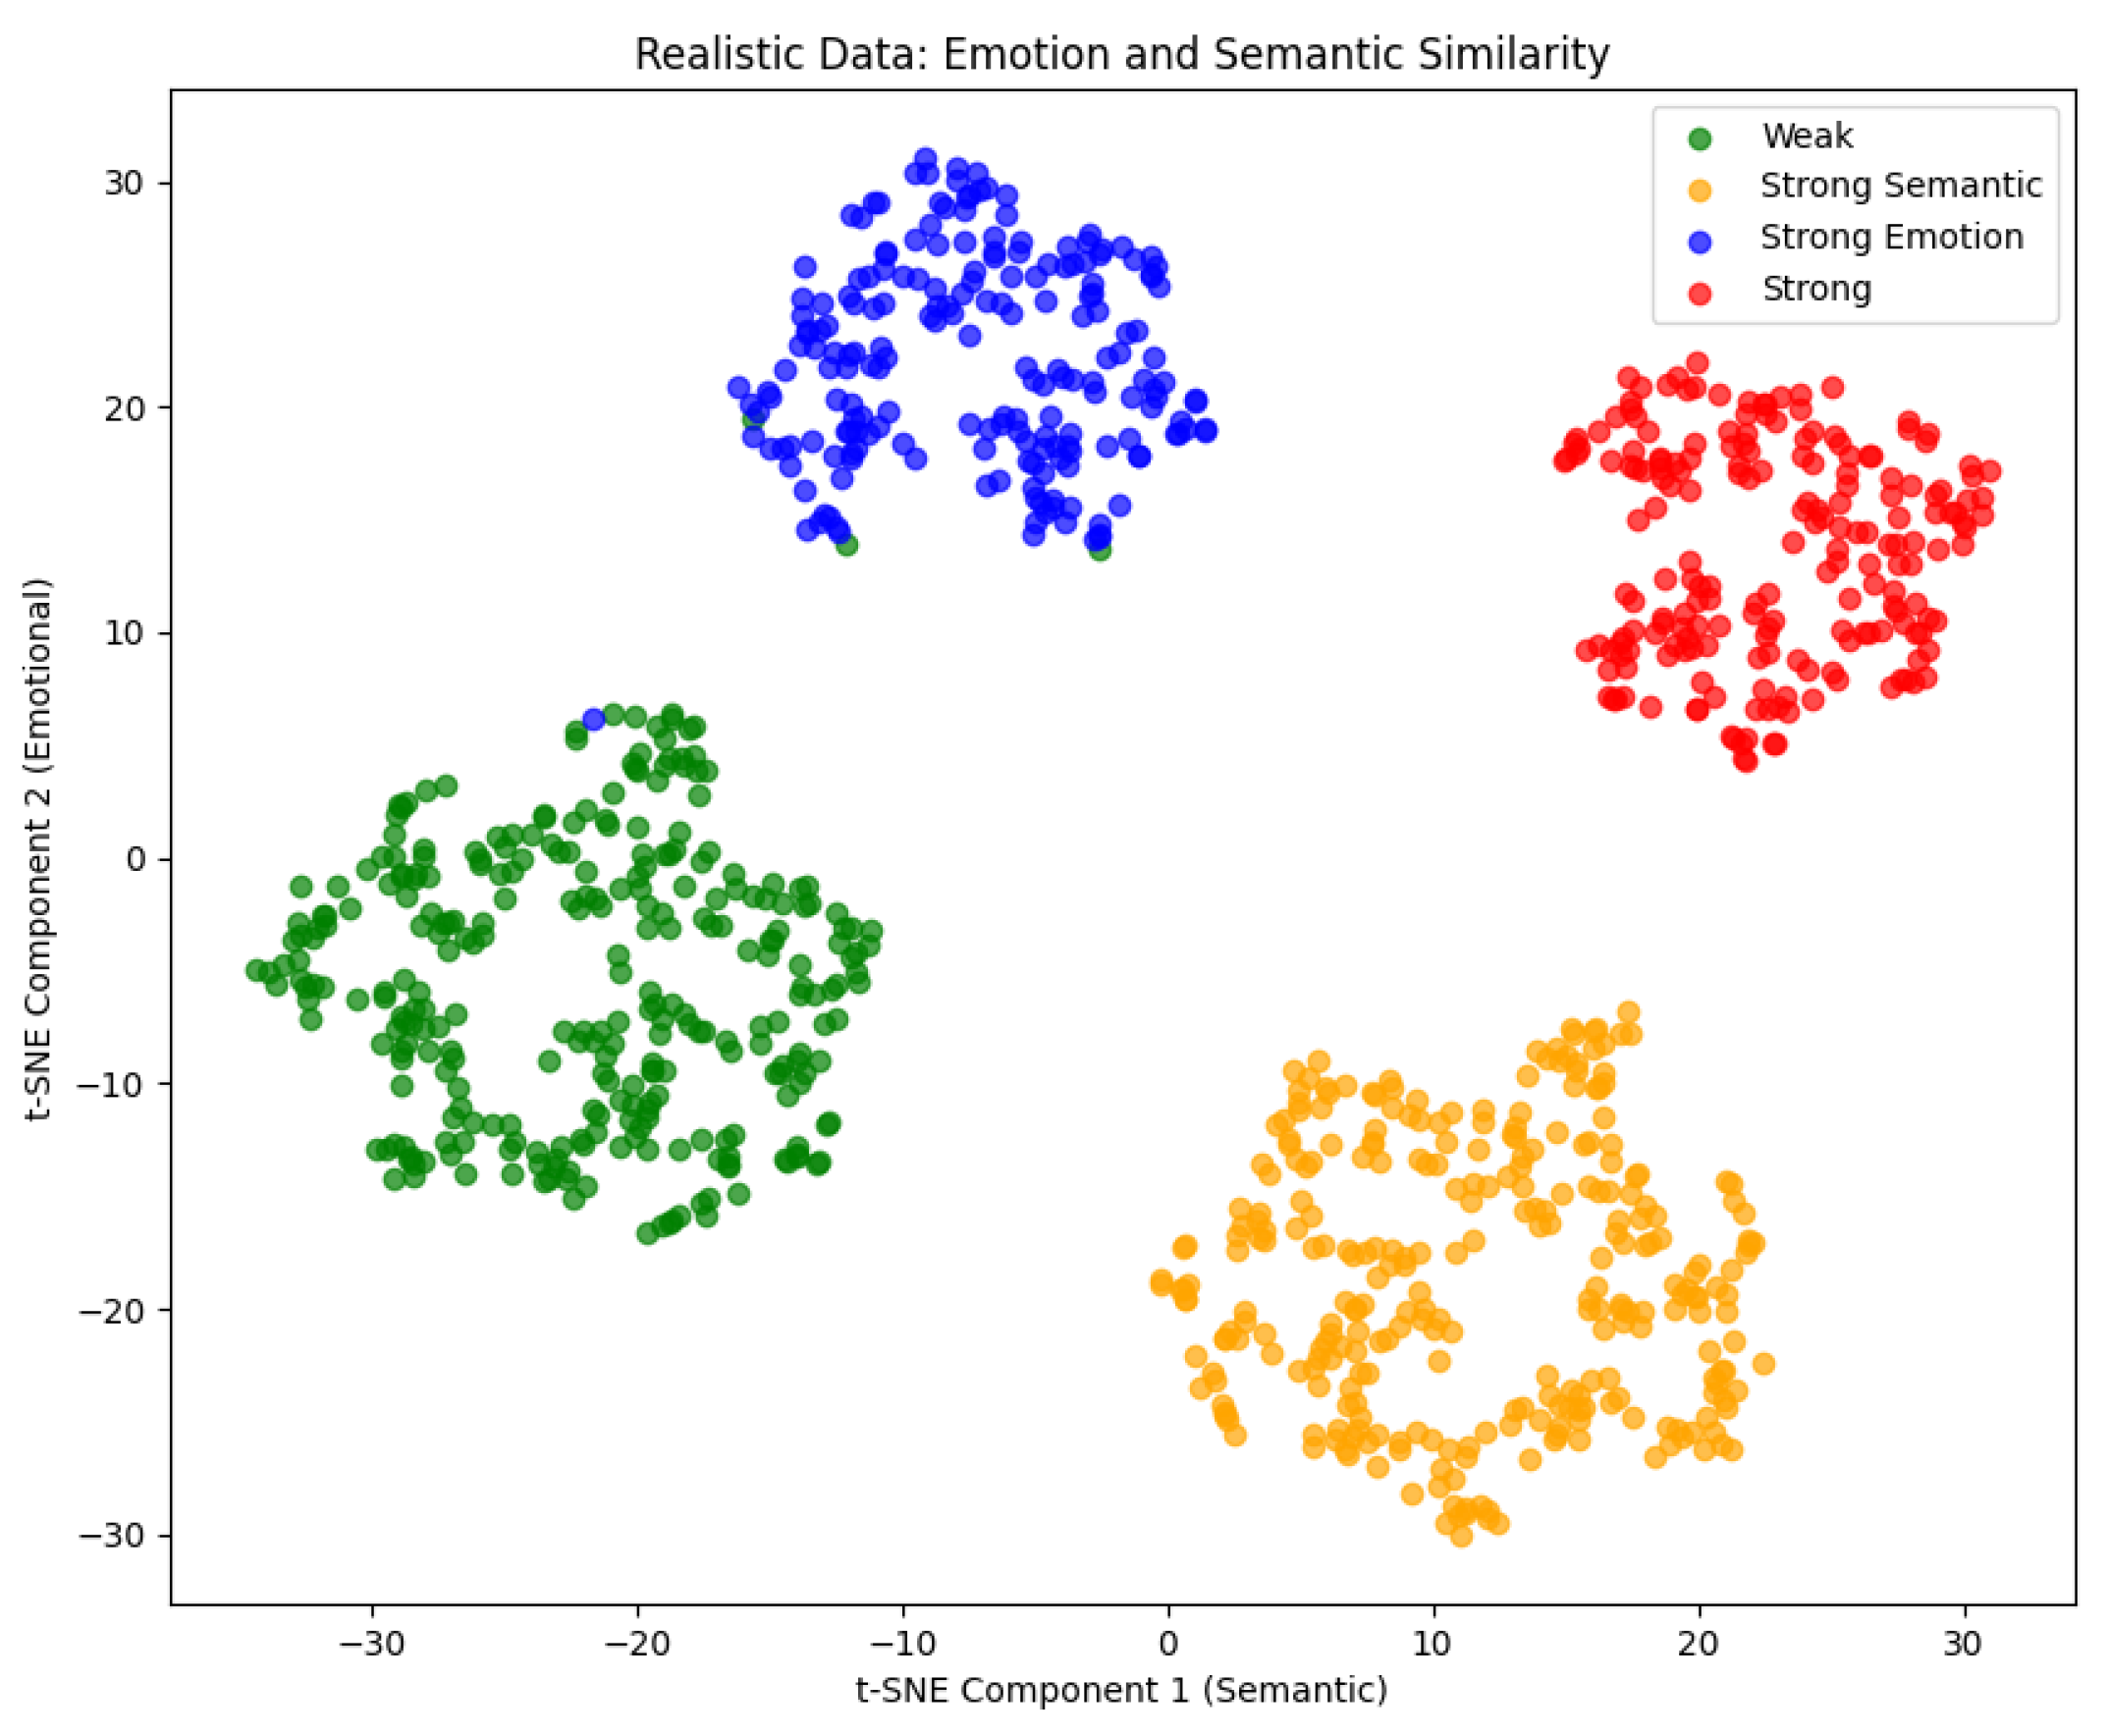
5.1.2. Realistic Data
5.2. User Study
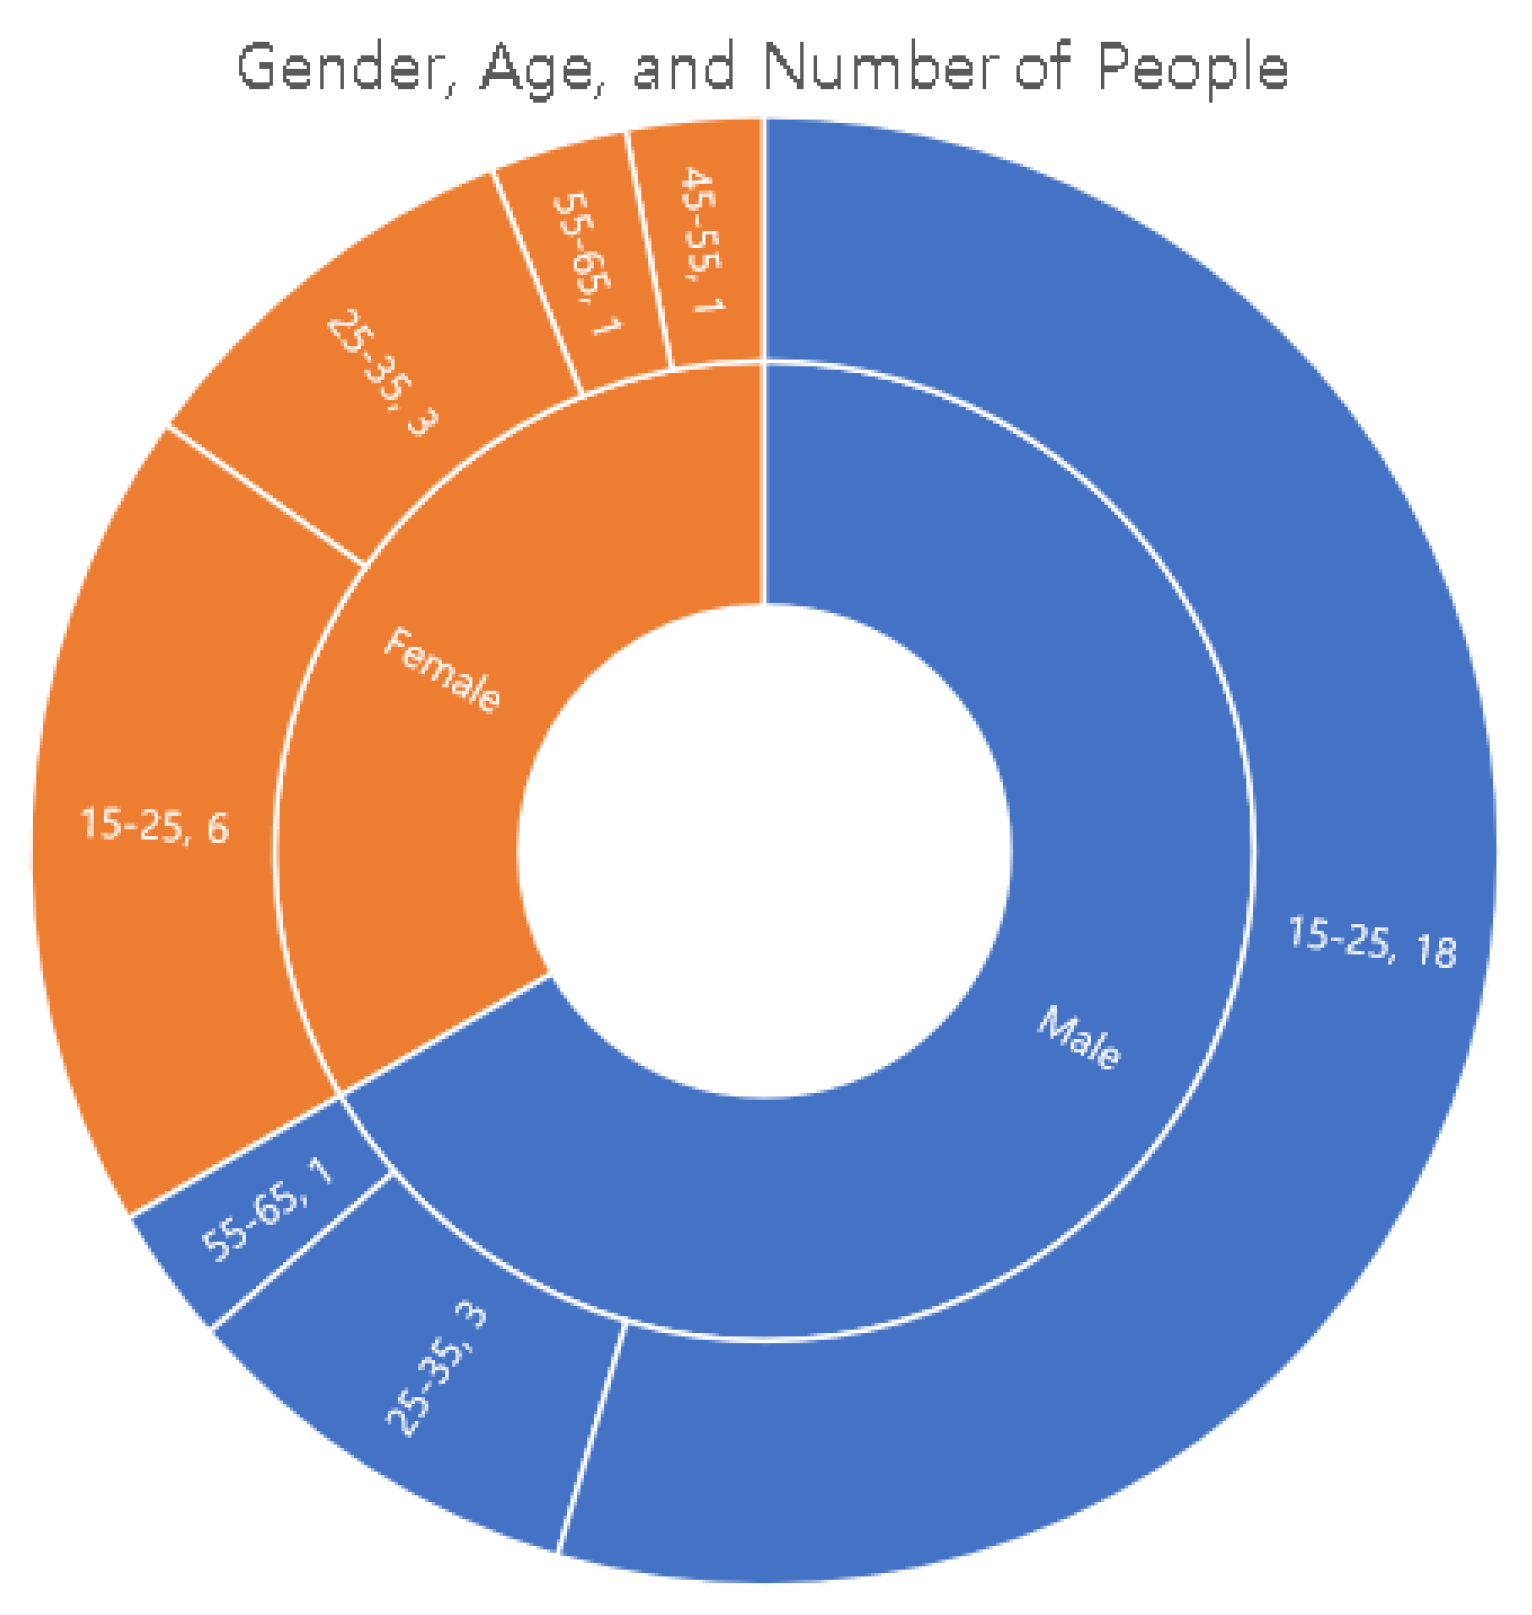
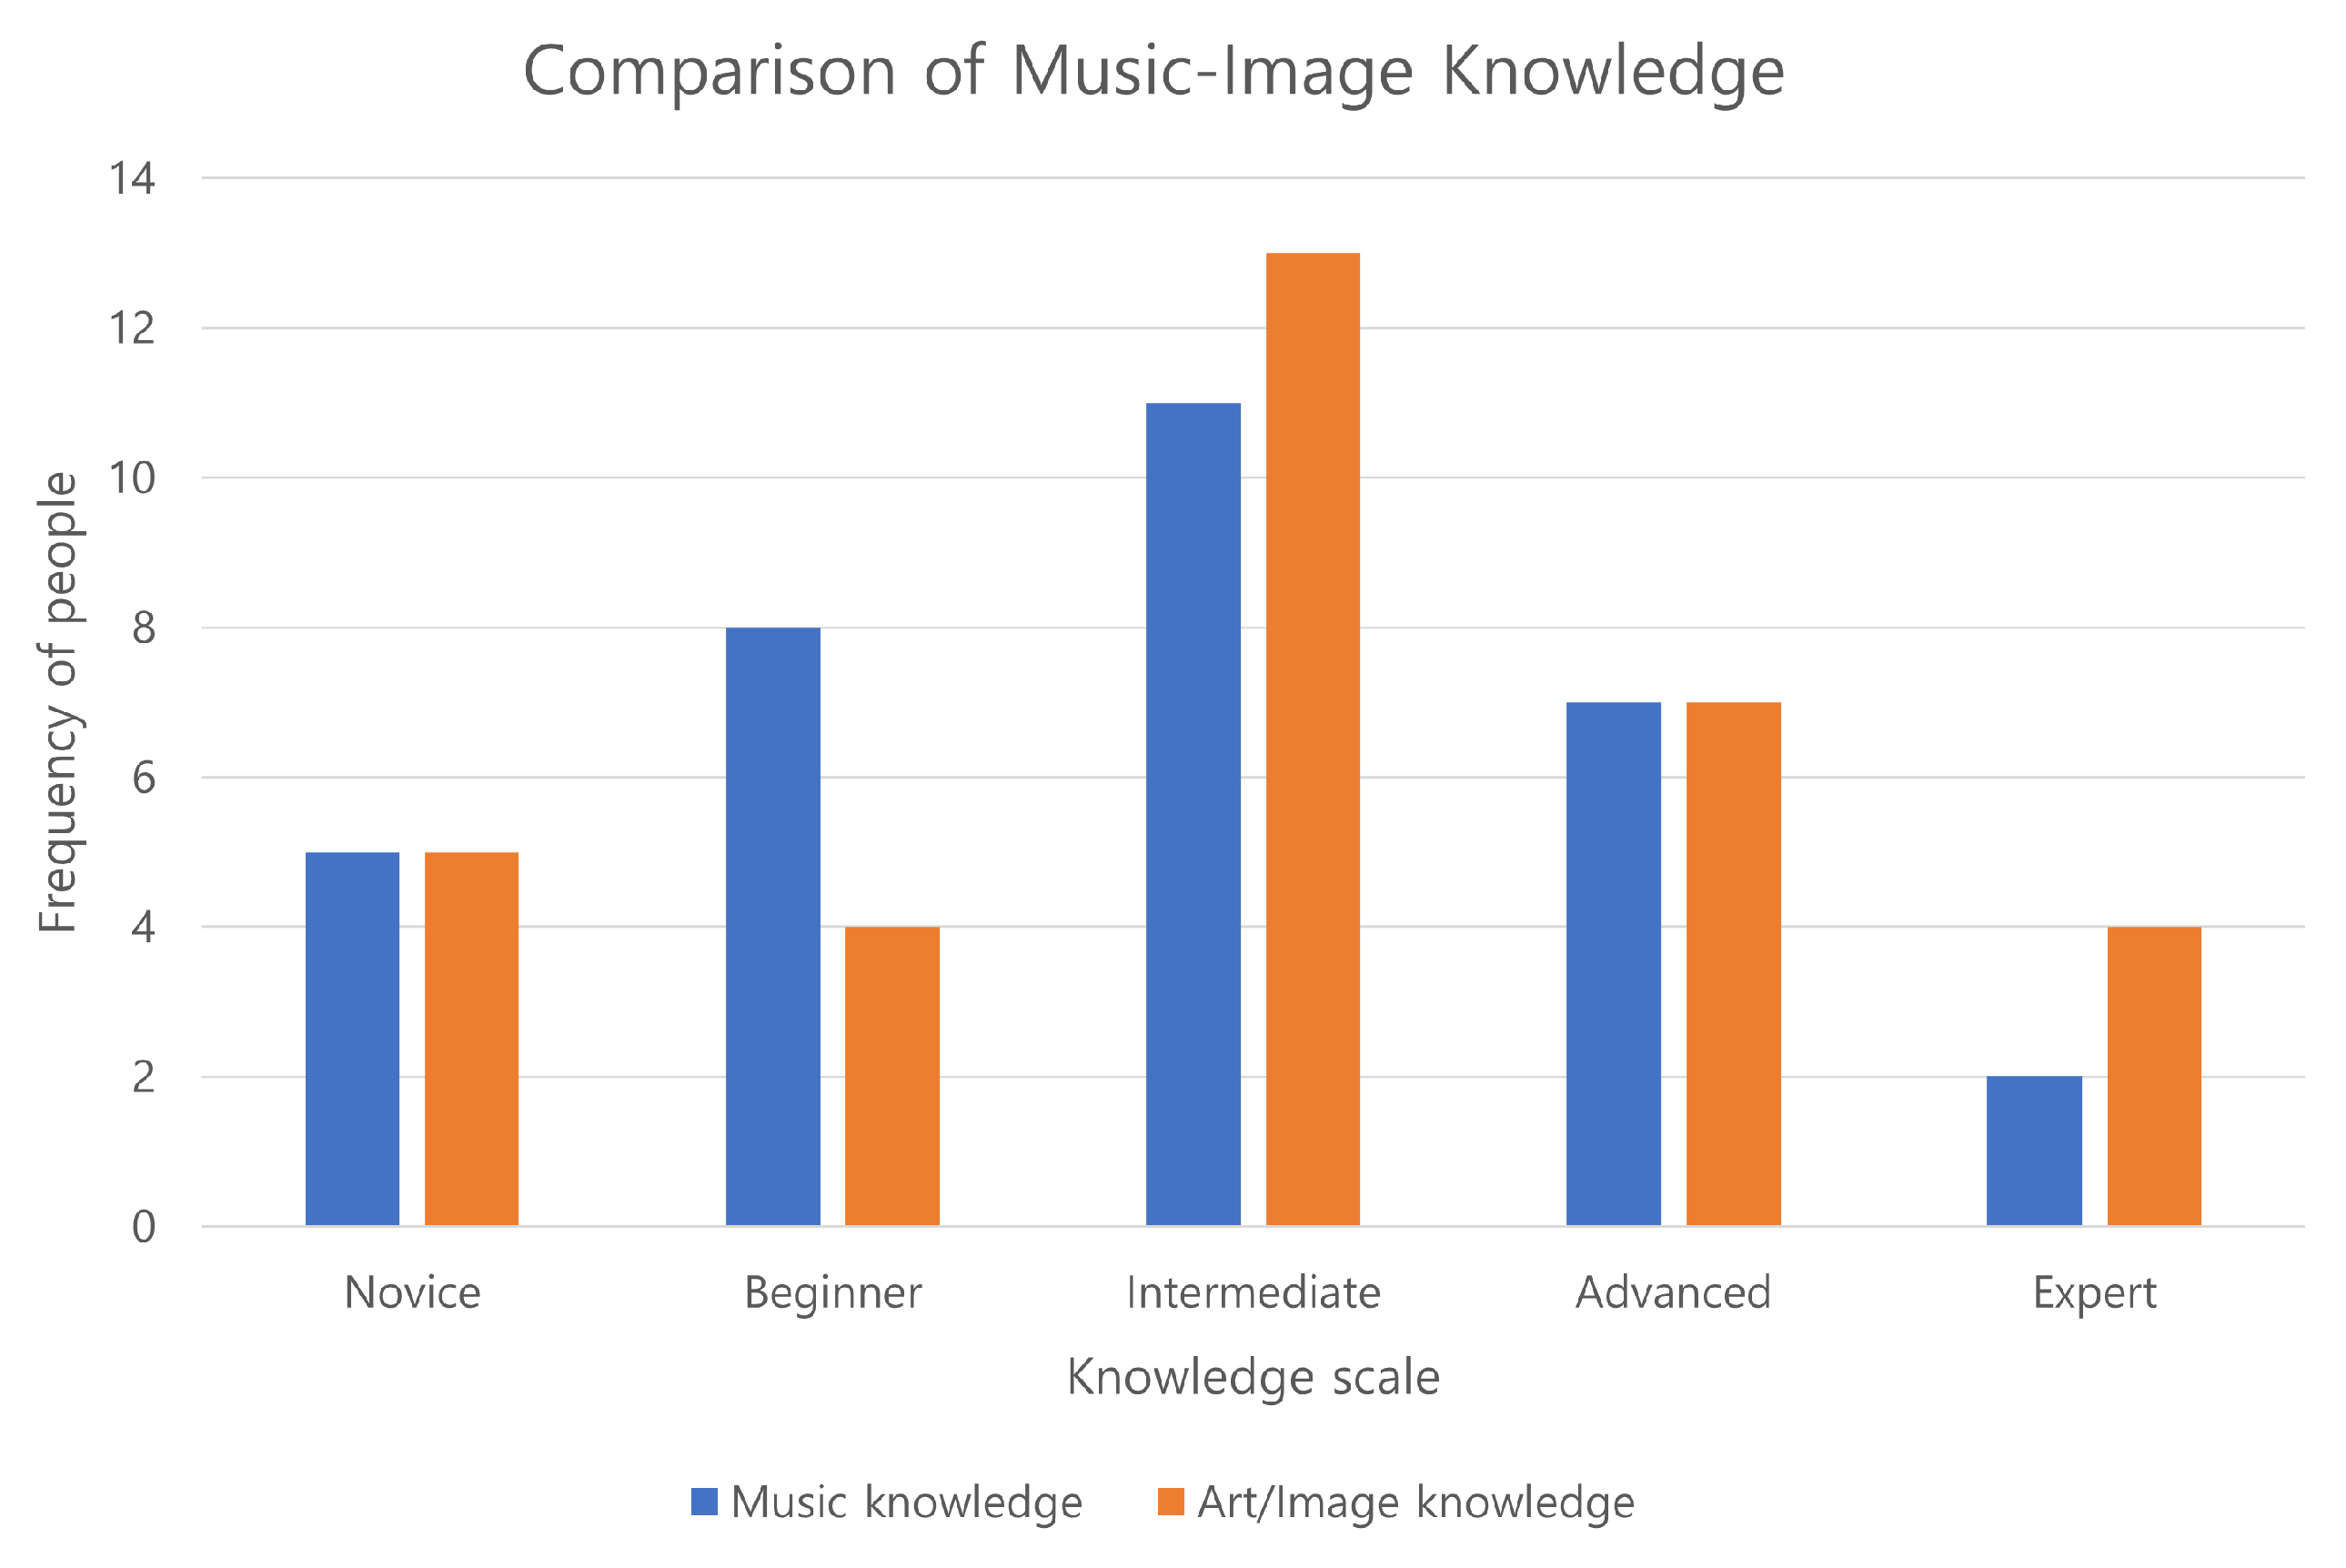
5.2.1. Setup
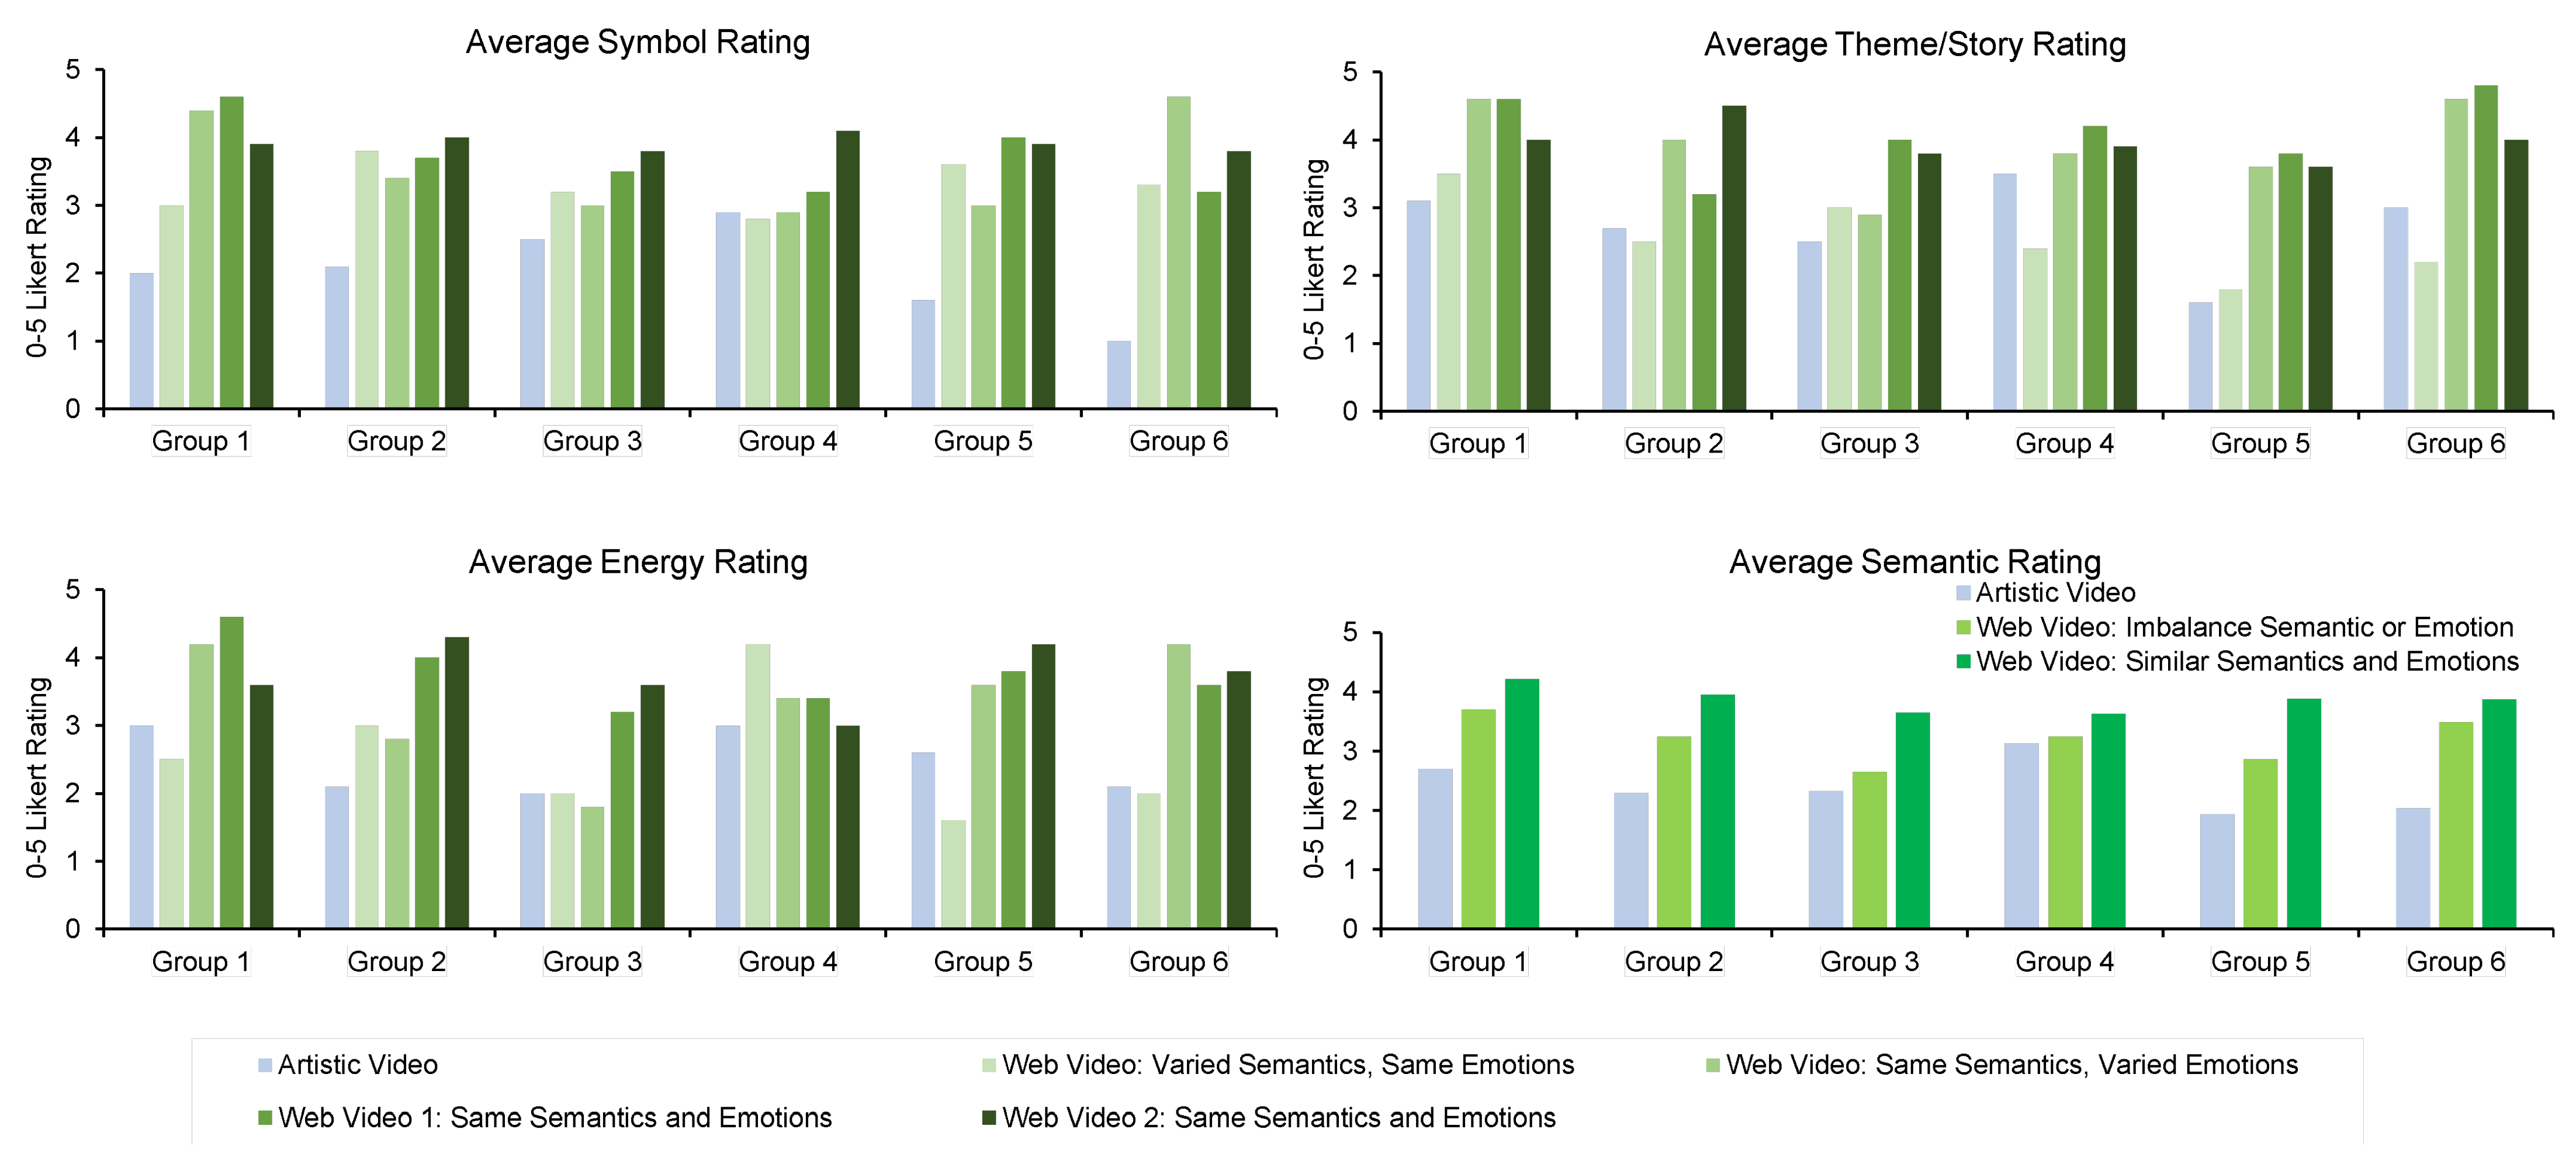
5.2.2. Result Evaluation
6. Conclusions and Future Work
Author Contributions
Funding
Institutional Review Board Statement
Informed Consent Statement
Data Availability Statement
Acknowledgments
Conflicts of Interest
Correction Statement
References
- Gaut, B.; Gaut, B. Art, Emotion and Ethics; Oxford University Press: Oxford, NY, USA, 2007. [Google Scholar]
- Giachanou, A.; Crestani, F. Like It or Not: A Survey of Twitter Sentiment Analysis Methods. ACM Comput. Surv. 2016, 49, 1–41. [Google Scholar] [CrossRef]
- Zhao, S.; Ma, Y.; Gu, Y.; Yang, J.; Xing, T.; Xu, P.; Hu, R.; Chai, H.; Keutzer, K. An End-to-End Visual-Audio Attention Network for Emotion Recognition in User-Generated Videos. In Proceedings of the AAAI Conference on Artificial Intelligence, New York, NY, USA, 7–12 February 2020; Volume 34, pp. 303–311, ISSN 2374-3468/2159-5399. [Google Scholar] [CrossRef]
- Zhao, S.; Yao, H.; Gao, Y.; Ding, G.; Chua, T.S. Predicting Personalized Image Emotion Perceptions in Social Networks. IEEE Trans. Affect. Comput. 2018, 9, 526–540. [Google Scholar] [CrossRef]
- Hassan, S.Z.; Ahmad, K.; Al-Fuqaha, A.; Conci, N. Sentiment Analysis from Images of Natural Disasters. In Image Analysis and Processing—ICIAP 2019; Ricci, E., Rota Bulò, S., Snoek, C., Lanz, O., Messelodi, S., Sebe, N., Eds.; Lecture Notes in Computer Science; Springer: Cham, Switzerland, 2019; pp. 104–113. [Google Scholar] [CrossRef]
- She, D.; Yang, J.; Cheng, M.M.; Lai, Y.K.; Rosin, P.L.; Wang, L. WSCNet: Weakly Supervised Coupled Networks for Visual Sentiment Classification and Detection. IEEE Trans. Multimed. 2020, 22, 1358–1371. [Google Scholar] [CrossRef]
- Truong, Q.T.; Lauw, H.W. Visual Sentiment Analysis for Review Images with Item-Oriented and User-Oriented CNN. In Proceedings of the 25th ACM International Conference on Multimedia, MM’17, New York, NY, USA, 21–25 October 2017; pp. 1274–1282. [Google Scholar] [CrossRef]
- Zhao, S.; Jia, Z.; Chen, H.; Li, L.; Ding, G.; Keutzer, K. PDANet: Polarity-consistent Deep Attention Network for Fine-grained Visual Emotion Regression. In Proceedings of the 27th ACM International Conference on Multimedia, MM’19, New York, NY, USA, 21–25 October 2019; pp. 192–201. [Google Scholar] [CrossRef]
- Sharma, P.; Ding, N.; Goodman, S.; Soricut, R. Conceptual Captions: A Cleaned, Hypernymed, Image Alt-text Dataset For Automatic Image Captioning. In Proceedings of the 56th Annual Meeting of the Association for Computational Linguistics (Volume 1: Long Papers), Melbourne, Australia, 15–20 July 2018; pp. 2556–2565. [Google Scholar] [CrossRef]
- Lin, T.Y.; Maire, M.; Belongie, S.; Hays, J.; Perona, P.; Ramanan, D.; Dollár, P.; Zitnick, C.L. Microsoft COCO: Common Objects in Context. In Computer Vision—ECCV 2014; Fleet, D., Pajdla, T., Schiele, B., Tuytelaars, T., Eds.; Lecture Notes in Computer Science; Springer: Cham, Switzerland, 2014; pp. 740–755. [Google Scholar] [CrossRef]
- Krishna, R.; Zhu, Y.; Groth, O.; Johnson, J.; Hata, K.; Kravitz, J.; Chen, S.; Kalantidis, Y.; Li, L.J.; Shamma, D.A.; et al. Visual Genome: Connecting Language and Vision Using Crowdsourced Dense Image Annotations. Int. J. Comput. Vis. 2017, 123, 32–73. [Google Scholar] [CrossRef]
- Doh, S.; Won, M.; Choi, K.; Nam, J. Toward Universal Text-To-Music Retrieval. In Proceedings of the ICASSP 2023—2023 IEEE International Conference on Acoustics, Speech and Signal Processing (ICASSP), Rhodes Island, Greece, 4–10 June 2023; pp. 1–4. [Google Scholar] [CrossRef]
- Doh, S.; Choi, K.; Lee, J.; Nam, J. LP-MusicCaps: LLM-Based Pseudo Music Captioning, 2023. arXiv 2023, arXiv:2307.16372. [Google Scholar] [CrossRef]
- Wu, Y.; Chen, K.; Zhang, T.; Hui, Y.; Berg-Kirkpatrick, T.; Dubnov, S. Large-Scale Contrastive Language-Audio Pretraining with Feature Fusion and Keyword-to-Caption Augmentation. In Proceedings of the ICASSP 2023—2023 IEEE International Conference on Acoustics, Speech and Signal Processing (ICASSP), Rhodes Island, Greece, 4–10 June 2023; pp. 1–5. [Google Scholar] [CrossRef]
- Xing, B.; Zhang, K.; Zhang, L.; Wu, X.; Dou, J.; Sun, S. Image–Music Synesthesia-Aware Learning Based on Emotional Similarity Recognition. IEEE Access 2019, 7, 136378–136390. [Google Scholar] [CrossRef]
- Achlioptas, P.; Ovsjanikov, M.; Haydarov, K.; Elhoseiny, M.; Guibas, L. ArtEmis: Affective Language for Visual Art. In Proceedings of the 2021 IEEE/CVF Conference on Computer Vision and Pattern Recognition (CVPR), Nashville, TN, USA, 20–25 June 2021; pp. 11564–11574. [Google Scholar] [CrossRef]
- Mohamed, Y.; Khan, F.F.; Haydarov, K.; Elhoseiny, M. It is Okay to Not Be Okay: Overcoming Emotional Bias in Affective Image Captioning by Contrastive Data Collection. In Proceedings of the 2022 IEEE/CVF Conference on Computer Vision and Pattern Recognition (CVPR), New Orleans, LA, USA, 18–24 June 2022; pp. 21231–21240. [Google Scholar] [CrossRef]
- Aljanaki, A.; Yang, Y.H.; Soleymani, M. Developing a benchmark for emotional analysis of music. PLoS ONE 2017, 12, e0173392. [Google Scholar] [CrossRef]
- Wang, S.Y.; Wang, J.C.; Yang, Y.H.; Wang, H.M. Towards time-varying music auto-tagging based on CAL500 expansion. In Proceedings of the 2014 IEEE International Conference on Multimedia and Expo (ICME), Chengdu, China, 14–18 July 2014; pp. 1–6, ISSN 1945-788X. [Google Scholar] [CrossRef]
- Aljanaki, A.; Soleymani, M. A Data-driven Approach to Mid-level Perceptual Musical Feature Modeling. In Proceedings of the 19th International Society for Music Information Retrieval Conference, Paris, France, 23–27 September 2018. [Google Scholar]
- Soleymani, M.; Caro, M.N.; Schmidt, E.M.; Sha, C.Y.; Yang, Y.H. 1000 songs for emotional analysis of music. In Proceedings of the 2nd ACM International Workshop on Crowdsourcing for Multimedia, CrowdMM’13, New York, NY, USA, 21–25 October 2013; pp. 1–6. [Google Scholar] [CrossRef]
- Ullah, U.; Lee, J.S.; An, C.H.; Lee, H.; Park, S.Y.; Baek, R.H.; Choi, H.C. A Review of Multi-Modal Learning from the Text-Guided Visual Processing Viewpoint. Sensors 2022, 22, 6816. [Google Scholar] [CrossRef]
- Zhao, S.; Yao, X.; Yang, J.; Jia, G.; Ding, G.; Chua, T.S.; Schuller, B.W.; Keutzer, K. Affective Image Content Analysis: Two Decades Review and New Perspectives. IEEE Trans. Pattern Anal. Mach. Intell. 2022, 44, 6729–6751. [Google Scholar] [CrossRef]
- Li, T.; Liu, Y.; Owens, A.; Zhao, H. Learning Visual Styles from Audio-Visual Associations. In Proceedings of the Computer Vision—ECCV 2022: 17th European Conference, Tel Aviv, Israel, 23–27 October 2022; pp. 235–252. [Google Scholar] [CrossRef]
- Owens, A.; Isola, P.; McDermott, J.; Torralba, A.; Adelson, E.H.; Freeman, W.T. Visually Indicated Sounds. In Proceedings of the 2016 IEEE Conference on Computer Vision and Pattern Recognition (CVPR), Las Vegas, NV, USA, 27–30 June 2016; pp. 2405–2413, ISSN 1063-6919. [Google Scholar] [CrossRef]
- Nakatsuka, T.; Hamasaki, M.; Goto, M. Content-Based Music-Image Retrieval Using Self- and Cross-Modal Feature Embedding Memory. In Proceedings of the 2023 IEEE/CVF Winter Conference on Applications of Computer Vision (WACV), Waikoloa, HI, USA, 2–7 January 2023; pp. 2173–2183, ISSN 2642-9381. [Google Scholar] [CrossRef]
- Hong, S.; Im, W.; Yang, H.S. CBVMR: Content-Based Video-Music Retrieval Using Soft Intra-Modal Structure Constraint. In Proceedings of the 2018 ACM on International Conference on Multimedia Retrieval, ICMR’18, New York, NY, USA, 5 June 2018; pp. 353–361. [Google Scholar] [CrossRef]
- Yi, J.; Zhu, Y.; Xie, J.; Chen, Z. Cross-Modal Variational Auto-Encoder for Content-Based Micro-Video Background Music Recommendation. IEEE Trans. Multimed. 2023, 25, 515–528. [Google Scholar] [CrossRef]
- Abu-El-Haija, S.; Kothari, N.; Lee, J.; Natsev, A.P.; Toderici, G.; Varadarajan, B.; Vijayanarasimhan, S. YouTube-8M: A Large-Scale Video Classification Benchmark. arXiv 2016, arXiv:1609.08675. [Google Scholar]
- Gemmeke, J.F.; Ellis, D.P.W.; Freedman, D.; Jansen, A.; Lawrence, W.; Moore, R.C.; Plakal, M.; Ritter, M. Audio Set: An ontology and human-labeled dataset for audio events. In Proceedings of the 2017 IEEE International Conference on Acoustics, Speech and Signal Processing (ICASSP), New Orleans, LA, USA, 5–9 March 2017; pp. 776–780. [Google Scholar] [CrossRef]
- Chen, L.; Srivastava, S.; Duan, Z.; Xu, C. Deep Cross-Modal Audio-Visual Generation. In Proceedings of the on Thematic Workshops of ACM Multimedia 2017, Workshops’17, New York, NY, USA, 23–27 October 2017; pp. 349–357. [Google Scholar] [CrossRef]
- Zhao, S.; Li, Y.; Yao, X.; Nie, W.; Xu, P.; Yang, J.; Keutzer, K. Emotion-Based End-to-End Matching Between Image and Music in Valence-Arousal Space. In Proceedings of the 28th ACM International Conference on Multimedia, MM’20, New York, NY, USA, 10–16 October 2020; pp. 2945–2954. [Google Scholar] [CrossRef]
- Verma, G.; Dhekane, E.G.; Guha, T. Learning Affective Correspondence between Music and Image. In Proceedings of the ICASSP 2019—2019 IEEE International Conference on Acoustics, Speech and Signal Processing (ICASSP), Brighton, UK, 12–17 May 2019; pp. 3975–3979. [Google Scholar] [CrossRef]
- Arandjelovic, R.; Zisserman, A. Look, Listen and Learn. In Proceedings of the 2017 IEEE International Conference on Computer Vision (ICCV), Venice, Italy, 22–29 October 2017; pp. 609–617, ISSN 2380-7504. [Google Scholar] [CrossRef]
- Surís, D.; Vondrick, C.; Russell, B.; Salamon, J. It’s Time for Artistic Correspondence in Music and Video. In Proceedings of the 2022 IEEE/CVF Conference on Computer Vision and Pattern Recognition (CVPR), New Orleans, LA, USA, 18–24 June 2022; pp. 10554–10564. [Google Scholar] [CrossRef]
- Arandjelovic, R.; Zisserman, A. Objects that Sound. In Computer Vision—ECCV 2018; Springer International Publishing: Berlin/Heidelberg, Germany, 2018; pp. 435–451. [Google Scholar]
- Ekman, P. An argument for basic emotions. Cogn. Emot. 1992, 6, 169–200. [Google Scholar] [CrossRef]
- Eerola, T.; Vuoskoski, J.K. A comparison of the discrete and dimensional models of emotion in music. Psychol. Music. 2011, 39, 18–49. [Google Scholar] [CrossRef]
- Turnbull, D.; Barrington, L.; Torres, D.; Lanckriet, G. Towards musical query-by-semantic-description using the CAL500 data set. In Proceedings of the 30th Annual International ACM SIGIR Conference on Research and Development in Information Retrieval, SIGIR’07, New York, NY, USA, 23–27 July 2007; pp. 439–446. [Google Scholar] [CrossRef]
- Cowen, A.S.; Fang, X.; Sauter, D.; Keltner, D. What music makes us feel: At least 13 dimensions organize subjective experiences associated with music across different cultures. Proc. Natl. Acad. Sci. USA 2020, 117, 1924–1934. [Google Scholar] [CrossRef] [PubMed]
- Cowen, A.S.; Keltner, D. Self-report captures 27 distinct categories of emotion bridged by continuous gradients. Proc. Natl. Acad. Sci. USA 2017, 114, E7900–E7909. [Google Scholar] [CrossRef]
- Drossos, K.; Lipping, S.; Virtanen, T. Clotho: An Audio Captioning Dataset. In Proceedings of the ICASSP 2020—2020 IEEE International Conference on Acoustics, Speech and Signal Processing (ICASSP), Barcelona, Spain, 4–9 May 2020; pp. 736–740. [Google Scholar] [CrossRef]
- Kosti, R.; Alvarez, J.M.; Recasens, A.; Lapedriza, A. Context Based Emotion Recognition Using EMOTIC Dataset. IEEE Trans. Pattern Anal. Mach. Intell. 2020, 42, 2755–2766. [Google Scholar] [CrossRef]
- Lee, C.C.; Lin, W.Y.; Shih, Y.T.; Kuo, P.Y.P.; Su, L. Crossing You in Style: Cross-modal Style Transfer from Music to Visual Arts. In Proceedings of the 28th ACM International Conference on Multimedia, MM’20, New York, NY, USA, 12–16 October 2020; pp. 3219–3227. [Google Scholar] [CrossRef]
- Malheiro, R.; Panda, R.; Gomes, P.; Paiva, R.P. Bi-modal music emotion recognition: Novel lyrical features and dataset. In Proceedings of the 9th International Workshop on Machine Learning and Music—MML 2016, Riba del Garda, Italy, 23 September 2016. [Google Scholar]
- Aljanaki, A.; Yang, Y.H.; Soleymani, M. Emotion in Music Task at MediaEval 2015. In Proceedings of the MediaEval Benchmarking Initiative for Multimedia Evaluation, Barcelona, Spain, 16–17 October 2014. [Google Scholar]
- Agostinelli, A.; Denk, T.I.; Borsos, Z.; Engel, J.; Verzetti, M.; Caillon, A.; Huang, Q.; Jansen, A.; Roberts, A.; Tagliasacchi, M.; et al. MusicLM: Generating Music From Text, 2023. arXiv 2023, arXiv:2301.11325. [Google Scholar] [CrossRef]
- Law, E.; West, K.; Mandel, M.I.; Bay, M.; Downie, J.S. Evaluation of Algorithms Using Games: The Case of Music Tagging. In Proceedings of the International Society for Music Information Retrieval Conference, Kobe, Japan, 26–30 October 2009. [Google Scholar]
- Mei, X.; Meng, C.; Liu, H.; Kong, Q.; Ko, T.; Zhao, C.; Plumbley, M.D.; Zou, Y.; Wang, W. WavCaps: A ChatGPT-Assisted Weakly-Labelled Audio Captioning Dataset for Audio-Language Multimodal Research, 2023. arXiv 2023, arXiv:2303.17395. [Google Scholar] [CrossRef]
- Huang, Q.; Park, D.S.; Wang, T.; Denk, T.I.; Ly, A.; Chen, N.; Zhang, Z.; Zhang, Z.; Yu, J.; Frank, C.; et al. Noise2Music: Text-conditioned Music Generation with Diffusion Models. arXiv 2023. [Google Scholar] [CrossRef]
- Kim, C.D.; Kim, B.; Lee, H.; Kim, G. AudioCaps: Generating Captions for Audios in The Wild. In Proceedings of the 2019 Conference of the North American Chapter of the Association for Computational Linguistics: Human Language Technologies, Volume 1 (Long and Short Papers), Minneapolis, MN, USA, 3–5 June 2019; pp. 119–132. [Google Scholar] [CrossRef]
- WikiArt.org—Visual Art Encyclopedia. Available online: https://www.wikiart.org/ (accessed on 10 January 2024).
- Li, J.; Li, D.; Savarese, S.; Hoi, S. BLIP-2: Bootstrapping Language-Image Pre-training with Frozen Image Encoders and Large Language Models. arXiv 2023. [Google Scholar] [CrossRef]
- Touvron, H.; Martin, L.; Stone, K.; Albert, P.; Almahairi, A.; Babaei, Y.; Bashlykov, N.; Batra, S.; Bhargava, P.; Bhosale, S.; et al. Llama 2: Open Foundation and Fine-Tuned Chat Models, 2023. arXiv 2023, arXiv:2307.09288. [Google Scholar] [CrossRef]
- Xiong, Z.; Lin, P.C.; Farjudian, A. Retaining Semantics in Image to Music Conversion. In Proceedings of the 2022 IEEE International Symposium on Multimedia (ISM), Naples, Italy, 5–7 December 2022; pp. 228–235. [Google Scholar] [CrossRef]
- Stargazers · Explosion/spaCy. Available online: https://github.com/explosion/spacy-layout (accessed on 15 February 2024).
- Bird, S.; Klein, E.; Loper, E. Natural Language Processing with Python: Analyzing Text with the Natural Language Toolkit; O’Reilly Media, Inc.: Sebastopol, CA, USA, 2009. [Google Scholar]
- Codd, A. ViT-Base NSFW Detector. 2023. Available online: https://huggingface.co/AdamCodd/vit-base-nsfw-detector (accessed on 16 February 2024).
- Face, H. Sentence-Transformers/All-MiniLM-L6-v2. 2023. Available online: https://huggingface.co/sentence-transformers/all-MiniLM-L6-v2 (accessed on 20 February 2024).
- Hutto, C.; Gilbert, E. VADER: A Parsimonious Rule-Based Model for Sentiment Analysis of Social Media Text. In Proceedings of the International AAAI Conference on Web and Social Media 2014, Ann Arbor, MI USA, 1–4 June 2014; Volume 8, pp. 216–225. [Google Scholar] [CrossRef]
- Semeraro, A.; Vilella, S.; Ruffo, G. PyPlutchik: Visualising and comparing emotion-annotated corpora. PLoS ONE 2021, 16, e0256503. [Google Scholar] [CrossRef] [PubMed]
- Schlenker, P. Musical Meaning within Super Semantics. In Linguistics and Philosophy; Springer: Berlin/Heidelberg, Germany, 2021. [Google Scholar] [CrossRef]


| Aspect | Categorical Model | Dimensional Model | Hybrid Model |
|---|---|---|---|
| Emotion Representation | Discrete, with a fixed set of basic emotions. | Continuous, using a 2D vector (e.g., valence-arousal). | Continuous, with a 28D vector for multiple emotions and intensities. |
| Complexity of Emotions | Simplistic; one emotion at a time. | Flexible; captures a range but may miss overlaps. | Highly flexible; captures overlapping, complex emotions. |
| Intensity of Emotions | Lacks intensity variation. | Includes intensity but limited in handling overlaps. | Uses intensity scales for continuous, overlapping emotions. |
| Applicability | Suitable for single-dominant emotion labeling. | Captures broader spectra but limited for complex multi-emotions. | Designed for complex artistic/multimedia content. |
| Interpretability | Easy to interpret; defined categories. | Moderate; requires understanding dimensions. | Allows detailed, nuanced emotional analysis. |
| Information Layer | Modality | Dataset | ML Tasks | ||||
|---|---|---|---|---|---|---|---|
| Name | Domain | Annotations | Quantity | ||||
| Affective | Visual (Image/Art) | [43] EMOTIC | Human Emotions | BBOX + CES (26) + DES (VAD) | 23,571 | DIS | |
| [16] ArtEmis | Affective Art Captioning | CES (9) + captions | 80,031 | GEN | |||
| [17] ArtEmis 2.0 | Affective Art Captioning | CES (9) + captions + contrast | - | GEN | |||
| Music | [18] DEAM | Static Music Emotion | DES (VA) | 1802 | DIS | ||
| [38] Soundtrack | Static Music Emotion | CES (4) | 360 | DIS | |||
| [45] Bi-Modal | Static Music Emotion | CES (4) + Lyrics | 162 | DIS | |||
| [39] CAL500 | Static Music Emotion | CES (18) | 502 | DIS | |||
| [19] CAL500exp | Dynamic Music Emotion | CES (18) | 3223 | DIS | |||
| [46] EMM | Static Music Emotion | DES (VA) | 489 | DIS | |||
| [20] MPF | Static Music Emotion | Perceptual Features + DES (8) | 5000 | DIS | |||
| [21] EAM | Dynamic Music Emotion | DES (VA) | 744 | DIS | |||
| Audio-Visual (Music-Image) | [32] IMEMNet | Music-Image | DES (VA) | 144,435 pairs | ED | DIS | |
| [33] IMAC | Music-Image | CES (3) | - | 0/1 | DIS | ||
| [15] ASD | Music-Image | CES (8) | 250,000 pairs | ED, PCC | DIS | ||
| Semantic | Visual (Image/Art) | [9] Conceptual Captions | Image captioning | Web Captions | 3.4M | GEN | |
| [10] COCO | Image captioning | Human captions | 328 | DIS | |||
| [11] VG | Image Captioning | Captions + QA + Scene Graphs | 108 | DIS + GEN | |||
| Audio (Music) | [12] ECALS | Text-Music Retrieval | Tag-Captions | 517,022 | DIS | ||
| [47] MC | Text to Music | Captions | 5,5 | GEN | |||
| [48] MTT | Music Retrieval | Tags (Semantic + Mood) | 26 | DIS | |||
| [13] LP-MusicCaps | Audio Captioning | Tags + Pseudo captions | 514 | GEN | |||
| [49] WavCaps | Audio Captioning | Captions | 400 | DIS + GEN | |||
| [14] LAION-Audio-630K | Text-Audio Representation | Tags (K2C) + Captions | 633,526 | DIS | |||
| [50] MuLaMCap | Text to Music | Pseudo Captions | 400 | GEN | |||
| [51] AudioCaps | Audio captioning | Captions | 52,904 | GEN | |||
| [42] Clotho | Audio captioning | Captions | 5929 | GEN | |||
| Audio-Visual (Music-Image) | [24] ITW | Audio-Visual | Egocentric Videos | 94 | Temporal | GEN | |
| [25] GH | Audio-Visual | Videos | 977 | Temporal | DIS + GEN | ||
| [26] MCA | Music-Image | Music Cover Art | 78,325 | 1-to-1 | DIS | ||
| [27] HIMV-200K | Music-Video Retrieval | Micro Video | 200,5 | Temporal | DIS | ||
| [28] TT-150K | Music-Video Retrieval | Micro Video | 150 | Temporal | DIS | ||
| [29] YouTube-8M | Video Classification | Labels | 8M | Temporal | DIS | ||
| [30] AudioSet | Audio Event recognition | Audio classes | 1.2M | Temporal | DIS | ||
| [31] Sub-URMP + INIS | Music-Visual | Video + Labels | 17,555 + 7200 | Temporal | GEN | ||
| Affective + Semantic | Audio-Visual | MuIm | Music-Image | Artistic: 28D emotions + captions | 50K pairs | Several Distance Metrics | DIS + GEN |
| (Music-Image) | Web: emotional + semantic labels | 700k pairs | |||||
| Aspect | Artistic Example (Image) | Musical Example (Music) |
|---|---|---|
| Theme | Architecture | Baroque period architecture-inspired themes |
| Style | Early Renaissance, Perspective | Baroque instrumental style |
| Genre | Art, Architecture | Classical Music, Instrumental |
| Atmosphere | Historical, Serene, Spiritual | Serene, Majestic, Historical undertones |
| Instruments/Visual Elements | Perspective lines, Linear perspective, Church interior | Pipe organ, Strings, Spacious acoustic reverb |
| Images | Human-Defined Tags | Generated Caption | Caption-Based Semantic Tags | NLP-Based Sentiment Tags |
|---|---|---|---|---|
 | tulips, flowers, march, garden, red, bouquet, flower, bloom, beauty, tulip, spring, flora, nature | a bouquet of colorful tulips in a store | bloom, beauty, tulips, spring, flora | tulips: 0.0, flowers: 0.0, march: 0.0, garden: 0.0, red: 0.0, bouquet: 0.0, flower: 0.0, bloom: 0.0, beauty: 0.5859, tulip: 0.0, spring: 0.0, flora: 0.0, nature: 0.0 |
 | happiness, optimist, graffiti, smile, happy eyes, playful, youth, dream, green, young woman, charming, tree, smiling. | a young girl smiles while posing in front of a flowering tree | young woman, smile, tree | happiness: 0.5574, optimist: 0.5267, graffiti: 0.0 smile: 0.3612, happy eyes: 0.5719, playful: 0.4404, youth: 0.0, dream: 0.25, green: 0.0, young woman: 0.0, charming: 0.5859, tree: 0.0, smiling: 0.4588 |
| Web-Music | Human-Defined Tags | Tags-Based Generated Caption (OpenAssistant) | Music-Based Captions (LP-MusicCaps) | NLP-Based Sentiment Tags |
|---|---|---|---|---|
| Music-31 | 1. Mood-based tags: ‘relax’, ‘relaxing’, ‘relaxation’, ‘ambient’, ‘piano’, ‘chilling’, ‘nature’, ‘forest’, ‘woods’, ‘planet’, ‘sleeping’, ‘pray’, ‘relaxing mood’, ‘chill’, ‘peaceful’, ‘dreamy’, ‘bright’, ‘relaxing’, ‘hopeful’, ‘laid back’ 2. Genre ‘ambient’, ‘beats’, ‘electronic’, ‘beautiful plays’ 3. Movement ‘floating’, ‘smooth’, ‘medium’, ‘elegant’ 4. Theme: ‘music for videos’, ‘music for YouTube videos’, ‘background music’ | 1. Tags-based: ‘A peaceful and dreamy piano melody fills the air, surrounded by the calming sounds of nature and chirping birds. The atmosphere is filled with a sense of hope and relaxation, as the listener finds solace in the sound of the piano’. 2. Genre-Movement- Theme based: ‘A musical journey of floating elegance, smooth movement and mesmerizing music for Youtube videos’. 3. All-tags: ‘A beautiful piano plays in the background of a tranquil forest, with peaceful, dreamy synths and ambient pads. The music adds a relaxing and hopeful mood to the video, perfect for promoting positive vibes and encouraging viewers to stay grounded and optimistic’. | [10:00–20:00] This audio contains someone playing a melody on a theremin. A deep male voice is singing in the mid to higher range. This song may be playing in a church. . . . [180:00–190:00] The low quality recording features a shimmering cymbal in the left channel, alongside a suspenseful didgeridoo melody, followed by tinny wooden percussion and a violin melody in the right channel of the stereo image. The recording is noisy and in mono. | relax: 0.4404, relaxing: 0.4939, relaxation: 0.5267, ambient: 0.0, piano: 0.0, chilling: 0.0258, nature: 0.0, forest: 0.0, woods: 0.0, planet: 0.0, sleeping: 0.0, pray: 0.3182, chill: 0.0, peaceful: 0.4939, dreamy: 0.0, bright: 0.4404, hopeful: 0.5106, laid back: 0.0 |
| MuIm Segment | Image | Music |
|---|---|---|
| Artistic Segment |
|
|
| Realistic Segment |
|
|
| Semantics | Affective | Annotations | Number of Samples | ||||
|---|---|---|---|---|---|---|---|
| Human | AI models | Images | Music | Pairs | |||
| Artistic |
|
| 28D Emotions | 1 Caption | 2319 | 1841 | 50K |
| Web-based | Affective tags Semantic tags | Tag-caption Media-caption Tag-media Caption | 540K | 25K | 700K | ||
Disclaimer/Publisher’s Note: The statements, opinions and data contained in all publications are solely those of the individual author(s) and contributor(s) and not of MDPI and/or the editor(s). MDPI and/or the editor(s) disclaim responsibility for any injury to people or property resulting from any ideas, methods, instructions or products referred to in the content. |
© 2024 by the authors. Licensee MDPI, Basel, Switzerland. This article is an open access article distributed under the terms and conditions of the Creative Commons Attribution (CC BY) license (https://creativecommons.org/licenses/by/4.0/).
Share and Cite
Ullah, U.; Choi, H.-C. MuIm: Analyzing Music–Image Correlations from an Artistic Perspective. Appl. Sci. 2024, 14, 11470. https://doi.org/10.3390/app142311470
Ullah U, Choi H-C. MuIm: Analyzing Music–Image Correlations from an Artistic Perspective. Applied Sciences. 2024; 14(23):11470. https://doi.org/10.3390/app142311470
Chicago/Turabian StyleUllah, Ubaid, and Hyun-Chul Choi. 2024. "MuIm: Analyzing Music–Image Correlations from an Artistic Perspective" Applied Sciences 14, no. 23: 11470. https://doi.org/10.3390/app142311470
APA StyleUllah, U., & Choi, H.-C. (2024). MuIm: Analyzing Music–Image Correlations from an Artistic Perspective. Applied Sciences, 14(23), 11470. https://doi.org/10.3390/app142311470