
Assessing Ammonia (NH₃) Emissions, Precursor Gas (SO2, NOx) Concentrations, and Source Contributions to Atmospheric PM2.5 from a Commercial Manure Composting Facility


Abstract
1. Introduction
2. Materials and Methods
2.1. Monitoring Site
2.2. Monitoring System
2.2.1. Precursor Gas Measurement
2.2.2. Particulate Matter Measurement
2.2.3. Environmental Variables
2.3. Ammonia Emissions Flux Calculations
2.4. Statistical Analyses
3. Results and Discussion
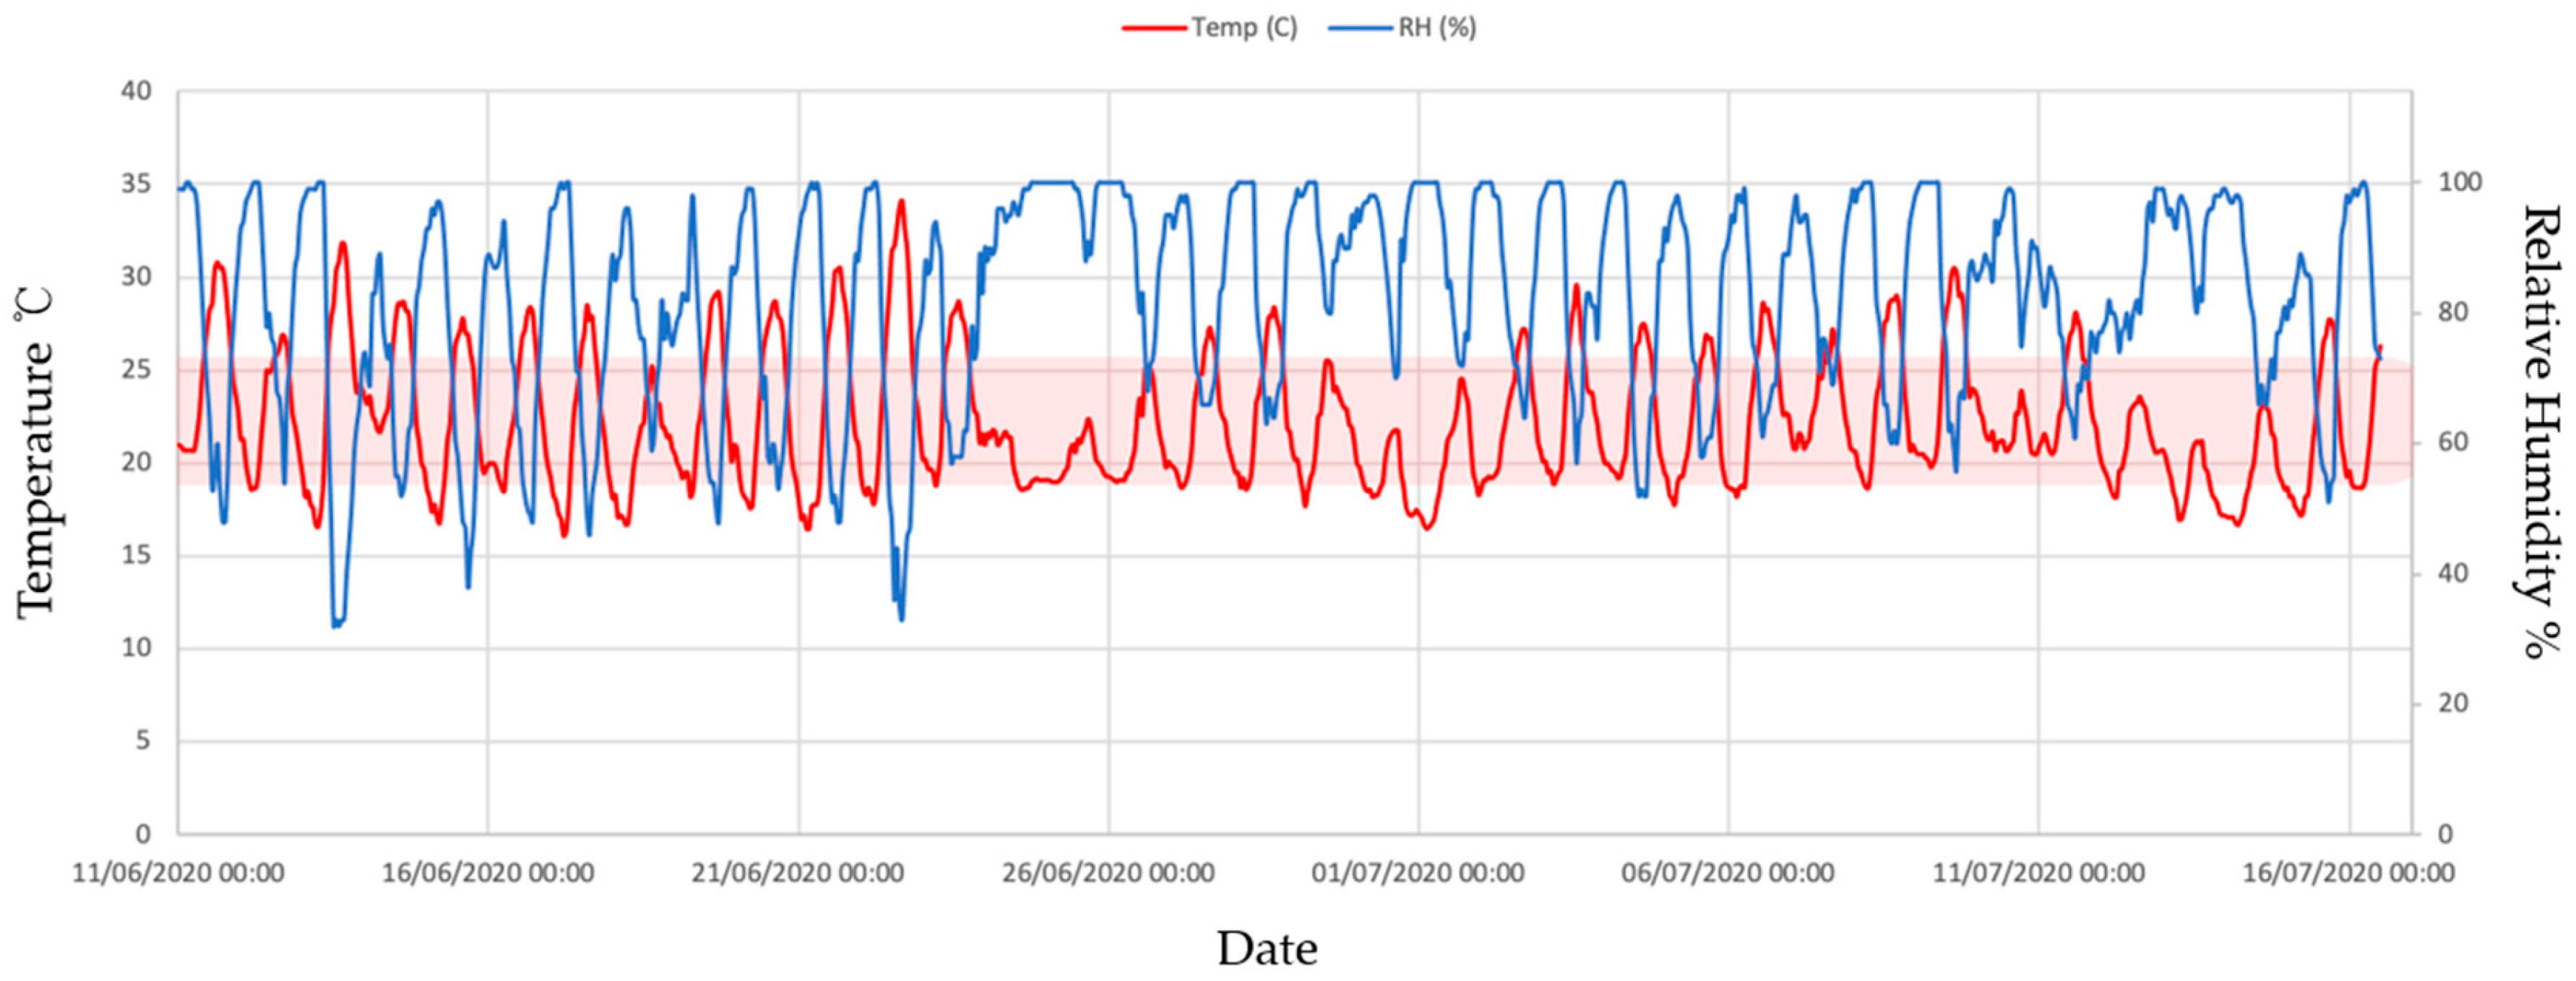
3.1. Environmental Variables: Temperature and Relative Humidity
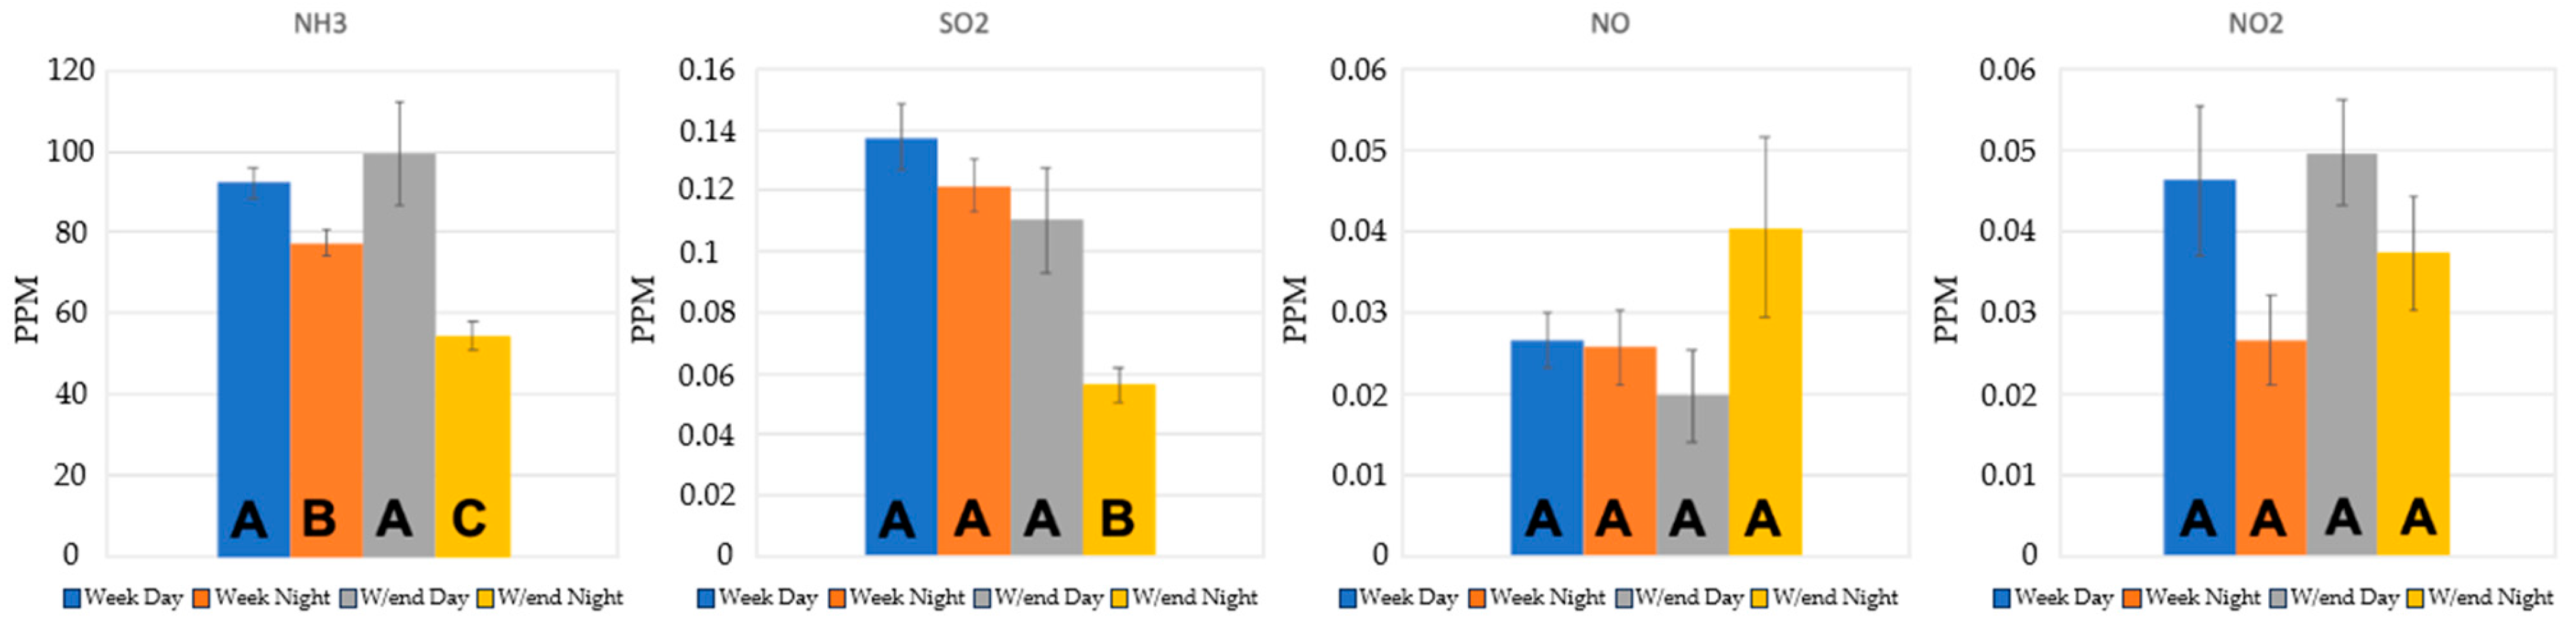
3.2. Gas Concentrations
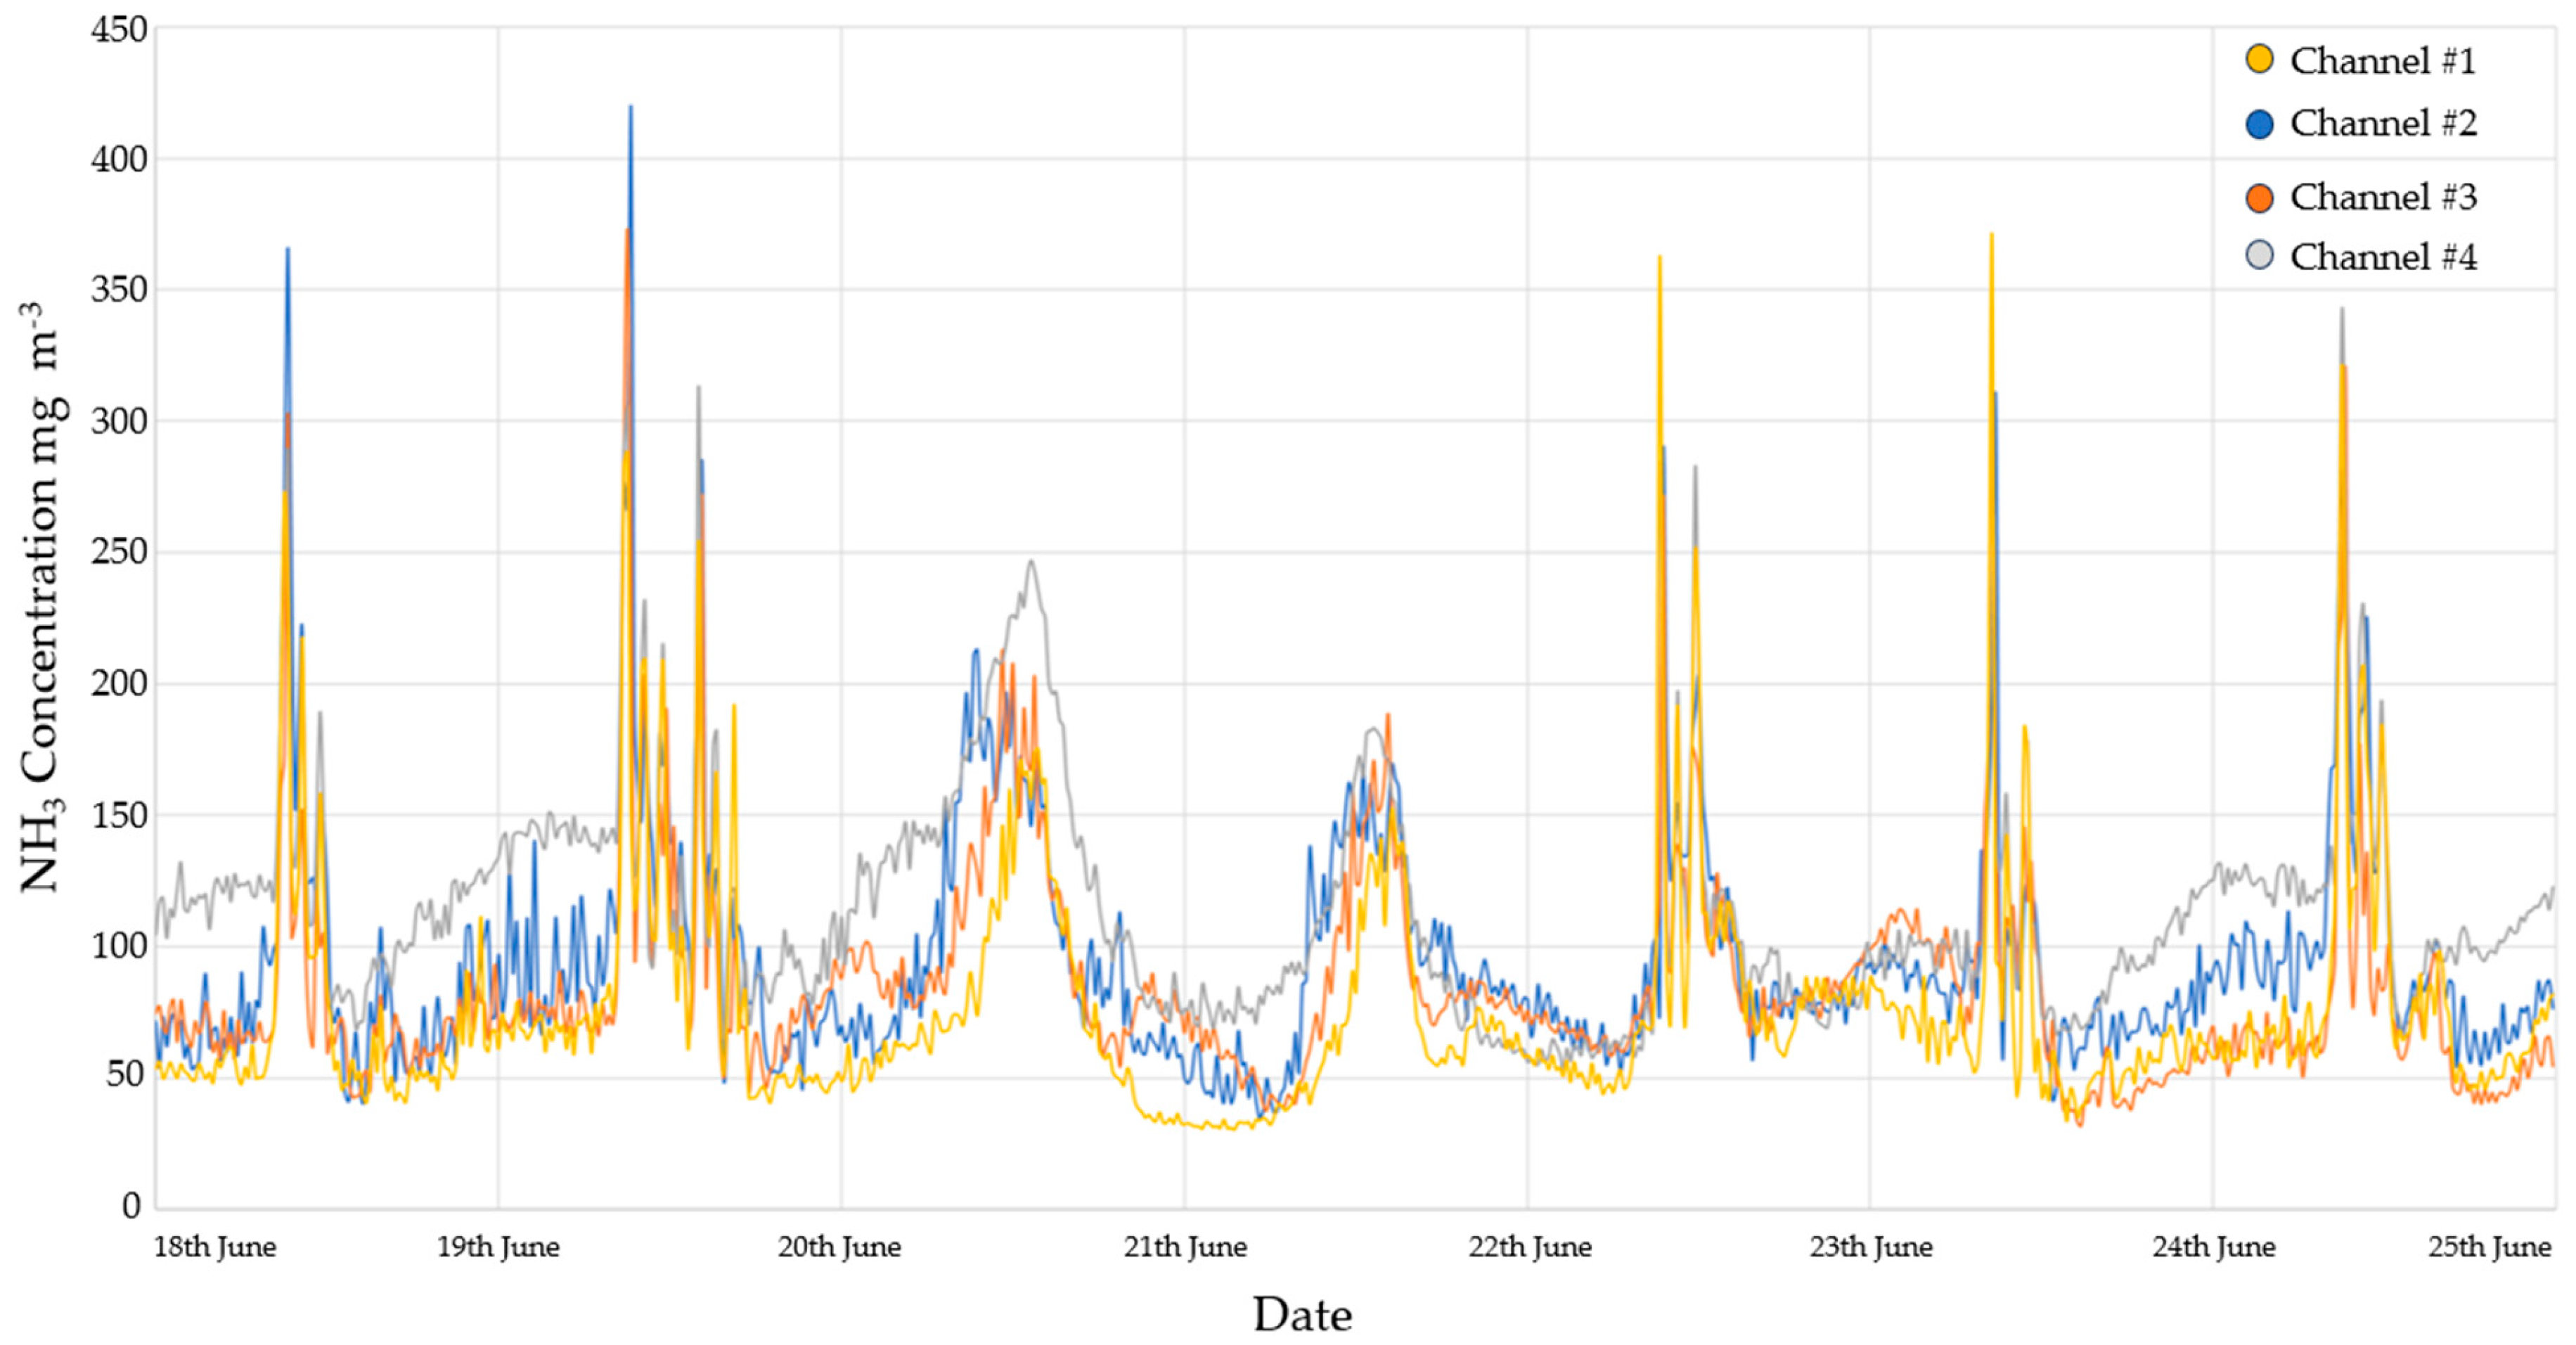
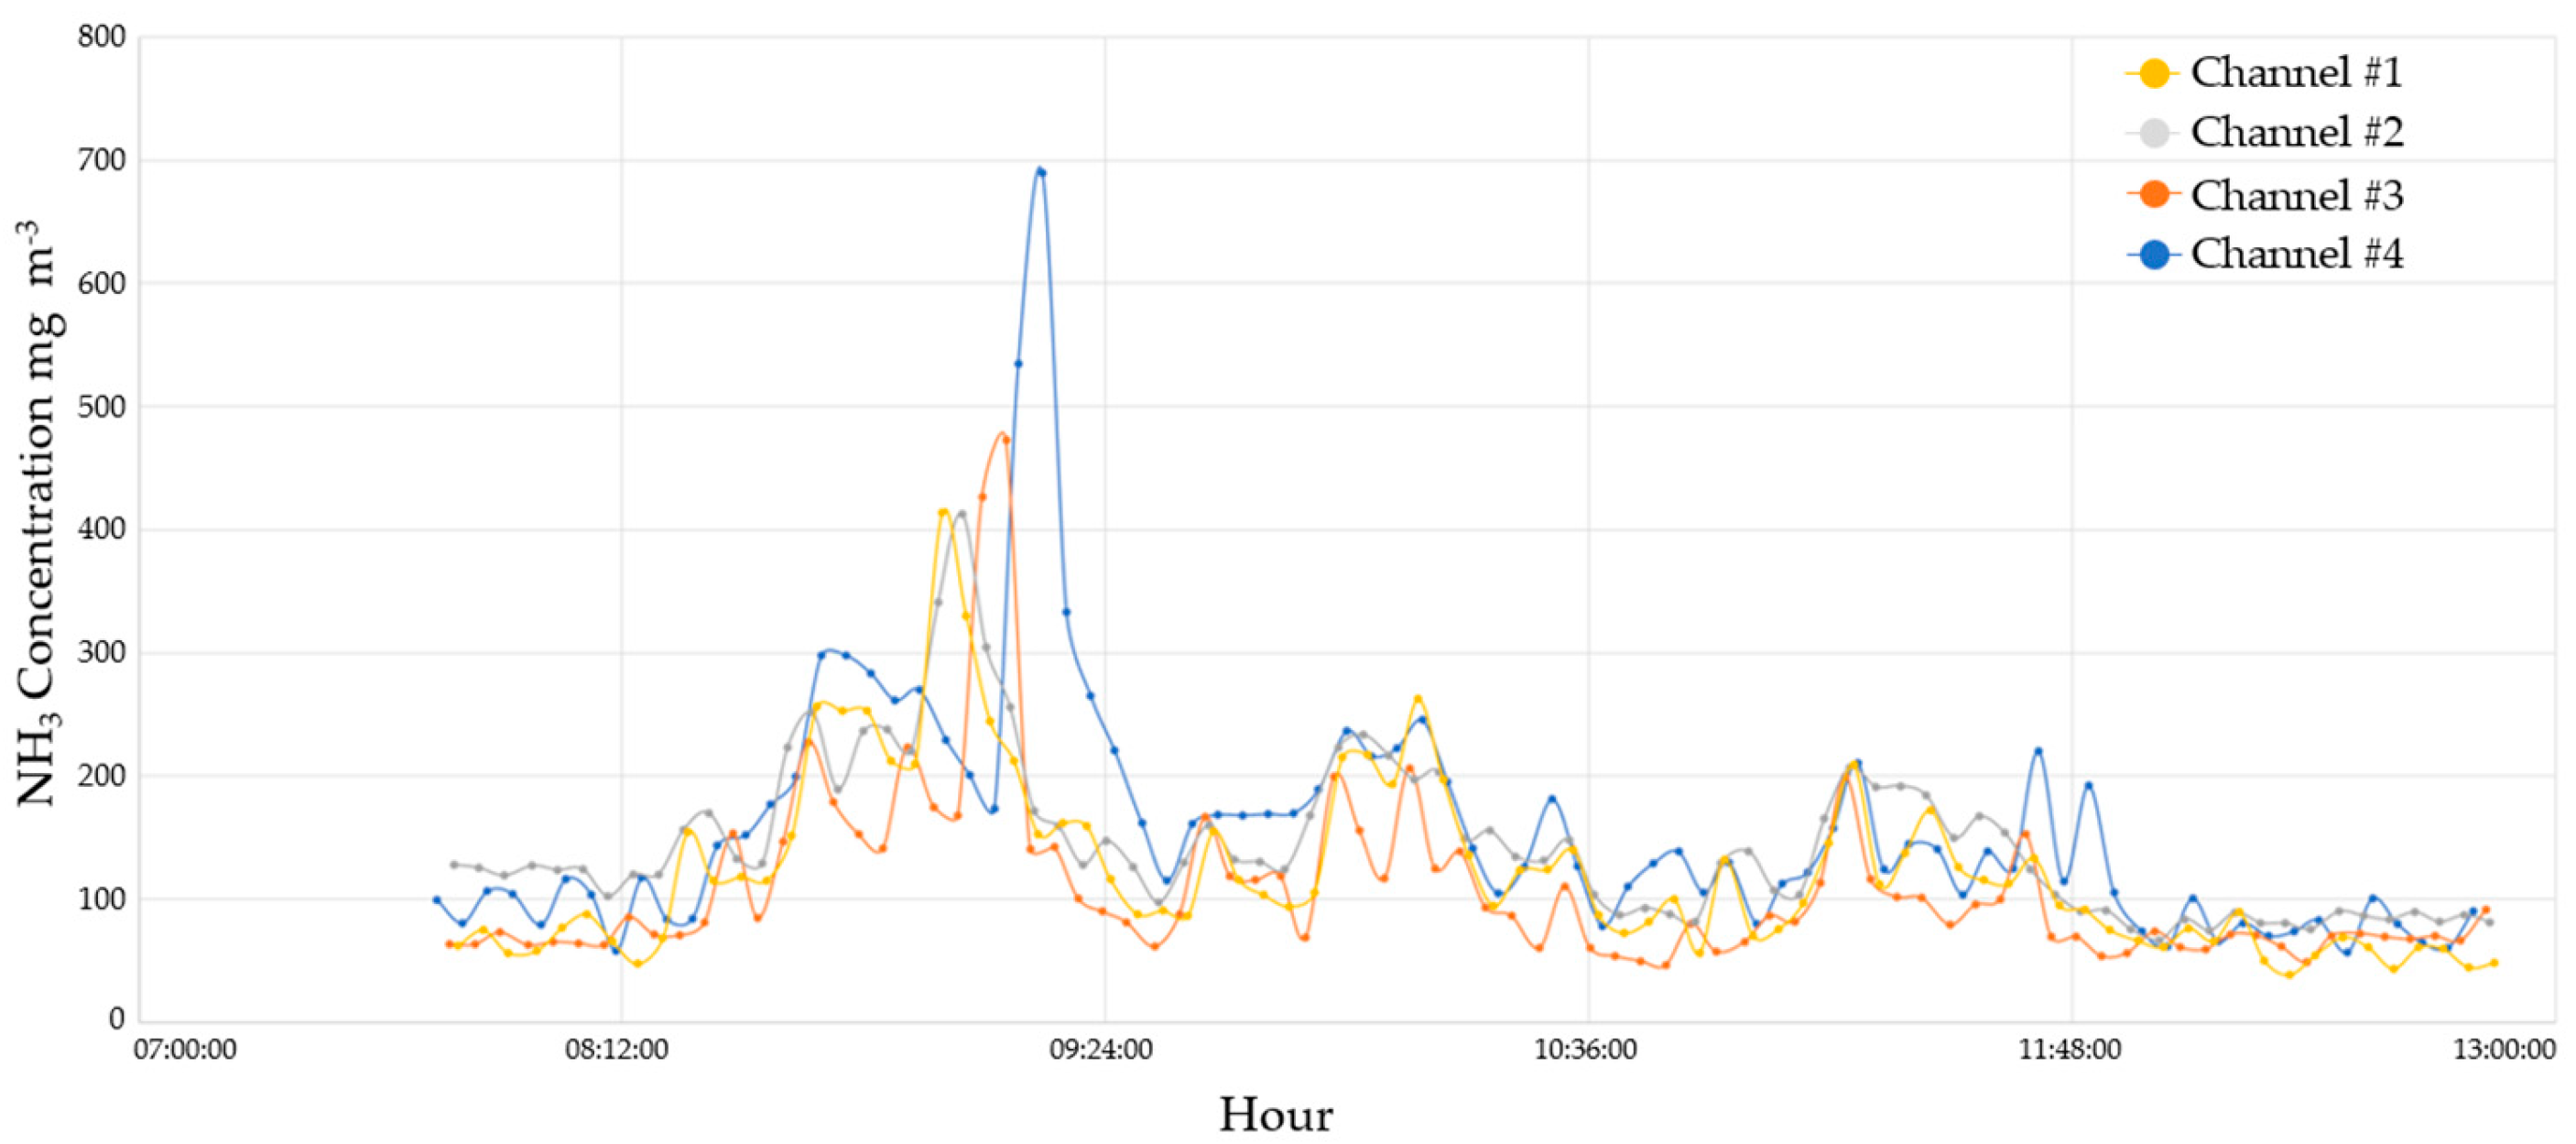
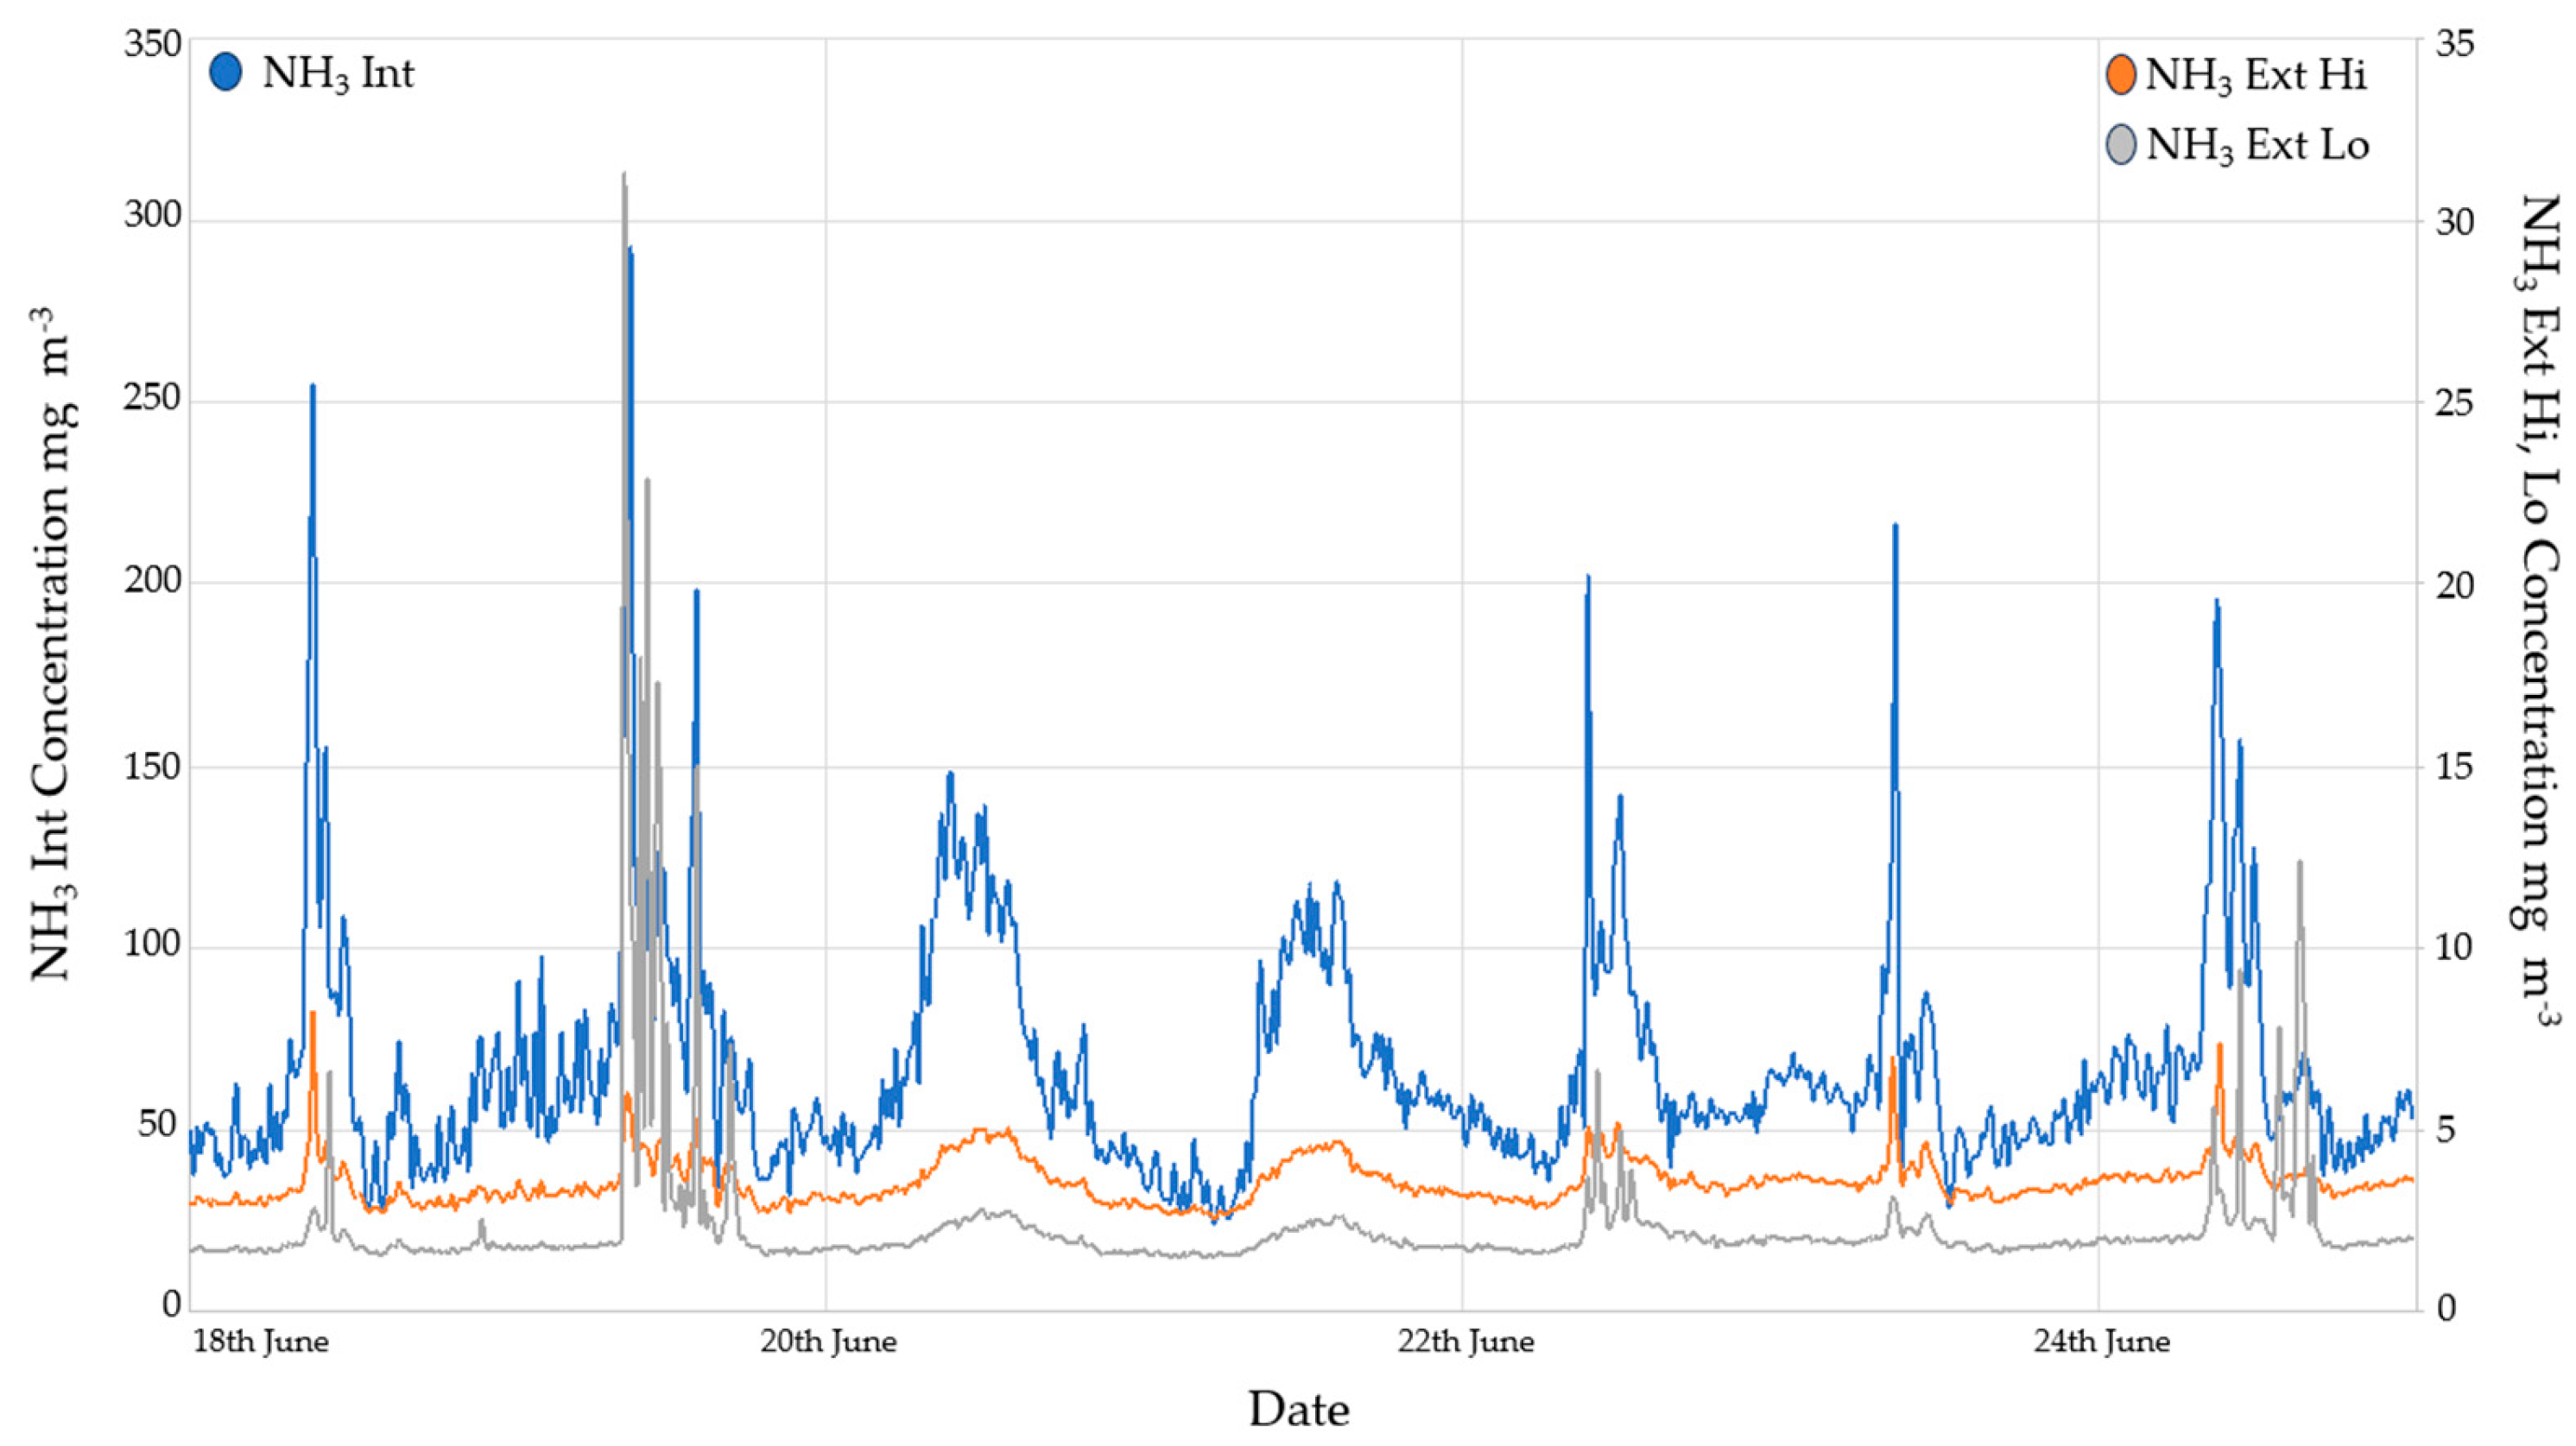
3.2.1. Ammonia Monitoring Results
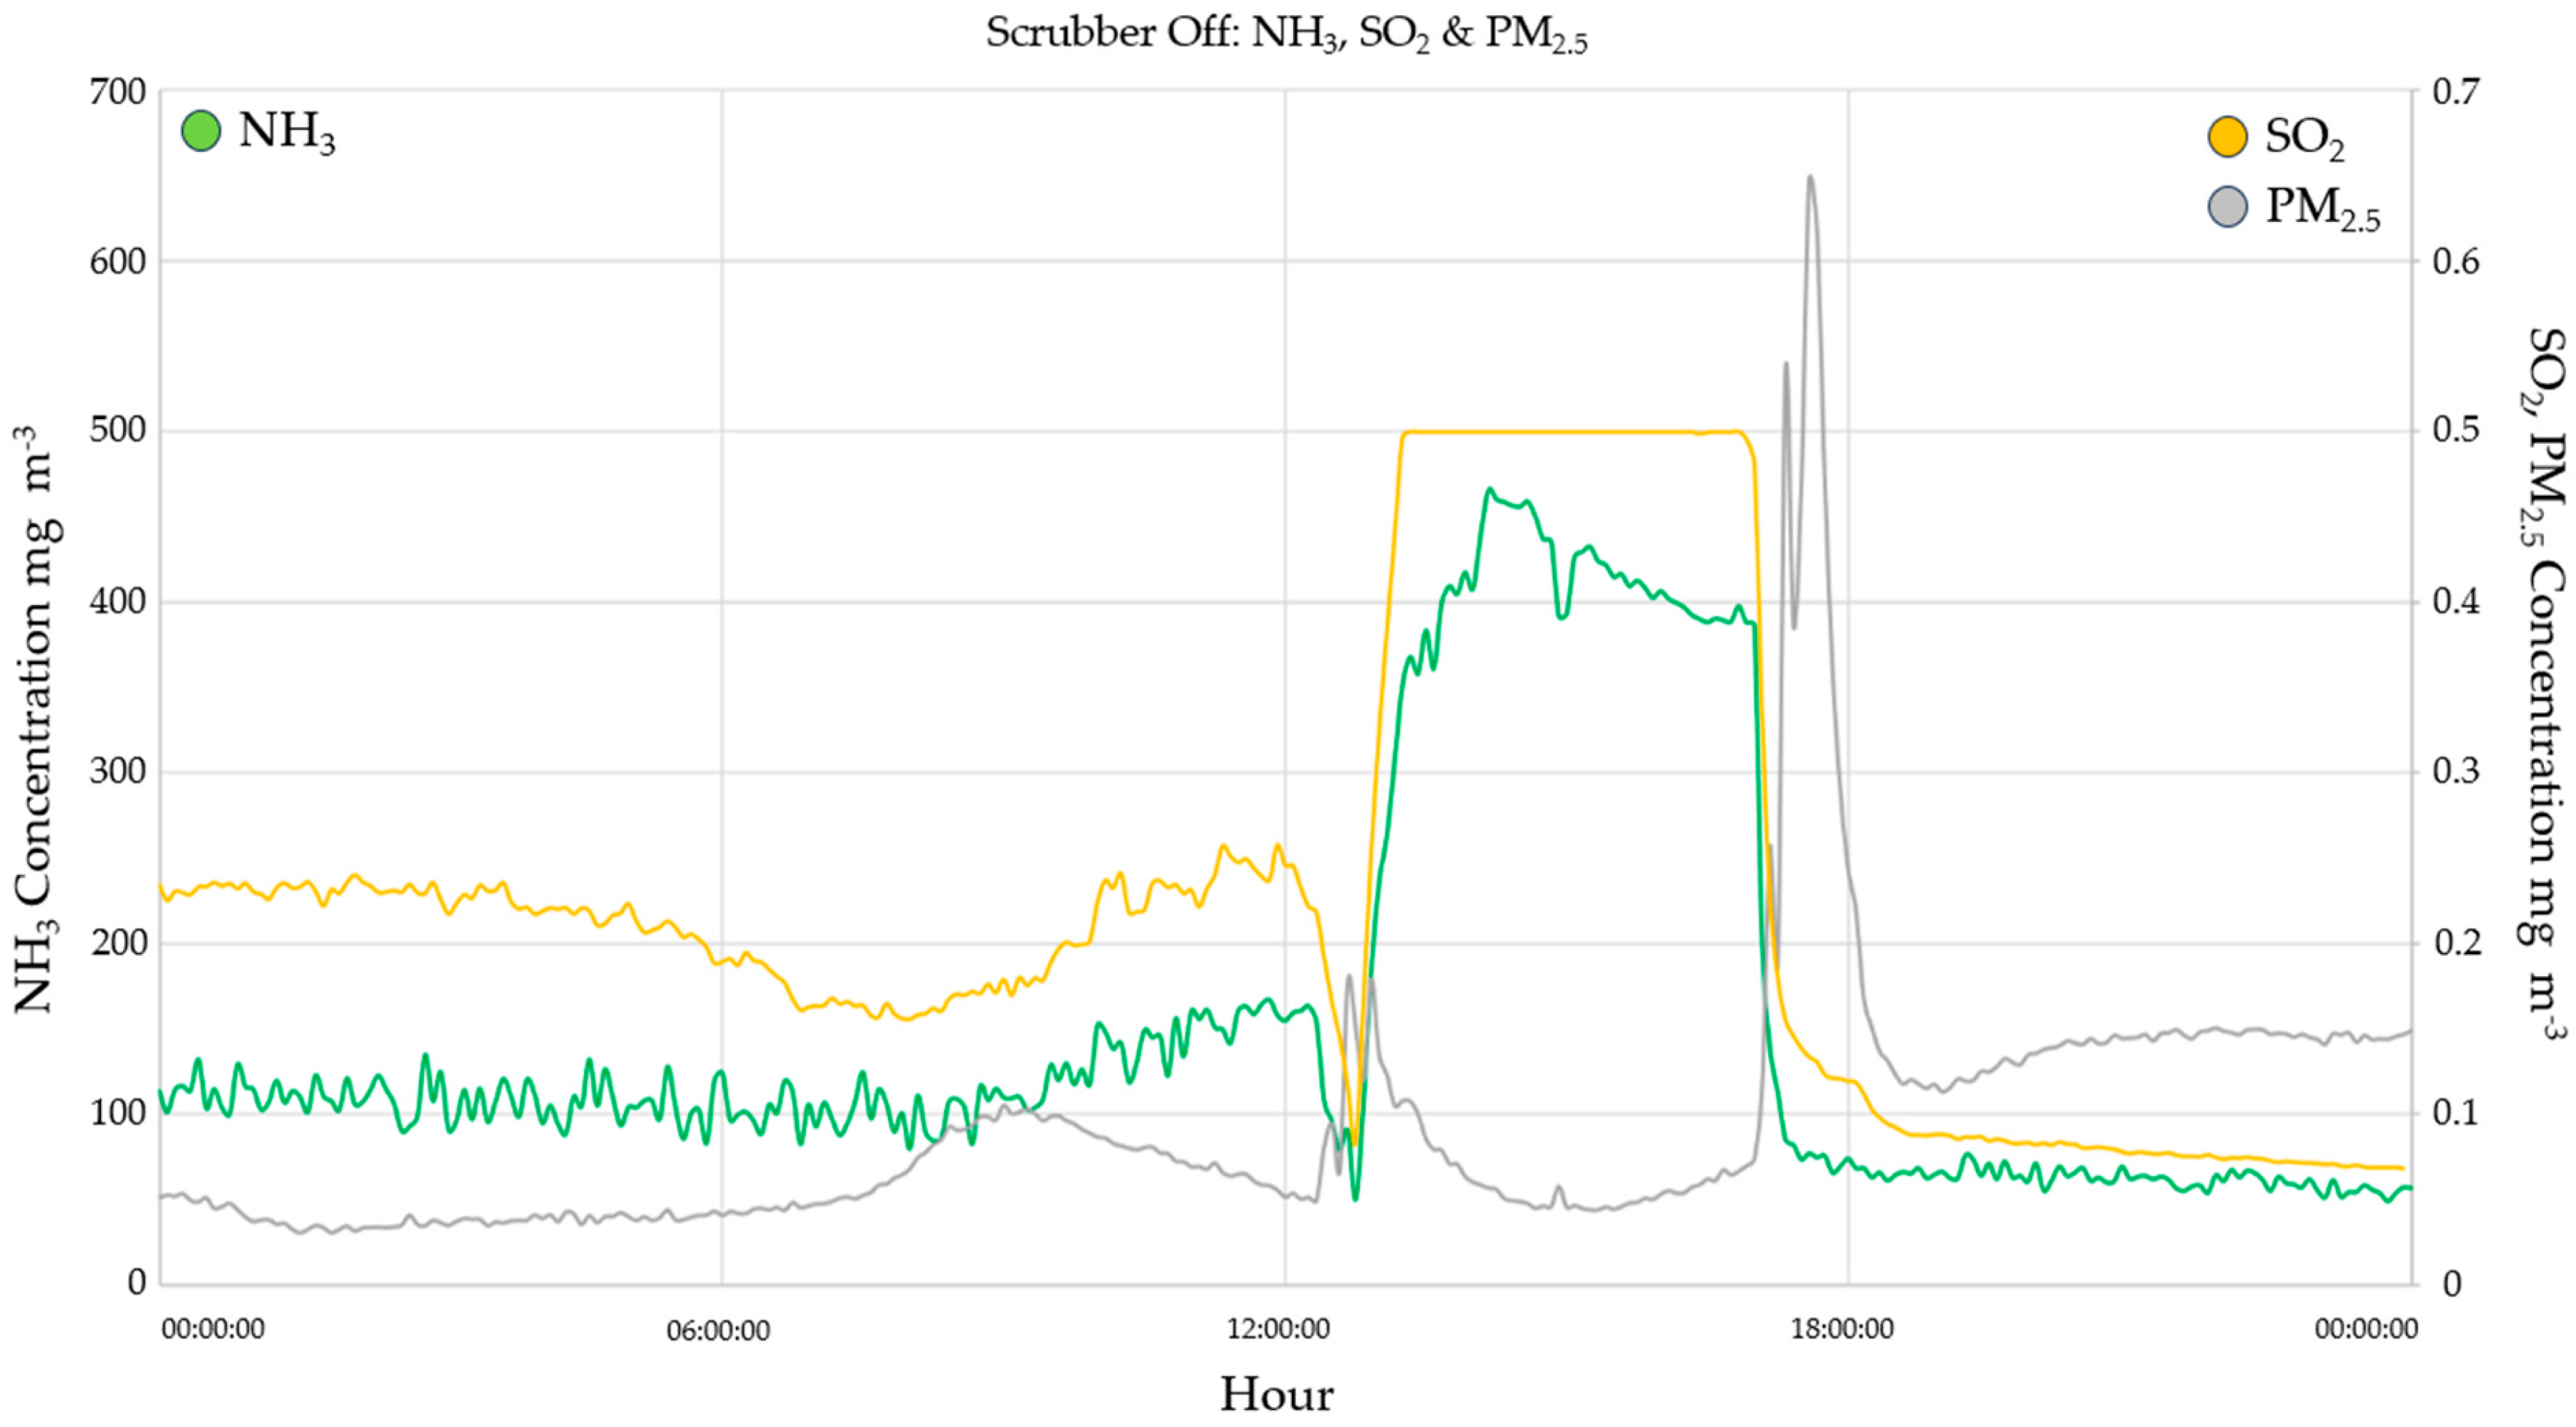
3.2.2. SO2
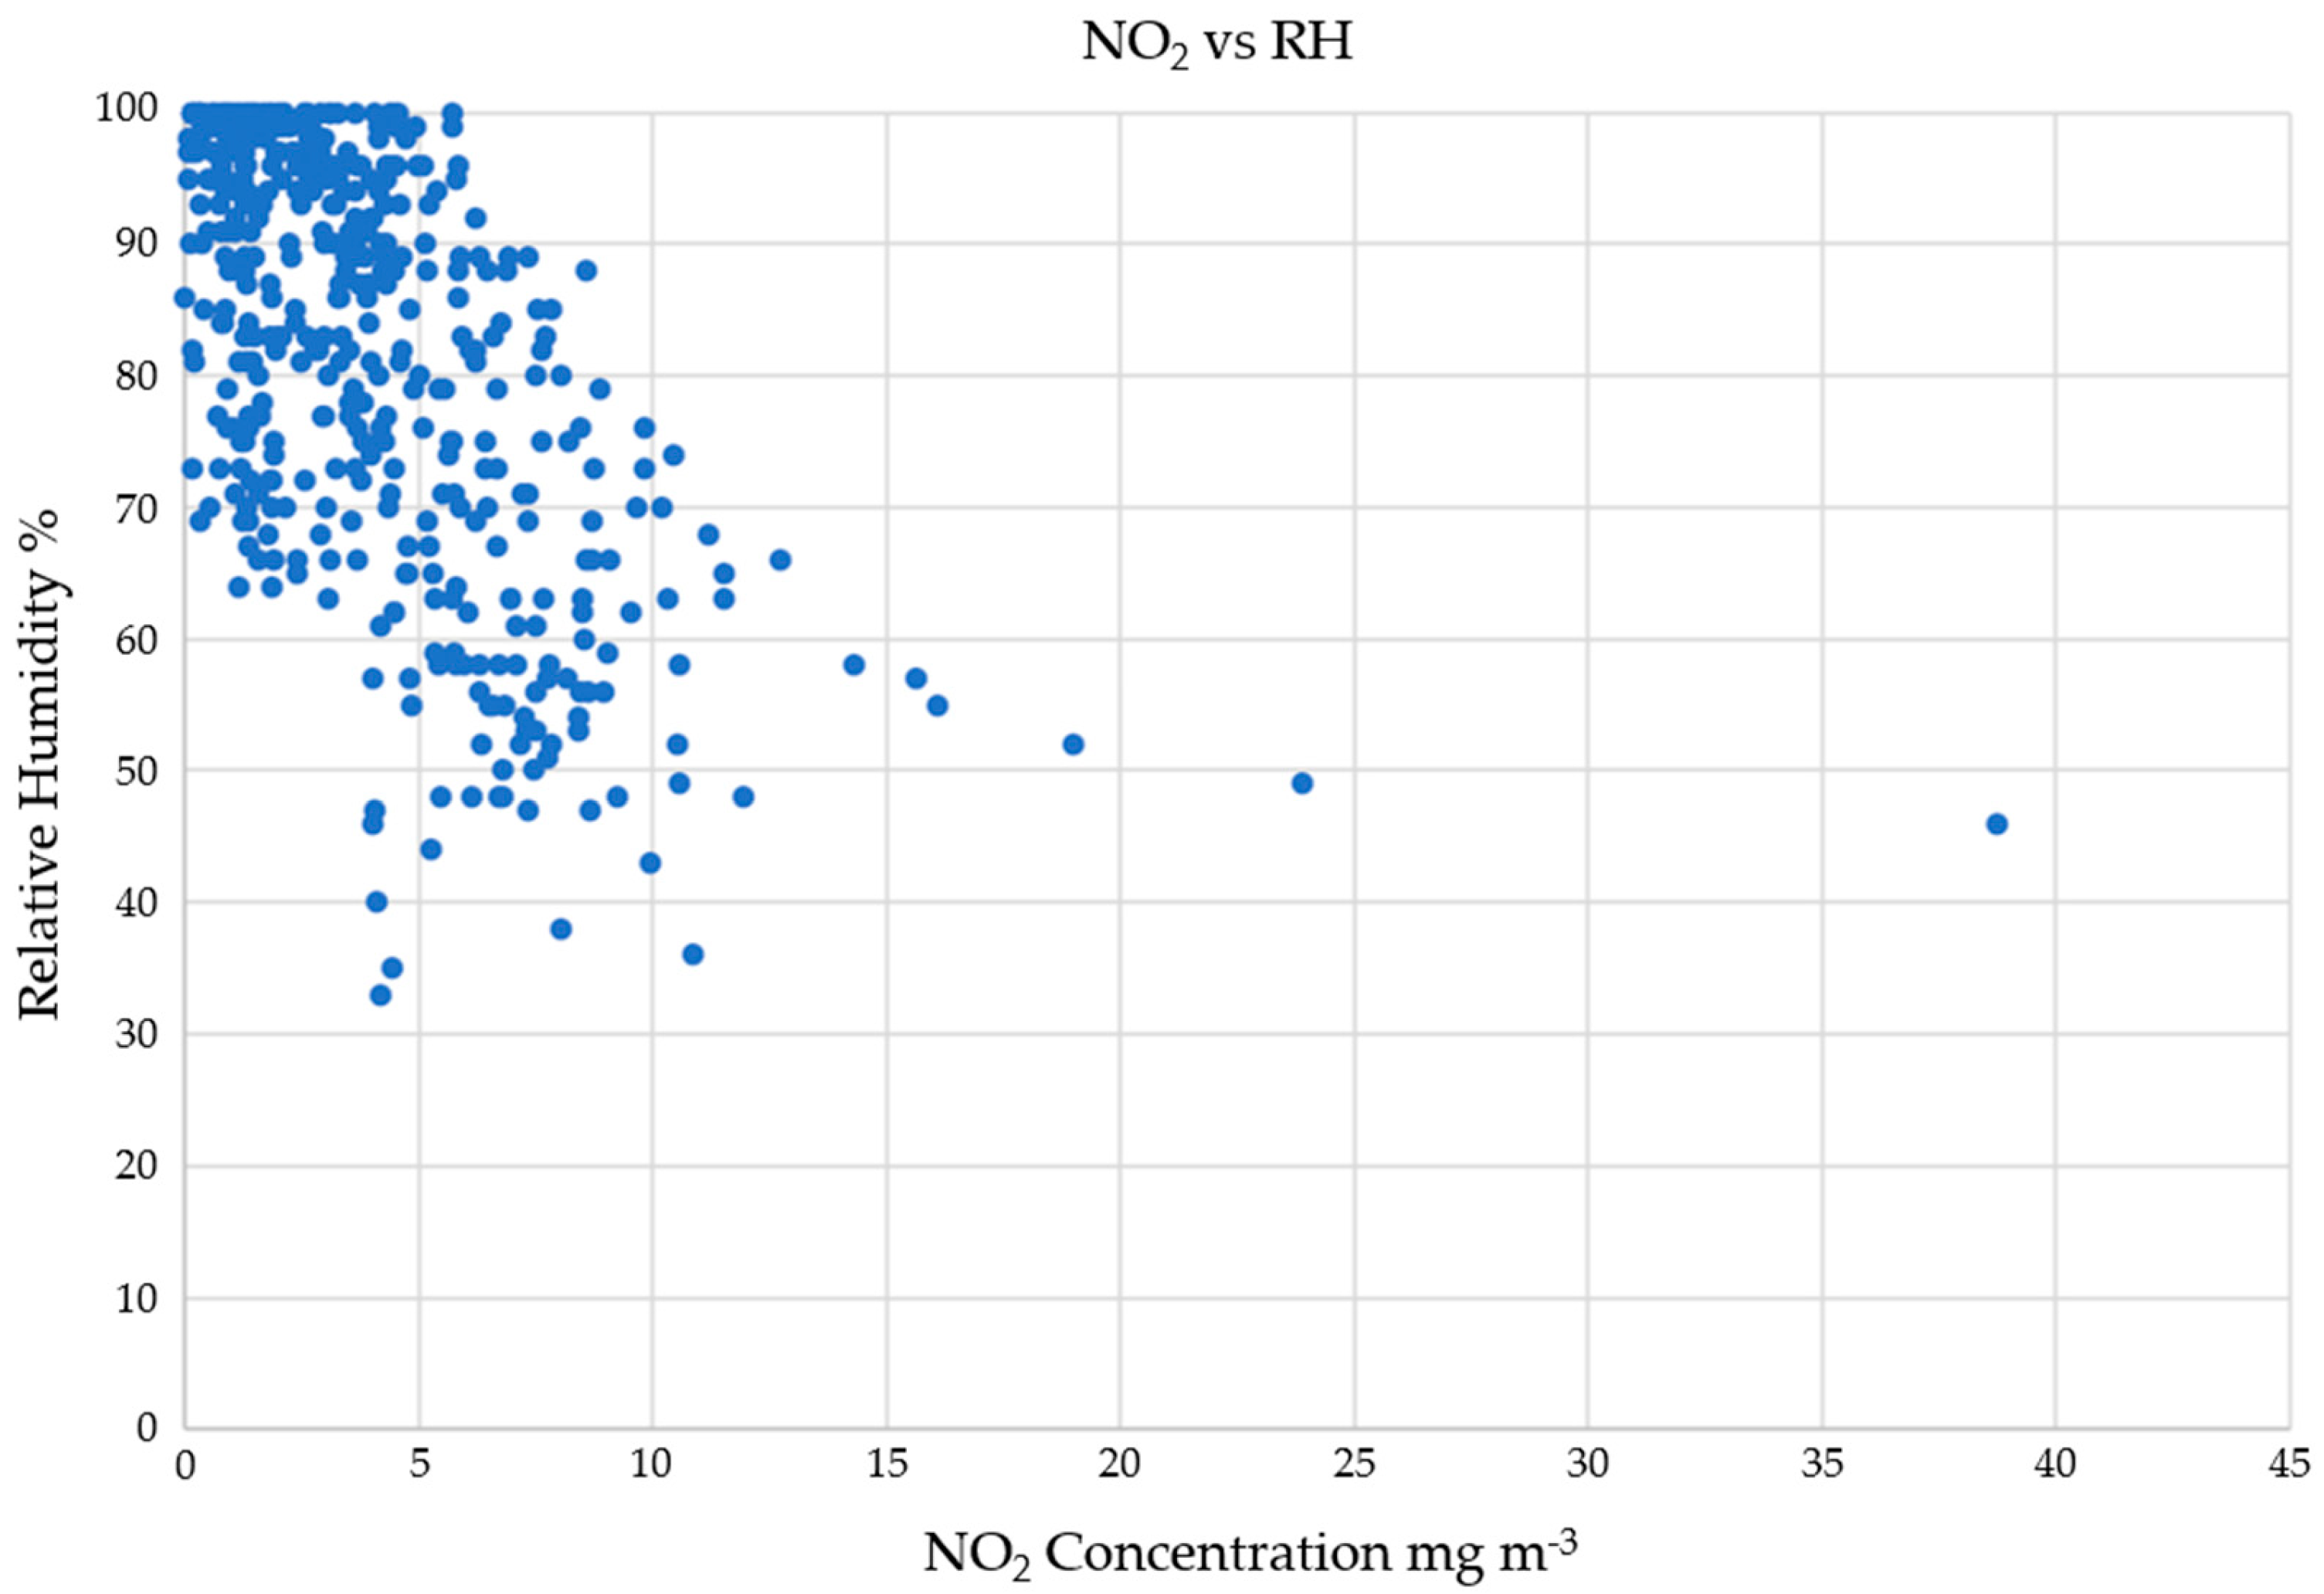
3.2.3. NOx
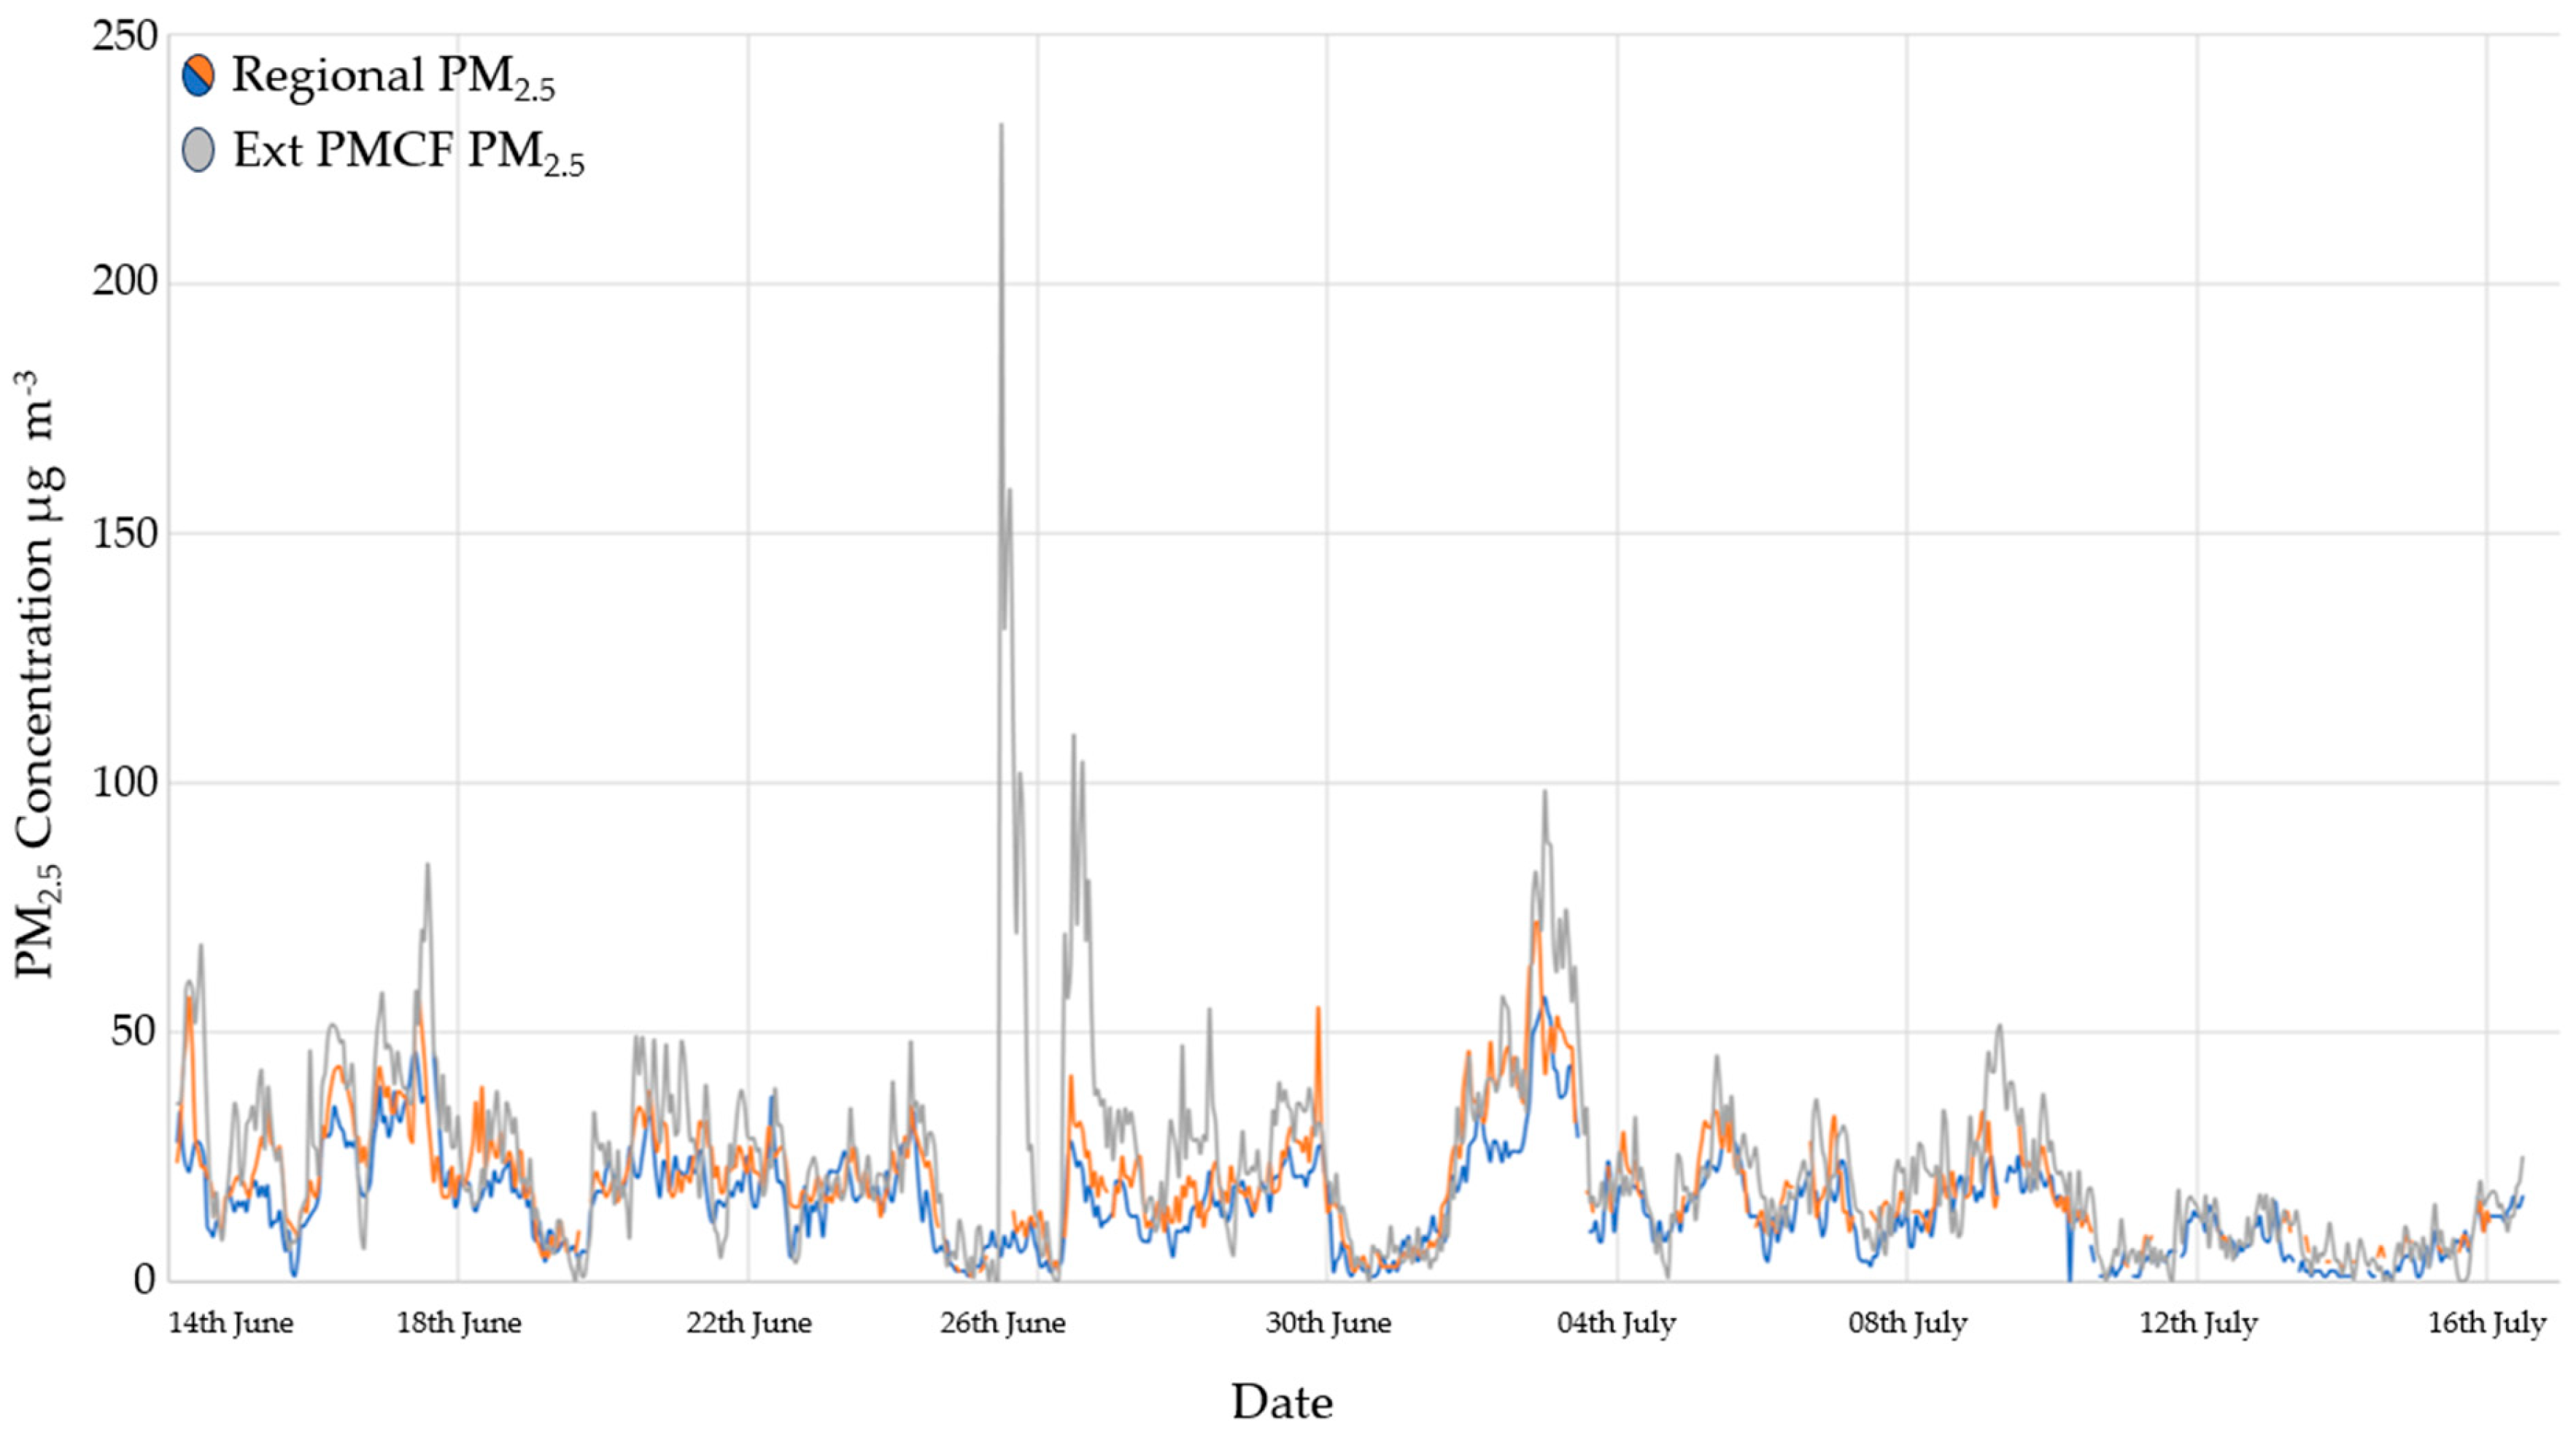
3.3. Particulate Matter Concentrations
3.4. Ammonia Emission Rate
4. Conclusions
Author Contributions
Funding
Institutional Review Board Statement
Informed Consent Statement
Data Availability Statement
Conflicts of Interest
References
- Bracamonte-Terán, J.A.; Meza-Figueroa, D.; García-Rico, L.; Schiavo, B.; Meza-Montenegro, M.; Valenzuela-Quintanar, A. Agricultural abandoned lands as emission sources of dust containing metals and pesticides in the Sonora-Arizona Desert. Environ. Monit. Assess. 2023, 195, 1496. [Google Scholar] [CrossRef] [PubMed]
- Huang, S.; Ghazali, S.; Azadi, H.; Movahhed Moghaddam, S.; Viira, A.; Janečková, K.; Sklenička, P.; Lopez-Carr, D.; Köhl, M.; Kurban, A. Contribution of agricultural land conversion to global GHG emissions: A meta-analysis. Sci. Total Environ. 2023, 876, 162269. [Google Scholar] [CrossRef]
- Korean National Air Pollutants Emission Service. Gaseous Emissions by Sector. 2017. Available online: http://web.archive.org/web/20210921084554/https://airemiss.nier.go.kr/module/statistics/causeStatistics.do?siteId=airemiss&id=airemiss_030300000000 (accessed on 3 February 2021).
- Streets, D.G.; Bond, T.C.; Carmichael, G.R.; Fernandes, S.D.; Fu, Q.; He, D.; Klimont, Z.; Nelson, S.M.; Tsai, N.Y.; Wang, M.Q. An inventory of gaseous and primary aerosol emissions in Asia in the year 2000. J. Geophys. Res. Atmos. 2003, 108. [Google Scholar] [CrossRef]
- Velthof, G.L.; van Bruggen, C.; Groenestein, C.M.; de Haan, B.J.; Hoogeveen, M.W.; Huijsmans, J. A model for inventory of ammonia emissions from agriculture in the Netherlands. Atmos. Environ. 2012, 46, 248–255. [Google Scholar] [CrossRef]
- Wang, S.; Nan, J.; Shi, C.; Fu, Q.; Gao, S.; Wang, D.; Cui, H.; Saiz-Lopez, A.; Zhou, B. Atmospheric ammonia and its impacts on regional air quality over the megacity of Shanghai, China. Sci. Rep. 2015, 5, 15842. [Google Scholar] [CrossRef] [PubMed]
- Zhao, L.; Hadlocon, L.J.S.; Manuzon, R.B.; Darr, M.J.; Keener, H.M.; Heber, A.J.; Ni, J. Ammonia concentrations and emission rates at a commercial poultry manure composting facility. Biosyst. Eng. 2016, 150, 69–78. [Google Scholar] [CrossRef]
- Sommer, S.G.; Webb, J.; Hutchings, N.D. New emission factors for calculation of ammonia volatilization from European livestock manure management systems. Front. Sustain. Food Syst. 2019, 3, 101. [Google Scholar] [CrossRef]
- Hristov, A.N. Technical note: Contribution of ammonia emitted from livestock to atmospheric fine particulate matter (PM2.5) in the United States. J. Dairy Sci. 2011, 94, 3130–3136. [Google Scholar] [CrossRef]
- Zhang, N.; Bai, Z.; Winiwarter, W.; Ledgard, S.; Luo, J.; Liu, J.; Guo, Y.; Ma, L. Reducing ammonia emissions from dairy cattle production via cost-effective manure management techniques in China. Environ. Sci. Technol. 2019, 53, 11840–11848. [Google Scholar] [CrossRef]
- Sutton, M.A.; Oenema, O.; Erisman, J.W.; Leip, A.; van Grinsven, H.; Winiwarter, W. Too much of a good thing. Nature 2011, 472, 159–161. [Google Scholar] [CrossRef] [PubMed]
- Hristov, A.H.; Hanigan, M.; Cole, A.; Todd, R.; Mcallister, T.A.; Ndegwa, P.M.; Rotz, A. Review: Ammonia emissions from dairy farms and beef feedlots. Can. J. Ani. Sci. 2011, 91, 1–35. [Google Scholar] [CrossRef]
- OECD. Meat Consumption (Indicator). 2021. Available online: https://doi.org/10.1787/fa290fd0-en (accessed on 6 December 2024).
- Won, S.; Yoon, Y.; Hamid, M.M.A.; Reza, A.; Shim, S.; Kim, S.; Ra, C.; Novianty, E.; Park, K. Estimation of greenhouse gas emission from Hanwoo (Korean native cattle) manure management systems. Atmosphere 2020, 11, 845. [Google Scholar] [CrossRef]
- Jo, S.; Kim, K.; Jeon, B.; Lee, M.; Kim, Y.; Kim, B.; Cho, S.; Hwang, O.; Bhattacharya, S.S. Odor characterization from barns and slurry treatment facilities at a commercial swine facility in South Korea. Atmos. Environ. 2015, 119, 339–347. [Google Scholar] [CrossRef]
- Ba, S.; Qu, Q.; Zhang, K.; Groot, J.C.J. Meta-analysis of greenhouse gas and ammonia emissions from dairy manure composting. Biosyst. Eng. 2020, 193, 126–137. [Google Scholar] [CrossRef]
- Wang, Y.; Liu, S.; Xue, W.; Guo, H.; Li, X.; Zou, G.; Zhao, T.; Dong, H. The characteristics of carbon, nitrogen and sulfur transformation during cattle manure composting—Based on different aeration strategies. Int. J. Environ. Res. Public Health 2019, 16, 3930. [Google Scholar] [CrossRef] [PubMed]
- Fillingham, M.A.; VanderZaag, A.C.; Burtt, S.; Baldé, H.; Ngwabie, N.M.; Smith, W.; Hakami, A.; Wagner-Riddle, C.; Bittman, S.; MacDonald, D. Greenhouse gas and ammonia emissions from production of compost bedding on a dairy farm. Waste Manag. 2017, 70, 45–52. [Google Scholar] [CrossRef]
- Jiang, T.; Li, G.; Tang, Q.; Ma, X.; Wang, G.; Schuchardt, F. Effects of aeration method and aeration rate on greenhouse gas emissions during composting of pig feces in pilot scale. J. Environ. Sci. 2015, 31, 124–132. [Google Scholar] [CrossRef]
- Pardo, G.; Moral, R.; Aguilera, E.; Prado, A. Gaseous emissions from management of solid waste: A systematic review. Glo. Chang. Biol. 2015, 21, 1313–1327. [Google Scholar] [CrossRef]
- Behera, S.N.; Sharma, M.; Aneja, V.P.; Balasubramanian, R. Ammonia in the atmosphere: A review on emission sources, atmospheric chemistry and deposition on terrestrial bodies. Environ. Sci. Pollut. Res. 2013, 20, 8092–8131. [Google Scholar] [CrossRef]
- Behera, S.N.; Sharma, M. Degradation of SO2, NO2 and NH3 leading to formation of secondary inorganic aerosols: An environmental chamber study. Atmos. Environ. 2011, 45, 4015–4024. [Google Scholar] [CrossRef]
- Sharma, M.; Kishore, S.; Tripathi, S.N.; Behera, S.N. Role of atmospheric ammonia in the formation of inorganic secondary particulate matter: A study at Kanpur, India. J. Atmos. Chem. 2007, 58, 1–17. [Google Scholar] [CrossRef]
- Ye, Z.; Guo, X.; Cheng, L.; Cheng, S.; Chen, D.; Wang, W.; Liu, B. Reducing PM2.5 and secondary inorganic aerosols by agricultural ammonia emission mitigation within the Beijing-Tianjin-Hebei region, China. Atmos. Environ. 2019, 219, 116989. [Google Scholar] [CrossRef]
- Backes, A.; Aulinger, A.; Bieser, J.; Matthias, V.; Quante, M. Ammonia emissions in Europe, part I: Development of a dynamical ammonia emission inventory. Atmos. Environ. 2016, 131, 55–66. [Google Scholar] [CrossRef]
- Erisman, J.W.; Schaap, M. The need for ammonia abatement with respect to secondary PM reductions in Europe. Environ. Pollut. 2004, 129, 159–163. [Google Scholar] [CrossRef] [PubMed]
- Pozzer, A.; Tsimpidi, A.P.; Karydis, V.A.; Meij, A.; Lelieveld, J. Impact of agricultural emission reductions on fine-particulate matter and public health. Atmos. Chem. Phys. Discuss. 2017, 17, 12813–12826. [Google Scholar] [CrossRef]
- Kashima, S.; Yorifuji, T.; Bae, S.; Honda, Y.; Lim, Y.; Hong, Y. Asian dust effect on cause-specific mortality in five cities across South Korea and Japan. Atmos. Environ. 2016, 128, 20–27. [Google Scholar] [CrossRef]
- Kwon, H.J.; Cho, S.H.; Chun, Y.; Lagarde, F.; Pershagen, G. Effects of the Asian dust events on daily mortality in Seoul, Korea. Environ. Res. 2002, 90, 1–5. [Google Scholar] [CrossRef]
- Jeong, D. Socio-economic costs from yellow dust damages in South Korea. Korean Soc. Sci. J. 2008, 35, 1–29. [Google Scholar]
- Wang, Y.; Niu, B.; Ni, J.; Xue, W.; Zhu, Z.; Li, X.; Zou, G. New insights into concentrations, sources and transformations of NH3, NOx, SO2 and PM at a commercial manure-belt layer house. Environ. Pollut. 2020, 262, 114355. [Google Scholar] [CrossRef] [PubMed]
- Løes, A.; Khalil, R.; McKinnon, K. Exhaust Gas Concentrations and Elemental Losses from a Composting Drum Treating Horse ManureCompost. Sci. Util. 2020, 28, 36–48. [Google Scholar]
- Fukumoto, Y.; Suzuki, K.; Kuroda, K.; Waki, M.; Yasuda, T. Effects of struvite formation and nitratation promotion on nitrogenous emissions such as NH3, N2O and NO during swine manure composting. Bioresour. Technol. 2011, 102, 1468–1474. [Google Scholar] [CrossRef]
- Wang, Y.; Dong, H.; Zhu, Z.; Li, L.; Zhou, T.; Jiang, B.; Xin, H. CH4, NH3, N2O and NO emissions from stored biogas digester effluent of pig manure at different temperatures. Agric. Ecosyst. Environ. 2016, 217, 1–12. [Google Scholar] [CrossRef]
- Dai, C.; Huang, S.; Zhou, Y.; Xu, B.; Peng, H.; Qin, P.; Wu, G. Concentrations and emissions of particulate matter and ammonia from extensive livestock farm in South China. Environ. Sci. Pollut. Res. 2019, 26, 1871–1879. [Google Scholar] [CrossRef] [PubMed]
- Morgan, R.J.; Wood, D.J.; Van Heyst, B.J. The development of seasonal emission factors from a Canadian commercial laying hen facility. Atmos. Environ. 2014, 86, 1–8. [Google Scholar] [CrossRef]
- Yang, X.; Wang, X.; Zhang, Y.; Lee, J.; Su, J.; Gates, R.S. Characterization of trace elements and ions in PM10 and PM2.5 emitted from animal confinement buildings. Atmos. Environ. 2011, 45, 7096–7104. [Google Scholar] [CrossRef]
- Matsusada, J.; Maeda, T.; Ohmiya, K. Ammonia emissions from composting of livestock manure. In Proceedings of the 1st International Conference on Greenhouse Gases and Animal Agriculture, Obihiro, Japan, 7–11 November 2002; pp. 283–286. [Google Scholar]
- Bai, M.; Flesch, T.; Trouvé, R.; Coates, T.; Butterly, C.; Bhatta, B.; Hill, J.; Chen, D. Gas emissions during cattle manure composting and stockpiling. J. Environ. Qual. 2020, 49, 228–235. [Google Scholar] [CrossRef]


| Temperature (°C) | Relative Humidity (%) | |
|---|---|---|
| Average | 22.3 | 82 |
| Min. | 16.1 | 32 |
| Max. | 34.1 | 100 |
| St. Dev. | 3.6 | 15.9 |
| Daily Max. Average | 27.1 | 98.4 |
| St. Dev. | 2.9 | 2.9 |
| Daily Min. Average | 18.3 | 60.2 |
| St. Dev. | 1.3 | 13.7 |
| NH3 Int | NH3 Ext Hi | NH3 Ext Lo | NO Fac | NO2 Fac | SO2 Fac | PM2.5 Int | PM2.5 Ext | ||
|---|---|---|---|---|---|---|---|---|---|
| mg m−3 | μg m−3 | ||||||||
| Week Day | Mean | 63.951 | 3.850 | 3.155 | 34.007 | 9.000 | 371.004 | - | 23.570 |
| Std. Err. | 2.530 | 0.070 | 0.366 | 4.052 | 1.846 | 30.452 | - | 3.832 | |
| Week Night | Mean | 54.217 | 3.555 | 2.053 | 31.928 | 4.991 | 321.118 | - | 22.171 |
| Std. Err. | 2.074 | 0.084 | 0.092 | 5.421 | 1.052 | 23.671 | - | 3.277 | |
| W/end Day | Mean | 66.278 | 3.793 | 2.079 | 27.939 | 10.332 | 264.985 | - | 22.337 |
| Std. Err. | 8.157 | 0.179 | 0.092 | 6.616 | 1.363 | 45.646 | - | 3.529 | |
| W/end Night | Mean | 37.911 | 3.180 | 1.736 | 49.723 | 7.032 | 147.155 | - | 23.319 |
| Std. Err. | 2.558 | 0.112 | 0.056 | 13.629 | 1.328 | 15.669 | - | 2.644 | |
| Over all | Mean | 57.063 | 3.642 | 2.425 | 33.350 | 7.276 | 307.224 | 36.901 | 23.713 |
| Std. Err. | 1.316 | 0.056 | 0.159 | 3.153 | 0.846 | 17.426 | 2.599 | 1.959 | |
| NH3 Int | NH3 Ext Wi | NH3 Ext Gr | NO Fac | NO2 Fac | SO2 Fac | PM2.5 Int | PM2.5 Ext | ||
|---|---|---|---|---|---|---|---|---|---|
| Temp | 0.101 | 0.086 | 0.071 | −0.191 | 0.476 | 0.073 | 0.277 | 0.033 | |
| RH | −0.072 | −0.012 | −0.063 | 0.059 | −0.600 | −0.047 | −0.322 | 0.078 | |
| PM2.5 Paju | 0.191 | 0.154 | −0.139 | 0.072 | 0.096 | 0.053 | 0.341 | 0.666 | |
| NO2 Paju | 0.023 | −0.025 | 0.084 | 0.412 | |||||
| SO2 Paju | −0.204 | −0.017 | 0.404 | ||||||
| NH3 Int | |||||||||
| NH3 Ext wi | 0.831 | ||||||||
| NH3 Ext gr | 0.429 | 0.345 | * = 0.05 | ||||||
| NO Fac | 0.191 | 0.140 | 0.107 | ** = 0.01 | |||||
| NO2 Fac | −0.084 | −0.139 | −0.102 | 0.290 | *** = 0.001 | ||||
| SO2 Fac | 0.751 | 0.702 | 0.400 | −0.008 | −0.201 | ||||
| PM2.5 Int | 0.047 | 0.117 | 0.026 | 0.063 | 0.051 | 0.155 | |||
| PM2.5 Ext | 0.096 | 0.072 | −0.110 | −0.030 | 0.028 | −0.065 | 0.088 |
| Emission Rate | Scaled Emission Rates | |||
|---|---|---|---|---|
| mg min−1 m−3 | g h−1 m−2 Manure | g h−1 m−3 Manure | g kg−1 Manure * | |
| Mean | 7.28 | 2.77 | 1.85 | 1.52 |
| Std. Error | 0.41 | 0.16 | 0.1 | 0.09 |
Disclaimer/Publisher’s Note: The statements, opinions and data contained in all publications are solely those of the individual author(s) and contributor(s) and not of MDPI and/or the editor(s). MDPI and/or the editor(s) disclaim responsibility for any injury to people or property resulting from any ideas, methods, instructions or products referred to in the content. |
© 2024 by the authors. Licensee MDPI, Basel, Switzerland. This article is an open access article distributed under the terms and conditions of the Creative Commons Attribution (CC BY) license (https://creativecommons.org/licenses/by/4.0/).
Share and Cite
Lee, S.-R.; Kim, G. Assessing Ammonia (NH₃) Emissions, Precursor Gas (SO2, NOx) Concentrations, and Source Contributions to Atmospheric PM2.5 from a Commercial Manure Composting Facility. Appl. Sci. 2024, 14, 11467. https://doi.org/10.3390/app142311467
Lee S-R, Kim G. Assessing Ammonia (NH₃) Emissions, Precursor Gas (SO2, NOx) Concentrations, and Source Contributions to Atmospheric PM2.5 from a Commercial Manure Composting Facility. Applied Sciences. 2024; 14(23):11467. https://doi.org/10.3390/app142311467
Chicago/Turabian StyleLee, Sang-Ryong, and Gyuwon Kim. 2024. "Assessing Ammonia (NH₃) Emissions, Precursor Gas (SO2, NOx) Concentrations, and Source Contributions to Atmospheric PM2.5 from a Commercial Manure Composting Facility" Applied Sciences 14, no. 23: 11467. https://doi.org/10.3390/app142311467
APA StyleLee, S.-R., & Kim, G. (2024). Assessing Ammonia (NH₃) Emissions, Precursor Gas (SO2, NOx) Concentrations, and Source Contributions to Atmospheric PM2.5 from a Commercial Manure Composting Facility. Applied Sciences, 14(23), 11467. https://doi.org/10.3390/app142311467