Abstract
Compared with T- and Y-shaped confluence pipelines, arc confluence pipelines have a smaller energy loss coefficient. In the study presented herein, numerical simulation analyses of the flow fields of T-shaped, Y-shaped, bifurcated, and arc confluence pipelines were carried out. An experimental system was designed to study the energy loss coefficient of the arc confluence pipeline by using five different pipe diameters and nine different radii with water as the working fluid and analyze the influence of pipe diameter, radius, and Reynolds number on the energy loss of the arc confluence pipeline. As the radius of the arc confluence pipeline increases, the energy loss coefficient of confluence first decreases and then increases, and the minimum energy loss corresponds to a radius of 65 mm; with an increase in Reynolds number, the energy loss coefficient of confluence first decreases gradually and tends to a certain value. With an increase in diameter, the energy loss coefficient of confluence decreases gradually.
1. Introduction
Pipeline conveyance systems are indispensable in the process of industrial and agricultural fluid transportation. The accuracy and rationality of pipeline design play an important role in the performance of all equipment and the entire system. The three-way pipe is one of the main connection methods used in water transmission and distribution network systems, with it being widely used in the petroleum, chemical, hydraulic, and other pipeline transportation fields [1].
Common confluence pipeline shapes include T-shaped, Y-shaped, and bifurcated, as shown in Figure 1. Compared with straight pipes and elbow pipes, the velocity distribution of fluid particles in the junction of a confluence pipe is uneven, and there are mutual mixing, jacking, momentum, and energy changes in water flow in this type of pipe [2]. Studying the energy loss mechanism of a confluence pipe is useful in calculating the energy loss within it and providing a reference for the accurate design of such pipes. The energy loss caused by fluid flowing in these types of confluence pipelines is large, especially in the process of confluence, when the energy loss is extremely severe.
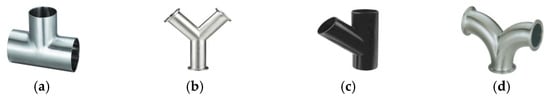
Figure 1.
Confluence pipelines with different structures. (a) T shape; (b) Y shape; (c) bifurcated; and (d) arc shape.
J.C. Stevens [3] conducted a theoretical analysis of the energy loss of a Y-shaped confluence pipe and obtained the empirical formula for calculating the energy loss of such a pipe, which was then modified to make it applicable to the calculation of energy loss of an elbow, sudden expansion pipe, and a sudden contraction pipe. Toshitake Ando [4] attempted to reduce the local energy loss by adding fillets inside a T-shaped confluence pipe or adding barriers before the confluence. Mohammed and Niranjan [5] carried out a numerical simulation of a 90° T-shaped confluence pipe using Fluent, and the simulation results showed slightly higher values than the experimental and theoretical results. Radka and David [6] conducted a numerical simulation study on the steady flow of non-viscous and viscous fluid in a T-shaped confluence pipe. By adjusting Fluent’s setting parameters, they obtained models and algorithms that were similar to the theoretical calculation results. Bate and Ludek Benes [7] also conducted a numerical simulation of the fluid in a pipe using the RNG model in Fluent 2020 R2 software, analyzed the mechanism of the energy loss by observing the internal pressure distribution cloud, and verified that the energy loss calculated by Fluent could predict the actual flow state of the fluid in the pipe. Paritosh [8] used Fluent to perform numerical simulations of T-shaped confluence pipes with different cross-sectional areas for main and branch pipes and different angles. The relative error between the numerical calculation results and the experimental results was small. Mao [9] and Luo [10] proposed a theoretical calculation formula for the local energy loss coefficient with consideration of the unique flow characteristics at the confluence of a 90° T-shaped bus pipe. Cao [11] and Sun [12] used Fluent to conduct numerical simulation research on the energy loss inside bush pipes with different structures, whose results show that, compared with T-shaped and Y-shaped manifold, the circular arc manifold has the smallest head loss. With the increase in inlet velocity, the amplitude of energy loss of circular and Y-shaped busses is more stable than that of T-shaped busses. Liu [13] analyzed and studied the energy loss mechanism inside Y-shaped manifold pipes with different structures and working conditions in the Xilongchi pumped storage power Station. Feng [14] used Fluent to numerically simulate the flow state of fluid particles inside a Y-shaped open channel intersection. Rong [15] used Fluent to simulate the flow characteristics of water inside a three-dimensional manifold. Based on the numerical simulation results of Fluent, the energy loss and fluid flow characteristics in the confluence area of a 35° bifurcation pipe were predicted. M. De la Cruz-Ávila [16] numerically evaluated different injection configurations for the analysis of two-phase flow behavior and evolution through a staggered Y-junction pipeline. Li [17] investigated the shape and hydrodynamic characteristics of the sand bed at the junction of urban pipelines and their relationship with the flow ratio. Wang [18] put forward suggestions for the optimization of hydraulic parameters for pipeline systems of hydropower stations with super-long headrace tunnels (HSSLHTs) based on the Mayfly algorithm and considering different operational scenarios. According to previous studies, the experimental study of curvature radius and pipe diameter on the energy loss coefficient is lacking. The influence of these parameters on energy loss can provide a scientific basis for optimizing the design of the bus pipe and improve the efficiency of the fluid conveying system.
Itaru Naramoto and Taijiro Kasai [19] conducted an experimental study on the energy loss of T-shaped and Y-shaped confluence pipes. They used main and branch pipes with different angles and diameters to conduct experimental research. They explained that the negative energy loss coefficient found was due to the ejection effect of the main pipe when the velocity of the branch pipe was small. When the fluid velocity in the straight pipe is high enough, the fluid in the main pipe will be ejected, and the resistance coefficient of the main pipe will be negative. F. E. Giesecke and W.H. Badgett [20] conducted an experimental study on a T-shaped confluence pipe made of cast iron. They conducted an experimental study on the different split ratios of a 90° T-shaped confluence pipe and fitted the curve of the experimental results; Marc and Jacob [21] summarized the experience and theory of their predecessors and carried out theoretical and experimental research on three-way pipes with different structures. Their theoretical calculations are in good agreement with the experimental measurement results. Costa [1] conducted experimental research on a T-shaped confluence pipe with a rounded inner wall. Their research results showed that the energy loss of the rounded T-shaped confluence pipe was reduced by 10–20%. Mao [22] conducted hydraulic model experiments and numerical calculations of water flow characteristics, such as flow regime and head loss under different operating conditions, on the T-shaped bifurcation pipe in the Wuxi Mashan Pumped Storage Power Station.
Jiang [23] conducted numerical simulation research on a 90° bend pipe with a large curvature radius using the RNG turbulence model and Fluent fluid dynamics simulation software. Duan et al. [24] performed a numerical simulation of a 90° T-shaped manifold by using the standard two-way equation model using Fluent software. Focusing on the influence of turbulent viscosity, the temperature stress distribution and velocity gradient of the three-dimensional turbulent flow inside the pipeline were analyzed, and the flow field distribution inside the pipe was determined. Han [25] studied the numerical model of tee pipes with different cross-sectional area ratios for the main and branch pipes by applying the standard two-path turbulent flow model through Fluent and determined the flow field distribution inside the pipes. Zhao [26] used Fluent numerical simulation software to simulate the fluid flow of a T-shaped confluence pipe. The flow field characteristics of different structures such as a straight pipe, elbow pipe, and sudden expansion pipe were analyzed in the case of laminar flow and turbulent flow, and their energy loss variation law was obtained. Wang [27] developed a physically guided neural network model to predict the temperature and pressure drop of oil pipelines. Mei [28] utilized a backpropagation neural network (BP) combined with a variant slime mould algorithm (SMA) to solve the pipeline structure design optimization problem.
When designing the energy loss system of pipe confluence, it is necessary to calculate the energy loss of the overall pipeline, including the energy loss along the pipeline and the local energy loss. At present, there is insufficient research on arc confluence pipelines. Therefore, in order to study the characteristics of the internal energy loss of an arc confluence pipeline, a measurement system for its energy loss was established.
The core objective of this study is to deeply explore the factors affecting the energy loss of the manifold through experimental research, and to find possible ways to reduce the energy loss, so as to provide a practical reference for the optimization of the inlet pipe of a fire truck pump. To achieve this, we employ an integrated methodology that combines precise experimental research with advanced computational fluid dynamics (CFD) simulations. In the experimental part, we designed a series of controlled experiments to measure the pressure drop and flow velocity distribution at different pipe diameters, curvature radii, and fluid velocities. These experiments were carried out in transparent tubes for visual observation of fluid behavior and data acquisition using high-precision pressure sensors and flow meters. In CFD simulation, we employed 3D models with a focus on the selection and application of turbulence models. We chose the k-ε turbulence model suitable for our study. The simulation results are compared with the experimental data to ensure the reliability of the model. Through the combination of experiments and simulations, it is hoped that innovative pipeline design recommendations can be made to achieve more efficient energy use and lower operating costs.
2. Numerical Simulation of the Flow Field of a Confluence Pipeline
The energy loss of confluence of a T-shaped confluence pipe, a Y-shaped confluence pipe, a bifurcated pipe, and an arc-shaped confluence pipe is numerically simulated.
2.1. Turbulent Flow Modeling of Bus-Tube
According to the knowledge of fluid mechanics, the fluid in the tube needs to satisfy the law of conservation of mass, that is, satisfy the continuity equation in mathematical form. According to the definition of conservation of mass, the net mass flowing into a tiny cell in unit time is equal to the amount of mass added in the tiny cell in unit time. It can be concluded that the general continuity equation in the circular tube is as follows:
If the fluid medium in the pipeline is an incompressible fluid, ρ, it is equal to the constant, so the incompressible fluid equation can be written as Equation (2):
where ρ is the density, t is the time, and u is the velocity vector of the fluid particle.
The turbulent flow in the bus pipe is one of many fluid flow states, and since the medium of the bus pipe is water, it also needs to satisfy the incompressible viscous fluid equation. Therefore, the basic equation of incompressible viscous turbulent flow in a single medium is Equations (3)–(5):
where P is the pressure on the fluid element body, μ is the dynamic viscosity, and X, Y, Z is the generalized source term of the momentum conservation equation, which is shown in Equations (6)–(8):
This is the momentum conservation equation for viscous incompressible fluids, also known as the Navier–Stokes (N-S) equation. The component form of the N-S equation in cartesian coordinates is shown in Equation (9):
where i, j equals, X, Y, Z and f is mass force.
The basic equations of viscous fluid turbulence are continuity equation and motion equation, namely the N-S equation. Assuming that the turbulence is traversed by each state, the instantaneous value is substituted for the statistical average, and Equation (9) is substituted by Equation (10).
where is the time-average component of the velocity and u’ is the pulsating component of the velocity; taking the time average of the continuous equation, the continuous Equation (11) of the time-average flow is obtained:
Equation (12) is subtracted from Equation (2) to obtain the continuous equation of pulsating flow.
Due to the energy loss of turbulent fluid in the manifolds studied in this paper, eddy flow and streamline bending are serious, so the RNG two-equation model of the following branch of the eddy viscosity model suitable for solving such problems should be selected. The RNG model equation is shown in Equations (13) and (14):
2.2. Simulation Setup and Result Analysis
The inlet–outlet configurations of confluence pipelines with different shapes are shown in Figure 2. For the T-shaped pipeline, the left and right sides are water inlets, the vertical direction is a water outlet, and the cross-sectional areas of the inlet and outlet are equal. For the Y-shaped confluence pipeline, the left and right sides are water inlets, the vertical direction is a water outlet, the cross-sectional areas of the inlet and outlet are equal, and the angle between the two water inlets is 45°.
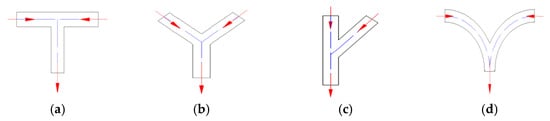
Figure 2.
Schematic diagram of the structure of confluence pipelines with different shapes. (a) T shape; (b) Y shape; (c) bifurcated; and (d) arc shape.
The vertical upper end and the right branch pipe of the bifurcated confluence pipeline are the water inlets, and the vertical lower end is the water outlet, as shown by the arrows. The left and right sides of the arc confluence pipeline are water inlets, and the vertical direction is a water outlet; the inlet and outlet cross-sectional areas are equal. In the arc bending stage, the angle is 90°. For the manifold tubes of different structures studied in this paper, the same boundary conditions are adopted, that is, the boundary conditions of velocity inlet are adopted at inlet 1 and inlet 2, the boundary conditions of pressure outlet are adopted, as shown as red arrows, and the wall surface is non-slip wall, as shown as blue dotted lines.
The RNG turbulence model was selected. By correcting the turbulent dynamic viscosity coefficient and adding the term of turbulent energy dissipation rate, the accuracy of the turbulent energy dissipation rate equation has been effectively improved. The SIMPLE algorithm, due to its ability to handle pressure–velocity coupling, iterative solutions, and suitability for complex flow problems, makes it an appropriate choice for solving turbulent flow models in a confluence pipe.
The relevant parameters of the numerical simulation were set according to the environmental conditions in the actual measurement process. Under the local atmospheric pressure (about 101.3 KPa), the liquid used in the experiment was water, the temperature was roughly 23 °C, and the density was roughly 997.54 kg/m3. In addition, the gravity acceleration was roughly 9.8035 m/s2. The inner surface roughness of the arc confluence pipeline made of polymethyl methacrylate referenced in this paper was measured using a roughness measurement instrument, and the measurement result is 0.149 μm.
The unstructured grid was generated using the grid generation software ICEM 2022 R2. Compared with the division of structured grids, the structure of unstructured grids is complex and the number of grids generated is larger. The results can be more similar to the real flow state of the fluid. The results of unstructured grid division of different structure bus tubes are shown in Figure 3. Based on the conclusions of the study, grid independence in the RNG turbulence model is verified.
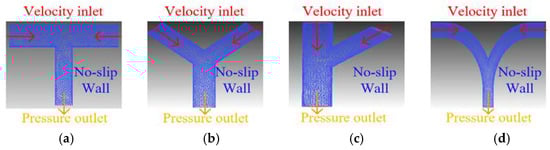
Figure 3.
Confluence pipelines with different structures. (a) T shape; (b) Y shape; (c) bifurcated; and (d) arc shape.
To determine the flow in the confluence pipeline, the energy loss coefficient of different structures is calculated according to the pressure difference between the inlet and outlet according to Bernoulli’s equation [29], as shown in Equation (15):
where p1, z1, and v1 are the average pressure, average position head, and average velocity of the section at the inlet of the confluence pipeline; p2, z2, and v2 refer to the average pressure, average position head, and average velocity of the section at the outlet of the confluence pipeline; α is the correction coefficient ( generally, α = 1 is selected); and hw is the head loss between the inlet and outlet sections.
Since the inlet and outlet of the confluence pipeline examined in this study are at the same height, z1 = z2, Equation (16) holds:
The energy loss coefficient can be calculated based on Equation (17):
where ξ is the calculated energy loss coefficient of the confluence pipeline with different structures.
As shown in Figure 4, the velocity distribution of fluid particles at the junction of the T-shaped confluence pipeline is irregular, and the velocity and direction of fluid particles are disordered. A local vortex is formed at the horizontal junction of the T-shaped confluence pipeline, and the flow velocity increases rapidly after confluence. Since the two fluid particles collide with each other in the opposite direction of velocity after confluence, the velocity distribution of fluid particles is disordered after confluence, and they extend toward the wall of the confluence pipe.
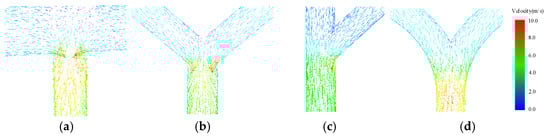
Figure 4.
Vector graph of the velocity distribution of fluid particles. (a) T shape; (b) Y shape; (c) bifurcated; and (d) arc shape.
Therefore, the energy loss of the T-shaped confluence pipeline is severe. The velocity distribution of fluid particles at the junction of the Y-shaped confluence pipeline is more regular than that of the T-shaped confluence pipeline; however, the velocity distribution at the corner of the Y-shaped confluence pipeline is still disordered. In addition, the velocity direction and size of fluid particles in this area are disordered. At the corner of a Y-shaped confluence pipeline in particular, the velocity distribution between fluid particles is complex, resulting in mutual collision and friction between fluid particles, leading to partial energy loss. The particle velocity distribution of the fluid in the convergence area of the bifurcated confluence pipeline is relatively regular compared with that of the Y-shaped confluence pipeline.
When the fluid in the branch pipe of the bifurcated confluence pipeline flows into the main pipeline area, the fluid in the branch pipe collides with the fluid in the main pipeline; therefore, the velocity distribution between particle points is relatively disordered, resulting in partial energy loss. However, since the particle velocity distribution of the fluid at the intersection of the bifurcated confluence pipeline is relatively uniform, the energy loss of this pipeline is smaller.
Compared with the T-shaped confluence pipeline, Y-shaped confluence pipeline, and bifurcated confluence pipeline, the velocity distribution of fluid particles in the arc confluence pipeline at the intersection is relatively regular. The fluid particle velocity of the arc confluence pipeline changes relatively gently due to the elbow transition at the intersection.
It can be seen from the velocity vector diagram of fluid particles that the fluid particles in the arc confluence pipeline do not undergo the same severe particle collision and mixing as those in the T-shaped, Y-shaped, and bifurcated confluence pipelines; however, there are also changes in the velocity of fluid particles at the confluence due to the mutual collision of fluid particles, and the fluid moves toward the outer wall of the pipeline at the confluence.
We conducted CFD simulation analysis on different pipelines under Reynolds numbers of 4000, 4800, 6400, 7520, 9600, 11,200, 12,800, 14,400, 16,000, 20,800, 25,600, 30,400, 35,200, 40,000, 44,800, 48,000, and 56,000. Figure 5 shows the energy loss coefficient of the confluence pipelines with different structures. The energy loss coefficient of the confluence pipeline with different structures gradually decreases with the increase in Reynolds number and ultimately tends to be stable. Under the same conditions, the energy loss coefficient of the arc confluence pipeline is the smallest, followed by the energy loss coefficient of the bifurcated confluence pipeline and the Y-shaped confluence pipeline, and the energy loss coefficient of the T-shaped confluence pipeline is the largest. In light of the above results, the following section will focus on the experiments performed on the arc confluence pipeline.
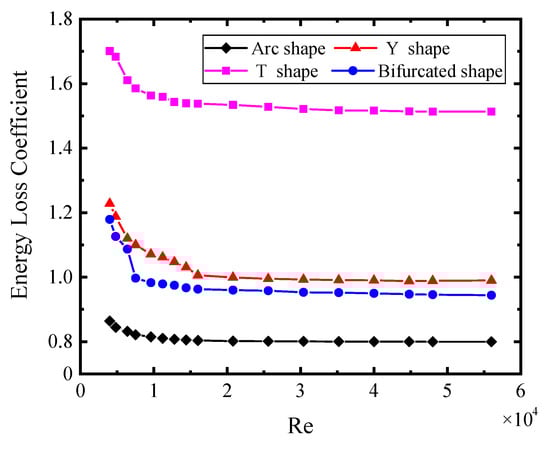
Figure 5.
Comparison of the energy loss coefficient of confluence pipelines with different structures.
3. Experimental System for the Energy Loss of the Arc Confluence Pipeline
The experimental system required to determine the energy loss of the arc confluence pipeline was built with reference to the experimental device designed by Zachary and Costa, which was originally designed to measure the energy loss of a T-shaped confluence pipeline. The experiment was carried out at room temperature (20 °C) with water as the fluid medium. The experimental system primarily includes three parts: the flow measurement system of the arc confluence pipeline, the pressure measurement system of the arc confluence pipeline, and the arc confluence pipeline specimen. In this energy loss experiment on an arc confluence pipeline, such pipelines with different curvature radii and different materials were tested under different flow rates with water as the medium, and the energy loss of the arc confluence pipelines was measured using the local energy loss measurement system of this type of pipeline.
The system is supplied with water by a submersible pump, and ball valve 2 is responsible for pressure limiting and diversion, as shown in Figure 6. The outlet of the water pump is divided into two paths, and each branch changes the flow of the two water inlets of the arc confluence pipeline by adjusting ball valves 10 (11) and 12 (13). Double valves in parallel are used to adjust the flow. When the flow is larger, the ball valve with a larger inner diameter is used to roughly adjust the flow, and when the flow is smaller, the ball valve with a smaller inner diameter is used to fine-tune the flow. The pressure of the two branch pipe inlets of the arc confluence pipeline is measured through intelligent pressure transmitters 4 and 8, and the flow of the two branch pipe inlets of the arc confluence pipeline is measured through intelligent electromagnetic flowmeters 3 and 9.
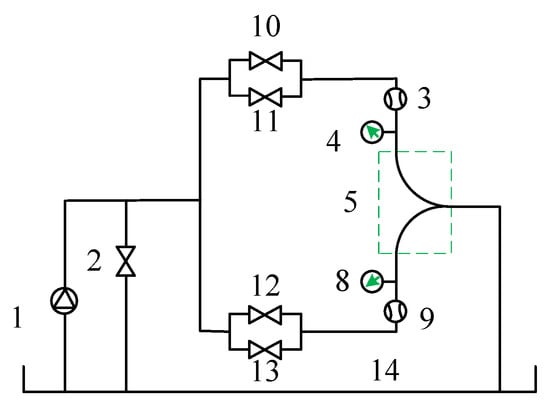
Figure 6.
Schematic diagram of the experimental system. 1. Submersible pump; 2. bypass ball valve; 3 and 9. intelligent electromagnetic flowmeter; 4 and 8. intelligent pressure transmitter; 5. arc manifold; 10 and 13. branch ball valve; 11 and 12. fine adjustment ball valve; and 14. water tank.
For the energy loss experiment on the arc confluence pipeline, after determining the pipe diameter, curvature radius, material, and fluid medium of the pipeline, the fluid velocity in the pipe is proportional to Reynolds number Re. The fluid is in different flow states at different Reynolds numbers, resulting in different energy loss coefficients. The energy loss of the arc confluence pipeline not only includes local energy loss but also includes energy loss along the path according to the energy loss mechanism of the arc elbow due to its geometric structure characteristics. The authors assume that, with a fixed pipe diameter, when the radius of curvature is reduced to the same as the radius of the pipe section, it is close to the T-shape piped and its loss is local energy loss; when the radius of curvature increases infinitely, it is close to the straight pipe, and its energy loss is energy loss along the path; lastly, when the curvature radius is between the two, the energy loss is the sum of the energy loss along the path and the local energy loss.
The influence of curvature radius on the energy loss of the arc confluence pipeline was studied theoretically and experimentally by using polymethyl methacrylate. The curvature radius ranges from 30 mm to 400 mm, covering a variety of situations from sharp to gentle bends, which is conducive to studying the impact of curvature radius on energy loss. The pipe diameters were 12 mm, 15 mm, and 20 mm and the radius of curvature was 30 mm, 65 mm, 100 mm, 150 mm, 200 mm, 250 mm, 300 mm, 350 mm, and 400 mm. The energy loss of the arc confluence pipeline with different curvature radii at the same Reynolds number was measured experimentally to determine the variation rule of the energy loss of the arc confluence pipeline changing with curvature radius.
The choice of pipe diameters of 12 mm, 15 mm, and 20 mm is to cover pipes from smaller to medium sizes, which are relatively common in practical engineering applications and can represent a certain range of engineering issues. By measuring the energy loss of the arc confluence pipeline with the same radius of curvature of 100 mm and 200 mm and pipe diameters of 8 mm, 12 mm, 15 mm, 20 mm, and 25 mm, the effect of pipe diameter on the energy loss of the arc confluence pipeline was analyzed using the experimental measurement results.
3.1. The Effect of Curvature Radius on the Energy Loss of the Arc Confluence Pipe
Figure 7 shows that, with the gradual increase in the curvature radius of the arc confluence pipeline, the value of its energy loss coefficient first decreases and then tends to be stable, and its change law is similar to that of energy loss along the path. For arc confluence pipelines with different curvature radii at the same Reynolds number, the energy loss coefficient decreases first and then increases gradually with an increase in curvature radius. When the curvature radius is 65 mm, the energy loss coefficient is at its minimum value. In the range of 4000 < Re < 56,000, the value of the energy loss coefficient increases with an increase in the curvature radius of the arc confluence pipeline. When the radius of curvature is constant, the energy loss coefficient decreases with an increase in Re, and when Re > 20,000, the energy loss coefficient ultimately remains unchanged.
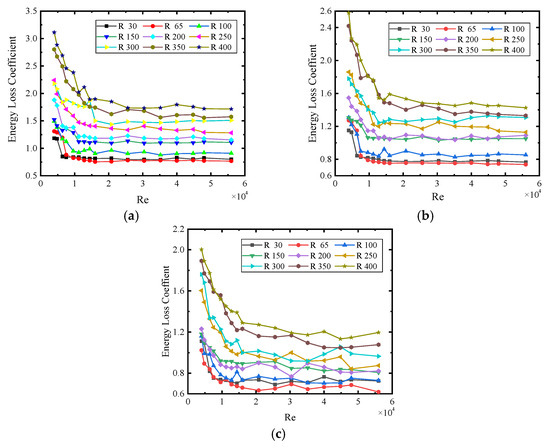
Figure 7.
Measurement of the energy loss coefficient of arc confluence pipelines with different radii. (a) Radius of 12 mm; (b) radius of 16 mm; and (c) radius of 20 mm.
When Re > 15,000, the energy loss coefficient of the circular manifold with a radius of curvature R = 65 mm is the minimum for an arc confluence pipeline with different pipe diameters. Therefore, it can be judged that the radius of curvature corresponding to the minimum energy loss should be R = 65 mm and should meet the requirements of 30 mm < R < 100 mm. These findings are due to the fact that local energy loss dominates when the radius of curvature is small in the arc confluence pipeline with the same pipe diameter. However, with the increase in the radius of curvature of the circular manifold, its energy loss along the path is dominant; therefore, there will be a radius of curvature corresponding to the lowest energy loss.
3.2. Influence of Pipe Diameter on the Energy Loss of the Arc Confluence Pipeline
Figure 8 shows the energy loss coefficient of arc confluence pipelines with different pipe radii, which indicates that the energy loss coefficient of an arc confluence pipeline with different diameters of 100 mm and 200 mm curvature radius decreases with a gradual increase in pipe diameter. Therefore, for an arc confluence pipeline with the same curvature radius, when the Reynolds number is one, in order to reduce the energy loss during confluence, the pipe diameter can be appropriately increased.
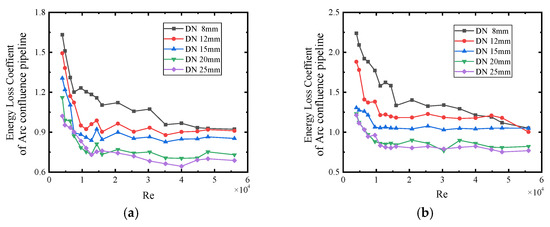
Figure 8.
Energy loss coefficient of arc confluence pipelines with different pipe radii: (a) R100 mm and (b) R200 mm.
3.3. Effect of Curvature Radius and Pipe Diameter Ratio (R/D) on the Energy Loss of the Arc Confluence Pipeline
As shown in Figure 9, when R > 100 mm, the energy loss coefficient of arc confluence pipelines with the same pipe diameter increases with an increase in R. When the radius of curvature is constant, the energy loss coefficient of the arc confluence pipeline decreases with an increase in pipe diameter D. If R/D increases but D does not change, then the energy loss coefficient of the arc confluence pipeline increases with an increase in R. If R remains constant, then the energy loss coefficient of the arc confluence pipeline decreases with a reduction in D. If R and D are increased simultaneously, the trend in the energy loss coefficient cannot be judged. In summary, there is currently no established rule on the influence of R/D on the energy loss of polymethyl methacrylate arc confluence pipelines.
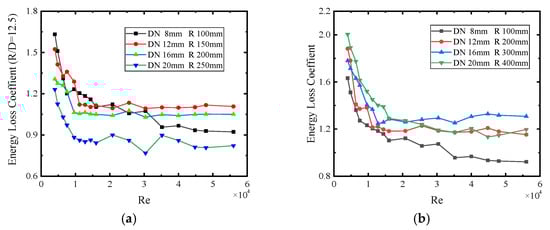
Figure 9.
Effect of (R/D) on the energy loss coefficient of the arc confluence pipeline: (a) energy loss coefficient at R/D = 12.5 and (b) energy loss coefficient at different R/D.
3.4. Error Analysis of Experimental Results and Theoretical Calculations
An error comparison was made between the simulation results of the energy loss of the DN8 mm circular arc bus and the experimental measurement results, as shown in Figure 10. The maximum relative error is 24.43% and the minimum relative error is −0.63% from the theoretical calculation and experimental results of the energy loss coefficient of the circular arc bus tube with different curvature radii of tube diameter.
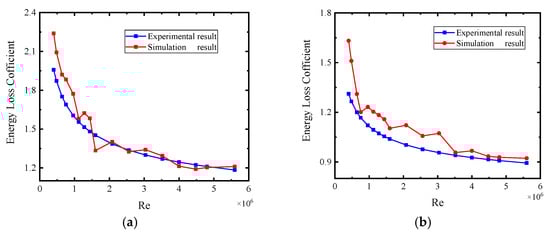
Figure 10.
Comparison of experimental and simulation results of DN8 acrylic confluence pipeline: (a) R100 mm and (b) R200 mm.
The calculated energy loss coefficient of circular arc manifolds with different curvature radii at different Reynolds numbers are compared with the experimental results, and the overall error is small. When Re > 10,000, the error of theoretical calculation is about 10% compared with experimental measurement. Therefore, the formula for calculating the energy loss coefficient of the circular arc manifold in this paper can provide a reference for practical engineering application at a certain precision.
4. Application
As shown in Figure 11, the PSP1500 car-mounted fire pump produced by AMPRO is equipped with a standard T-shaped manifold with a diameter of 150 mm. The water pump inlet pipeline is designed with a water inlet at two sides. However, during the performance testing of the vehicle water pump, whether it is a single-sided water inlet or a simultaneous water inlet on both sides, it cannot meet the design requirements of the water pump very well. According to analysis, this is caused by the influence of local resistance on the direction of water inflow. Therefore, the structure of the inlet pipe was changed by using two 90° curved pipes to connect and form a curved confluence pipe, as shown in Figure 11. Then, when tested again, it could easily meet the design requirements for pump performance flow rate and pressure. The impact of the structure with water inflow on both sides on the performance of the fire truck pump cannot be ignored.
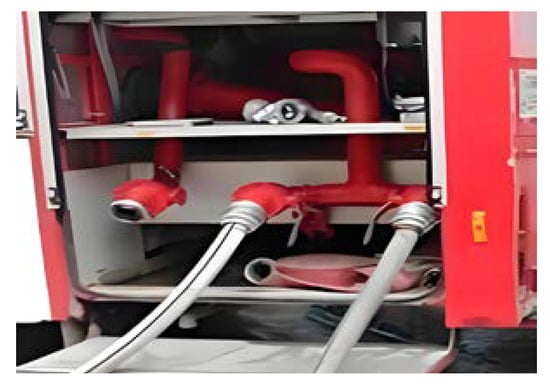
Figure 11.
Fire truck water supply pump merging system.
The application of fire pumps is special. When using fire pumps, due to emergency situations that require additional water intake, the inlet pipeline often adopts a situation where two branches merge to all the water to enter, as shown in the figure. For the situation where two branches of a fire truck merge into the water inlet, reducing the energy loss of the inlet channel can increase the flow rate of the inlet pipe while ensuring that cavitation does not occur, thereby obtaining sufficient fire water flow; secondly, a higher suction height can be achieved at a certain water flow rate without cavitation.
For a fixed power water pump, the energy loss in the inlet pipeline will equally cause a decrease in pressure in the outlet pipeline or a decrease in the outlet lifting height. The relationship between the head, suction, and energy loss of a pump is shown in the following Equations (18) and (19).
In the formula, P1 is the outlet pressure of the pump, Pa; Hp is the head of the pump, m; H0 is the suction stroke of the pump, m; v is the outlet flow velocity of the pump, m/s; and Hs is the energy loss of the inlet pipeline, m.
According to the above relationship, it can be seen that the energy loss of the inlet pipeline of a constant power pump will affect the head height of the pump, and the energy loss saved by the circular arc manifold will increase the lifting height of the pump. In addition, fire trucks often require outdoor water intake, such as shallow river water, lake water, etc. Therefore, if the energy loss of the pump inlet pipeline is effectively reduced, sufficient fire water flow and a greater suction height can be obtained.
Due to the relationship between the diameter and flow rate of common fire truck inlet pipelines, the flow rate of the DN100 mm inlet pipeline is 15 L/s (54 m3/h) and the flow rate of the DN150 mm inlet pipeline is 35 L/s (126 m3/h). Based on the relationship between flow rate and pipe diameter, the average flow velocity of the pipeline cross-section can be calculated as m/s and m/s. The minimum cross-sectional area flow velocity m/s is taken for energy loss calculation.
The calculation results show that compared to T-shaped, Y-shaped, and bifurcated confluence pipes, the application of circular arc confluence pipes in the combined inlet pipeline of fire truck water supply pumps can increase the suction height by about 1.3 m, 0.6 m, and 0.33 m. This is of great significance for improving the on-site performance of fire trucks and enhancing firefighting efficiency.
5. Conclusions
In the present study, the energy loss in confluence pipelines was studied, with a particular focus on this type of pipeline throughout the study. Through numerical simulation, we used the RNG turbulence model and SIMPLE algorithm to solve the energy loss of the pipeline. The energy loss of polymethyl methacrylate arc confluence pipelines with different pipe diameters, curvature radii, and Reynolds numbers were analyzed in the experimental research, and the main conclusions are as follows:
- (1)
- For arc confluence pipes with diameters of 12 mm, 16 mm, and 20 mm, as the curvature radius of the arc confluence pipe increases, its energy loss coefficient first decreases and then increases, with the curvature radius corresponding to the minimum energy loss being approximately 65 mm. This phenomenon may be related to the flow separation and reattachment when the fluid flows through the confluence pipe, especially under smaller curvature radii, where flow separation is more severe, leading to increased local energy loss. As the curvature radius increases, the flow becomes smoother, reducing energy loss. However, when the curvature radius is too large, the along-pipe losses begin to dominate, leading to an increase in total energy loss.
- (2)
- For arc confluence pipes with the same curvature radius and diameters of 8 mm, 12 mm, 16 mm, 20 mm, and 25 mm, the energy loss coefficient gradually decreases as the pipe diameter increases. This may be because a larger diameter helps to reduce the local velocity of the flow, thereby reducing the energy loss caused by turbulence and flow separation.
- (3)
- For an arc confluence pipeline with different pipe diameters and curvature radii, there is no established rule to follow between the ratio of curvature radius to pipe diameter R/D and confluence energy loss. This indicates that a single geometric parameter is not sufficient to predict energy loss, and it may be necessary to consider more flow characteristics and boundary conditions.
We conducted quantitative calculations on the energy loss and suction height of the PSP1500 vehicle-mounted fire pump produced by AMPRO. They indicated that the application of circular arc confluence pipes in the combined inlet pipeline of fire truck water supply pumps can increase the suction height, which is of great significance for improving the on-site performance of fire trucks and enhancing firefighting efficiency. Our future work will focus on sensitivity analysis of other independent variables like fluid properties and temperature and developing and validating more accurate numerical models to predict energy loss.
Author Contributions
Conceptualization, S.Z.; methodology, S.Z.; software, C.P.; validation, C.P.; formal analysis, C.P.; resources, S.Z.; data curation, C.P.; writing—original draft preparation, C.P.; writing—review and editing, S.Z. and J.L.; visualization, C.P.; supervision, Z.L. and Q.H.; project administration, Z.L.; funding acquisition, S.Z. All authors have read and agreed to the published version of the manuscript.
Funding
This research was funded by the National Science and Technology Major Project, grant number: J2019-I-0008-0008.
Institutional Review Board Statement
Not applicable.
Informed Consent Statement
No applicable.
Data Availability Statement
The original contributions presented in this study are included in the article. Further inquiries can be directed to the corresponding author.
Conflicts of Interest
The authors declare no conflicts of interest.
References
- Costa, N.P.; Maia, R.; Proença, M.F.; Pinho, F.T. Edge effect on the flow characteristics in a 90 deg tee junction. J. Fluid Eng. 2006, 128, 1204–1218. [Google Scholar] [CrossRef]
- Ito, H.; Oka, K. T-junction Piping System. Annu. J. Eng. 2005, 3, 21–27. [Google Scholar]
- Stevens, J.C. Theoretical energy loss in intersecting pipes. Engin. News Rec. 1926, 97, 140–141. [Google Scholar]
- Ando, T.; Satoru Takamura, S. Effect on flow rate on the loss reduction of T-junction pipe. Jpn. Soc. Mech. Eng. 2014, 9, 26–38. [Google Scholar] [CrossRef]
- Abdulwahhab, M.; Injeti, N.K.; Dakhil, S.F. Numerical prediction of pressure loss of fluid in a T-junction. Int. J. Energy Environ. 2013, 4, 253–264. [Google Scholar]
- Keslerová, R.; Trdlička, D. Numerical Simulation of 3D Flow of Viscous and Viscoelastic Fluids in T-Junction Channel. In Numerical Mathematics and Advanced Applications ENUMATH 2015 (Lecture Notes in Computational Science and Engineering); Springer: Cham, Switzerland, 2016; pp. 491–499. [Google Scholar]
- Beneš, L.; Louda, P.; Kozel, K.; Keslerová, R.; Štigler, J. Numerical simulation of flow through channels with T-junction. Appl. Math. Comput. 2013, 219, 7225–7235. [Google Scholar] [CrossRef]
- Paritosh, R.V. Fluid Flow in T-Junction of Pipes. Master’s Thesis, Lappeenranta University of Technology, Lappeenranta, Finland, 2007. [Google Scholar]
- Mao, Z.Y.; Zhao, K. Experimental Study on Local Resistance at Pipeline. Conflu. J. Water Resour. 2007, 7, 812–818. [Google Scholar]
- Mao, Z.Y.; Luo, S. Local energy loss at the confluence of rectangular cross-section pressure pipelines. Prog. Water Resour. Hydropower Technol. 2006, 26, 62–67. [Google Scholar]
- Cao, H.B.; Gao, L.L. Numerical simulation of fluid flow characteristics in three-way pipes with different structures. Guangdong Chem. Ind. 2016, 43, 72–73. [Google Scholar]
- Sun, Q.G.; Chen, C.Z. Distribution characteristics of oil air lubricated annular flow in circular arc three-way pipes. Mech. Res. Appl. 2015, 28, 74–79. [Google Scholar]
- Liu, P.Q.; Qu, Q.L. Numerical simulation of hydraulic characteristics of internally reinforced crescent rib three-way pipe. J. Water Resour. 2004, 3, 42–47. [Google Scholar]
- Feng, Y.H.; Li, S.Y. Numerical analysis of water surface morphology characteristics at Y-shaped intersections. People's Yangtze River 2008, 39, 63–67. [Google Scholar]
- Rong, G.W.; Wei, W.L. Numerical simulation of three-dimensional turbulent hydraulic characteristics of bifurcation pipelines. J. Hydrol. 2010, 41, 398–406. [Google Scholar]
- De la Cruz-Ávila, M.; Carvajal-Mariscal, I.; Sigalotti, L.D.G.; Klapp, J. Numerical study of water-oil two-phase flow evolution in a y-junction horizontal pipeline. Water 2022, 14, 3451. [Google Scholar] [CrossRef]
- Li, Z.; Chen, S.; Sun, B.; Wang, F.; Zhang, L.; Wang, B. The characteristics of water and sediment movement in the confluence area of pipeline. Urban Water J. 2024, 21, 927–940. [Google Scholar] [CrossRef]
- Wang, L.; Guo, W. Optimization of hydraulic parameters for pipeline system of hydropower station with super long headrace tunnel based on mayfly algorithm considering operational scenarios. Energy Sci. Eng. 2024, 12, 2341–2364. [Google Scholar] [CrossRef]
- Naramoto, I.; Kasai, T. On the loss of energy at impact of two confined streams of water. Kyushu Imp. Univ. College of Engin. Mem. 1931, 189–261. [Google Scholar]
- Giesecke, F.E.; Bangett, W.H. Supplementary friction heads in one-inch cast-iron tees. ASHVE Trans. 1995, 111–120. [Google Scholar]
- Serre, M.; Odgaard, A.J.; Elder, R.A. Energy loss at combining pipe junction. J. Hydraul. Eng. 1994, 120, 808–830. [Google Scholar] [CrossRef]
- Mao, G.H.; Zhang, J.J. Research on the Hydraulic Model Test and Three dimensional Numerical Calculation of B-type Fork Pipe. J. Hydroelectr. Power 2005, 24, 16–22. [Google Scholar]
- Jiang, S. Analysis of the internal flow field of a 90’’ circular bend based on Fluent. China Shipbuild. Res. 2008, 1, 34–45. [Google Scholar]
- Duan, Y.H. Three dimensional numerical simulation of tees based on FLUENT. Inn. Mong. Petrochem. 2008, 5, 51–54. [Google Scholar]
- Han, F.J.; Sun, X. Numerical simulation and structural optimization of internal flow field of T-shaped three-way pipe. Xinjiang Water Resour. 2010, 4, 1–3. [Google Scholar]
- Zhao, Y. Numerical Simulation of Local Resistance of Pipeline Based on CFD; Northeast Petroleum University: Daqing, China, 2011. [Google Scholar]
- Wang, L.; Zhou, Q.; Gao, Y. Prediction of oil pipeline process operating parameters based on mechanism and data mining. ASME J. Energy Resour. Technol. 2024, 146, 113001-1–113001-8. [Google Scholar]
- Mei, J.; Cui, J.; Wu, L.; Xu, S.; Guo, Q.; Xiao, W.; Ye, S.; Zhang, H. Design optimization method of pipeline parameter based on improved artificial neural network. Knowl. Based Syst. 2024, 304, 112409. [Google Scholar] [CrossRef]
- Westerhof, N.; Stergiopulos, N.; Noble, M.I.M.; Westerhof, B.E. Bernoulli’s Equation. Snapshots of Hemodynamics; Springer: Cham, Switzerland, 2018; pp. 1–5. [Google Scholar]
Disclaimer/Publisher’s Note: The statements, opinions and data contained in all publications are solely those of the individual author(s) and contributor(s) and not of MDPI and/or the editor(s). MDPI and/or the editor(s) disclaim responsibility for any injury to people or property resulting from any ideas, methods, instructions or products referred to in the content. |
© 2024 by the authors. Licensee MDPI, Basel, Switzerland. This article is an open access article distributed under the terms and conditions of the Creative Commons Attribution (CC BY) license (https://creativecommons.org/licenses/by/4.0/).