
A Data-Driven Comparative Analysis of Machine-Learning Models for Familial Hypercholesterolemia Detection


Abstract
Featured Application
Abstract
1. Introduction
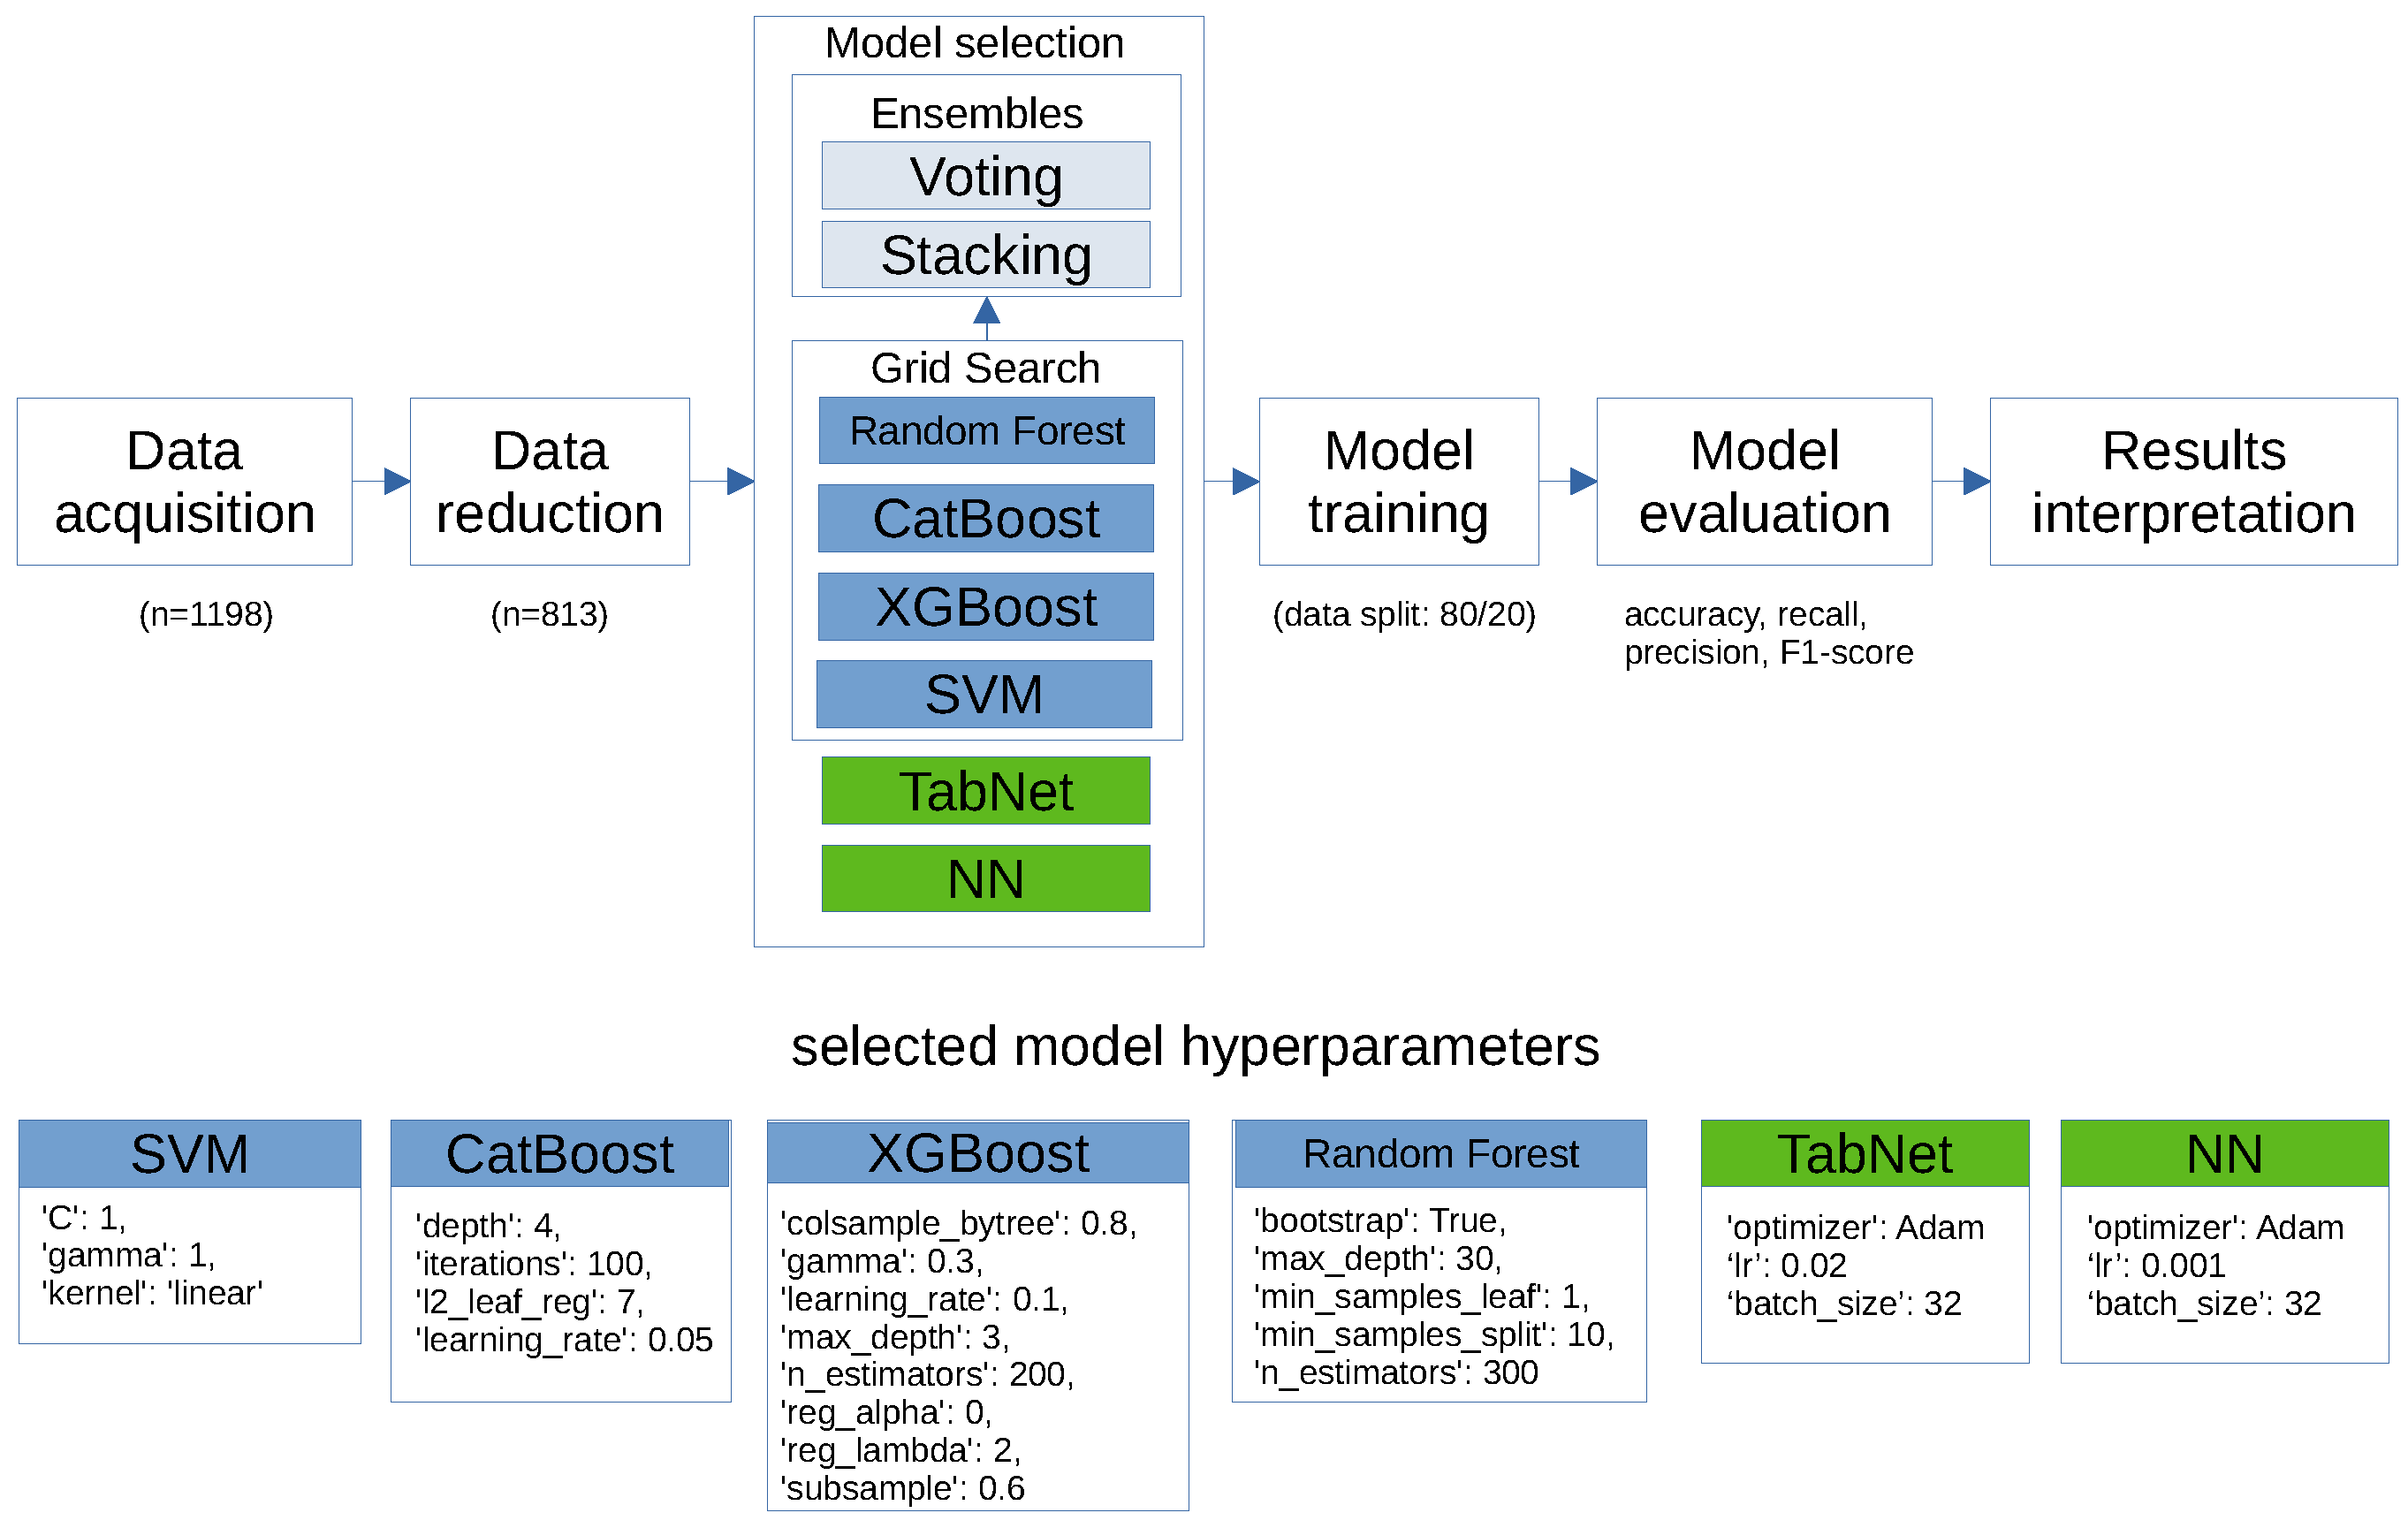
2. Methods
2.1. Data Cleaning
- Categorical data encoding: Categorical variables were converted to boolean data using one-hot encoding to ensure compatibility with the machine-learning algorithm.
- Handling missing data: Rows containing empty fields were removed from the dataset to maintain the integrity and consistency of the input data.
- Feature selection: Columns containing information on DLCN score and DNA results were excluded from the dataset to avoid potential data leakage or bias in model training.
- Data splitting: The dataset was partitioned into training and testing sets, with an 80/20 split. Stratified sampling was performed to balance the representation of patients regarding the DLCN score. This technique splits the data in such a way that each subset has approximately the same proportion of different categories as the original dataset. I followed the recommended protocol for classifying patients based on their likelihood of having FH. This standard approach involves dividing patients into four categories according to the probability of the disease: unlikely (<3 points), possible (3–5 points), probable (6–8 points), and definite (>8 points) [23,24].
2.2. Classification Algorithm
- Sampling predictors
- Sampling observations
- The learning rate
- The maximum depth of a tree
- The number of trees
- Minimum loss reduction required to make a further partition on a leaf node of the tree
- Regularization parameter
- The number of trees
- Maximum depth of each tree
- Minimum number of samples that must be present in a leaf node
- Minimum number of samples required to split an internal node
- Whether to bootstrap samples or not
- The regularization strength
- Decision boundaries
- The type of kernel function
- The maximum depth of the individual decision trees
- The number of boosting iterations
- Regularization term that prevents overfitting
- The step size for updating the model during each iteration
- Width of the decision prediction layer
- Width of the attention embedding for each mask
- Number of steps in the architecture
3. Results
- Sampling predictors (colsample_bytree): 0.8
- Sampling observations (subsample): 0.6
- The learning rate (learning_rate): 0.1
- The maximum depth of a tree (max_depth): 3
- The number of trees (n_estimators): 200
- Minimum loss reduction required to make a further partition on a leaf node of the tree (gamma): 0.3
- Regularization parameter (reg_alpha and reg_lambda): 0 and 2
- The number of trees (n_estimators): 300
- Maximum depth of each tree (max_depth): 30
- Minimum number of samples that must be present in a leaf node (min_samples_leaf): 1
- Minimum number of samples required to split an internal node (min_samples_split): 10
- Whether to bootstrap samples or not (bootstrap): True
- The regularization strength (C): 1
- Decision boundaries (gamma): 1
- The type of kernel function (kernel): linear
- The maximum depth of the individual decision trees (depth): 4
- The number of boosting iterations (iterations): 100
- Regularization term that prevents overfitting (l2_leaf_reg): 7
- The step size for updating the model during each iteration (learning_rate): 0.05
- Learning rate (lr): 0.001
- Optimizer (optimizer_fn): Adam
- Loss function: binary crossentropy
- batch size: 32
- Learning rate (lr): 0.02
- Optimizer (optimizer_fn): Adam
- batch size: 32
- Width of the decision prediction layer (n_d): 8
- Width of the attention embedding for each mask (n_a): 8
- Number of steps (n_steps): 3
4. Discussion
5. Conclusions
Funding
Institutional Review Board Statement
Informed Consent Statement
Data Availability Statement
Acknowledgments
Conflicts of Interest
References
- Raal, F.J.; Santos, R.D. Homozygous familial hypercholesterolemia: Current perspectives on diagnosis and treatment. Atherosclerosis 2012, 223, 262–268. [Google Scholar] [CrossRef] [PubMed]
- Pajak, A.; Szafraniec, K.; Polak, M.; Drygas, W.; Piotrowski, W.; Zdrojewski, T.; Jankowski, P. Prevalence of familial hypercholesterolemia: A meta-analysis of six large, observational, population-based studies in Poland. Arch. Med. Sci. 2016, 12, 687–696. [Google Scholar] [CrossRef] [PubMed]
- Chlebus, K.; Cybulska, B.; Gruchała, M.; Smaga, A.; Wróbel, K.; Wojtyniak, B.; Pajkowski, M.; Jankowski, P.; Zdrojewski, T. Prevalence, diagnosis, and treatment of familial hypercholesterolaemia in outpatient practices in Poland. Pol. Heart J. (Kardiol. Pol.) 2018, 76, 960–967. [Google Scholar] [CrossRef] [PubMed]
- Walma, E.; Visseren, F.; Jukema, J.; Kastelein, J.; Hoes, A.; Stalenhoef, A. The practice guideline ’Diagnosis and treatment of familial hypercholesterolaemia’ of the Dutch Health Care Insurance Board. Ned. Tijdschr. Voor Geneeskd. 2006, 150, 18–23. [Google Scholar]
- Casula, M.; Olmastroni, E.; Pirillo, A.; Catapano, A.; Arca, M.; Averna, M.; Bertolini, S.; Calandra, S.; Tarugi, P.; Pellegatta, F.; et al. Evaluation of the performance of Dutch Lipid Clinic Network score in an Italian FH population: The LIPIGEN study. Atherosclerosis 2018, 277, 413–418. [Google Scholar] [CrossRef] [PubMed]
- Boccatonda, A.; Rossi, I.; D’Ardes, D.; Cocomello, N.; Perla, F.M.; Bucciarelli, B.; Rocco, G.D.; Ben, M.; Angelico, F.; Guagnano, M.T.; et al. Comparison between different diagnostic scores for the diagnosis of familial hypercholesterolemia: Assessment of their diagnostic accuracy in comparison with genetic testing. Eur. Heart J. 2020, 41, ehaa946.3206. [Google Scholar] [CrossRef]
- Mohammadnia, N.; Bax, W.; Cornel, J. Abstract 11337: Sensitivity Analysis of an Electronic Health Record-Based Algorithm to Facilitate Detection of Familial Hypercholesterolemia: Results in Genetically Confirmed Familial Hypercholesterolemia. Circulation 2021, 144, A11337. [Google Scholar] [CrossRef]
- Patel, V.L.; Shortliffe, E.H.; Stefanelli, M.; Szolovits, P.; Berthold, M.R.; Bellazzi, R.; Abu-Hanna, A. The coming of age of artificial intelligence in medicine. Artif. Intell. Med. 2009, 46, 5–17. [Google Scholar] [CrossRef] [PubMed]
- Castaneda, C.; Nalley, K.; Mannion, C.; Bhattacharyya, P.; Blake, P.; Pecora, A.; Goy, A.; Suh, K.S. Clinical decision support systems for improving diagnostic accuracy and achieving precision medicine. J. Clin. Bioinform. 2015, 5, 1–16. [Google Scholar] [CrossRef] [PubMed]
- Dai, Y.; Gao, Y.; Liu, F. Transmed: Transformers advance multi-modal medical image classification. Diagnostics 2021, 11, 1384. [Google Scholar] [CrossRef] [PubMed]
- Manzari, O.N.; Ahmadabadi, H.; Kashiani, H.; Shokouhi, S.B.; Ayatollahi, A. MedViT: A robust vision transformer for generalized medical image classification. Comput. Biol. Med. 2023, 157, 106791. [Google Scholar] [CrossRef] [PubMed]
- Wu, X.; Feng, Y.; Xu, H.; Lin, Z.; Chen, T.; Li, S.; Qiu, S.; Liu, Q.; Ma, Y.; Zhang, S. CTransCNN: Combining transformer and CNN in multilabel medical image classification. Knowl.-Based Syst. 2023, 281, 111030. [Google Scholar] [CrossRef]
- Sidey-Gibbons, J.A.M.; Sidey-Gibbons, C. Machine learning in medicine: A practical introduction. BMC Med. Res. Methodol. 2019, 19, 64. [Google Scholar] [CrossRef]
- Huang, M.W.; Chen, C.W.; Lin, W.C.; Ke, S.W.; Tsai, C.F. SVM and SVM ensembles in breast cancer prediction. PLoS ONE 2017, 12, e0161501. [Google Scholar] [CrossRef] [PubMed]
- Radakovich, N.; Nagy, M.; Nazha, A. Machine learning in haematological malignancies. Lancet Haematol. 2020, 7, e541–e550. [Google Scholar] [CrossRef] [PubMed]
- Richens, J.G.; Lee, C.M.; Johri, S. Improving the accuracy of medical diagnosis with causal machine learning. Nat. Commun. 2020, 11, 3923. [Google Scholar] [CrossRef] [PubMed]
- Schaefer, J.; Lehne, M.; Schepers, J.; Prasser, F.; Thun, S. The use of machine learning in rare diseases: A scoping review. Orphanet J. Rare Dis. 2020, 15, 145. [Google Scholar] [CrossRef]
- Luo, R.F.; Wang, J.H.; Hu, L.J.; Fu, Q.A.; Zhang, S.Y.; Jiang, L. Applications of machine learning in familial hypercholesterolemia. Front. Cardiovasc. Med. 2023, 10, 1237258. [Google Scholar] [CrossRef] [PubMed]
- Rao, A.R.; Wang, H.; Gupta, C. Predictive Analysis for Optimizing Port Operations. arXiv 2024, arXiv:2401.14498. [Google Scholar]
- Pina, A.; Helgadottir, S.; Mancina, R.; Pavanello, C.; Pirazzi, C.; Montalcini, T.; Henriques, R.; Calabresi, L.; Wiklund, O.; Macedo, M.P.; et al. Virtual genetic diagnosis for familial hypercholesterolemia powered by machine learning. Eur. J. Prev. Cardiol. 2020, 27, 1639–1646. [Google Scholar] [CrossRef] [PubMed]
- Albuquerque, J.; Medeiros, A.M.; Alves, A.C.; Bourbon, M.; Antunes, M. Performance comparison of different classification algorithms applied to the diagnosis of familial hypercholesterolemia in paediatric subjects. Sci. Rep. 2022, 12, 1164. [Google Scholar] [CrossRef]
- Albuquerque, J.; Medeiros, A.M.; Alves, A.C.; Bourbon, M.; Antunes, M. Comparative study on the performance of different classification algorithms, combined with pre-and post-processing techniques to handle imbalanced data, in the diagnosis of adult patients with familial hypercholesterolemia. PLoS ONE 2022, 17, e0269713. [Google Scholar] [CrossRef] [PubMed]
- Benn, M.; Watts, G.; Tybjaerg-hansen, A.; Nordestgaard, B. Familial hypercholesterolemia in the danish general population: Prevalence, coronary artery disease, and cholesterol-lowering medication. J. Clin. Endocrinol. Metab. 2012, 97, 3956–3964. [Google Scholar] [CrossRef] [PubMed]
- Defesche, J.; Lansberg, P.; Umans-Eckenhausen, M.; Kastelein, J. Advanced method for the identification of patients with inherited hypercholesterolemia. Semin. Vasc. Med. 2004, 4, 59–65. [Google Scholar] [CrossRef] [PubMed]
- Arik, S.O.; Pfister, T. Tabnet: Attentive interpretable tabular learning. arXiv 2019, arXiv:1908.07442. [Google Scholar] [CrossRef]
- Belete, D.; Huchaiah, M.D. Grid search in hyperparameter optimization of machine learning models for prediction of HIV/AIDS test results. Int. J. Comput. Appl. 2021, 44, 875–886. [Google Scholar] [CrossRef]
- Alibrahim, H.; Ludwig, S.A. Hyperparameter Optimization: Comparing Genetic Algorithm against Grid Search and Bayesian Optimization. In Proceedings of the 2021 IEEE Congress on Evolutionary Computation (CEC), Krakow, Poland, 28 June–1 July 2021; pp. 1551–1559. [Google Scholar] [CrossRef]
- Osamor, V.; Okezie, A. Enhancing the weighted voting ensemble algorithm for tuberculosis predictive diagnosis. Sci. Rep. 2021, 11, 14806. [Google Scholar] [CrossRef] [PubMed]
- Ma, Z.; Wang, P.; Gao, Z.; Wang, R.; Khalighi, K. Ensemble of machine learning algorithms using the stacked generalization approach to estimate the warfarin dose. PLoS ONE 2018, 13, e0205872. [Google Scholar] [CrossRef] [PubMed]
- Kaushik, H.; Singh, D.; Kaur, M.; Alshazly, H.; Zaguia, A.; Hamam, H. Diabetic retinopathy diagnosis from fundus images using stacked generalization of deep models. IEEE Access 2021, 9, 108276–108292. [Google Scholar] [CrossRef]
- Scicali, R.; Pino, A.D.; Platania, R.; Purrazzo, G.; Ferrara, V.; Giannone, A.; Urbano, F.; Filippello, A.; Rapisarda, V.; Farruggia, E.; et al. Detecting familial hypercholesterolemia by serum lipid profile screening in a hospital setting: Clinical, genetic and atherosclerotic burden profile. Nutr. Metab. Cardiovasc. Dis. NMCD 2018, 28, 35–43. [Google Scholar] [CrossRef] [PubMed]
- Chan, D.; Pang, J.; Hooper, A.; Bell, D.; Bates, T.; Burnett, J.; Watts, G. A Comparative Analysis of Phenotypic Predictors of Mutations in Familial Hypercholesterolemia. J. Clin. Endocrinol. Metab. 2018, 103, 1704–1714. [Google Scholar] [CrossRef] [PubMed]


| Model | Accuracy | Precision | Recall | F1-Score |
|---|---|---|---|---|
| CatBoost | 0.804 | 0.812 | 0.629 | 0.709 |
| XGBoost | 0.724 | 0.660 | 0.565 | 0.609 |
| SVM | 0.773 | 0.879 | 0.468 | 0.611 |
| RF | 0.798 | 0.764 | 0.677 | 0.718 |
| NN | 0.718 | 0.611 | 0.709 | 0.657 |
| TabNet | 0.742 | 0.727 | 0.516 | 0.603 |
| Model | Accuracy | Precision | Recall | F1-Score |
|---|---|---|---|---|
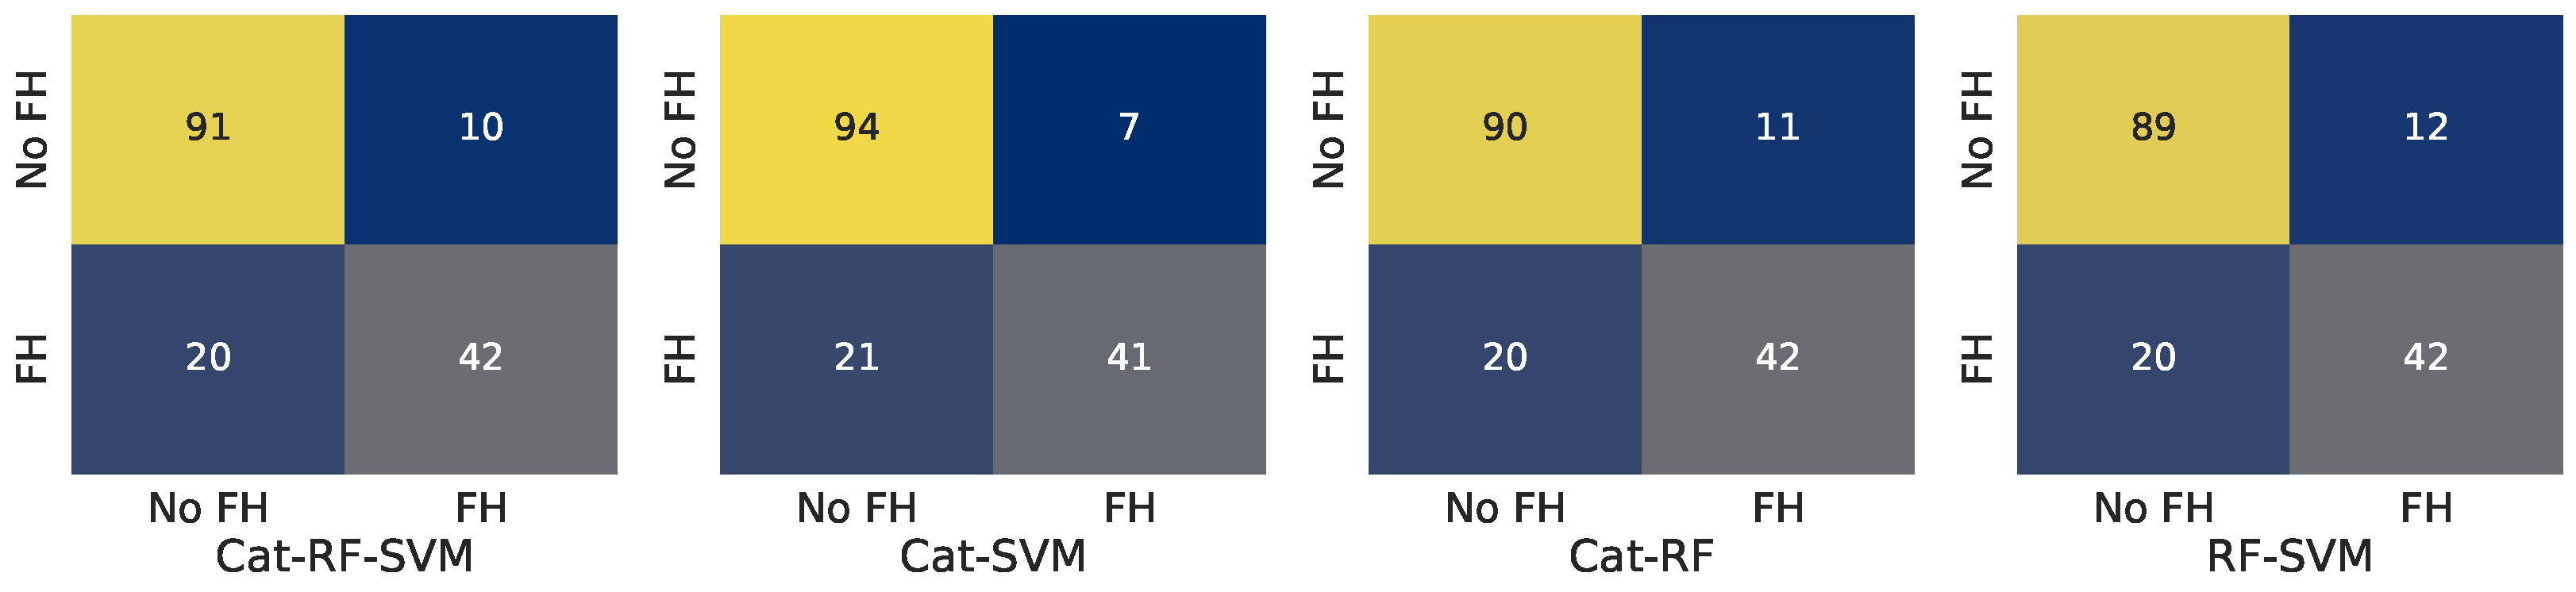
| Cat-RF-SVM | 0.828 | 0.840 | 0.677 | 0.750 |
| Cat-SVM | 0.816 | 0.848 | 0.629 | 0.722 |
| Cat-RF | 0.798 | 0.796 | 0.629 | 0.703 |
| RF-SVM | 0.779 | 0.750 | 0.629 | 0.684 |
| Model | Accuracy | Precision | Recall | F1-Score |
|---|---|---|---|---|
| Cat-RF-SVM | 0.816 | 0.808 | 0.677 | 0.737 |
| Cat-SVM | 0.828 | 0.854 | 0.661 | 0.745 |
| Cat-RF | 0.810 | 0.792 | 0.677 | 0.730 |
| RF-SVM | 0.804 | 0.778 | 0.677 | 0.724 |
| Catboost | ||||
| DLCN Score | Accuracy | Precision | Recall | F1-Score |
| <0, 2> | 0.625 | 0.667 | 0.286 | 0.400 |
| <3, 5> | 0.812 | 0.828 | 0.686 | 0.750 |
| <6, 8> | 0.857 | 0.889 | 0.615 | 0.727 |
| 9 and above | 0.800 | 0.714 | 0.714 | 0.714 |
| Voting Cat-RF-SVM | ||||
| DLCN Score | Accuracy | Precision | Recall | F1-Score |
| <0, 2> | 0.750 | 1.000 | 0.429 | 0.600 |
| <3, 5> | 0.800 | 0.800 | 0.686 | 0.738 |
| <6, 8> | 0.881 | 0.900 | 0.692 | 0.783 |
| 9 and above | 0.900 | 0.857 | 0.857 | 0.857 |
| Stacking Cat-SVM | ||||
| DLCN Score | Accuracy | Precision | Recall | F1-Score |
| <0, 2> | 0.625 | 0.667 | 0.286 | 0.400 |
| <3, 5> | 0.835 | 0.862 | 0.714 | 0.781 |
| <6, 8> | 0.881 | 0.900 | 0.692 | 0.783 |
| 9 and above | 0.850 | 0.833 | 0.714 | 0.769 |
| DLCN Score | CatBoost | Voting Cat-RF-SVM | Stacking Cat-SVM | DLCN Score Accuracy |
|---|---|---|---|---|
| <0, 2> | 0.286 | 0.429 | 0.286 | - |
| <3, 5> | 0.686 | 0.686 | 0.714 | - |
| <6, 8> | 0.615 | 0.692 | 0.692 | 0.310 |
| 9 and above | 0.714 | 0.857 | 0.714 | 0.350 |
| Model 1 | Model 2 | p-Value |
|---|---|---|
| DLCN bin. pred. | CatBoost | 0.000 (<0.05) |
| DLCN bin. pred | Voting Cat-RF-SVM | 0.000 (<0.05) |
| DLCN bin. pred | Stacking Cat-SVM | 0.000 (<0.05) |
| logistic reg. | CatBoost | 0.000 (<0.05) |
| logistic reg | Voting Cat-RF-SVM | 0.000 (<0.05) |
| logistic reg | Stacking Cat-SVM | 0.000 (<0.05) |
Disclaimer/Publisher’s Note: The statements, opinions and data contained in all publications are solely those of the individual author(s) and contributor(s) and not of MDPI and/or the editor(s). MDPI and/or the editor(s) disclaim responsibility for any injury to people or property resulting from any ideas, methods, instructions or products referred to in the content. |
© 2024 by the author. Licensee MDPI, Basel, Switzerland. This article is an open access article distributed under the terms and conditions of the Creative Commons Attribution (CC BY) license (https://creativecommons.org/licenses/by/4.0/).
Share and Cite
Kocejko, T. A Data-Driven Comparative Analysis of Machine-Learning Models for Familial Hypercholesterolemia Detection. Appl. Sci. 2024, 14, 11187. https://doi.org/10.3390/app142311187
Kocejko T. A Data-Driven Comparative Analysis of Machine-Learning Models for Familial Hypercholesterolemia Detection. Applied Sciences. 2024; 14(23):11187. https://doi.org/10.3390/app142311187
Chicago/Turabian StyleKocejko, Tomasz. 2024. "A Data-Driven Comparative Analysis of Machine-Learning Models for Familial Hypercholesterolemia Detection" Applied Sciences 14, no. 23: 11187. https://doi.org/10.3390/app142311187
APA StyleKocejko, T. (2024). A Data-Driven Comparative Analysis of Machine-Learning Models for Familial Hypercholesterolemia Detection. Applied Sciences, 14(23), 11187. https://doi.org/10.3390/app142311187