1. Introduction
An estimated 1.2 million people die annually worldwide due to road traffic accidents. In 2023, the World Health Organization (WHO) reported that approximately 3% of the gross domestic product (GDP) of most countries is lost due to these accidents [
1]. Road traffic accidents are a significant social issue, especially as they are a leading cause of death among young people [
2]. Specifically, for individuals aged 15 to 29, road traffic accidents are the leading cause of death, highlighting the urgent need for safety improvements to reduce these social losses [
3].
To minimize the loss of life and property from traffic accidents, it is crucial to analyze the factors influencing their frequency and develop appropriate countermeasures [
4]. Developing a model to estimate the frequency of traffic accidents is essential. For a highly accurate traffic accident prediction model, identifying and selecting key variables that significantly affect the frequency of these accidents is crucial. Incorporating these key variables into a traffic accident prediction model can effectively support the development of safety management strategies to address traffic safety issues [
5].
Various models have been developed to estimate the frequency of traffic accidents by explaining the relationship between multiple influencing factors and accident frequency. Common factors used in these models include traffic conditions such as annual average daily traffic (AADT) and travel speed, road geometric conditions such as the number of lanes, gradients, and the curve radius, and environmental conditions such as rainfall and snowfall [
6,
7]. Initially, linear regression models were commonly used to represent the relationship between key factors and the frequency of traffic accidents [
8]. These models assume that the dependent variable, the frequency of traffic accidents, follows a normal distribution [
9]. However, this assumption does not adequately reflect the characteristics of traffic accidents, which occur randomly and rarely. Therefore, to overcome the limitations of linear regression models, Poisson regression models, negative binomial regression models, multinomial probability models, and Bayesian models have been used [
10].
Statistical models for more accurately estimating the frequency of traffic accidents have continuously evolved over a long period. Despite this, the factors influencing traffic accidents are highly diverse and exhibit complex interrelationships, making it extremely challenging to identify and model these relationships accurately. Consequently, models utilizing artificial intelligence (AI), which have superior predictive performance compared to traditional statistical models, have recently emerged. AI-based approaches offer several advantages: first, AI can efficiently process large volumes of data; second, AI can build models even if the interrelationships between data are not clear; and finally, AI models can autonomously learn important features, resulting in relatively high predictive accuracy. However, there are limitations in understanding the basis on which AI estimates the frequency of traffic accidents. Fully explaining AI’s reasoning is extremely challenging, a phenomenon known in the field of AI as the “black box” problem [
11]. One approach to addressing this issue is the use of explainable AI (XAI) [
12].
The primary question addressed in this study is: “What are the key factors influencing traffic accident occurrences, and are these factors consistently identified across traditional statistical models and AI-based models?” To achieve this, various data—including the frequency of traffic accidents, traffic volume, geometric structure, and congestion level—were collected from individual sections of motorways in South Korea. Following the research objective, traditional statistical models and AI-based models were employed to identify key variables significantly influencing traffic accidents. Furthermore, the AI-based model was integrated with XAI to explain the variables that have a meaningful impact on traffic accident frequency.
This study bridges an important gap in the field by ensuring the consistency and reliability of key traffic accident factors through the use of both traditional statistical methods and AI-based methodologies. Additionally, the application of XAI enhances the interpretability of AI models, making the results more actionable for traffic safety strategies. The key influencing factors identified in this study can serve as critical resources for designing safety enhancement strategies for motorways.
The temporal scope of this study encompasses the year 2021, while the spatial scope focuses on motorways, specifically expressways, in South Korea. This location was chosen as it facilitates the collection of data pertinent to factors influencing traffic accidents. Detailed information regarding the scope will be expounded upon in the data collection section.
2. Literature Review
2.1. Traffic Accident Prediction Model Using Traditional Statistical Models
Various studies have introduced different models to elucidate the relationship between traffic accidents and key factors. These models encompass the Poisson regression model, Poisson-lognormal model, negative binomial regression model, and generalized estimating equations [
13]. The primary objective of these traffic accident prediction models is to pinpoint factors significantly impacting the frequency of traffic accidents. Among these, the Poisson regression model stands out as a frequently utilized tool for estimating traffic accident frequencies. It is adept at handling discrete data and avoids returning negative values, rendering it suitable for modeling traffic accident frequencies, which are inherently non-negative [
14].
The Poisson regression model operates under the assumption of equal mean and variance. However, in the context of traffic accidents, the variance often surpasses the mean, a phenomenon known as overdispersion [
13]. Consequently, an overdispersion test becomes necessary to ascertain the presence of overdispersion. Failure to meet the Poisson regression model’s assumption in the presence of overdispersion can introduce model bias. In such scenarios, resorting to the negative binomial regression model is recommended.
Yan et al. [
15] developed a traffic accident prediction model using a random effect negative binomial regression model to accommodate heterogeneity and mitigate biased parameter estimation. Their dataset encompassed 48,154 traffic accidents spanning three years on highways in Washington State, USA. By crafting both a negative binomial model and a random effect negative binomial model, they determined that the latter exhibited lower standard errors and thus delivered superior performance. Significant factors influencing traffic accidents in their study included AADT, speed limits, road surface conditions, horizontal alignment type, and visibility.
Naghawi [
16] devised a traffic accident severity prediction model employing a negative binomial regression model. The study incorporated six collected factors: driver negligence, age, gender, environmental factors, time of accident, and data related to road or vehicle defects, alongside the frequency and severity of traffic accidents. Descriptive analysis was conducted to identify factors deeply associated with traffic accident severity, forming the basis for the traffic accident prediction model. The findings revealed a decrease in traffic accident severity with increasing age, independent of the driver’s gender. Moreover, improved environmental conditions, weekends versus weekdays, and evenings versus mornings were correlated with reduced traffic accident severity. The negative binomial regression model’s analysis results regarding factors influencing traffic accidents aligned with those from descriptive analysis.
Dong et al. [
17] developed a model to analyze the relationships between variables associated with the frequency of traffic accidents, utilizing multivariate traffic accident data obtained from police reports in Tennessee, USA. Given the infrequent occurrence of traffic accidents, a substantial portion of the data comprised zero accident counts. To effectively address this issue, the study employed a multivariate random-parameter zero-inflated negative binomial (MRZINB) regression model. This model effectively estimated relationships between the frequency of traffic accidents and factors such as road pavement conditions, traffic factors, and road geometric characteristics. The study concluded that the MRZINB model adequately addressed data heterogeneity and zero-inflation tendencies.
Miaou [
18] conducted a comparative analysis of Poisson, zero-inflated Poisson, and negative binomial regression models to elucidate the relationship between heavy vehicle traffic accidents and road geometric conditions, using data from the Highway Safety Information System. The results indicated that, under the maximum likelihood method, the parameters estimated by the three models were consistent, and their performance in estimating traffic accident frequency was comparable. The study recommended initiating with the Poisson regression model and subsequently considering the negative binomial or zero-inflated Poisson models based on overdispersion analysis of the data. It also noted challenges in interpreting the zero-inflated Poisson model, especially in cases with an excessive number of zero-count data.
2.2. Traffic Accident Prediction Model Using AI
Explaining the frequency of traffic accidents with simple equations or statistical models is challenging due to their diverse and complex causes. Consequently, AI-based traffic accident prediction models have emerged, leveraging deep learning’s complex and robust model structures to estimate variable relationships and enhance predictive accuracy significantly. This has spurred the active development of prediction models in road traffic safety.
Assi [
19] highlighted the severity of traffic accident issues and emphasized the need to improve road safety to mitigate social and economic losses. They developed a prediction model using a Deep Neural Network (DNN) to forecast both the frequency and severity of traffic accidents, drawing upon various data categories such as human factors, environmental factors, road characteristics, and vehicle characteristics. Evaluating the model against the widely used Support Vector Machine (SVM) for traffic accident severity prediction revealed the DNN’s superior performance, achieving a remarkable prediction accuracy of 95% and an F1-score of 93%.
Chen et al. [
20] tackled the inverse problem of reconstructing traffic accidents using data-driven machine learning techniques. Their approach involved building a DNN capable of reconstructing initial accident conditions based on damage and structural changes (accident debris) resulting from accidents. This methodology successfully estimated the initial collision conditions of accidents, providing a valuable tool for forensic analysis and offering engineering solutions to address failure and vehicle safety issues.
Rezapour and Ksaibati [
21] cautioned against overly complex algorithms or deeply layered architectures when developing deep learning prediction models for traffic accident severity. They conducted a comparative study of three models: simple Long Short-Term Memory (LSTM), a deeper LSTM architecture, and a stacked model combining LSTM and a DNN. Surprisingly, the results favored the simple LSTM model, demonstrating superior performance over the other models evaluated.
Pan et al. [
22] developed a safety performance function utilizing a Deep Belief Network (DBN) for highways in Ontario, Colorado, and Washington, USA. They compared the performance of the DBN model with a traditional statistical model, the negative binomial regression model, using actual traffic accident data from these regions. The results demonstrated that the DBN model could estimate traffic accident frequency with accuracy similar to that of the negative binomial regression model. Moreover, the DBN-based model exhibited higher efficiency compared to the negative binomial regression model.
2.3. Traffic Accident Prediction Model Using Explainable AI
The advent of AI has significantly enhanced predictive performance compared to traditional statistical models. However, this advancement has also raised concerns regarding the interpretability of AI models [
23]. It is essential not only to achieve high performance but also to understand how a model arrives at its estimates of traffic accident frequency and the rationale behind these estimates. To interpret a model, users must be able to comprehend the process by which the model’s algorithm arrives at specific estimates. Deep learning models, often termed “black box” models, possess complex internal structures that are challenging to interpret [
24], rendering interpretability a significant weakness of these models. Addressing this issue, Lundberg and Lee [
25] introduced SHAP, a concept that quantifies the impact or importance of each input variable, such as AADT, on the model’s estimates. By quantifying the direction and magnitude of the influence of specific input variables, SHAP helps alleviate the interpretability challenges inherent in deep learning models.
Kang and Khattak [
26] crafted a model utilizing traffic accident data from Nebraska, USA, alongside a DNN to estimate injury severity resulting from traffic accidents. The developed DNN exhibited notably superior performance in terms of accuracy, precision, and recall when compared to the baseline logistic regression model. However, it encountered the drawback of high computational costs. To mitigate the interpretability challenge, the researchers integrated SHAP, enabling the interpretation of prediction outcomes for individual observations. This facilitated a deeper analysis of the factors influencing injury severity stemming from traffic accidents.
Wei et al. [
27] devised four models elucidating the correlation between traffic accident frequency and severity with factors such as road geometry, weather conditions, and speed, utilizing suburban highway data from Texas, USA. Among the four model types—Random Forest, AdaBoost, XGBoost, and DNN—the XGBoost model demonstrated the most impressive performance. Leveraging SHAP, they pinpointed the contribution of each influencing factor to the model’s estimations. The outcomes underscored the substantial impact of weather fluctuations and speed distribution on traffic accident frequency.
2.4. Differences from Previous Studies
The comparison between previous studies and the proposed method in this study is summarized in
Table 1. A review of the existing research revealed that numerous studies have developed diverse models to predict either the frequency or severity of traffic accidents, often comparing their respective performances. Notably, from a methodological perspective, there has been a noticeable progression and evolution from traditional statistical models toward AI-based models. Specifically concerning traffic accident count data, significant efforts have been made to address issues surrounding zero inflation or imbalance.
The objective of this study is to analyze the consistency of significant variables derived from various model types. Furthermore, in cases where inconsistencies in significant variables arise, this study aims to identify the underlying reasons for such discrepancies. While most prior studies focus on identifying key influencing factors using a single methodology, this study goes further by combining traditional statistical methods and AI-based methods (DNN) to analyze the consistency of key influencing factors across diverse methodologies. Additionally, we applied SHAP, an XAI methodology, to address the interpretability limitations of AI-based models. This allowed us to provide both global and local explanations regarding each variable’s contribution, addressing the black box issue inherent in AI models.
3. Data Description and Preprocessing
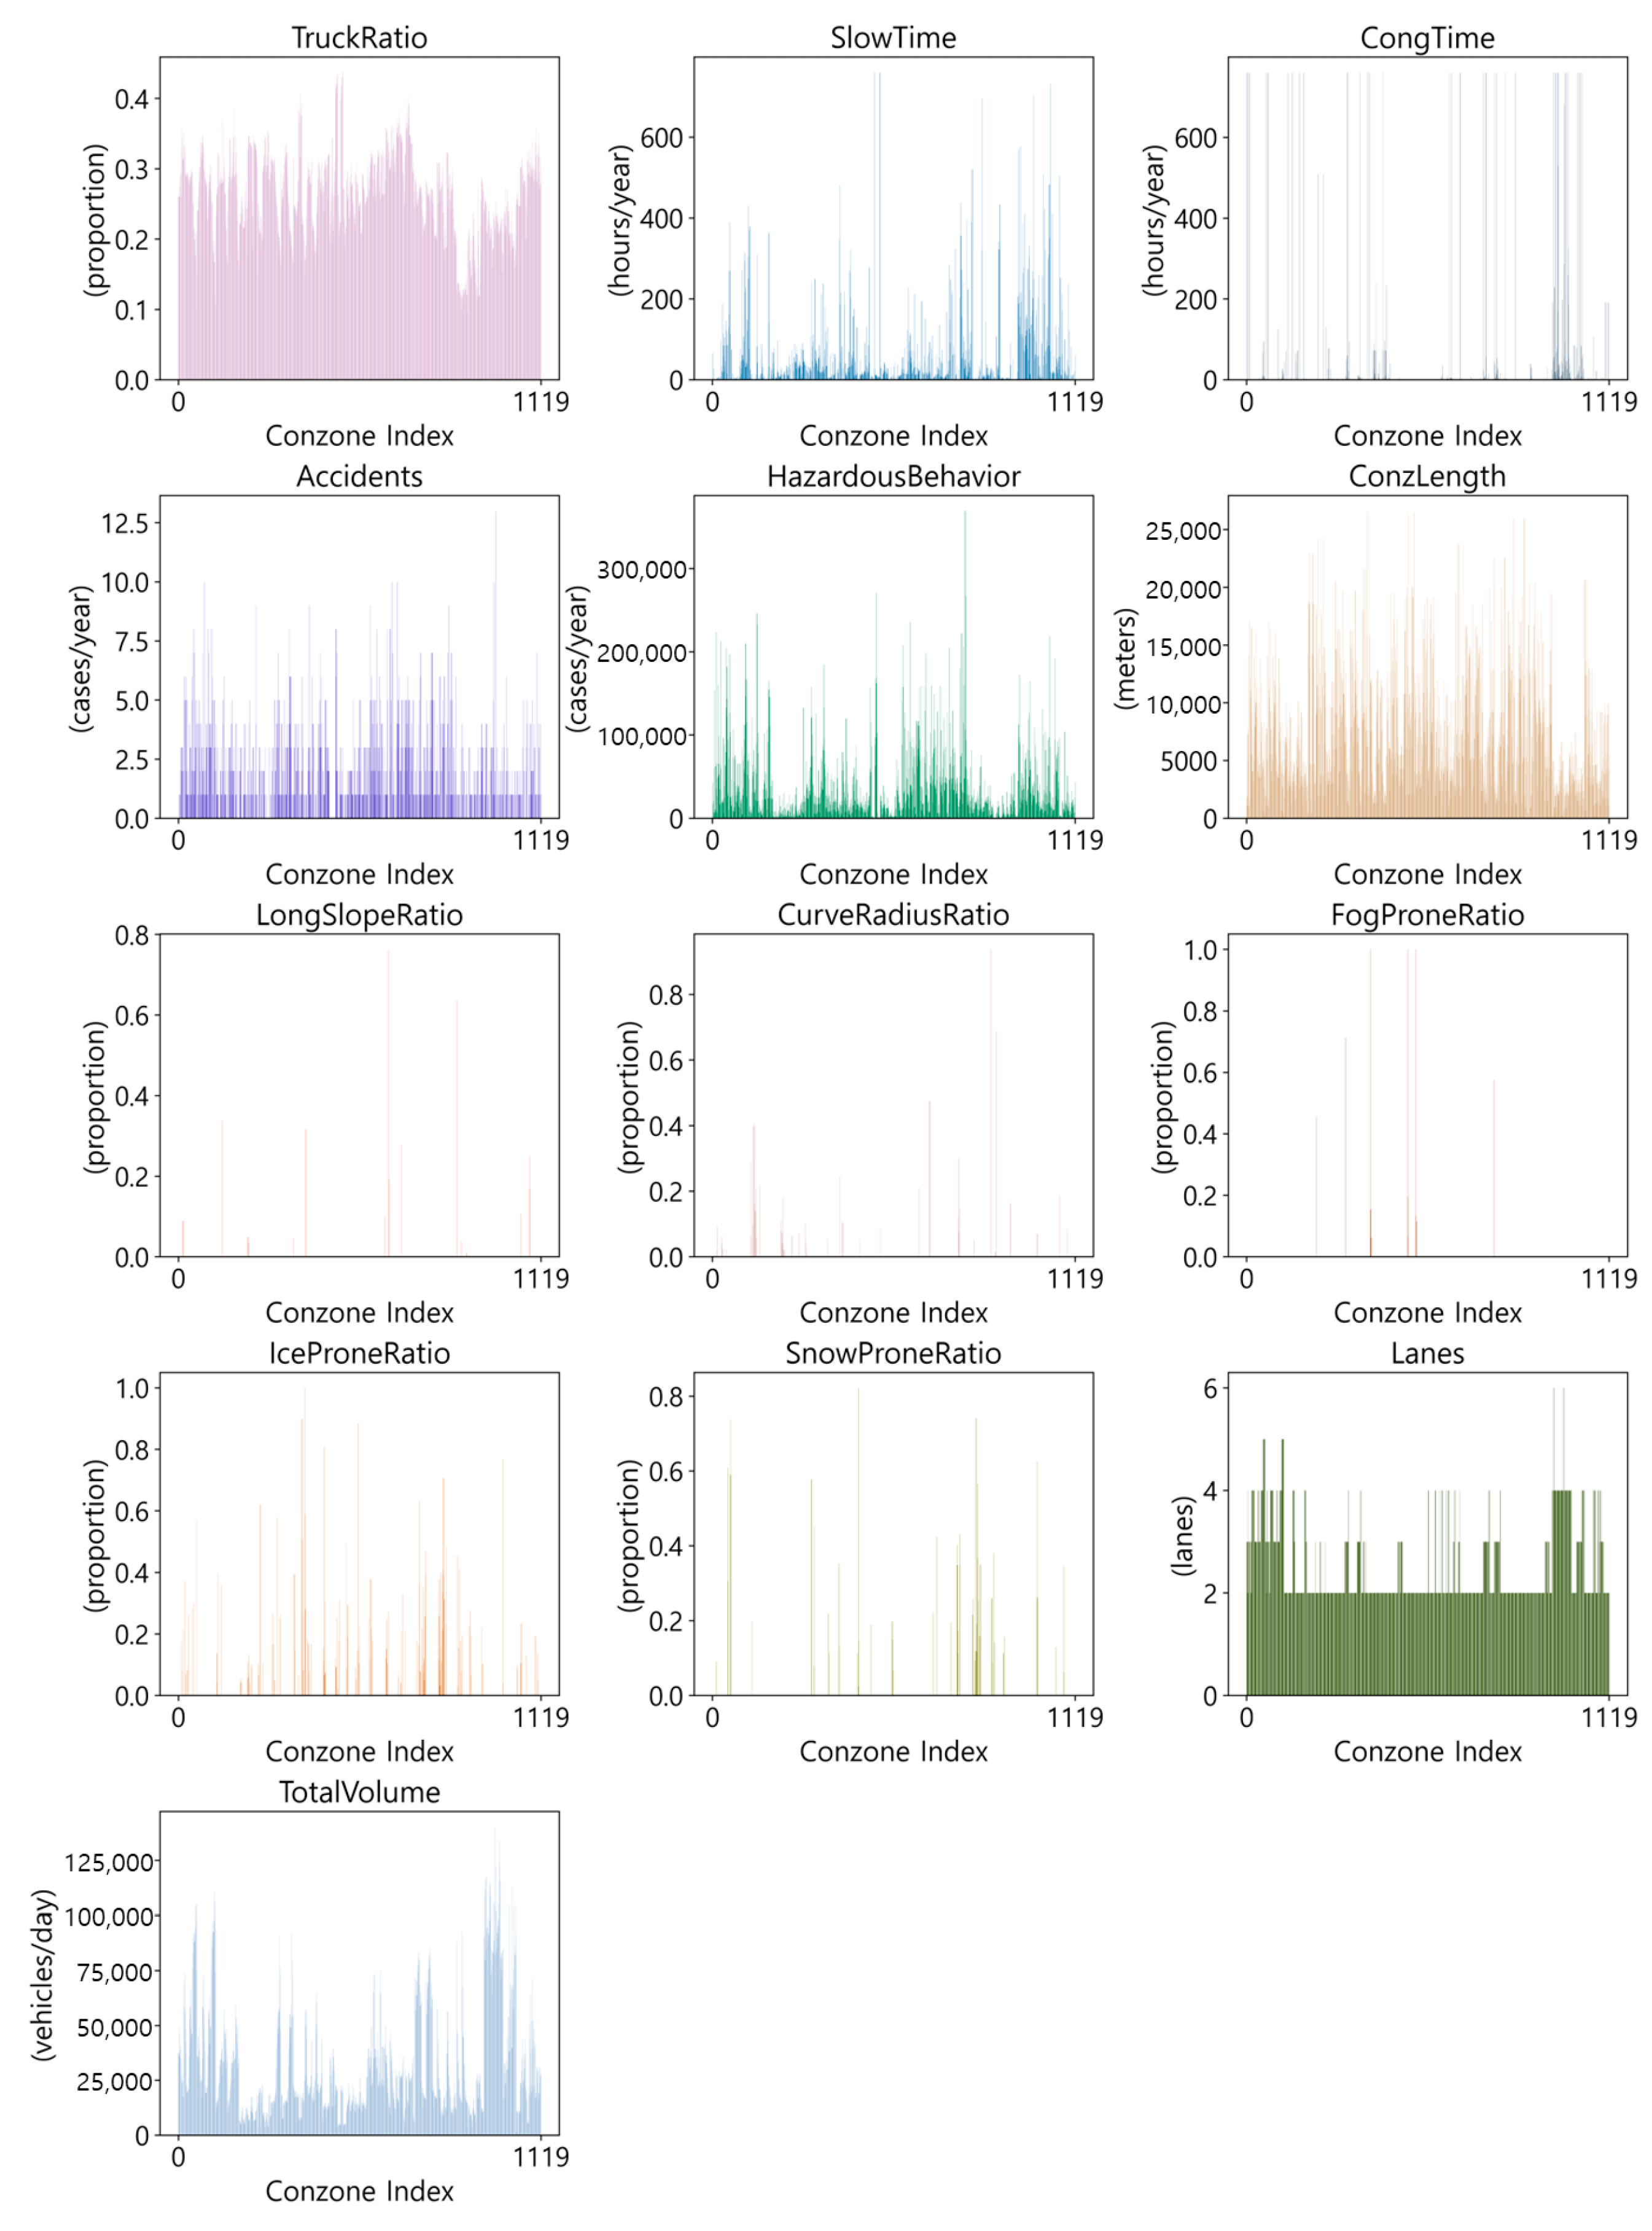
Data regarding the frequency of traffic accidents per “conzone” on motorways in South Korea, along with 12 influencing factors, were utilized for this study. Here, a conzone denotes the segment between motorway interchanges. The choice of motorways for analysis was deliberate due to the ease of collecting comprehensive data related to traffic accidents compared to other types of roads. Traffic accidents are caused by a wide range of factors (e.g., human, road environment, and vehicle factors). Incorporating a diverse range of data improves the reliability and accuracy of predicting traffic accident occurrences. To this end, we collected relatively recent data covering various types of accident-related factors. The data are categorized into four groups: traffic environment, traffic safety, geometric characteristics, and weather conditions, comprising a total of 12 data types. The temporal scope of the data collection is limited to the year 2021. This selection was made to ensure consistency across the diverse data types while also utilizing the most recent year that allowed for the collection of all relevant data. Unlike existing studies that primarily use variables such as traffic volume or road segment length, we introduced unique and specific variables, such as the ‘Number of Hazardous Driving Behaviors’, which provide a deeper understanding of accident characteristics. These innovative variables, rarely used in prior research, aim to enhance the reliability and accuracy of traffic accident prediction. The 12 influencing factors employed in this study include ‘Truck Traffic Ratio’, ‘Slow Traffic Time’, ‘Congestion Time’, ‘Number of Hazardous Driving Behaviors’, ‘Conzone Length’, ‘Hazardous Longitudinal Slope Ratio’, ‘Hazardous Curve Radius Ratio’, ‘Fog-Prone Section Ratio’, ‘Ice-Prone Section Ratio’, ‘Snow-Prone Section Ratio’, ‘Number of Lanes’, and ‘Total Traffic Volume’, as presented in
Table 2.
Table 2.
Data derivation method used for analysis.
Table 2.
Data derivation method used for analysis.
| Category | Unit | Details |
|---|
| Frequency of Traffic Accidents (Accidents) | cases/year | Frequency of individual traffic accidents |
Truck Traffic Ratio
(TruckRatio) | percent (%) | Proportion of trucks in total traffic volume |
Slow Traffic Time
(SlowTime) | hours/year | Total hours of slow traffic based on hourly travel speed (considered slow traffic if travel speed is between 40 km/h and 80 km/h) |
Congestion Duration
(CongTime) | hours/year | Total hours of congestion based on hourly travel speed (considered congested if travel speed is below 40 km/h) |
Number of
Hazardous Driving Behaviors
(HazardousBehavior) | cases/year | Total frequency of 11 types of hazardous driving behaviors |
| Conzone Length (ConzLength) | meters(m) | Length of the conzone |
Hazardous
Longitudinal Slope Ratio
(LongSlopeRatio) | percent (%) | The proportion of sections with longitudinal slopes surpassing the hazardous condition threshold is a critical metric. According to the “Road Structure and Facility Standards” of Korea, the maximum longitudinal slope permitted for highways is elaborated in Table 3. For the purposes of this study, the hazardous condition threshold is defined as slopes exceeding 6% |
| Hazardous Curve Radius Ratio (CurveRadiusRatio) | percent (%) | The proportion of sections with curve radii surpassing the hazardous condition threshold is a crucial parameter. As per the “Road Structure and Facility Standards” of Korea, the minimum curve radius allowed for highways is outlined in Table 4. For this study, the hazardous condition threshold is defined as curve radii less than 500 m |
| Fog-Prone Section Ratio (FogProneRatio) | percent (%) | Proportion of fog-prone sections |
| Ice-Prone Section Ratio (IceProneRatio) | percent (%) | Proportion of ice-prone sections |
| Snow-Prone Section Ratio (SnowProneRatio) | percent (%) | Proportion of snow-prone sections |
Number of Lanes
(Lanes) | Lanes | Number of lanes in the conzone |
Total Traffic Volume
(TotalVolume) | vehicles/day | Annual average daily traffic (AADT) |
The “Number of Hazardous Driving Behaviors” was computed using data obtained from digital tachographs (DTGs) installed on buses and trucks. Based on statistical correlations with traffic accidents, the “Number of Hazardous Driving Behaviors” was defined across 11 types [
28]. These 11 types encompass speeding, prolonged speeding, rapid acceleration, rapid start, rapid deceleration, sudden stop, abrupt lane change, sudden overtaking, sharp left turn, sharp right turn, and sharp U-turn.
Before commencing the analysis, data preprocessing steps were executed on the provided dataset. Two primary preprocessing techniques were applied: elimination of data with missing values and min-max data scaling.
Studies have established that a substantial proportion of missing data in an analytical dataset can adversely affect the model’s performance [
29]. Upon scrutinizing the dataset for missing values, it was noted that some data points for the Truck Traffic Ratio (TruckRatio) were absent. Conzones with missing data were excluded from the analysis, resulting in a final preprocessed dataset size of 1120. The outcomes of the basic statistical analysis of these 1120 data points are detailed in
Table 5, with the data distribution visually depicted in
Figure 1.
Furthermore, data scaling was conducted as part of the preprocessing phase. Data scaling involves normalizing the features within the dataset to improve the model’s learning speed and performance. The efficacy of machine learning algorithms can fluctuate based on whether scaling is implemented and the chosen scaling method [
30]. In this study, min-max scaling was employed, which transforms all data into a range between 0 and 1 by utilizing the minimum and maximum values. This standardization ensures that all features are within the same range, preventing any single feature from disproportionately influencing the output during the assessment of feature importance.
4. Modeling: Negative Binomial Regression Model and DNN Model with SHAP
4.1. Design of Negative Binomial Regression Model
To develop a traditional statistical model for predicting traffic accident occurrences, an appropriate methodology was selected. Based on the literature review, it is recommended to use a Poisson regression model when the data are not overdispersed, and a negative binomial regression model when overdispersion is present [
13]. The dispersion parameter was calculated using the Pearson Chi-Square statistic, and the result was approximately 1.573, indicating the presence of overdispersion in the data. Therefore, the negative binomial regression model was deemed appropriate for this study.
Traffic accidents are rare events, and many previous studies have raised concerns about the appropriateness of applying zero-inflated models to such datasets. Therefore, a preliminary analysis was conducted to verify whether zero inflation was present in the dataset before applying traditional statistical models. The results showed that zero inflation was not observed in the data, as the zero-inflation probability (p)—which indicates the likelihood of a value always being zero—was calculated to be 0. This finding suggests that a zero-inflated negative binomial model converges to a standard negative binomial model, making the NB model appropriate for this study.
4.2. Design of the DNN Model
Unlike traditional statistical models, which necessitate understanding the relationships between variables and selecting independent variables manually, DNNs can automatically identify relationships between variables within the algorithm and assign greater influence to more important variables. Therefore, the DNN model uses 12 variables, which are expected to influence the occurrence of traffic accidents, as inputs. To effectively capture the nonlinear relationships between these variables and traffic accident frequency, three Dense layers were employed. The activation function for the single output node is ReLU, chosen to effectively address the vanishing gradient problem. To prevent overfitting, a dropout rate of 0.2 was applied. The hyperparameters were tuned using a grid search, evaluating all possible combinations to determine the optimal model. This structure was designed to effectively capture the nonlinear complex relationships between the 12 accident-related variables and traffic accident occurrences.
The model consists of a total of 2561 trainable parameters, calculated as follows. The connection between the input layer and the first hidden layer includes 12 inputs multiplied by 32 neurons, plus 32 biases, resulting in 416 parameters. For the connections between the two hidden layers, each layer contains 32 neurons connected to another 32 neurons, plus 32 biases, yielding 1056 parameters per layer. Since there are two hidden layers, this amounts to 2112 parameters. Finally, the output layer contains 32 connections from the last hidden layer to a single output node, plus 1 bias, for a total of 33 parameters. When summed, the total number of trainable parameters is calculated as 416 + (1056 × 2) + 33 = 2561. This calculation is based on the connections between the layers in the model.
The model was trained using a training dataset comprising 80% of the total data, while the remaining 20% was used as an independent test dataset for evaluation. The use of a separate test dataset ensures that the model’s performance is not influenced by overfitting to the training data. The grid search method was utilized for hyperparameter optimization as it is a widely employed technique for this purpose. The method was chosen due to its exhaustive evaluation of hyperparameter combinations, ensuring optimal model performance. It explores all subsets within the given hyperparameter space in the network [
31]. In contrast to random search, grid search explores all parameter subsets, improving model performance but requiring significant computational time. The results of optimizing the model’s hyperparameters using the grid search method are presented in
Table 6.
4.3. Model Development and SHAP-Based Feature Importance Derivation
The evaluation results of the DNN model are presented in
Table 7. These metrics show that the MAE was 1.27, the MSE was 3.21, and the RMSE was 1.79. In comparison to the negative binomial regression model, the DNN model exhibited improvements across all evaluation metrics: MAE improved by 3.33%, MSE by 2.72%, and RMSE by 1.37%. These findings indicate that the DNN model surpassed the negative binomial regression model across all performance metrics.
The identification of significant variables with high importance in the DNN model involved the application of SHAP, a form of XAI. SHAP values serve as quantitative metrics that evaluate the contribution of each feature (i.e., variable) to the model’s specific predictions [
32]. For the SHAP analysis, the Kernel explainer was employed, which is model-agnostic and can be utilized regardless of the model’s internal structure. It assesses the influence of each feature on the predictions through feature sampling [
25].
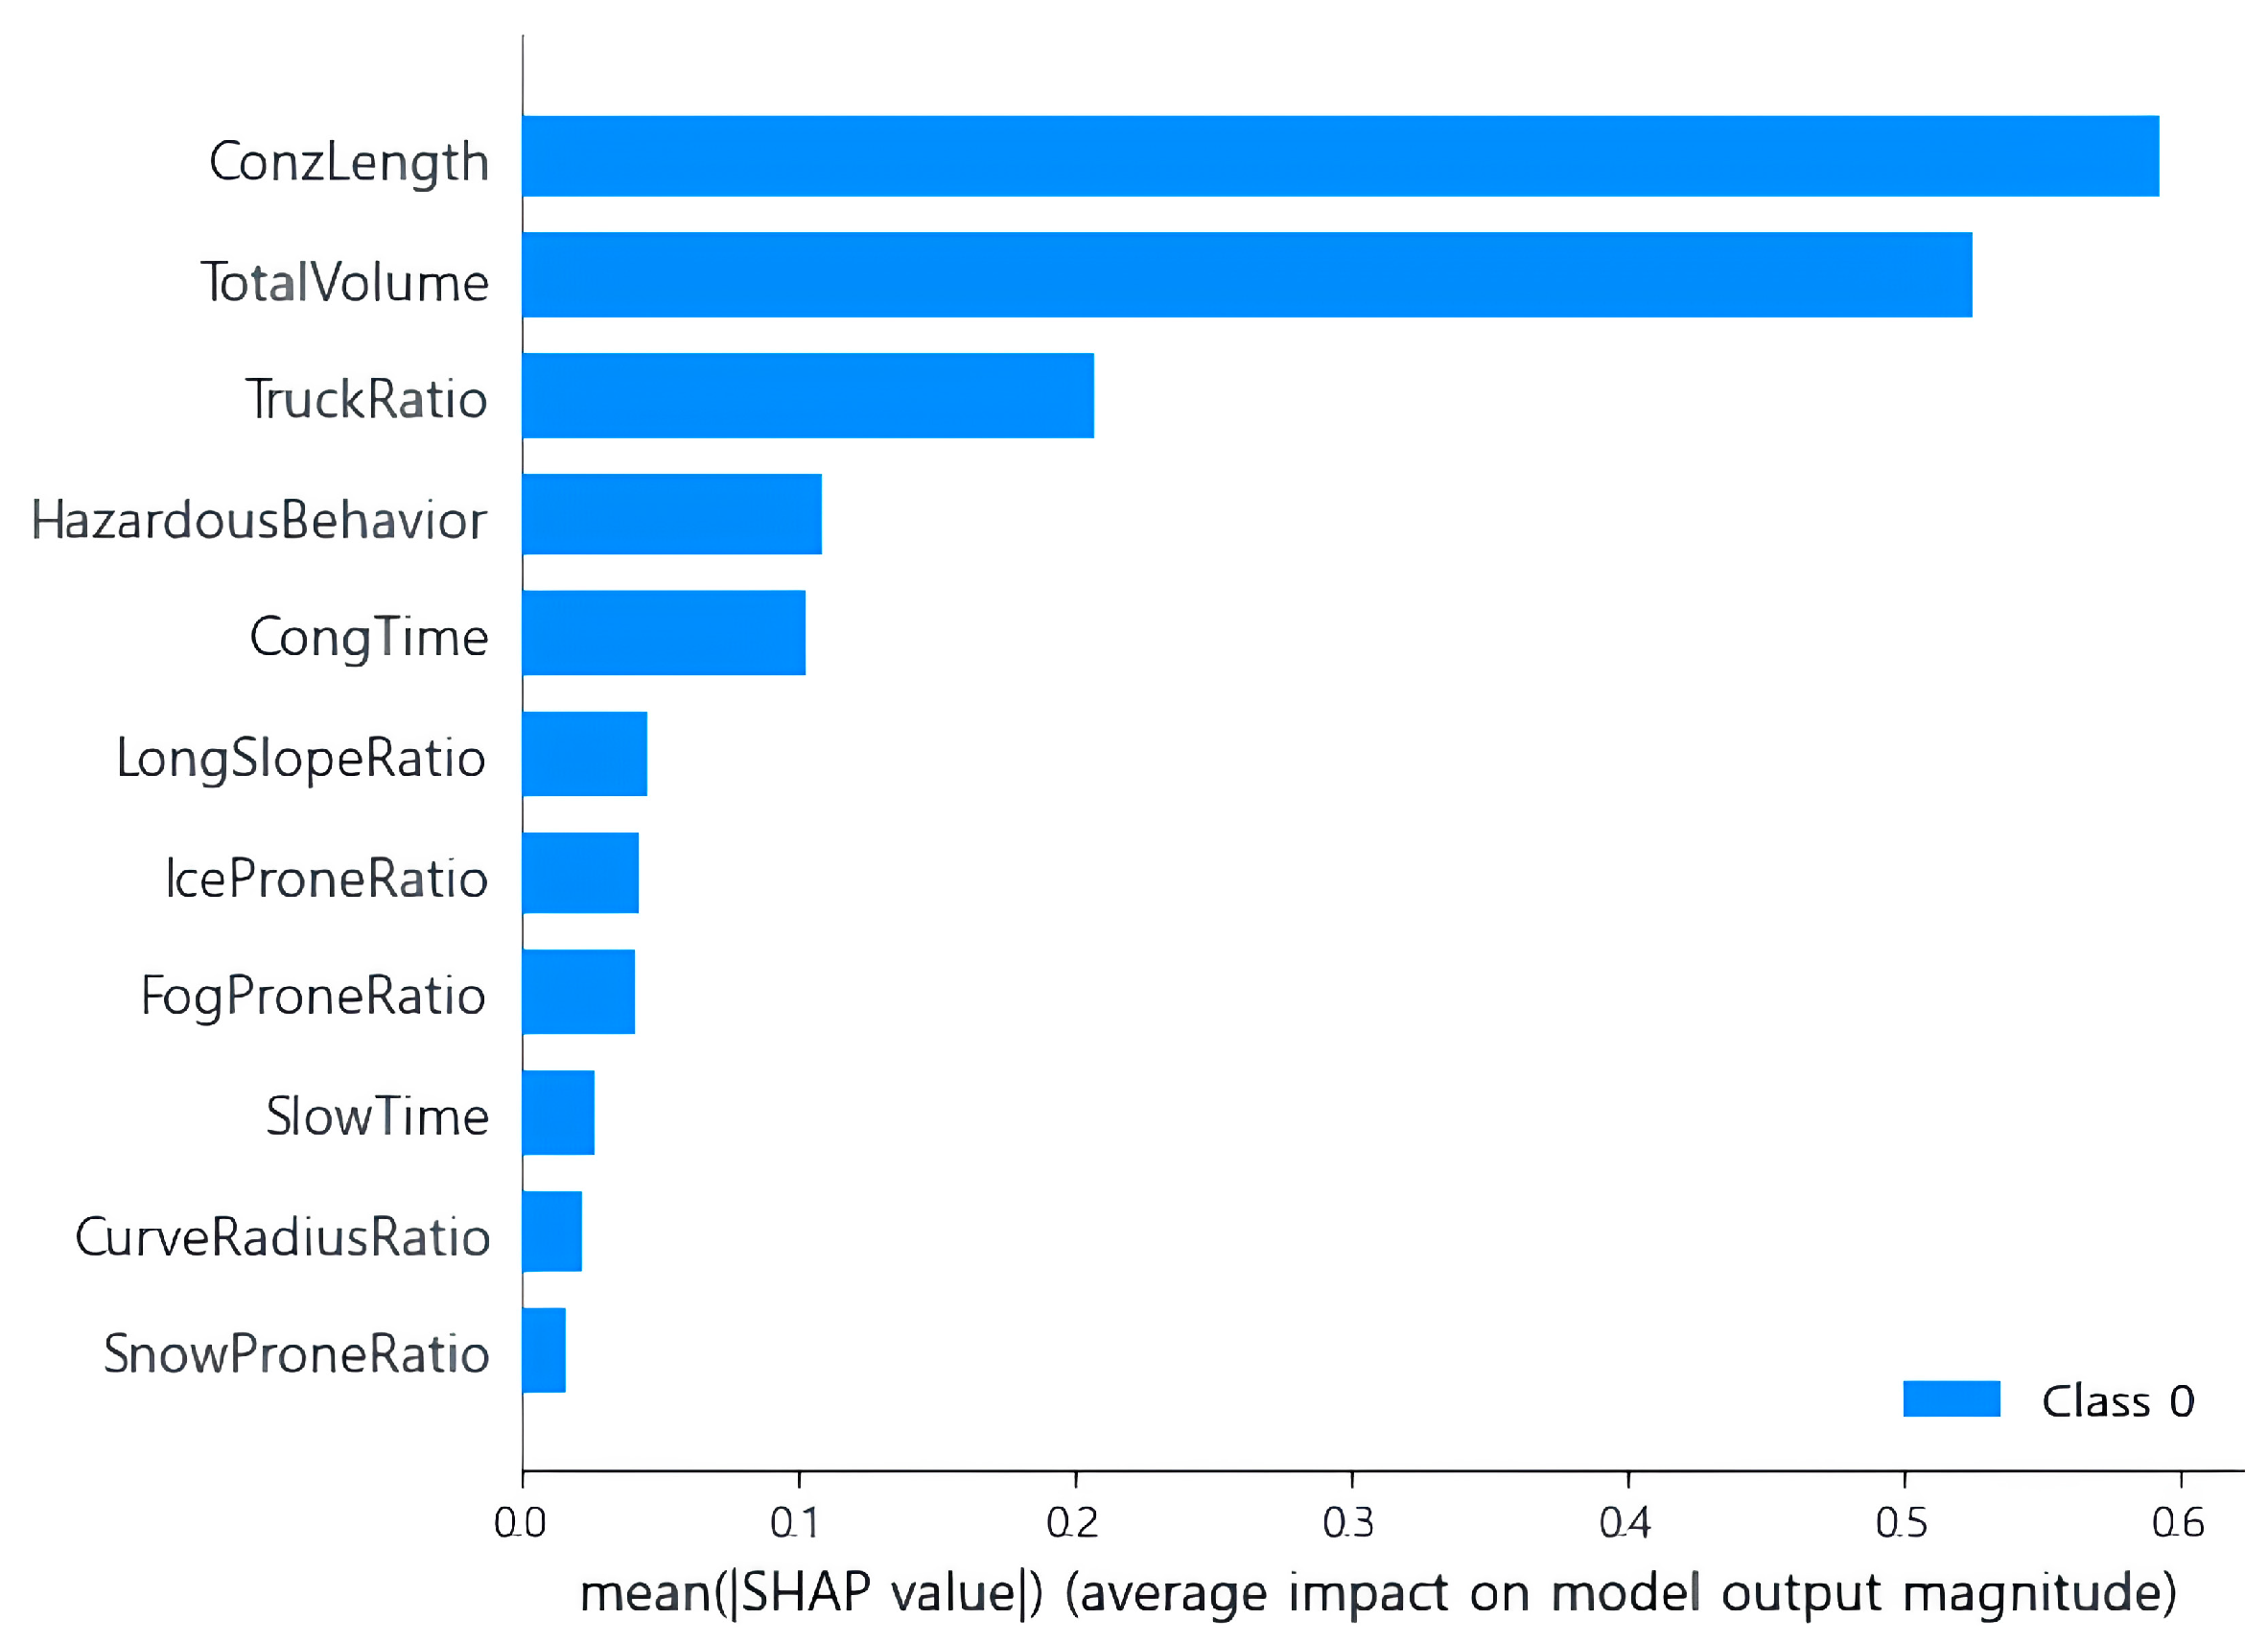
A bar plot illustrating the global explanation derived from SHAP values is depicted in
Figure 2. This bar plot showcases the mean absolute SHAP values for each feature, highlighting the overall contribution of each feature to the model’s predictions across the entire dataset. Features ranked higher in the bar plot have a stronger influence on the model’s predictions [
33]. The analysis of the bar plot reveals that Conzone Length (ConzLength) has the most significant impact on accident frequency, followed by Total Traffic Volume (TotalVolume), Truck Traffic Ratio (TruckRatio), Number of Hazardous Driving Behaviors (HazardousBehavior), and Congestion Duration (CongTime).
A beeswarm plot was created in addition to the bar plot to delve deeper into the model’s estimation algorithm and gain a more comprehensive understanding [
34]. This beeswarm plot, providing both global explanations and local data point information, is depicted in
Figure 3. It visualizes the distribution of SHAP values for each feature, with each data point representing the SHAP value for an individual data point. The positioning of points along the x-axis is based on the magnitude of their SHAP value, where positive SHAP values contribute to an increase in the estimate and negative SHAP values contribute to a decrease. A wider distribution indicates a greater variance in the feature’s influence across different data points. Furthermore, the color of each point corresponds to the value of the feature, with red denoting higher values and blue denoting lower values. Therefore, a preponderance of red points at positive SHAP values suggests that higher feature values increase the estimate, while blue points at positive SHAP values indicate that lower feature values lead to an increase in the estimate. This plot provides a granular view of how each feature impacts the model’s predictions on both a global and local scale.
Consistent with the bar plot findings, Conzone Length (ConzLength) and Total Traffic Volume (TotalVolume) exhibited the most substantial influence on traffic accident frequency, followed by Truck Traffic Ratio (TruckRatio), Number of Hazardous Driving Behaviors (HazardousBehavior), and Congestion Duration (CongTime), which demonstrated similar levels of influence. In the beeswarm plot, for variables such as Conzone Length (ConzLength), Total Traffic Volume (TotalVolume), Truck Traffic Ratio (TruckRatio), and Number of Hazardous Driving Behaviors (HazardousBehavior), red data points were predominantly distributed in the positive SHAP value range. This signifies that as the values of these features increase, the frequency of traffic accidents also increases. Conversely, for Congestion Duration (CongTime), blue data points were observed in the positive SHAP value range, suggesting that an increase in congestion time leads to a decrease in accident frequency. This occurrence can be attributed to the reduced risk of accidents during congestion, where traffic typically moves at speeds below 40 km/h, resulting in fewer instances of speeding and rapid responses to changing road conditions. The remaining six features, including Ice-Prone Section Ratio (IceProneRatio), showed minimal non-zero occurrences, leading to a negligible influence on the estimates.
5. Comparison of Statistically Significant Variables
The significant variables identified by developing the negative binomial regression model at a 95% confidence interval were compared with the important features identified through the SHAP analysis of the DNN model. The comparison results are presented in
Table 8. Commonly selected features by both models included Truck Traffic Ratio (TruckRatio), Congestion Duration (CongTime), Number of Hazardous Driving Behaviors (HazardousBehavior), Conzone Length (ConzLength), and Total Traffic Volume (TotalVolume). There was substantial overlap in the significant features chosen by each model, and they showed consistent directional influences (+/−) on the frequency of traffic accidents. This alignment indicates that the features were appropriately selected and are robust predictors of traffic accident frequency.
This study investigated the consistency of variables significantly impacting traffic accident frequency estimates by employing the traditional statistical model, negative binomial regression, and the DNN model. Despite the disparate nature and features of these models, the consistent identification of important variables indicates the robust impact of these selected variables on traffic accident frequency. This emphasizes their crucial role in traffic safety analysis. Furthermore, incorporating these selected variables can lead to the development and refinement of more accurate models for predicting traffic accidents. Lastly, the consistent presence of high-feature importance variables across multiple models suggests that these findings may enhance the applicability of the models to diverse regions.
In addition, the analysis identified five significant factors: Truck Traffic Ratio (TruckRatio), Congestion Duration (CongTime), Number of Hazardous Driving Behaviors (HazardousBehavior), Conzone Length (ConzLength), and Total Traffic Volume (TotalVolume). Among these, Conzone Length (ConzLength) and Total Traffic Volume (TotalVolume) have been commonly confirmed in other studies as having a direct effect on the frequency of traffic accidents on motorways. In this study, in addition to those two factors, Truck Traffic Ratio (TruckRatio), Congestion Duration (CongTime), and Number of Hazardous Driving Behaviors (HazardousBehavior) were also confirmed as important factors. Therefore, in order to reduce traffic accidents on motorways, it is necessary to manage truck traffic. In addition, it was confirmed that traffic accidents can be reduced by reducing the dangerous driving behaviors of vehicles driving on motorways. Finally, since congestion was confirmed to be the main cause of traffic accidents, it was confirmed that efforts to alleviate congestion may enhance roadway safety.
6. Conclusions
This study aimed to estimate traffic accident frequency and identify and assess the consistency of significant variables across different models. To achieve this, both an AI-based model (DNN) and a traditional statistical model (negative binomial) were employed to identify and analyze key factors influencing traffic accident frequency. In particular, the DNN model was enhanced with the XAI methodology SHAP to improve interpretability. The analysis utilized data on traffic accident frequency per conzone on South Korean motorways, along with 12 influencing factors.
The DNN model identified five significant factors, including Truck Traffic Ratio (TruckRatio), Congestion Duration (CongTime), Number of Hazardous Driving Behaviors (HazardousBehavior), Conzone Length (ConzLength), and Total Traffic Volume (TotalVolume). Notably, significant variables were selected using p-values and confidence intervals in the statistical model, while the DNN model identified them using SHAP-derived feature importance. This finding confirms that key factors with significant impacts on traffic accident frequency consistently emerge regardless of model type.
For future motorway traffic accident frequency estimation models, these five key variables should be integrated, while additional variables could be tailored to road characteristics, data properties, and model types. This streamlined approach could enhance resource efficiency in model development. In this study, the proportion of truck traffic, the number of dangerous driving behaviors, and the duration of congestion were confirmed as important factors. It is believed that if these factors are well-managed, the frequency of traffic accidents on highways can be effectively reduced. This study addresses the gap between traditional statistical methods and AI-based approaches, offering a precedent for applying XAI in the field of traffic safety. These contributions serve as a foundation for implementing measures to enhance motorway safety by preventing traffic accidents.
The main contributions of this study are as follows. One major distinction of this study lies in the utilization of diverse and unique data. Traffic accidents are caused by a wide range of factors, including human factors, road characteristics, and environmental conditions. While previous studies have typically used common variables such as age, gender, road geometry, and weather conditions to predict traffic accidents, this study incorporates additional variables that provide more precise insights into accident characteristics. Examples of road environment characteristics include Fog/Ice/Snow-Prone Section Ratios, which not only consider weather conditions (e.g., snow, rain, and fog) but also indicate the proportion of road sections prone to such conditions, thereby integrating geometric and weather-related factors. For traffic behavior characteristics, this study includes variables such as the Number of Hazardous Driving Behaviors, which reflect actual driving behaviors (e.g., risky driving) that are closely related to traffic accidents. These innovative variables, rarely used in prior research, enhance the precision and depth of traffic accident analysis. Another key contribution of this study is its methodological approach.
Unlike prior studies that typically use a single modeling approach to identify significant variables, this study evaluates the consistency of significant variables identified by traditional statistical models and AI-based models. Furthermore, to ensure sufficient predictive performance and interpretability, this study integrates XAI (SHAP) into the AI-based model to overcome the black box limitations commonly associated with such models. This dual approach emphasizes the robustness of the key influencing variables regardless of the model type, thereby providing a stronger foundation for traffic accident analysis.
The consistent key influencing factors identified in this study can be utilized in several ways to improve motorway safety. First, these factors can guide the prioritization of infrastructure and traffic flow improvements in high-risk road segments. By identifying and targeting road sections that are determined to be high-risk based on these factors, priority safety measures can be implemented to mitigate potential accidents effectively. In addition, this study highlights Hazardous Driving Behaviors as one of the most significant contributors to traffic accidents. The findings can inform the development of strategies to mitigate such behaviors. For example, enforcement equipment specifically designed to monitor and prevent Hazardous Driving Behaviors can be deployed to reduce the likelihood of these incidents. Furthermore, educational campaigns can be launched to raise awareness among drivers about the risks associated with Hazardous Driving Behaviors, further contributing to enhanced motorway safety. By implementing these targeted interventions, the frequency of traffic accidents can be significantly reduced, contributing to safer road conditions for all road users.
The primary goal of this study is to enhance motorway traffic safety by identifying and verifying factors that significantly influence traffic accident occurrences through the comparison of multiple methodologies. However, there are areas where methodological improvements could be considered. The models used in this study lack real-time applicability. For instance, variables such as Total Traffic Volume and Frequency of Traffic Accidents were derived from annual data. While this was due to limitations in computing resources and data availability, incorporating additional real-time monitoring data sources could improve the real-time applicability of the models. Additionally, this study could be further enhanced by expanding the types of AI methodologies used. For example, applying ensemble methods such as Random Forests or Gradient Boosting could improve the applicability of the analysis results to broader contexts. These advanced methods may also capture complex relationships among variables more effectively. Moreover, while this study focused on analyzing motorways in South Korea, future research could be expanded to include the entire national road network or international roads to gain broader insights.


