Article

Ionic Character and Alkyl Chain Length of Surfactants Affect Titanium Dioxide Dispersion and Its UV-Blocking Efficacy

by
Jaehun Mun
,
Yeji Jeon
,
Suhui Jeong
,
Jeong Min Lim
,
Yeojin Kim
,
Hwain Myeong
,
Jeongwoo Han
,
Youngwoo Choi
,
Seong-Min Jo
,
Seung Yun Yang
,
Beum-Soo An
,
Dae Youn Hwang
and
Sungbaek Seo
*
Department of Biomaterials Science (BK21 FOUR Program), College of Natural Resources and Life Science/Life and Industry Convergence Research Institute, Pusan National University, Miryang 50463, Republic of Korea
*
Author to whom correspondence should be addressed.
Appl. Sci. 2024, 14(23), 11035; https://doi.org/10.3390/app142311035
Submission received: 14 October 2024 / Revised: 22 November 2024 / Accepted: 26 November 2024 / Published: 27 November 2024
(This article belongs to the Special Issue Titania Surface Modification: Theory, Methods, and Applications)

Abstract

:
The dispersion of titanium dioxide (TiO2) determines the performance of TiO2-based formulations in cosmetic and coating applications. In particular, the chemical and structural characteristics of the surfactants used to prepare TiO2 dispersions are significant. However, the influence of surfactants on TiO2 dispersion quality has not been systematically investigated. In this study, we observed the effects of the ionic character of commercial surfactants on the dispersion stability and UV-blocking efficacy of TiO2. Among the experimental surfactant groups, anionic sodium dodecyl sulfate was efficient in stabilizing TiO2 as a water-in-oil formulation and enhancing its UV-blocking efficacy. Furthermore, an anionic fatty acid as a surfactant with a longer alkyl chain length was sufficient to stabilize the TiO2 formulation, which also displayed the highest UV-blocking efficacy, comparable to the values of commercial TiO2-based cosmetic products.

1. Introduction

Cosmetics or coating formulations consist of inorganic and organic compounds, among which titanium dioxide (TiO2) is commonly used as an inorganic pigment or filler. As TiO2 scatters or blocks ultraviolet (UV) rays by remaining on the skin or substrate surface, TiO2-based formulations have been widely used as sunscreen-functioning products. Moreover, TiO2 is less irritating to the skin than organic compounds, such as avobenzone, and cosmetic products containing TiO2 have been used for sensitive or infant skin [1,2].
In TiO2-based formulations, the UV ray blocking depends on the stability of the TiO2 dispersion [3,4]. TiO2 particles generally aggregate in media owing to the van der Waals forces between the particles. This aggregation behavior prevents the particles from spreading evenly in the dispersion, thus reducing the UV-blocking efficacy [5]. As a strategy to enable particles to move far apart, adding a surfactant or dispersant is required to reduce the aggregation behavior, reaching a suitable rheological or light scattering property of the particle dispersions for practical usage. For example, through the adsorption of ionic surfactants or dispersants on the surface of particles, an electrical double layer is formed at the solid–liquid interface, and electrical repulsion prevents aggregation [6,7]. Alternatively, the steric hindrance of the adsorbed polymeric dispersant inhibits the aggregation of TiO2 particles [8,9,10].
With regard to polymer adsorption on TiO2 particles, Lunn et al. revealed the effect of the architectural dispersant structure of poly(acrylic acid) (PAA) on the degree of TiO2 dispersion quality [11]. The polymers were synthesized in linear, single-branched, short-armed combs, long-armed combs, and star architectures. The relationship between the degree of dispersion and the dispersant structural architecture was investigated, and it was concluded that linear PAA was the most effective for TiO2 adsorption and dispersion. Accordingly, the effect of the chemical structure of the surfactant or dispersant on the dispersion quality of TiO2 is important for the interpretation and designing of TiO2-based formulations.
Herein, we investigated the effect of the ionic character of a surfactant on the dispersion stability, viscosity, morphological characterization, and UV-blocking efficacy of a TiO2 water-in-oil (W/O) formulation. We interpreted the correlation between the dispersion stability and UV-blocking efficacy. We further investigated the effect of the alkyl chain length of the anionic fatty acid used as a surfactant on the TiO2 dispersion performance, based on stability, viscosity, and UV-blocking efficacy.

2. Materials and Methods

2.1. Materials

DC345 (cyclomethicone) and CEH (cetyl ethylhexanoate) were purchased from Cosnet (Seoul, Republic of Korea). Sodium dodecyl sulfate (SDS) was purchased from Duksan Reagents (Ansan, Republic of Korea). Titanium oxide (TiO2; rutile, 98%) and cetyltrimethylammonium bromide (CTAB) were purchased from Daejung Chemicals and Metals (Siheung, Republic of Korea). N-Dodecyl-N,N-dimethyl-3-ammonio-1-propanesulfonate (DDAPS) was purchased from Thermo Fisher Scientific (Waltham, MA, USA). Polyoxyethylene (20) and sorbitan monolaurate (Tween 20) were purchased from Tokyo Chemical Industry (Tokyo, Japan). Rhodamine 6G (R6G), sodium hexanoic acid (fatty acid with six carbons; FA-C6), sodium lauric acid (fatty acid with twelve carbons; FA-C12), sodium stearic acid (fatty acid with eighteen carbons; FA-C18), and sodium oleic acid (unsaturated fatty acid with eighteen carbons; FA-unC18) were purchased from Sigma-Aldrich (St. Louis, MO, USA). All chemicals were used as received.

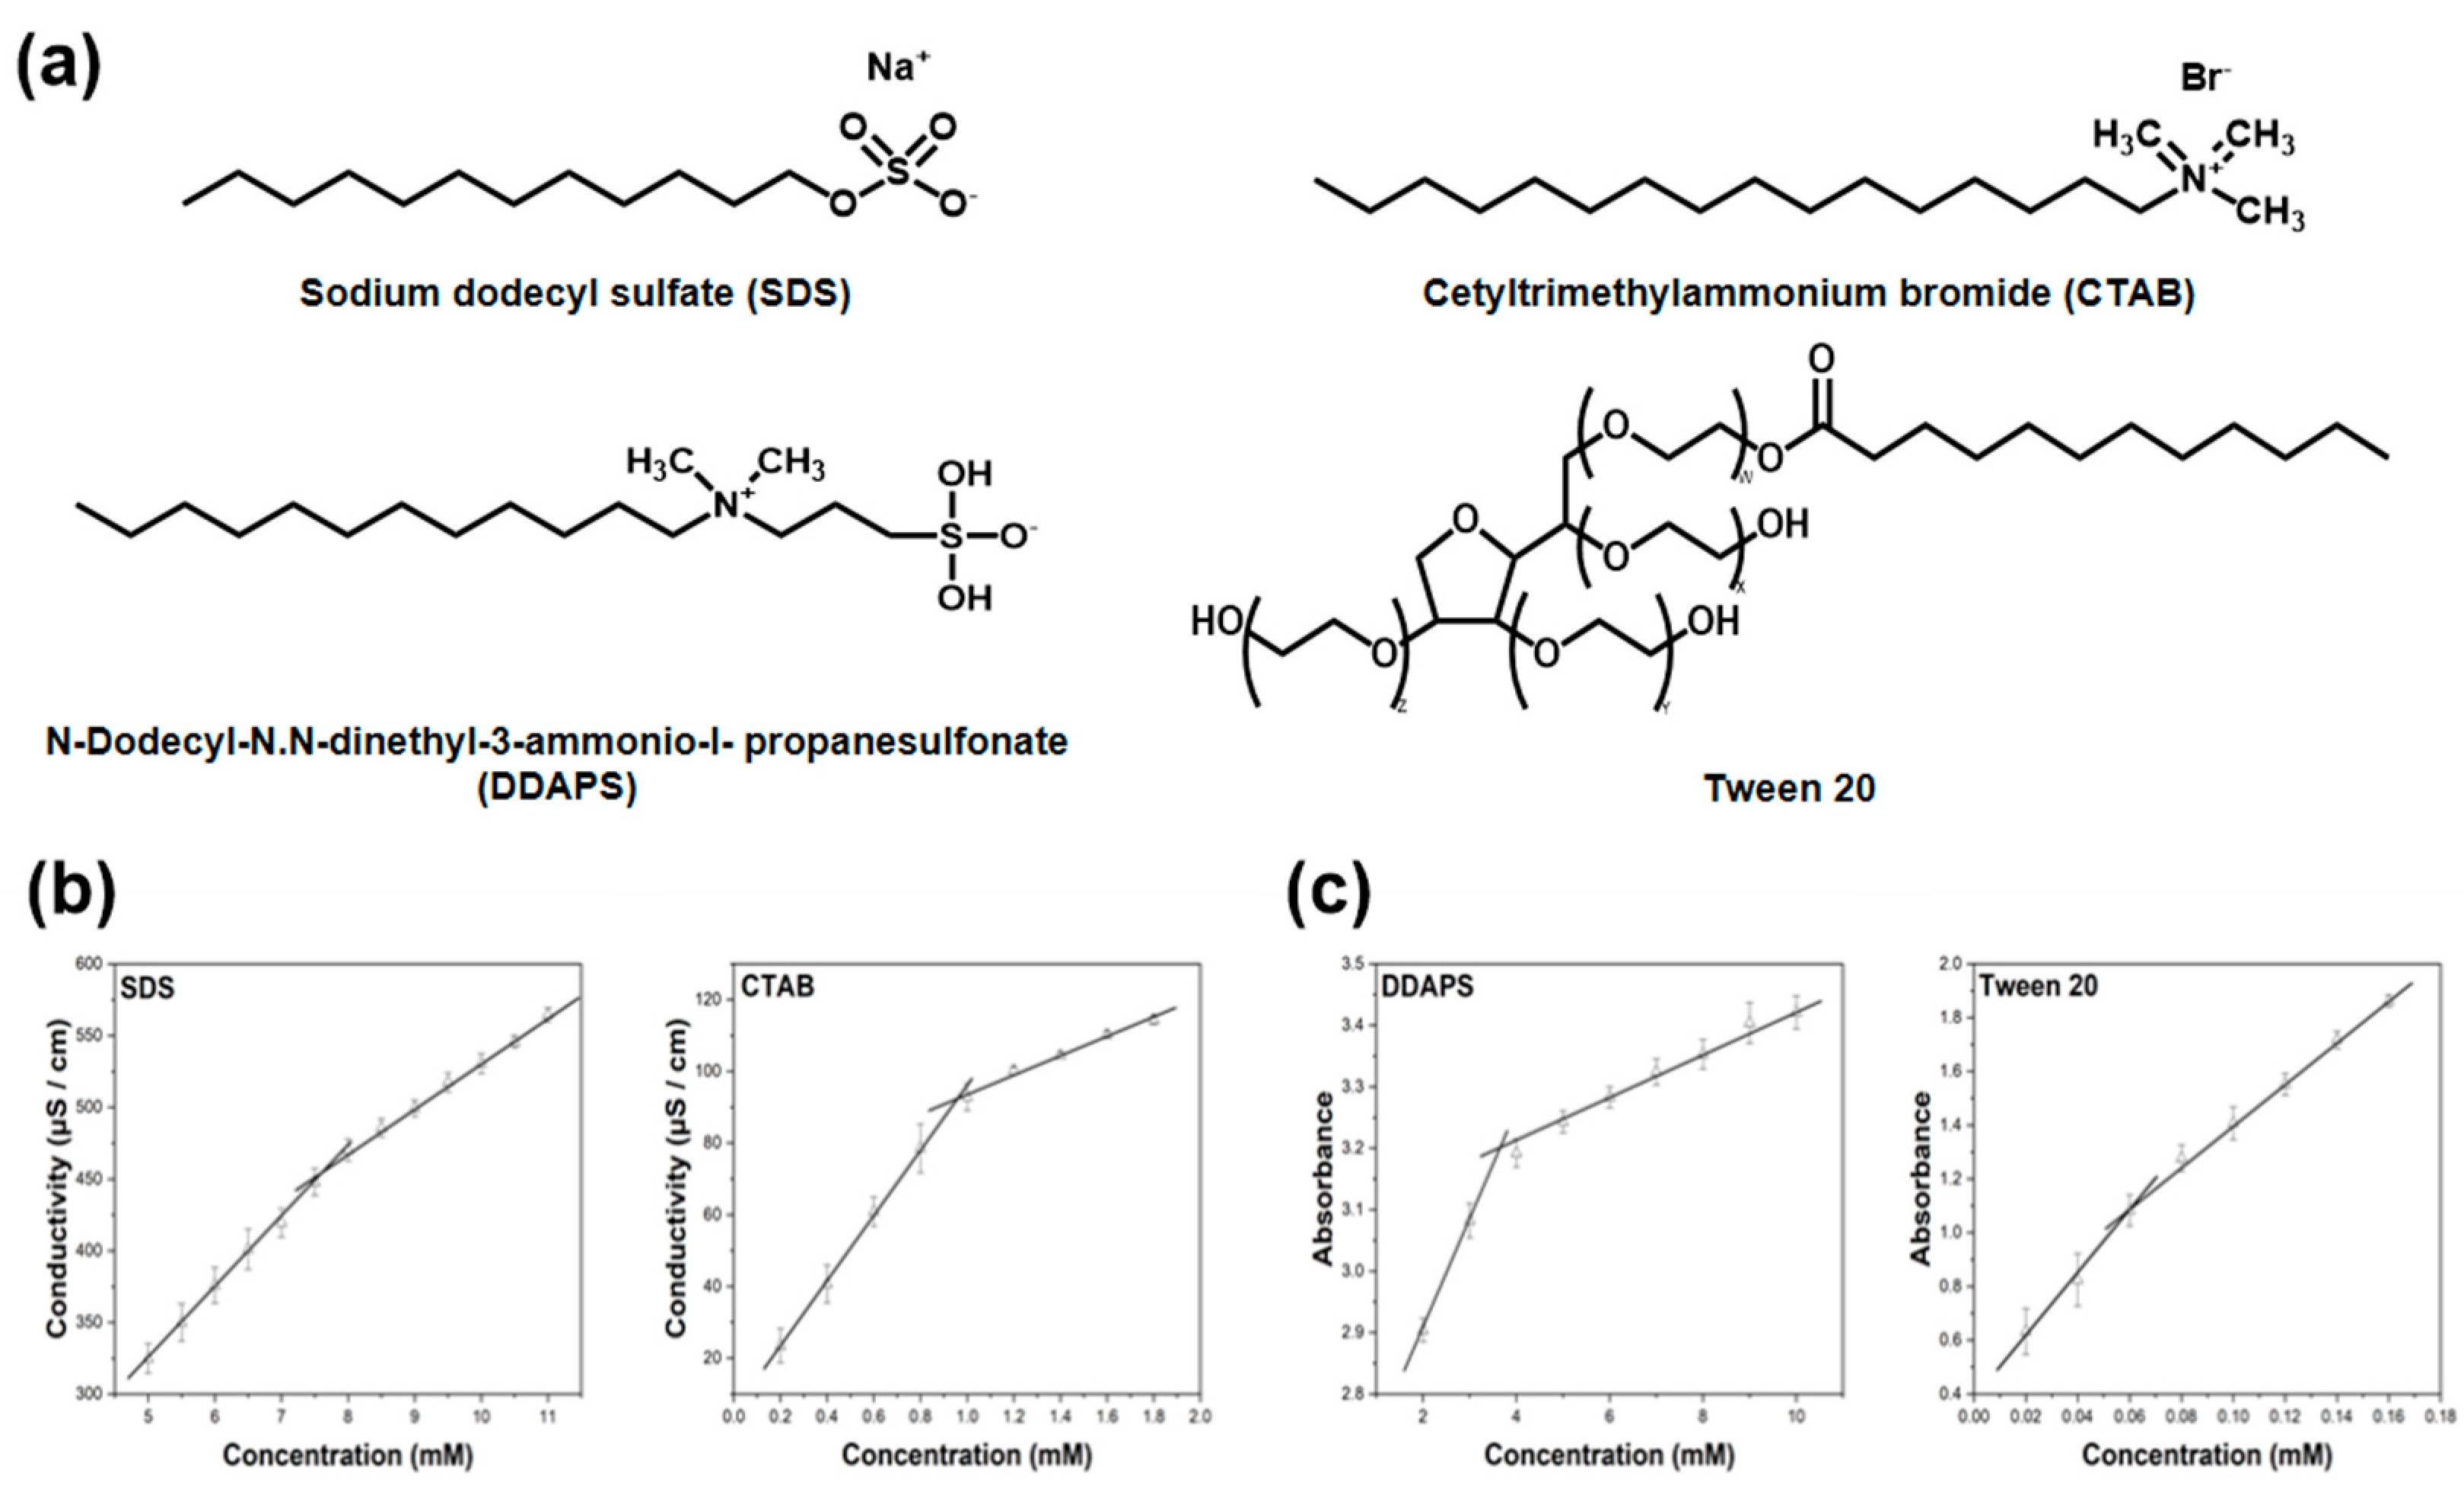
2.2. Determination of Critical Micelle Concentration (CMC)

The CMC of the surfactants was determined by measuring the concentration-dependent conductivity using a conductivity meter (Orion StarTM A212, Thermo Fisher Scientific, Waltham, MA, USA; the resolution of the conductivity meter is 0.001 μS). The conductivity of surfactants (SDS, CTAB, DDPAS, and Tween 20) or fatty acid (FA-C6, FA-C12, FA-C18, FA-unC18) aqueous solutions was measured at room temperature (24 ± 2 °C). As per another CMC determination from a previous study [12], UV-Vis absorption spectra and intensity (at 540 nm) were measured by using a microplate reader (VarioskanTM LUX Multimode, Thermo Fisher Scientific, Waltham, MA, USA; the resolution of the reader is 0.003 Abs). The absorbance of the surfactant (SDS, CTAB, DDPAS, and Tween 20) or fatty acid (FA-C6, FA-C12, FA-C18, and FA-unC18) aqueous solutions mixed with R6G was measured at room temperature.

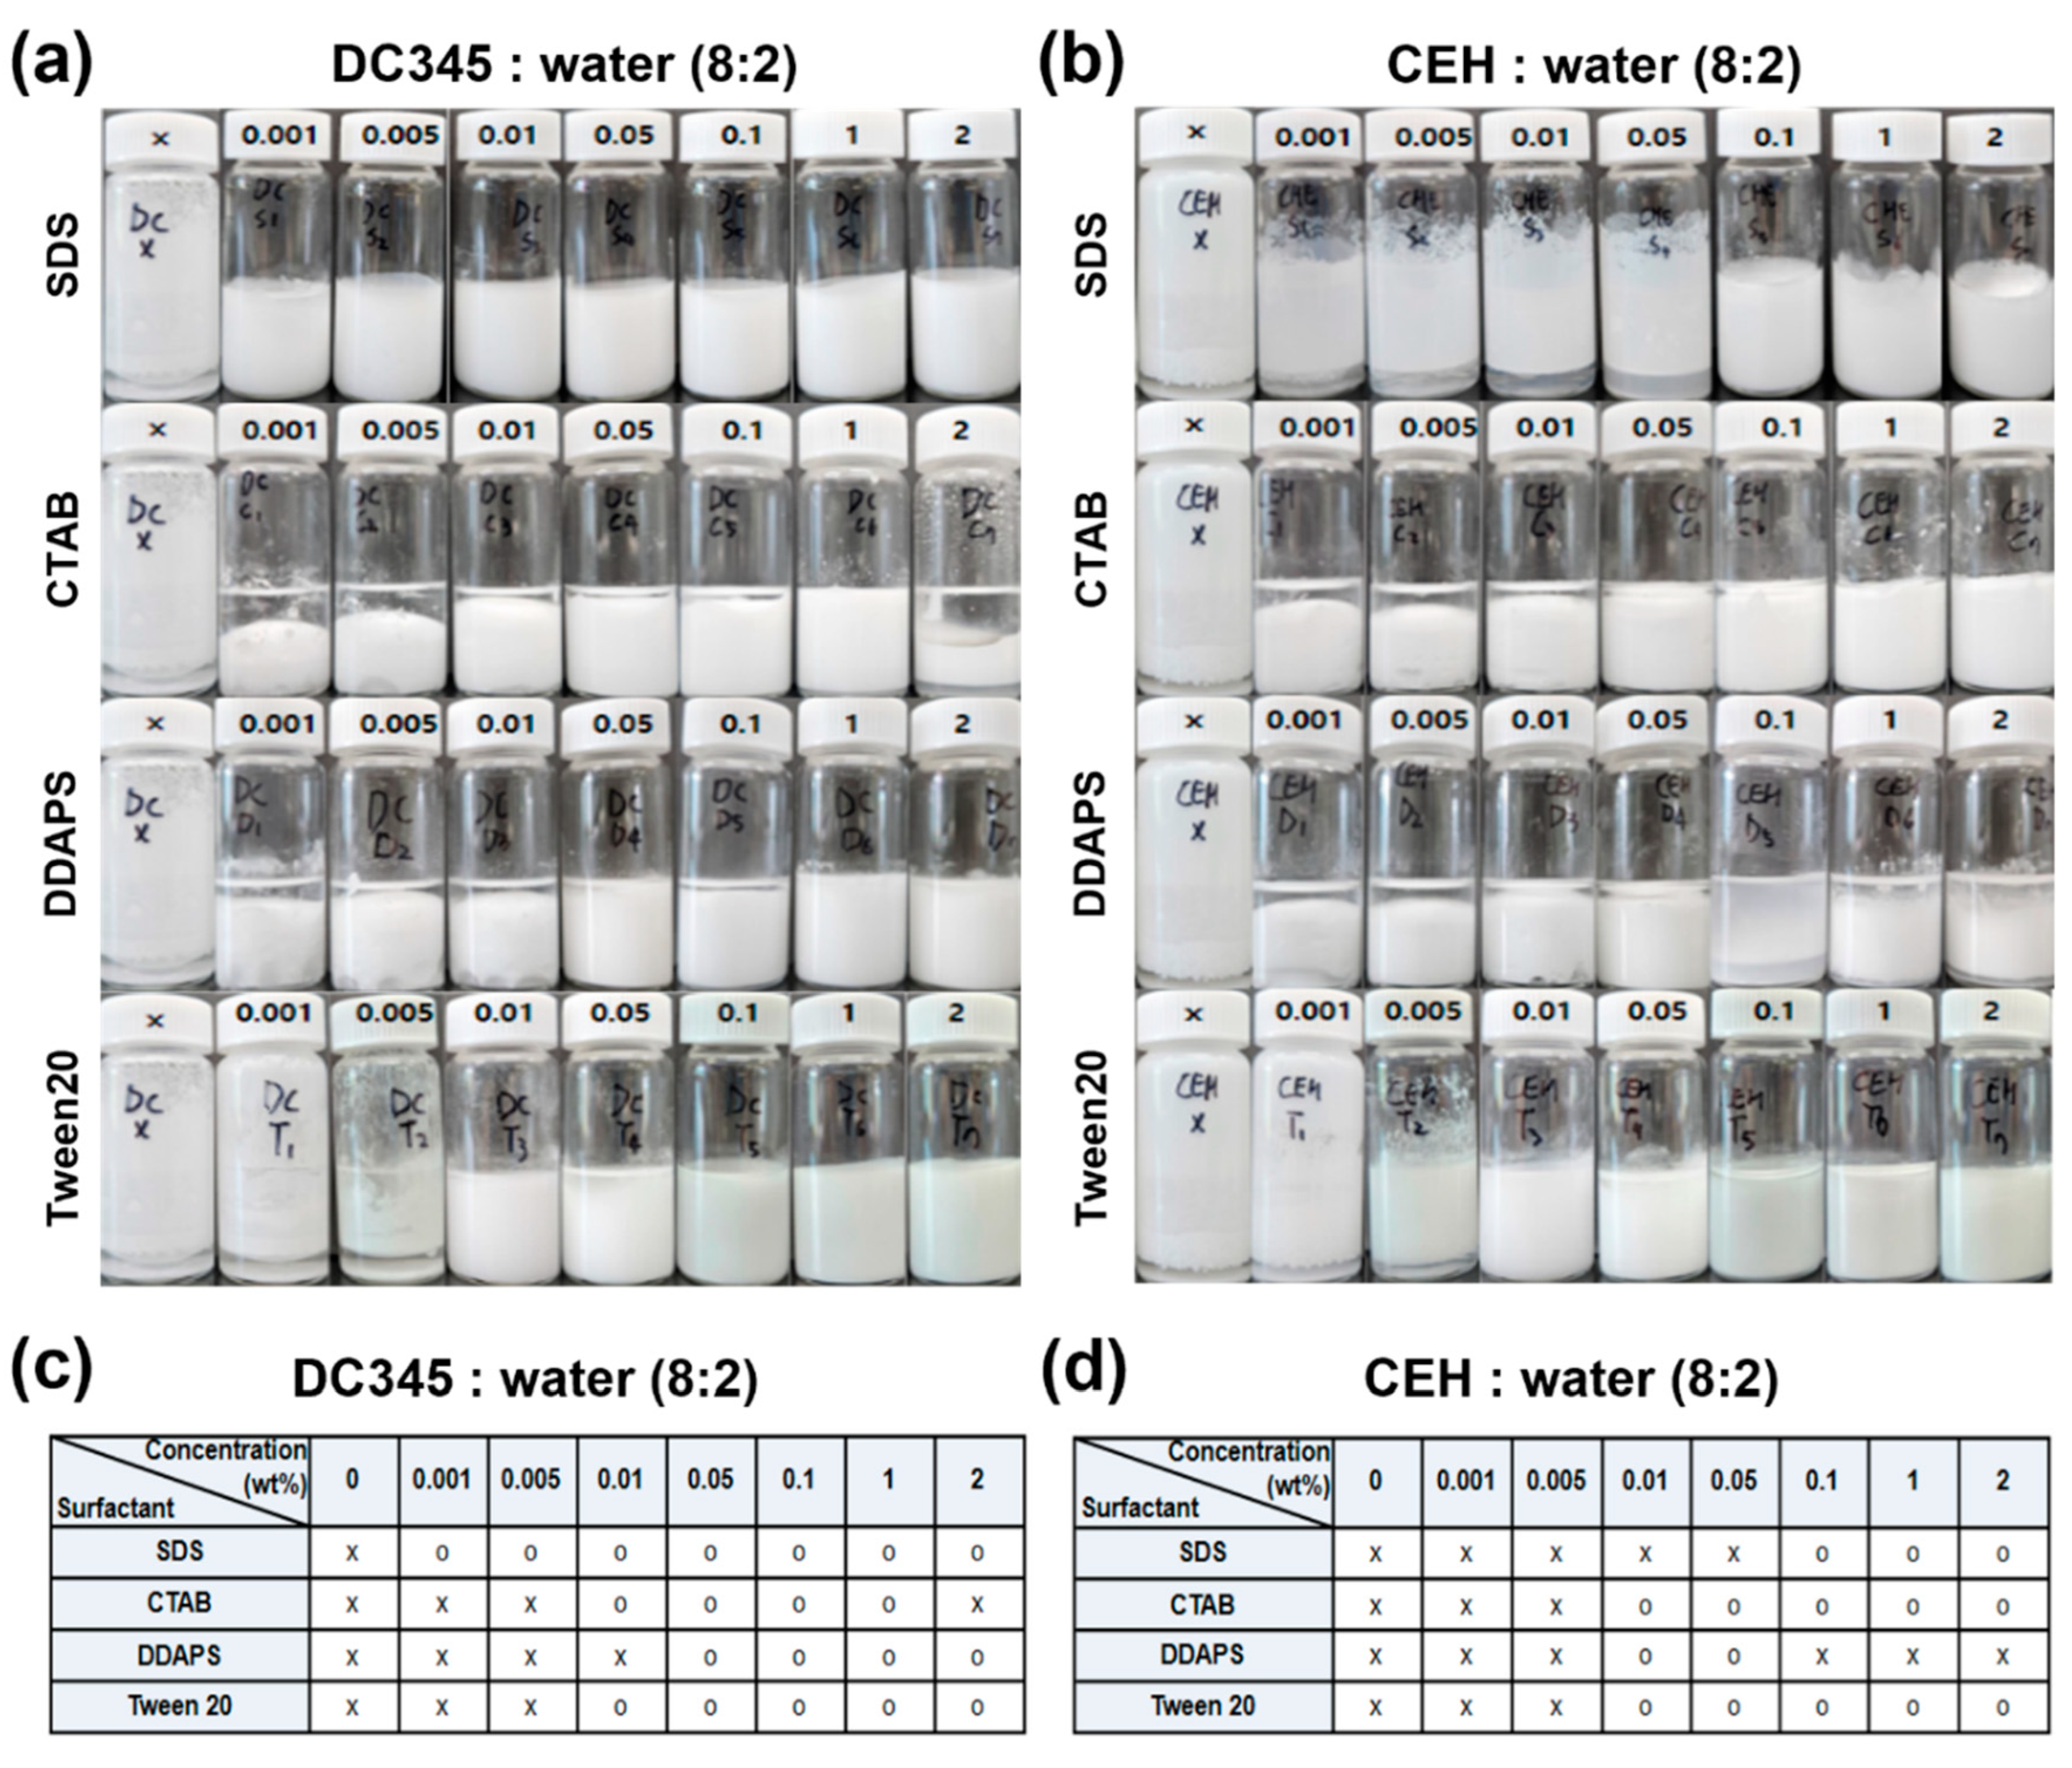
2.3. Preparation of TiO2 Dispersion in W/O Formulation

A two-phase liquid of oil and deionized water (water), that is, DC345: water (8:2) and CEH: water (8:2), were poured into 20 mL vials, respectively. In each co-solvent, TiO2 powder was weighted using an analytical balance (LA204, Mettler Toledo, Columbus, OH, USA; the resolution of balance is 160 mg) and added to make a fixed concentration (0.1 wt% TiO2). Surfactants (SDS, CTAB, DDPAS, and Tween 20) or fatty acids (FA-C6, FA-C12, FA-C18, FA-unC18) were added to produce a final concentration (0.001–2 wt% surfactant or fatty acid). The suspension was then homogenized at 10,000 rpm for 5 min (T25 Digital Ultra Turrax; IKA, Staufen im Breisgau, Baden Wurttemberg, Germany). The phase behavior of the dispersion was captured using a smartphone (Samsung Galaxy S23, Samsung Electronics, Suwon, Republic of Korea), and the stability of the dispersion was quantified using the ratio of the single-phase dispersion (ratio of the height of the single-phase dispersion to the height of the initial TiO2 suspension) [13].

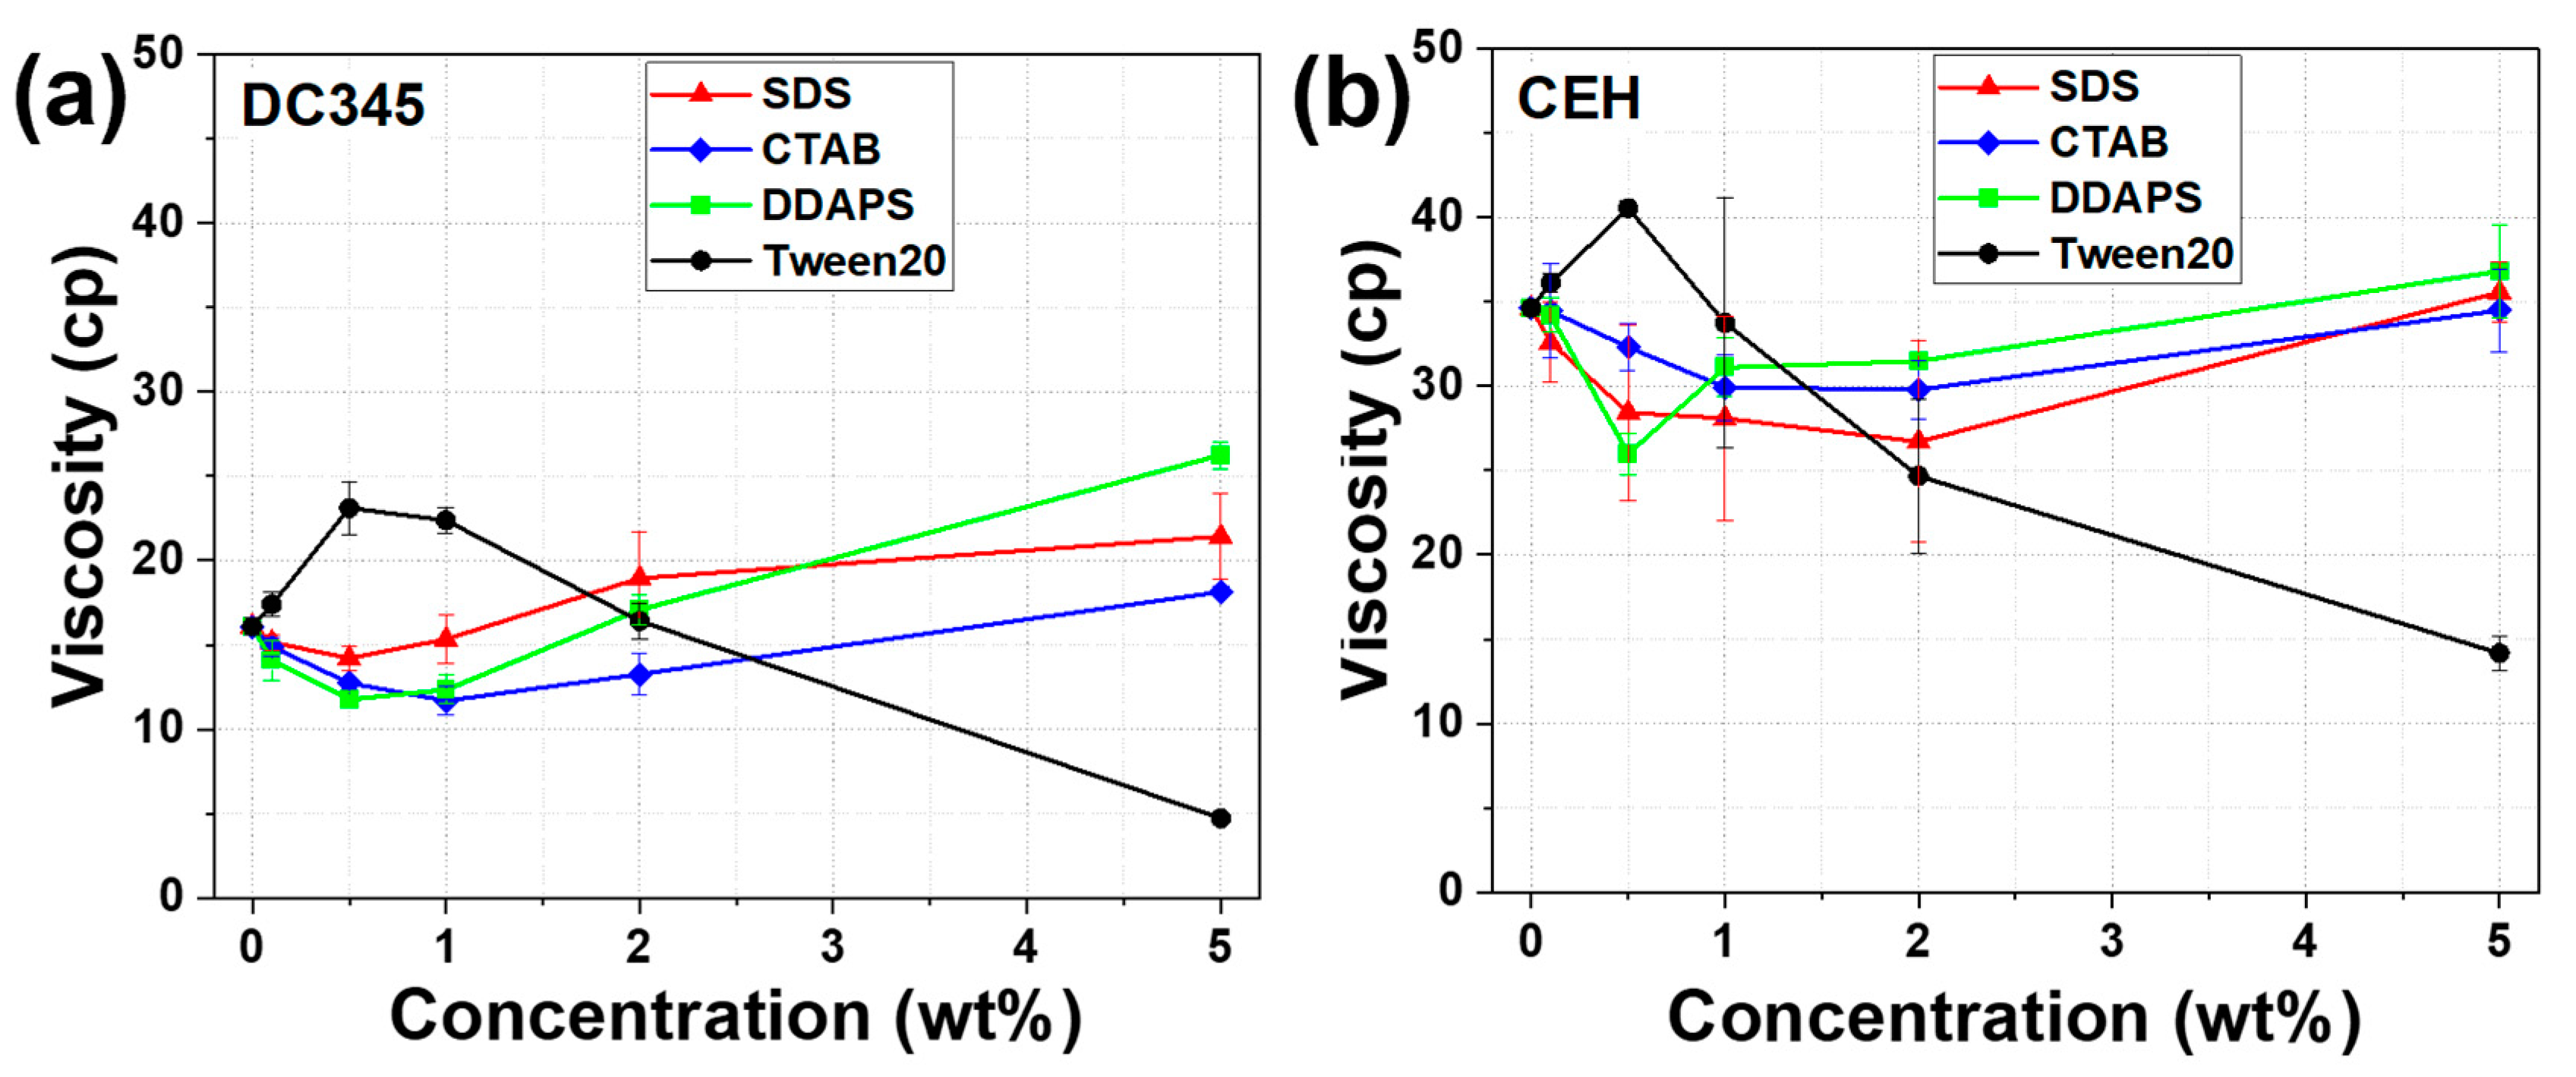
2.4. Viscosity Measurement of TiO2 Dispersion

DC345 (10 mL) and CEH (10 mL) were poured into 20 mL vials. In each oil, TiO2 powder was added to make a fixed concentration (1 wt% TiO2), and surfactants (SDS, CTAB, DDPAS, and Tween 20) or fatty acid (FA-C6, FA-C12, FA-C18, FA-unC18) was added to produce the final concentration (0.1–5 wt% surfactant or fatty acid). The suspension was homogenized at 10,000 rpm for 5 min. The viscosity of the dispersion was measured using a rheometer (DVNext Cone/Plate Rheometer with a CP-42 spindle; Ametek Brookfield, Middleborough, MA, USA) at 2 rpm or 10 rpm for 5 min.

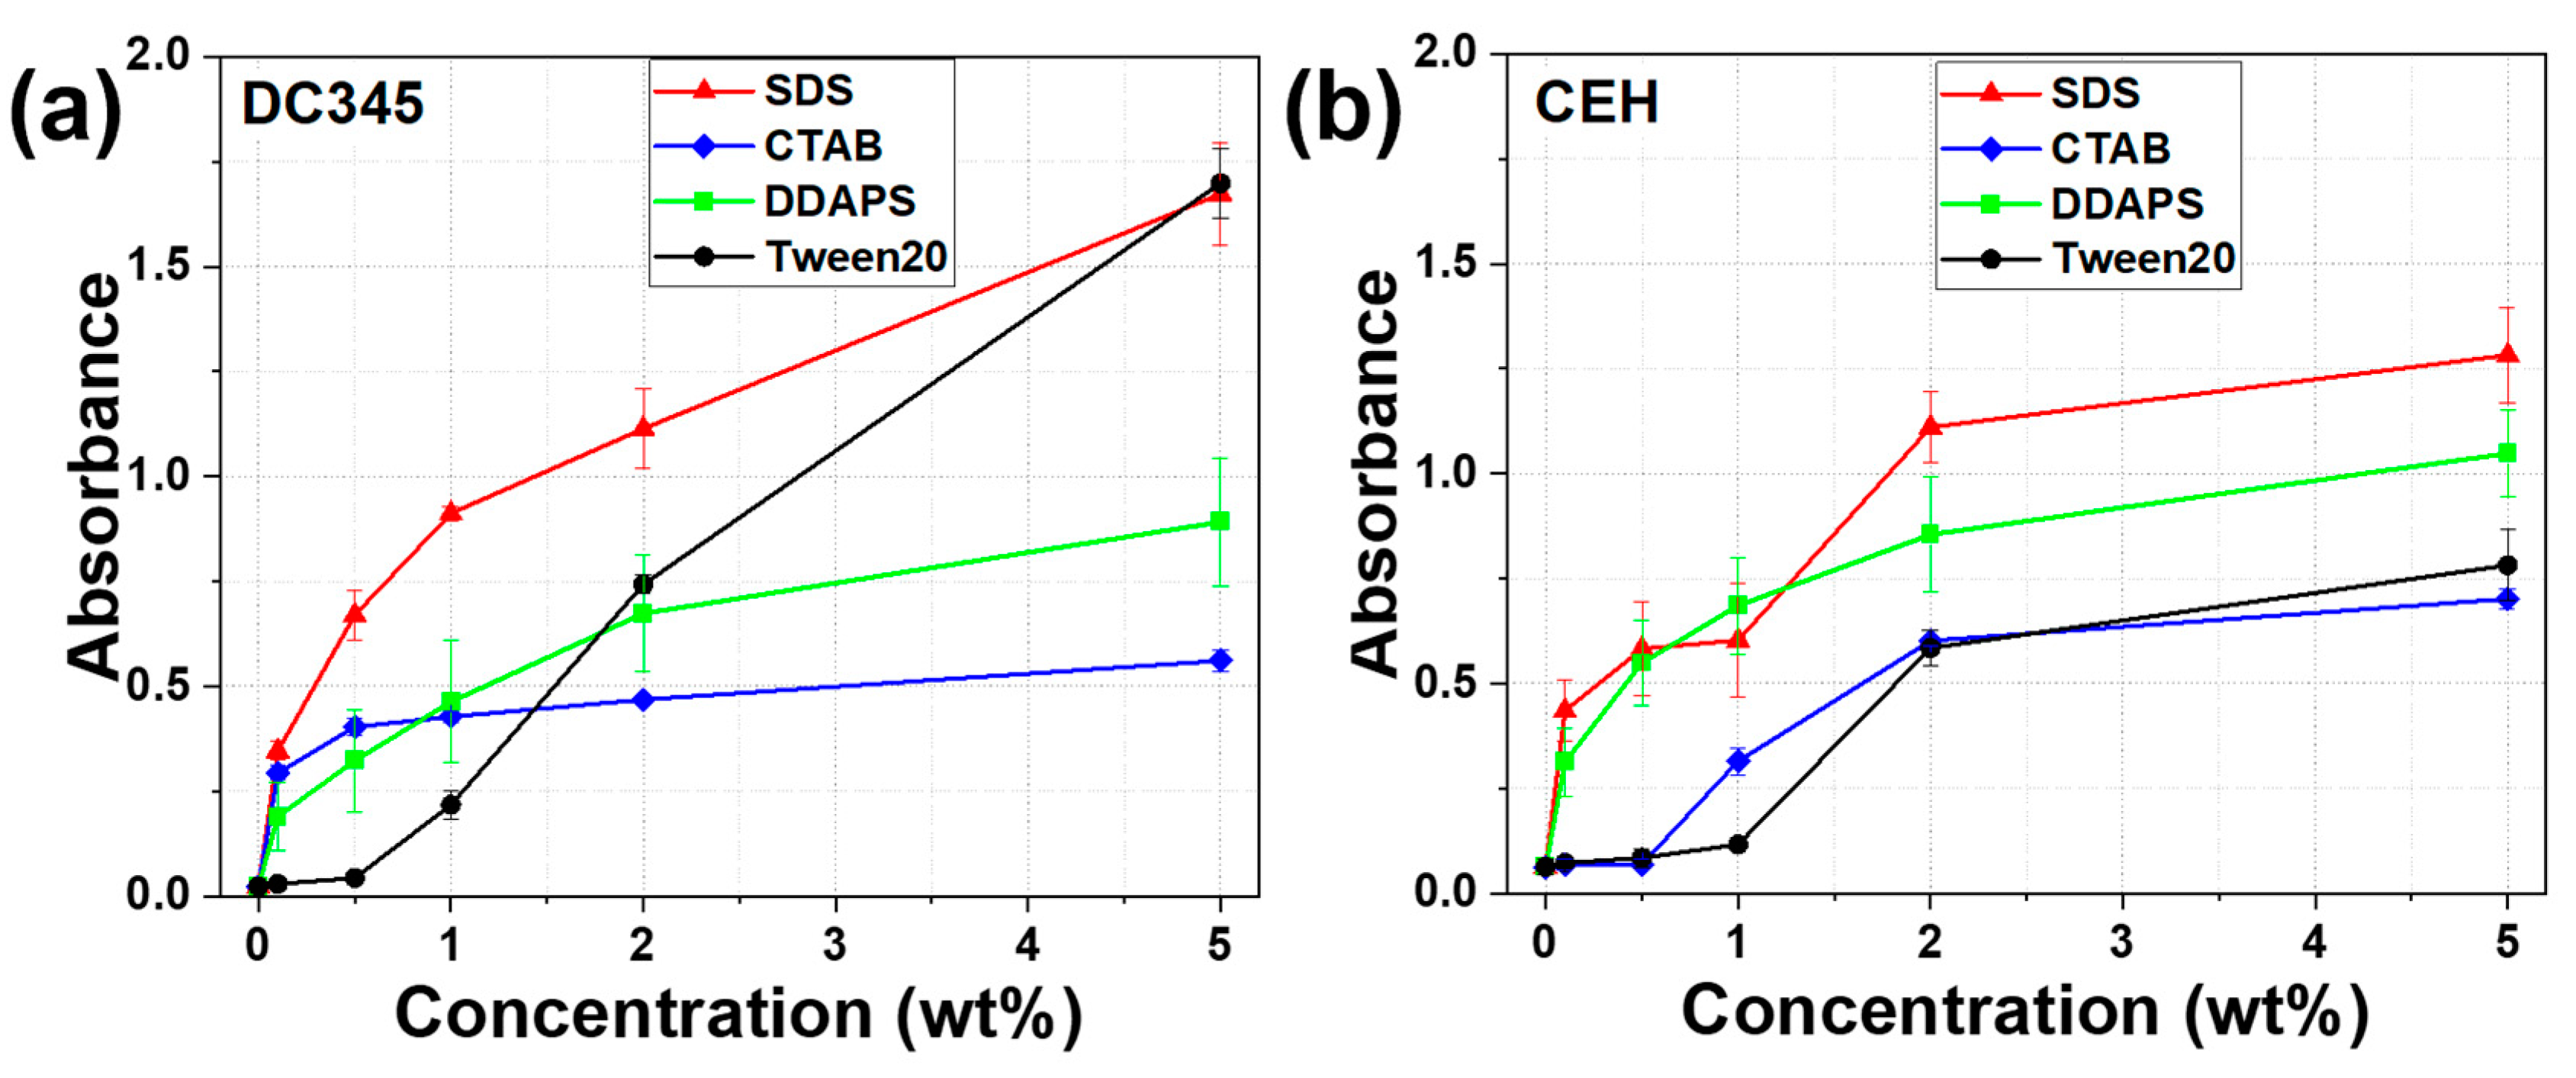
2.5. Assessment of UV-Blocking Efficacy

The TiO2 dispersion as a W/O formulation was prepared using DC345: water (8:2) and CEH: water (8:2). In each co-solvent, TiO2 powder was added up to a fixed concentration (10 wt% TiO2). Surfactants (SDS, CTAB, DDPAS, and Tween 20) or fatty acids (FA-C6, FA-C12, FA-C18, and FA-unC18) were added to produce a final concentration (0.1–5 wt% surfactant or fatty acid). The suspension was addressed on PMMA plates (Helioplate HD6, Helioscreen, Dijkstraat, Lokeren, Belgium) with an area of 1.5 mg/cm2 using fingertips for 1 min (Figure S1). The absorption spectra and intensities (at 300 nm) of the plates were measured using a microplate reader.

3. Results and Discussion

3.1. CMC Determination of Surfactants

Four commercial surfactants (SDS, CTAB, DDAPS, and Tween 20) were used to disperse the particles [14,15,16,17]. In this study, the following surfactants were chosen to investigate the effect of their ionic character on the TiO2 dispersion owing to their different ionic characteristics: anionic SDS, cationic CTAB, zwitterionic DDAPS, and nonionic Tween 20. Their chemical structures are shown in Figure 1a.
The CMC of materials determines the critical concentration for formulating self-assembled micelles by oil (air)–water interfacial activation and is referred to as the minimum concentration that can disperse particles far away. In general, the CMC of surfactants is determined via a concentration-dependent conductivity relationship [18]. CMC of SDS and CTAB was determined at a point of intersection between different linear slopes: 8.1 mM (0.233 wt%) and 0.97 mM (0.035 wt%), respectively (Figure 1b). Those are comparable (±5% variation) with values reported in the literature [19]. The conductivity values of DDAPS were constant regardless of concentration, indicating no apparent intersection point (Figure S2). This is because the net charge of the zwitterionic species is close to zero, thus, they rarely contribute to the conductance [20]. For Tween 20, the conductivity could not be measured because of the intrinsic non-charged character of the surfactant.
As an alternative method for determining the CMC of DDAPS and Tween 20, the inflection point of the concentration-dependent absorbance was used when the surfactant was mixed with R6G (Figure S3) [12]. CMC of DDAPS and Tween 20 was determined at a point of intersection between different linear slopes: 4.1 mM (0.137 wt%) and 0.06 mM (0.007 wt%), respectively (Figure 1c). These values are similar (±5% variation) to that measured in previous studies [21,22].

3.2. Stability of TiO2 Dispersion upon Adding Surfactants

For cosmetic formulations containing TiO2, such as sunscreens, W/O fabrication processes have mostly been considered [23]. As a model study of the W/O formulation, the stability of TiO2 dispersion in a mixture of two liquids (oil:water = 8:2) was evaluated by the percentage ratio (degree) of single-phase dispersion per total suspension (values as 0–100%) and change in trend of viscosity in the dispersed formulation. Two types of oils— nonpolar (DC345) and polar (CEH)—were chosen owing to them being the most studied regarding TiO2 formulations in the published literature [24]. Rutile TiO2 was selected because it functions as a UV-blocking compound in cosmetic formulations, with fewer skin toxicities [25]. TiO2 particles contain hydroxyl groups on their surfaces and are hydrophilic, which is appropriate for use in W/O formulations [26,27,28].
We compared the degree of single-phase dispersion of TiO2 suspensions by adding different surfactants. The liquid phase of the TiO2 dispersions was observed 24 h after preparation (Figure 2). Without adding surfactants, TiO2 powder (0.01 wt%) could not be dispersed in the mixture of oil and water (Figure 2a). In the case of TiO2 dispersed in a mixture of nonpolar oil (DC345) and water, the addition of SDS produced a well-dispersed solution in all ranges of the treated surfactant concentration (0.001–2 wt%). The anionic surfactant SDS enables electrostatic stabilization, as recognized by the Derjaguin–Landau–Verwey–Overbeek theory [29,30,31]. For CTAB, DDAPS, and Tween 20, a higher degree of single-phase dispersion was observed with increasing surfactant concentration (starting from 0.05 wt%). Exceptionally, the 2 wt% CTAB treatment resulted in phase separation, indicating an unstable dispersion. The reason for this instability is as follows: when the concentration of the added surfactant increases, the adsorption layer becomes thicker than the distance between the particles. Then, the driving force to form micelles between the surfactants increases the aggregation between the surfactants [32,33]. Based on the photographic images, the qualitative results of whether single-phase dispersion was maintained (criteria for stable dispersion were defined as more than the height of 80% single-phase dispersion) are summarized in Figure 2c.
Quantitative values of the degree of dispersion stability (percentage ratio between the height of a single-phase dispersion and the height of the initial suspension) were recorded in detail (Figure S4). Based on references, the CMC value and degree of dispersion stability are closely related; the dispersion capability is optimized at the CMC or higher concentrations of the surfactant [32,33,34]. Anionic SDS produced a TiO2 dispersion of ~100% in all ranges of treated concentrations. In the case of CTAB and DDAPS, the degree of dispersion stability increased from 70~80% to 100% as the treatment concentration increased. For non-ionic Tween 20, TiO2 was dispersed with a degree of 100% in treated surfactant concentration (0.01–2 wt%). After one month, TiO2 dispersion by adding SDS exhibited the highest stability, followed by the case of adding Tween 20, which also kept stable dispersion. In contrast, most of the CTAB- and DDAPS-added samples separated and precipitated (Figure S5).
In the case of TiO2 dispersion in a mixture of polar oil (CEH) and water, SDS produced a well-dispersed solution in the range of treated surfactant concentration (0.1–2 wt%) as shown in Figure 2b. In the cases of CTAB, DDAPS, and Tween 20, higher dispersion stability was observed with increasing surfactant concentration (starting from 0.01 wt%). Exceptionally, 0.1–2 wt% DDAPS treatment resulted in phase separation, which is explained by the same principle of surfactant aggregation when over-concentration was applied [32,33]. The qualitative results of the dispersion stability based on photographic images are summarized in Figure 2d.
The quantitative values of the degree of dispersion stability are presented in Figure S4. Anionic SDS produced a TiO2 dispersion with a degree of dispersion stability of ~100% at a range of treated concentrations (0.1–2 wt%). In the case of CTAB, TiO2 was dispersed with a stability of 84–100% at treated surfactant concentrations (0.01–2 wt%), although DDPAS enabled TiO2 to disperse from 85–95% at relatively low concentrations (0.001–0.05 wt%). In the case of Tween 20, it was not dispersed at low concentrations of 0.001 and 0.005 wt% but then dispersed with a degree of 100% in treated surfactant concentration (0.01–2 wt%). After one month of measurement, TiO2 dispersion by adding SDS maintained stability at concentrations of 0.01–2 wt%, while the case of adding Tween 20 remained stable at concentrations of 0.05–2 wt%. In contrast, most of the CTAB- and DDAPS-added samples showed significant precipitation (Figure S5). Using FT-IR spectroscopy (Nicolet iS20 FTIR Spectrometer, Thermo Fisher Scientific, Waltham, MA, USA), we further characterized the chemical compounds in the well-dispersed TiO2 dispersions (in the case of adding 1 wt% of the four different surfactants). The band at 600–700 cm−1 associated with TiO2 and the C-H bands of the surfactants at 2916 and 2848 cm−1 appeared, indicating that the surfactants were adsorbed onto the TiO2 surface, forming TiO2 dispersions (Figure S6). To examine the surface-charged state of the particle, the size and zeta potential of TiO2 dispersions were analyzed. Light dynamic scattering (DLS) measurements indicated that the addition of surfactants successfully reduced particle size compared to samples without surfactants. Without surfactants, particles tended to aggregate, increasing in size, whereas surfactant addition prevented this aggregation, resulting in smaller particle sizes. SDS, in particular, formed the smallest and most stable particles. Furthermore, size measurements at varying SDS concentrations showed that particle size increased with higher concentrations, indicating a thicker adsorption layer. This increase in the adsorption layer creates steric hindrance between particles, leading to even greater stability (Figure S7).
The zeta potential increased with concentration in the case of SDS and CTAB addition, showing more negative and positive values, respectively, while DDAPS and Tween 20 showed no change in zeta potential. This increase in zeta potential can enhance dispersion stability through ionic repulsion. Previous studies have shown that as the concentration of surfactants increases, the absolute value of zeta potential (negative or positive) also increases [35,36]. Similarly, in this study, we observed that higher concentrations resulted in greater dispersion stability (Figure S8).
To correlate the degree of dispersion stability and the viscosity of the TiO2-based W/O formulation, the viscosity of the TiO2 dispersion was measured based on the concentration of the treated surfactants. For non-polar oil (DC345), ionic surfactants (anionic SDS, cationic CTAB, and zwitterionic DDAPS) showed a decreasing trend at low concentrations (0–1 wt%) but increased at higher concentrations (2–5 wt%) of treated surfactants (Figure 3a). In the case of Tween 20, unlike the other surfactants, the viscosity increased at low concentrations (0–0.5 wt%) of the treated surfactants but decreased at their higher concentrations (1–5 wt%). The non-ionic but hydrophilic ions of the surfactant do not repel when adsorption occurs on the surface of the particles; therefore, the viscosity increases at low concentrations. However, at high concentrations, micelles are formed between the surfactants. Meanwhile, the amount of surfactant that can be adsorbed onto the particles decreases, reducing the viscosity [5,6,32,37,38].
For polar oil (CEH), similar to the trend of viscosity for non-polar oil, ionic surfactants (anionic SDS, cationic CTAB, and zwitterionic DDAPS) showed a decreasing trend at low concentrations (0–1 wt%) of treated surfactants, but increased at their higher concentrations (2–5 wt%) (Figure 3b). In the case of Tween 20, unlike other surfactants, the viscosity increased at low concentrations (0–0.5 wt%) of the treated surfactants but increased at their higher concentrations (1–5 wt%).

3.3. Effects of Surfactants on the UV-Blocking Efficacy of TiO2 Dispersion

The UV-ray-blocking performance depends on the degree of dispersion stability of the W/O formulation [23]. To evaluate the UV-blocking efficacy of the TiO2 dispersion, a standard assessment was utilized [39] as follows: the TiO2 dispersions in the corresponding non-polar oil (DC3456) and polar oil (CEH) were addressed and scrubbed on plates, and the absorption intensities were measured at 300 nm. Absorption gradually increased with increasing surfactant concentration (Figure 4). Overall, the TiO2 dispersion using anionic SDS treatment had higher UV-absorption or UV-blocking efficacy than those using CTAB, DDAPS, and Tween 20.
We further compared the optical microscopy images of the TiO2 dispersion after anionic SDS treatment (0.001 wt% vs. 1 wt% addition). For 0.001 wt% SDS, aggregates and clusters of TiO2 (dark part: TiO2) were observed. However, evenly spread particle-like TiO2 was observed in the case of 1 wt% SDS. These results suggested that the well-dispersed and stable TiO2 formulation contributed to the UV-blocking efficacy (Figure S9). Because the UV-blocking efficacy of the TiO2 dispersion by anionic SDS treatment was the most effective, we further investigated the effect of different alkyl chains of anionic fatty acids as surfactants on the TiO2 dispersion quality in subsequent experiments.

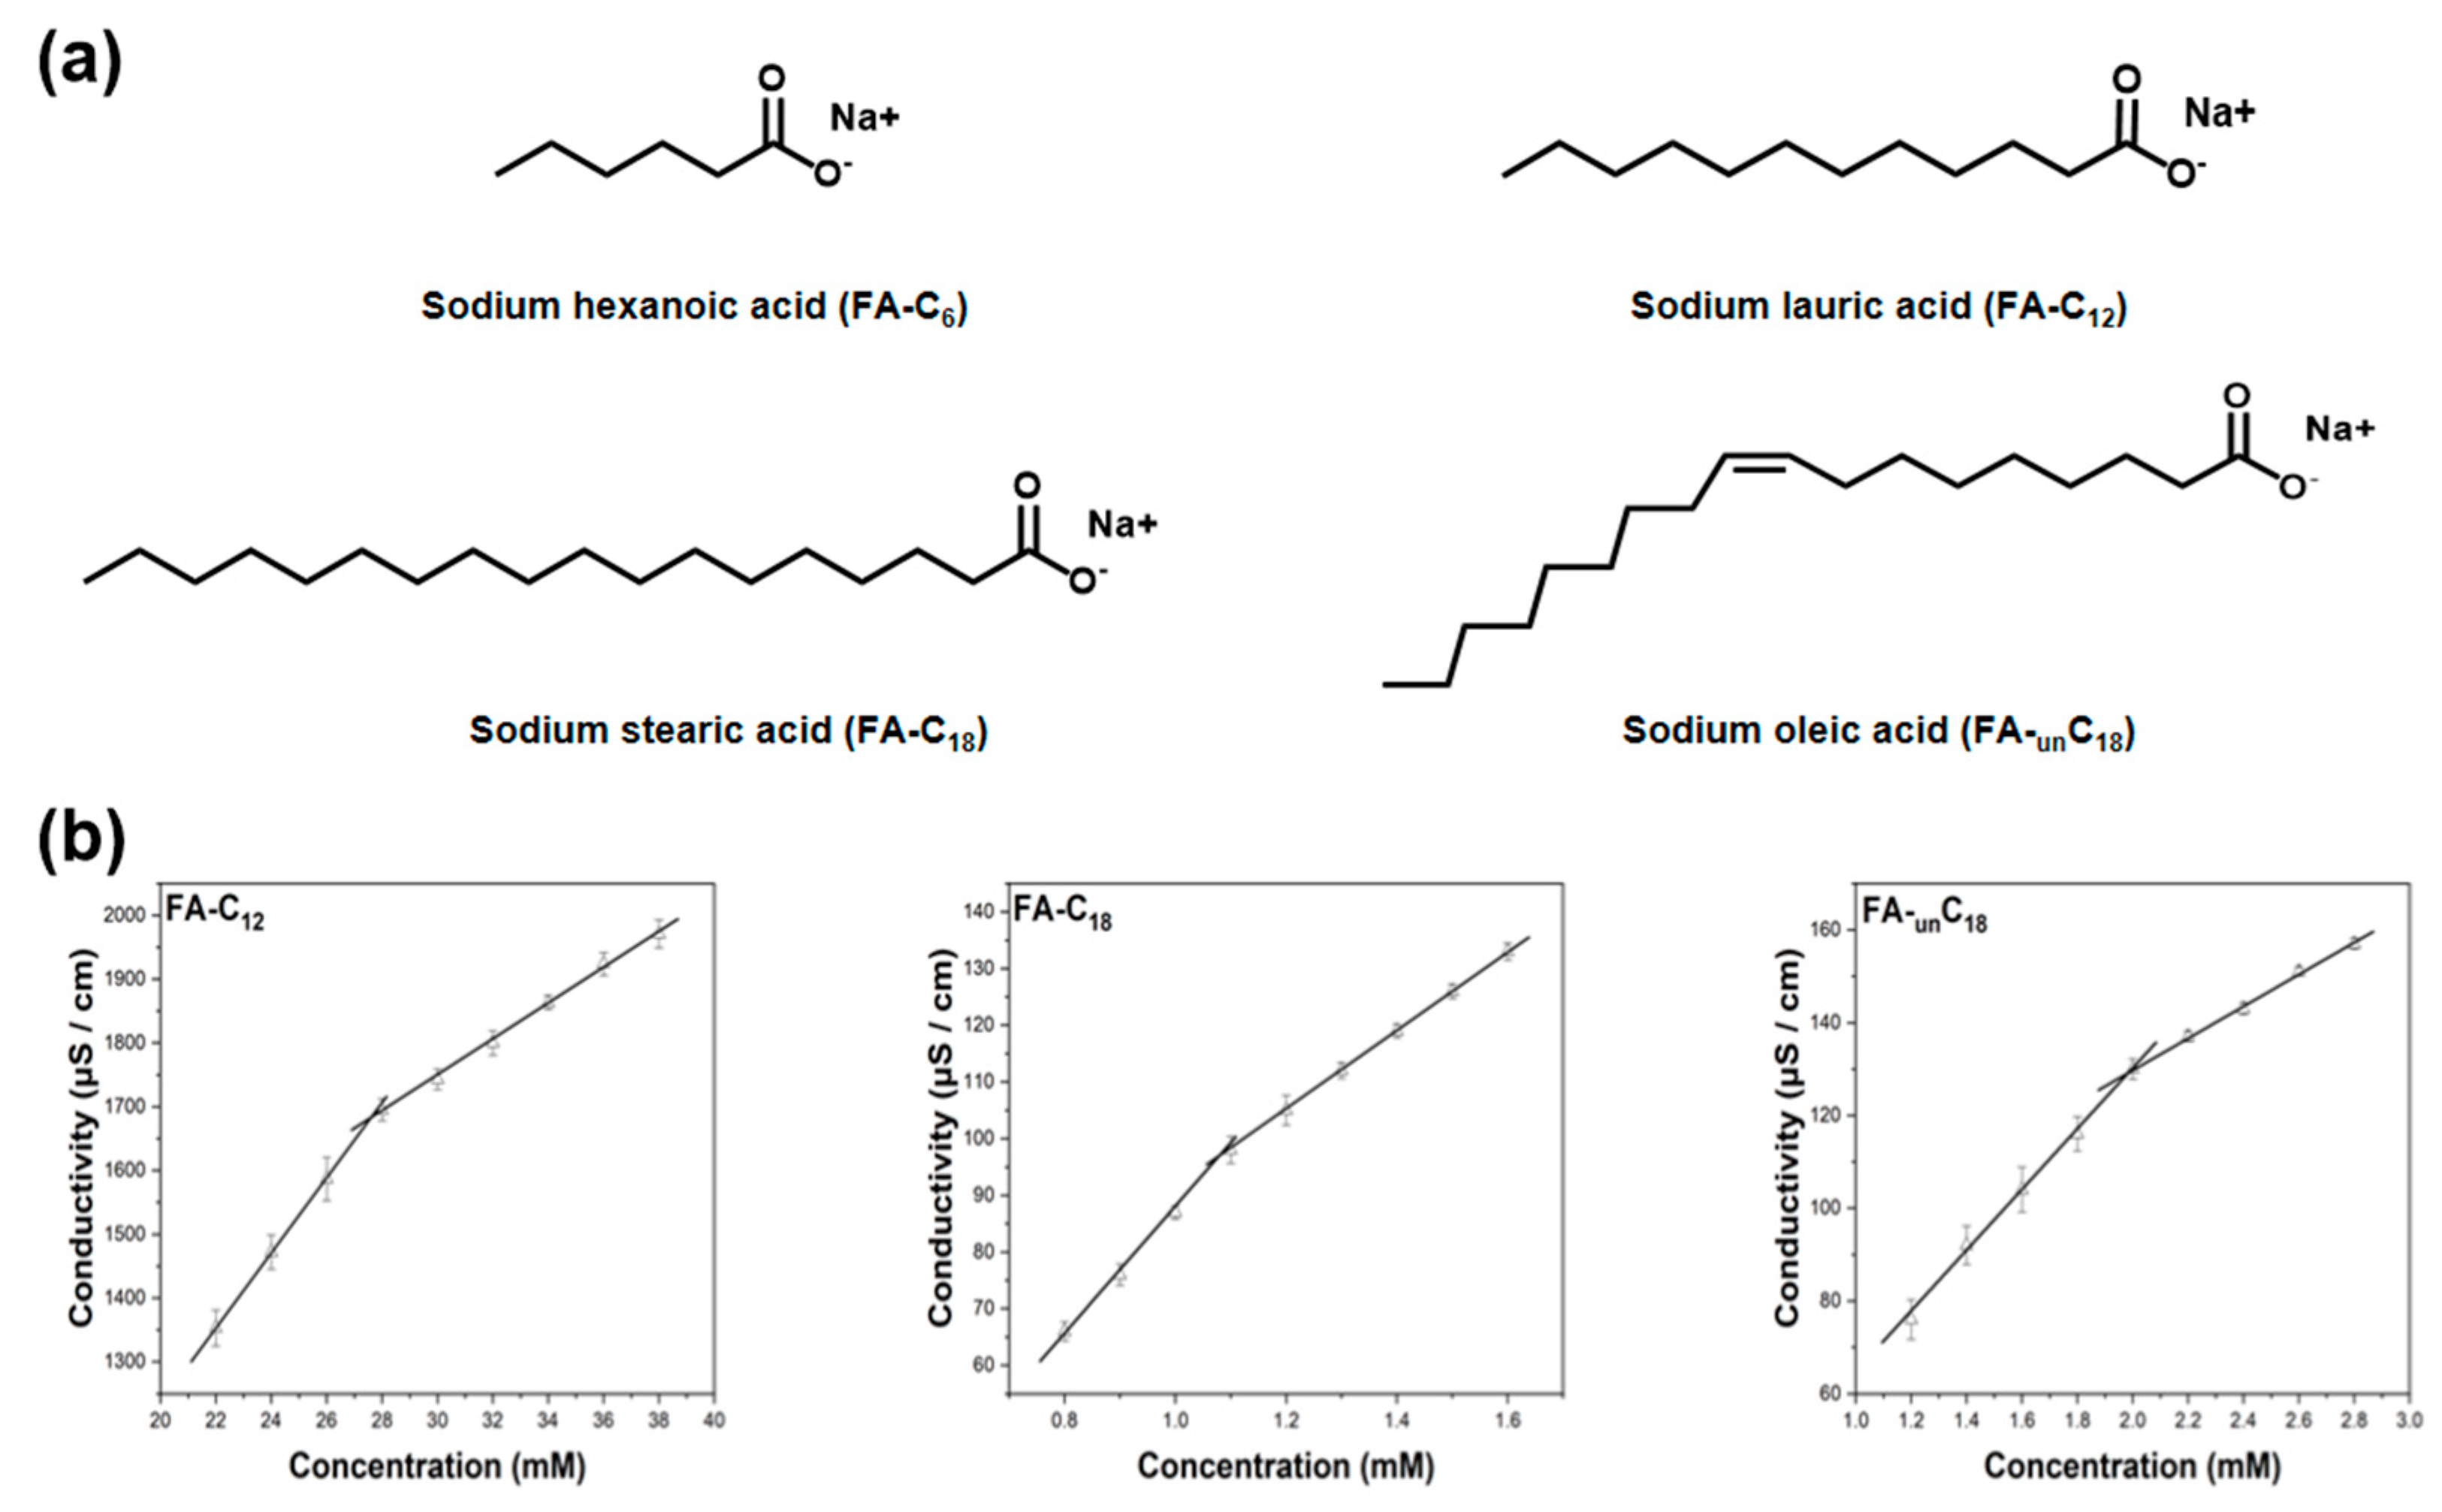
3.4. CMC Determination of Fatty Acids with Different Alkyl Chains

To evaluate the effect of surfactant alkyl chains on the degree of TiO2 dispersion stability, anionic fatty acids of different chain lengths (FA-C6, FA-C12, FA-C18, and FA-unC18) were selected. Their chemical structures are shown in Figure 5a. A comparison between FA-C18 and FA-unC18 revealed the effect of the presence of a double bond in the middle of the alkyl chains on dispersion quality.
The CMC of FA-C6 is approximately 1 M; however, FA-C6 is not soluble in water (solubility < 0.2 M), making it impossible to measure via conductivity measurements [40]. CMC of FA-C12, FA-C18, and FA-unC18 were determined at the point of intersection between different linear slopes: 27.4 mM (0.609 wt%), 1.08 mM (0.033 wt%), and 1.98 mM (0.06 wt%), respectively (Figure 5b).

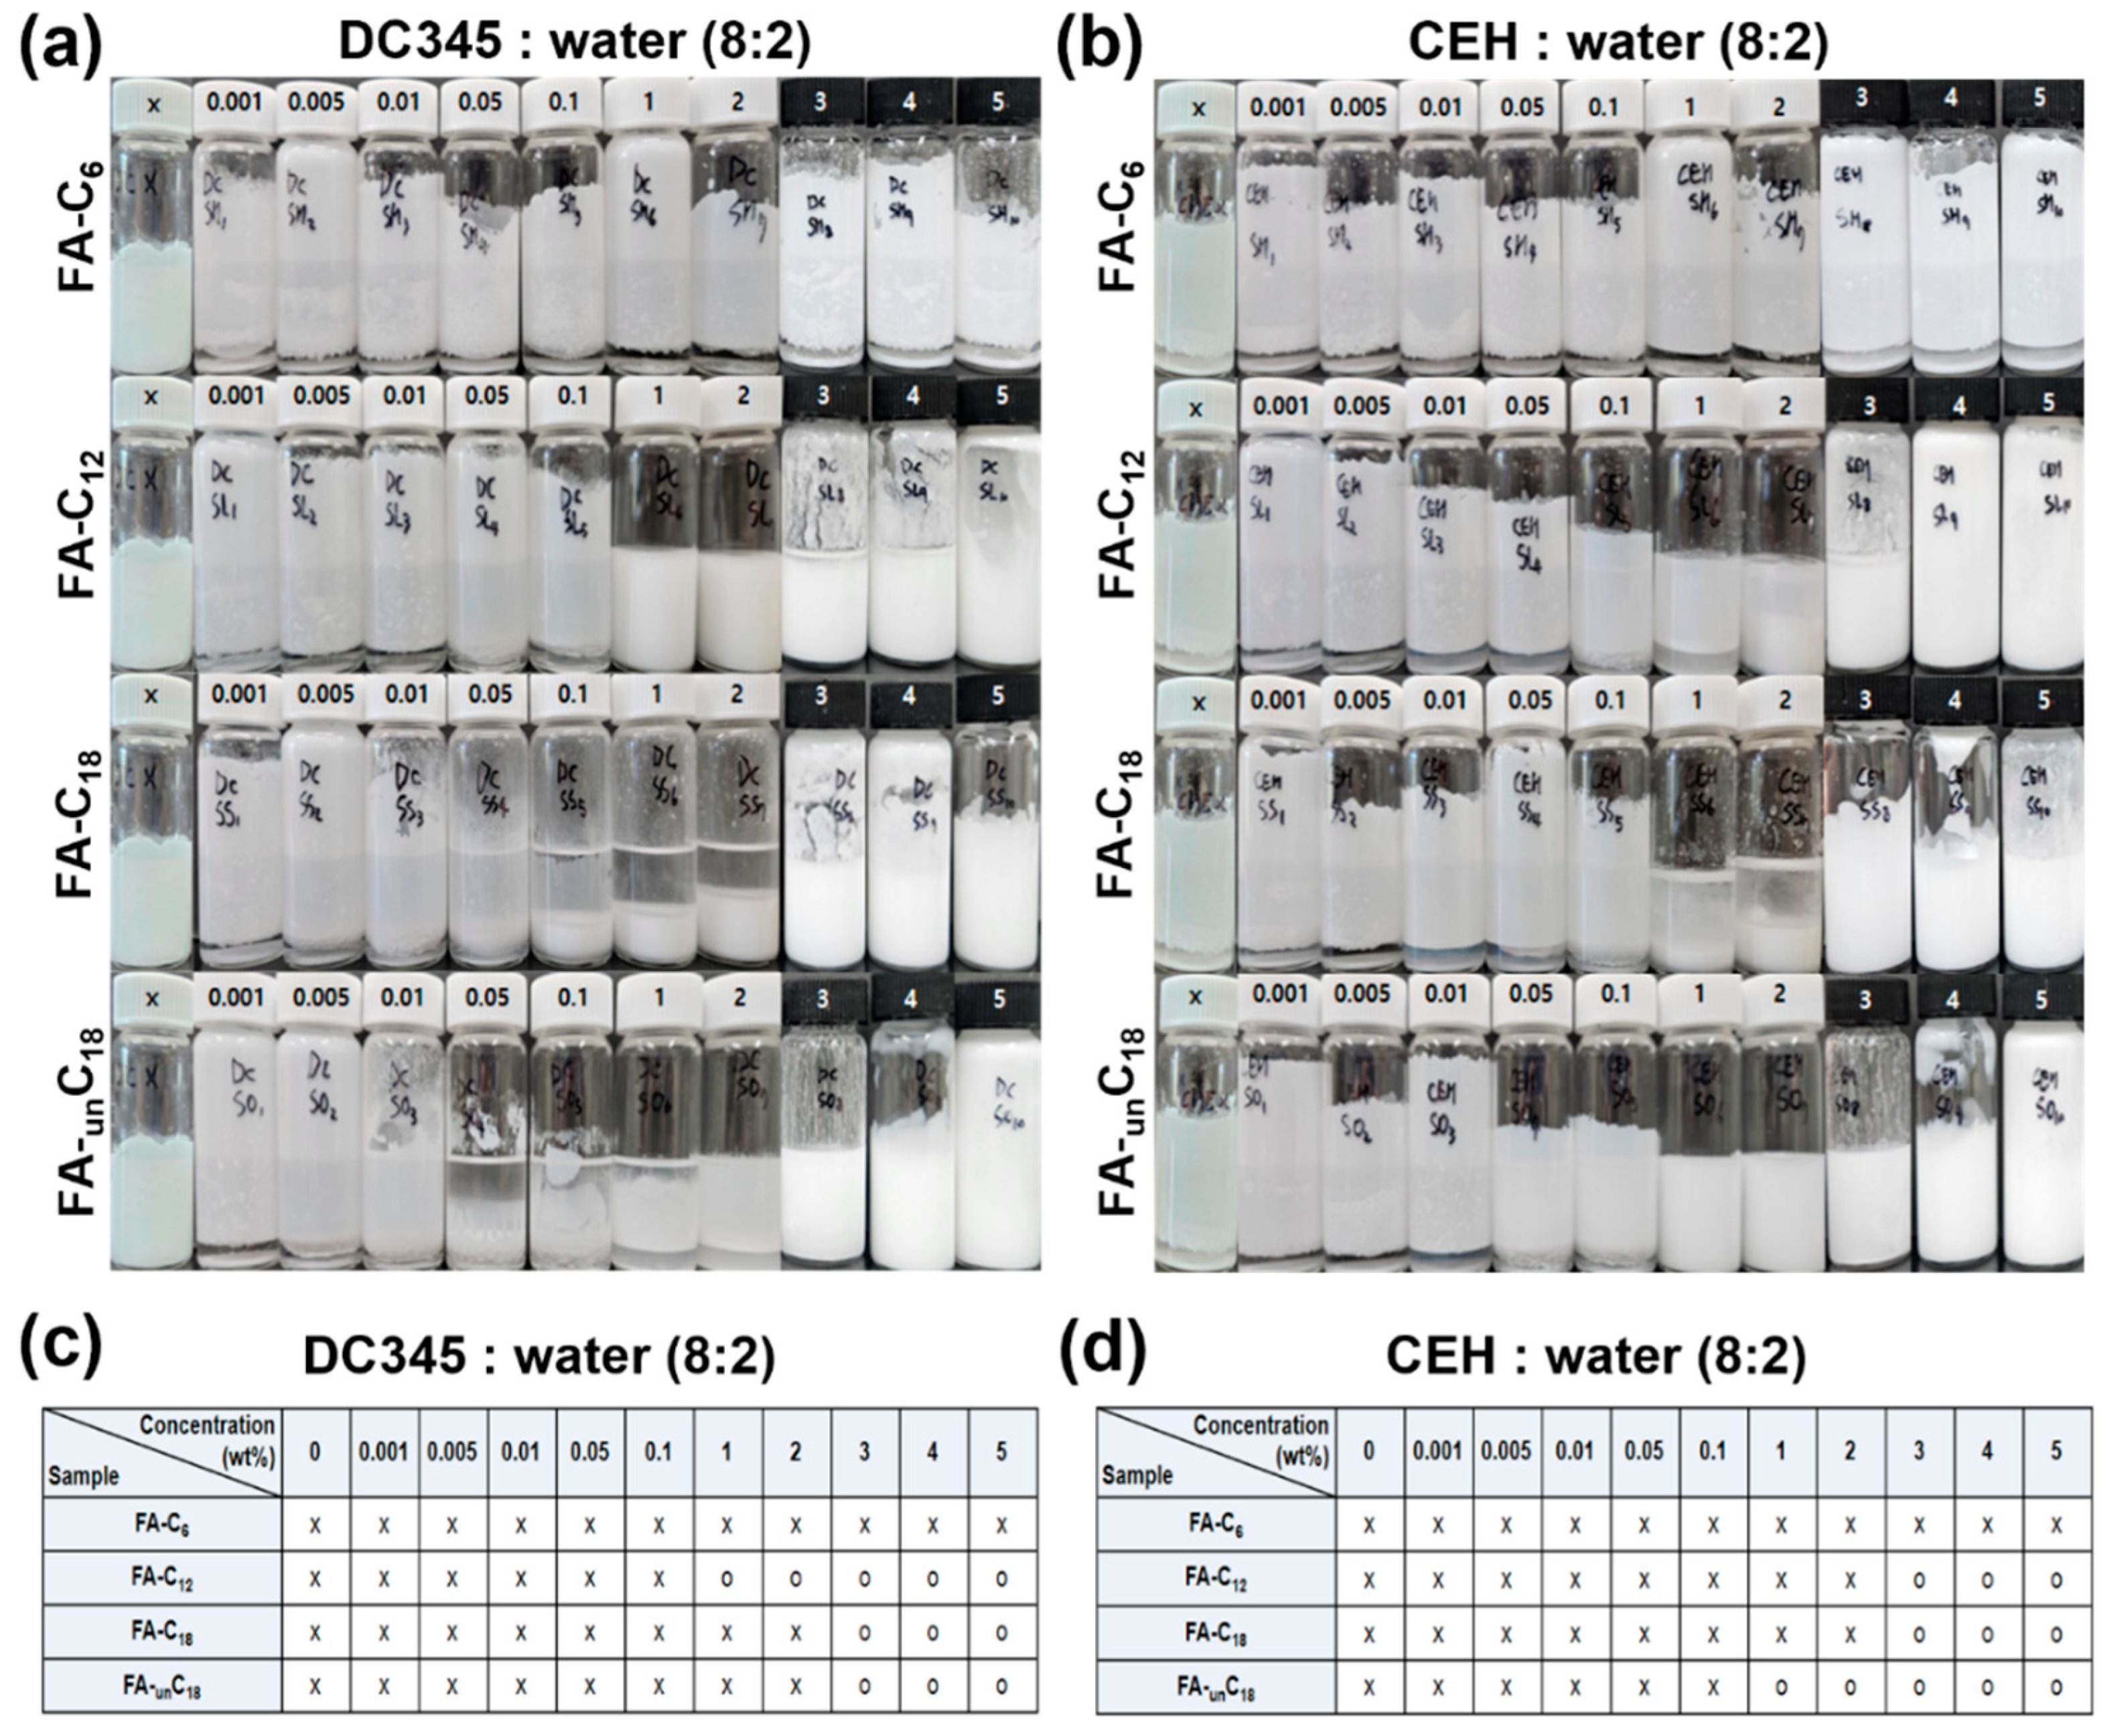
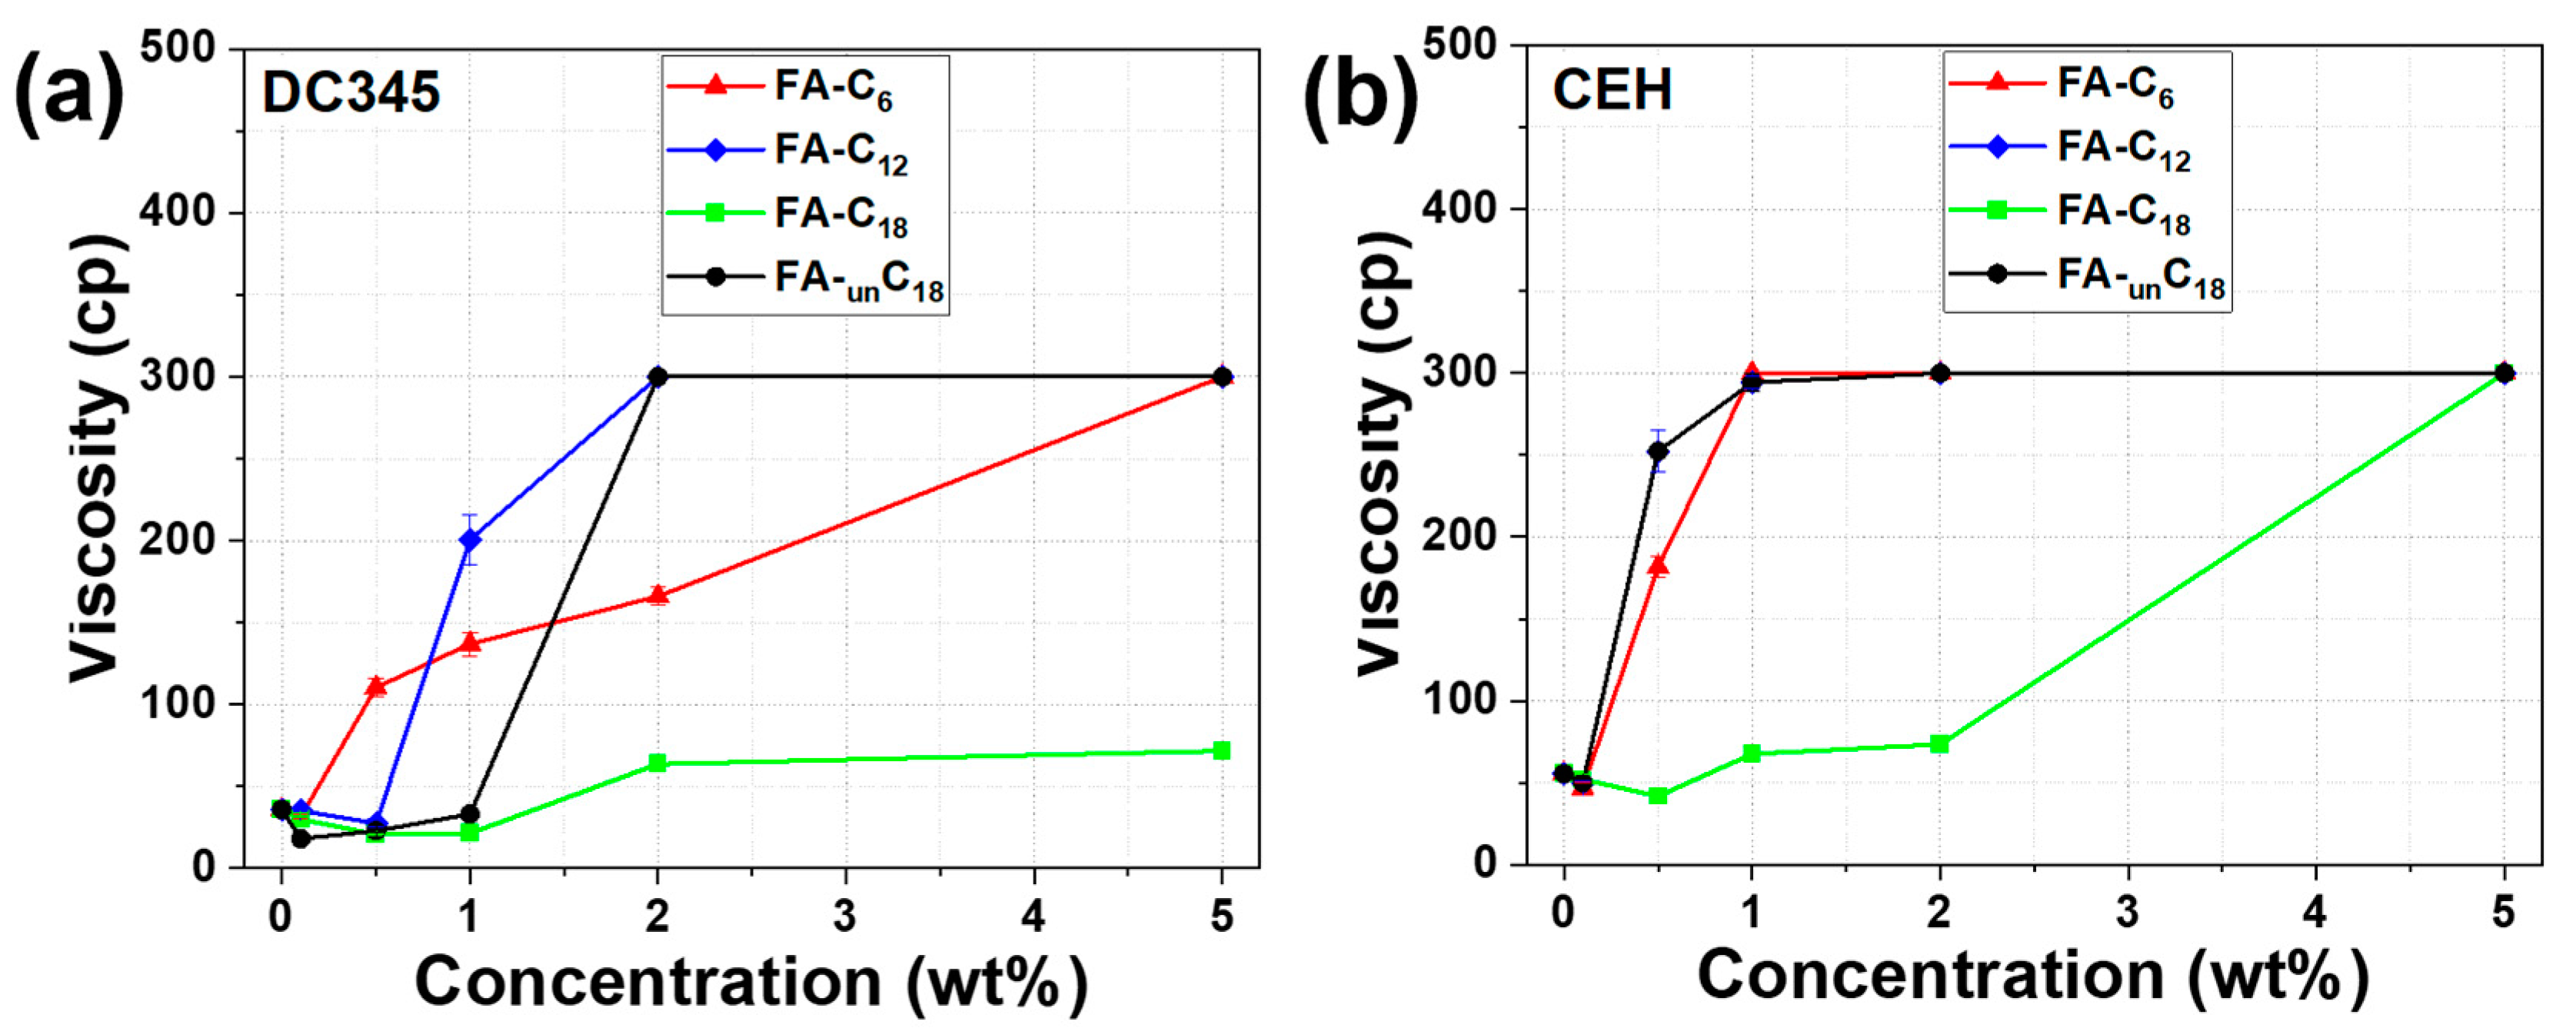
3.5. Effect of Addition of Fatty Acids with Different Alkyl Chains on the Stability of TiO2 Dispersion

We evaluated the degree of single-phase dispersion of TiO2 after the fatty acid treatment. In a mixture of non-polar oil (DC345) and water, FA-C6 could not disperse TiO2 at any concentration (Figure 6a). This is attributed to the fact that the alkyl chains of the fatty acids were too short to be adsorbed onto the surface of TiO2. In the case of FA-C12, as the treated fatty acid concentration increased (starting from 1 wt%), a higher dispersion height was observed. In the case of FA-C18 and FA-unC18, the degree of dispersion stability reached 100% at 3–5 wt% treated concentrations. The quantitative values of the degree of dispersion stability are presented in Figure S10a. Anionic FA-C12 produced a TiO2 dispersion with a nearly 100% degree of dispersion stability over a range of treated concentrations (1–5 wt%). In the case of FA-C18 and FA-unC18, TiO2 was dispersed with a degree of dispersion stability of 100% at treated surfactant concentrations (3–5 wt%). After one month of measurement, FA-C18, with its long alkyl chain, demonstrated the highest stability. This is because long chains more effectively maintain steric hindrance compared to shorter chains, resulting in such outcomes (Figure S11a).
In a mixture of polar oil (CEH) and water, FA-C6 could not disperse TiO2 in solution at all tested concentrations (Figure 6b). In the case of FA-C12 and FA-C18, single-phase dispersion was not achieved at low concentrations (0.001–2 wt%), although the dispersion showed approximately 100% of dispersion height at high concentrations (3–5 wt%). In the case of FA-unC18, as the treated fatty acid concentration increased (starting from 0.1 wt%), a higher dispersion height was observed. The quantitative values of the degree of dispersion stability are presented in Figure S10b. Anionic FA-C12 and FA-C18 produced a TiO2 dispersion with a nearly 100% degree of dispersion stability at the range of treated concentrations (3–5 wt%). In the case of FA-unC18, TiO2 was dispersed with a degree of dispersion stability of 85–100% at treated surfactant concentrations (1–5 wt%). After one month of measurement, FA-unC18, with its long alkyl chain, exhibited the highest stability (Figure S11b). We also characterized the chemical compounds in the TiO2 dispersions with 1 wt% of the four fatty acid treatments. Bands at 600–700 cm−1 associated with TiO2 and the C-H bands of fatty acids at 2916 and 2848 cm−1 were observed, indicating that the fatty acids were adsorbed on the TiO2, creating a well-dispersed TiO2 dispersion (Figure S12). To examine the characteristics of the particle surface, size and zeta potential were analyzed (Figure S13). As the chain length increased, the particle size also increased, indicating a thicker adsorption layer. This trend was consistent with the results observed in the zeta potential analysis (Figure S14).
To correlate the degree of dispersion stability and the potential of the viscous W/O formulation, the viscosity of the TiO2 dispersion was measured according to the fatty acid concentration. For both the non-polar (DC345) and polar (CEH) oils, anionic fatty acids showed an increasing trend of viscosity with increasing treatment concentrations (Figure 7). Fatty acids with relatively shorter alkyl chains (FA-C6 and FA-C12) produced a higher-viscosity TiO2 dispersion than fatty acids with longer alkyl chains (FA-C18) did. Surfactants with shorter alkyl chains have more molecules per unit mass than those with longer alkyl chains, resulting in faster adsorption onto TiO2. Consequently, a more rapid increase in viscosity occurred than for longer alkyl chains. However, for surfactants with shorter hydrophobic chains, the length of the chains protruding into the external oil is shorter, making them less effective at capturing oil and thus less stable compared to longer alkyl chains [41,42,43].

3.6. Effect of Fatty Acids with Different Alkyl Chains on the UV-Blocking Efficacy of TiO2 Dispersion

The UV-blocking efficacy of the TiO2 dispersion was evaluated based on the concentration of anionic fatty acids with different alkyl chains. The UV absorption (λabs = 300 nm) gradually increased corresponding to the increasing concentration of treated fatty acids (Figure 8). Among them, fatty acids with relatively longer alkyl chains (FA-C12, FA-C18, and FA-unC18) resulted in relatively more effective UV-blocking than those with shorter alkyl chains (FA-C6). In the case of surfactants with longer alkyl chains in the W/O formulations, the length of the alkyl chain protruding into the external oil was longer than that of the other surfactants, allowing it to successfully trap oil. This oil forms a spatial barrier by filling the gaps between the droplets, thereby increasing stability and enhancing UV-protection efficacy. Surfactants with double-bond structures have a higher affinity for polar oils, leading to greater oil-trapping capability and the formation of an even stronger spatial barrier [41,43].

4. Conclusions

As a fundamental study of the structure (surfactant additives)–performance (TiO2 formulation) correlation, the effects of the chemical characteristics of the surfactants on the dispersion stability and UV-blocking efficacy of TiO2 as a W/O formulation were investigated. In terms of the UV-blocking efficacy, the anionic SDS surfactant was the most effective in stabilizing the TiO2 dispersion. Among the anionic fatty acids used as surfactants, the fatty acids possessing relatively longer alkyl chains enabled higher UV-blocking efficacy of the TiO2-based formulation. Observations regarding the effect of the ionic and alkyl chain length of the surfactant on TiO2 dispersion may provide insights for developing inorganic compound-based formulations using molecular or polymer dispersants in the cosmetic, paint, and coating industries.

Supplementary Materials

The following supporting information can be downloaded at: https://www.mdpi.com/article/10.3390/app142311035/s1: Figure S1. Sample coated on a PMMA plate; Figure S2. Determination of critical micelle concentration of DDAPS by conductivity measurement; Figure S3. Spectra at varying concentrations of (a) DDAPS and (b) Tween 20; Figure S4. Degree of TiO2 dispersion stability in oil (DC345 and CEH) using various concentrations of different surfactants; Figure S5. Degree of dispersion stability of oil (DC345 and CEH) TiO2 dispersion with various concentrations of surfactants (SDS, CTAB, DDAPS, Tween 20) after one month of dispersion; Figure S6. FT-IR spectra of TiO2 dispersion by 1 wt% surfactants (SDS, CTAB, DDAPS, and Tween 20); Figure S7. (a), (b) Size according to hydrophilic ion. (c), (d) Size according to SDS concentration (0.01, 0.1, 1, 5 wt%); Figure S8. (a), (b) Zeta potenial according to hydrophilic ion. (c), (d) Zeta potenial according to SDS concentration (0.01, 0.1, 1, 5 wt%); Figure S9. Optical microscopic images of TiO2 dispersion by adding 1 wt% SDS under (a) 100×, (b) 400×, (c) 1000× magnification, and by adding 0.001 wt% SDS under (d) 100×, (e) 400×, (f) 1000× magnification; Figure S10. Degree of TiO2 dispersion stability in oil (DC345 and CEH) using various concentrations of fatty acid as a surfactant; Figure S11. Degree of dispersion stability of oil (DC345 and CEH) TiO2 dispersion with various concentrations of surfactants (FA-C6, FA-C12, FA-C18, FA-unC18) after one month of dispersion; Figure S12. FT-IR spectra of TiO2 dispersion with 1 wt% surfactants (FA-C6, FA-C12, FA-C18, and FA-unC18); Figure S13. (a), (b) Size with length of alkyl chain (FA-C6, FA-C12, FA-C18, FA-unC18); Figure S14. (a), (b) Zeta potential with length of alkyl chain (FA-C6, FA-C12, FA-C18, FA-unC18); Figure S15. UV-Vis absorption intensities (λabs = 300, 360 nm) of commercial products (randomly named with a letter).

Author Contributions

Conceptualization, S.S.; validation and investigation, J.M.; formal analysis and data curation, Y.J., S.J., J.M.L., Y.K., H.M. and J.H.; writing—original draft preparation, J.M.; writing—review and editing, Y.C., S.-M.J., S.Y.Y., B.-S.A., D.Y.H. and S.S. All authors have read and agreed to the published version of the manuscript.

Funding

This research was funded by a 2-Year Research Grant from Pusan National University (202314830001).

Data Availability Statement

The original contributions presented in the study are included in the article, further inquiries can be directed to the corresponding authors.

Conflicts of Interest

The authors declare no conflicts of interest.

References

  1. Filipe, P.; Silva, J.N.; Silva, R.; Cirne De Castro, J.L.; Marques Gomes, M.; Alves, L.C.; Santus, R.; Pinheiro, T. Stratum Corneum Is an Effective Barrier to TiO2 and ZnO Nanoparticle Percutaneous Absorption. Ski. Pharmacol. Physiol. 2009, 22, 266–275. [Google Scholar] [CrossRef] [PubMed]
  2. Suh, S.; Pham, C.; Smith, J.; Mesinkovska, N.A. The Banned Sunscreen Ingredients and Their Impact on Human Health: A Systematic Review. Int. J. Dermatol. 2020, 59, 1033–1042. [Google Scholar] [CrossRef] [PubMed]
  3. Smaoui, S.; Ben Hlima, H.; Ben Chobba, I.; Kadri, A. Development and Stability Studies of Sunscreen Cream Formulations Containing Three Photo-Protective Filters. Arab. J. Chem. 2017, 10, S1216–S1222. [Google Scholar] [CrossRef]
  4. Powar, N.S.; Chaeeun, A.; In, S.I. A Comprehensive Exploration of Nanomaterials in Cosmetics. IEEE Nanotechnol. Mag. 2024, 18, 15–26. [Google Scholar] [CrossRef]
  5. Faure, B.; Salazar-Alvarez, G.; Ahniyaz, A.; Villaluenga, I.; Berriozabal, G.; De Miguel, Y.R.; Bergström, L. Dispersion and Surface Functionalization of Oxide Nanoparticles for Transparent Photocatalytic and UV-Protecting Coatings and Sunscreens. Sci. Technol. Adv. Mater. 2013, 14, 23001. [Google Scholar] [CrossRef]
  6. Tseng, S.; Huang, C.H.; Hsu, J.P. Electrophoresis of Two Spheres: Influence of Double Layer and van Der Waals Interactions. J. Colloid Interface Sci. 2015, 451, 170–176. [Google Scholar] [CrossRef]
  7. Pu, Z.; Fan, X.; Su, J.; Zhu, M.; Jiang, Z. Aqueous Dispersing Mechanism Study of Nonionic Polymeric Dispersant for Organic Pigments. Colloid Polym. Sci. 2022, 300, 167–176. [Google Scholar] [CrossRef]
  8. Dange, C.; Phan, T.N.T.; André, V.; Rieger, J.; Persello, J.; Foissy, A. Adsorption Mechanism and Dispersion Efficiency of Three Anionic Additives [Poly(Acrylic Acid), Poly(Styrene Sulfonate) and HEDP] on Zinc Oxide. J. Colloid Interface Sci. 2007, 315, 107–115. [Google Scholar] [CrossRef]
  9. Deiss, J.L.; Anizan, P.; El Hadigui, S.; Wecker, C. Steric Stability of TiO2 Nanoparticles in Aqueous Dispersions. Colloids Surf. A Physicochem. Eng. Asp. 1996, 106, 59–62. [Google Scholar] [CrossRef]
  10. Liufu, S.; Xiao, H.; Li, Y. Adsorption of Poly(Acrylic Acid) onto the Surface of Titanium Dioxide and the Colloidal Stability of Aqueous Suspension. J. Colloid Interface Sci. 2005, 281, 155–163. [Google Scholar] [CrossRef]
  11. Lunn, D.J.; Seo, S.; Lee, S.H.; Zerdan, R.B.; Mattson, K.M.; Treat, N.J.; McGrath, A.J.; Gutekunst, W.R.; Lawrence, J.; Abdilla, A.; et al. Scalable Synthesis of an Architectural Library of Well-Defined Poly(Acrylic Acid) Derivatives: Role of Structure on Dispersant Performance. J. Polym. Sci. A Polym. Chem. 2019, 57, 716–725. [Google Scholar] [CrossRef]
  12. Mabrouk, M.M.; Hamed, N.A.; Mansour, F.R. Simple Spectrophotometric Method to Measure Surfactant CMC by Employing the Optical Properties of Curcumin’s Tautomers. J. Chem. Educ. 2021, 98, 2603–2609. [Google Scholar] [CrossRef]
  13. Ponphaiboon, J.; Limmatvapirat, S.; Limmatvapirat, C. Development and Evaluation of a Stable Oil-in-Water Emulsion with High Ostrich Oil Concentration for Skincare Applications. Molecules 2024, 29, 982. [Google Scholar] [CrossRef] [PubMed]
  14. Biswal, N.R.; Singh, J.K. Interfacial Behavior of Nonionic Tween 20 Surfactant at Oil–Water Interfaces in the Presence of Different Types of Nanoparticles. RSC Adv. 2016, 6, 113307–113314. [Google Scholar] [CrossRef]
  15. Kim, B.J.; Oh, S.G.; Han, M.G.; Im, S.S. Synthesis and Characterization of Polyaniline Nanoparticles in SDS Micellar Solutions. Synth. Met. 2001, 122, 297–304. [Google Scholar] [CrossRef]
  16. Liu, Y.; Tourbin, M.; Lachaize, S.; Guiraud, P. Silica Nanoparticles Separation from Water: Aggregation by Cetyltrimethylammonium Bromide (CTAB). Chemosphere 2013, 92, 681–687. [Google Scholar] [CrossRef]
  17. Wu, X.-J.; Jiang, Y.; Xu, D. A Unique Transformation Route for Synthesis of Rodlike Hollow Mesoporous Silica Particles. J. Phys. Chem. C 2011, 115, 11342–11347. [Google Scholar] [CrossRef]
  18. Yang, J.; Lee, T.I.; Lee, J.; Lim, E.K.; Hyung, W.; Lee, C.H.; Song, Y.J.; Suh, J.S.; Yoon, H.G.; Huh, Y.-M.; et al. Synthesis of Ultrasensitive Magnetic Resonance Contrast Agents for Cancer Imaging Using PEG-Fatty Acid. Chem. Mater. 2007, 19, 3870–3876. [Google Scholar] [CrossRef]
  19. Lee, S.H.; Lee, S.K.; Jeon, S.I. Study on the Critical Micelle Concentration Changes of Surfactants in Magnetized Water. Korean Chem. Soc. 2009, 53, 125–132. [Google Scholar] [CrossRef]
  20. Woodland, M.A.; Lucy, C.A. Altering the Selectivity of Inorganic Anion Separations Using Electrostatic Capillary Electrophoresis. Analyst 2001, 126, 28–32. [Google Scholar] [CrossRef]
  21. Bak, A.; Podgórska, W. Investigation of Drop Breakage and Coalescence in the Liquid-Liquid System with Nonionic Surfactants Tween 20 and Tween 80. Chem. Eng. Sci. 2012, 74, 181–191. [Google Scholar] [CrossRef]
  22. Cholewa, E.; Burgess, I.; Kunze, J.; Lipkowski, J. Adsorption of N-Dodecyl-N,N-Dimethyl-3-Ammonio-1-Propanesulfonate (DDAPS), a Model Zwitterionic Surfactant, on the Au(111) Electrode Surface. J. Solid State Electrochem. 2004, 8, 693–705. [Google Scholar] [CrossRef]
  23. Schulz, J.; Hohenberg, H.; Pflucker, F.; Gartner, E.; Will, T.; Pfeiffer, S.; Wepf, R.; Wendel, V.; Gers-Barlag, H.; Wittern, K. DIstribution of Sunscreens on Skin. Adv. Drug Deliv. Rev. 2002, 54, 157–163. [Google Scholar] [CrossRef]
  24. Jun, H.; Le Kim, T.H.; Han, S.W.; Seo, M.; Kim, J.W.; Nam, Y.S. Polyglycerol-Poly(ε-Caprolactone) Block Copolymer as a New Semi-Solid Polymeric Emulsifier to Stabilize O/W Nanoemulsions. Colloid. Polym. Sci. 2015, 293, 2949–2956. [Google Scholar] [CrossRef]
  25. Dréno, B.; Alexis, A.; Chuberre, B.; Marinovich, M. Safety of Titanium Dioxide Nanoparticles in Cosmetics. J. Eur. Acad. Dermatol. Venereol. 2019, 33, 34–46. [Google Scholar] [CrossRef] [PubMed]
  26. Dussert, A.-S.; Gooris, E.; Hemmerle, J. Characterization of the Mineral Content of a Physical Sunscreen Emulsion and Its Distribution onto Human Stratum Corneum. Int. J. Cosmet. Sci. 1997, 19, 119–129. [Google Scholar] [CrossRef]
  27. Mavon, A.; Miquel, C.; Lejeune, O.; Payre, B.; Moretto, P. In Vitro Percutaneous Absorption and in Vivo Stratum Corneum Distribution of an Organic and a Mineral Sunscreen. Ski. Pharmacol. Physiol. 2007, 20, 10–20. [Google Scholar] [CrossRef]
  28. Beasley, D.G.; Meyer, T.A. Characterization of the UVA Protection Provided by Avobenzone, Zinc Oxide, and Titanium Dioxide in Broad-Spectrum Sunscreen Products. Am. J. Clin. Dermatol. 2010, 11, 413–421. [Google Scholar] [CrossRef]
  29. Warson. Waterborne Coatings and Additives. Edited by D. R. Karsa and W. D. Davies. Royal Society of Chemistry, Cambridge, 1995. Pp. Ix + 257, Price £49.50. ISBN 0-85404-740-9. Polym. Int. 1996, 40, 75. [Google Scholar] [CrossRef]
  30. Núñez-Rojas, E.; Domínguez, H. Computational Studies on the Behavior of Sodium Dodecyl Sulfate (SDS) at TiO2(Rutile)/Water Interfaces. J. Colloid Interface Sci. 2011, 364, 417–427. [Google Scholar] [CrossRef]
  31. Kawazoe, A.; Kawaguchi, M. Characterization of Silicone Oil Emulsions Stabilized by TiO2 Suspensions Pre-Adsorbed SDS. Colloids Surf. A Physicochem. Eng. Asp. 2011, 392, 283–287. [Google Scholar] [CrossRef]
  32. Poorsargol, M.; Alimohammadian, M.; Sohrabi, B.; Dehestani, M. Dispersion of Graphene Using Surfactant Mixtures: Experimental and Molecular Dynamics Simulation Studies. Appl. Surf. Sci. 2019, 464, 440–450. [Google Scholar] [CrossRef]
  33. Lotya, M.; Hernandez, Y.; King, P.J.; Smith, R.J.; Nicolosi, V.; Karlsson, L.S.; Blighe, F.M.; De, S.; Wang, Z.; McGovern, I.T.; et al. Liquid Phase Production of Graphene by Exfoliation of Graphite in Surfactant/Water Solutions. J. Am. Chem. Soc. 2009, 131, 3611–3620. [Google Scholar] [CrossRef] [PubMed]
  34. Pu, N.-W.; Wang, C.-A.; Liu, Y.-M.; Sung, Y.; Wang, D.-S.; Ger, M.-D. Dispersion of Graphene in Aqueous Solutions with Different Types of Surfactants and the Production of Graphene Films by Spray or Drop Coating. J. Taiwan Inst. Chem. Eng. 2012, 43, 140–146. [Google Scholar] [CrossRef]
  35. Amirtham, V.A.; Dhinesh, D.K.; Khan, I.A. Experimental Investigation of Thermal Conductivity and Stability of TiO2-Ag/Water Nanocompositefluid with SDBS and SDS Surfactants. Thermochim. Acta 2019, 678, 178308. [Google Scholar] [CrossRef]
  36. Li, X.; Yoneda, M.; Shimada, Y.; Matsui, Y. Effect of Surfactants on the Aggregation and Stability of TiO2 Nanomaterial in Environmental Aqueous Matrices. Sci. Total Environ. 2017, 574, 176–182. [Google Scholar] [CrossRef]
  37. Loosli, F.; Stoll, S. Effect of Surfactants, PH and Water Hardness on the Surface Properties and Agglomeration Behavior of Engineered TiO2 Nanoparticles. Environ. Sci. Nano 2017, 4, 203–211. [Google Scholar] [CrossRef]
  38. Imae, T.; Muto, K.; Ikeda, S. The PH Dependence of Dispersion of TiO2 Particles in Aqueous Surfactant Solutions. Colloid Polym. Sci. 1991, 269, 43–48. [Google Scholar] [CrossRef]
  39. EN ISO 24443:2012; Cosmetics—Sun Protection Test Methods—In Vitro Determination of Sunscreen UVA Photoprotection. ISO: Geneva, Switzerland, 2012.
  40. Lee, S.Y.; Welbourn, R.; Clarke, S.M.; Skoda, M.W.A.; Clifton, L.; Zarbakhsh, A. Adsorption of Sodium Hexanoate on α-Alumina. J. Colloid Interface Sci. 2013, 407, 348–353. [Google Scholar] [CrossRef]
  41. Al-Busaidi, I.K.; Al-Maamari, R.S.; Karimi, M.; Naser, J. Effect of Different Polar Organic Compounds on Wettability of Calcite Surfaces. J. Pet. Sci. Eng. 2019, 180, 569–583. [Google Scholar] [CrossRef]
  42. Shafiei, M.; Kazemzadeh, Y.; Martyushev, D.A.; Dai, Z.; Riazi, M. Effect of Chemicals on the Phase and Viscosity Behavior of Water in Oil Emulsions. Sci. Rep. 2023, 13, 4100. [Google Scholar] [CrossRef] [PubMed]
  43. Tetteh, J.; Bai, S.; Kubelka, J.; Piri, M. Wettability Reversal on Oil-Wet Calcite Surfaces: Experimental and Computational Investigations of the Effect of the Hydrophobic Chain Length of Cationic Surfactants. J. Colloid Interface. Sci. 2022, 619, 168–178. [Google Scholar] [CrossRef] [PubMed]
Figure 1. (a) Chemical structures of sodium dodecyl sulfate (SDS), cetyltrimethylammonium bromide (CTAB), N-dodecyl-N,N-dimethyl-3-ammonio-1-propanesulfonate (DDAPS), and polyoxyethylene (20) sorbitan monolaurate (Tween 20). (b) Determination of critical micelle concentration for SDS and CTAB by conductivity measurement. (c) Determination of critical micelle concentration for DDAPS and Tween 20 by UV-Vis absorption measurement.
Applsci 14 11035 g001
Figure 2. Photograph of TiO2 dispersions using different surfactants after 24 h storage. (a) 0.01 wt% TiO2 was added to non-polar oil (DC345): water (8:2) with surfactant. (b) 0.01 wt% TiO2 was added to polar oil (CEH):water (8:2) with surfactant. Table of the degree of TiO2 dispersion (O: >80% dispersed, X: <80% dispersed) in a mixture of (c) DC345 and water and (d) CEH and water.
Applsci 14 11035 g002
Figure 3. (a) Viscosity of TiO2 dispersed in non-polar oil (DC345) using different surfactants. (b) Viscosity of TiO2 dispersed in polar oil (CEH) using surfactants. The viscosity of the dispersion was recorded at 10 rpm.
Applsci 14 11035 g003
Figure 4. UV-Vis absorption intensities of (a) 10 wt% TiO2 in non-polar oil (DC345): water (8:2) with various concentrations of surfactant (SDS, CTAB, DDAPS, and Tween 20); (b) 10 wt% TiO2 in polar oil (CEH):water (8:2) with various concentrations of surfactant (SDS, CTAB, DDAPS, and Tween 20).
Applsci 14 11035 g004
Figure 5. (a) Chemical structures of sodium hexanoic acid (FA-C6), sodium lauric acid (FA-C12), sodium stearic acid (FA-C18), and sodium oleic acid (FA-unC18). (b) Critical micelle concentration determination of FA-C12, FA-C18, and FA-unC18 by conductivity measurement.
Applsci 14 11035 g005
Figure 6. TiO2 dispersions using different surfactants after 24 h storage. (a) 0.01 wt% TiO2 was added to non-polar oil (DC345):water (8:2) with surfactant. (b) 0.01 wt% TiO2 was added to polar oil (CEH):water (8:2) with surfactant. Table of the degree of TiO2 dispersion (O: >80% dispersed, X: <80% dispersed) in a mixture of (c) DC345 and water and (d) CEH and water.
Applsci 14 11035 g006
Figure 7. (a) Viscosity of TiO2 dispersed in non-polar oil (DC345) using different surfactants. (b) Viscosity of TiO2 dispersed in polar oil (CEH) using surfactants. The viscosity of the dispersion was recorded at 2 rpm.
Applsci 14 11035 g007
Figure 8. UV-Vis absorption intensities of (a) 10 wt% TiO2 in non-polar oil (DC345):water (8:2) with various concentrations of surfactant (FA-C6, FA-C12, FA-C18, FA-unC18); (b) 10 wt% TiO2 in polar oil (CEH):water (8:2) with various concentrations of surfactant (FA-C6, FA-C12, FA-C18, FA-unC18).
Applsci 14 11035 g008
Disclaimer/Publisher’s Note: The statements, opinions and data contained in all publications are solely those of the individual author(s) and contributor(s) and not of MDPI and/or the editor(s). MDPI and/or the editor(s) disclaim responsibility for any injury to people or property resulting from any ideas, methods, instructions or products referred to in the content.

