1. Introduction
A natural threat, soil erosion is the removing and carrying of soil particles from their original position. Various factors including wind and water can transport particles over long distances. In addition to contributing to sedimentation and landscape altering, soil particles are frequently deposited in other places after being removed from their original location. Along with altering the physical characteristics of the land and perhaps leading to soil degradation, this process has an impact on agricultural productivity, ecosystem health, and water quality. Soil erosion is greatly exacerbated by the loss of natural environmental barriers, such as through overgrazing and uncontrolled deforestation. Unsustainable land management techniques, such as exposing bare soil to wind and rain, growing crops that hasten erosion, employing inappropriate cropping patterns, and utilizing inappropriate irrigation techniques, are additional factors. By removing protective plants from the soil, these methods expose it to wind and water erosion, which eventually degrades the soil and lowers land productivity.
Drainage catchments and sub-catchments are crucial components for efficient land and water resource management [
1,
2,
3]. Because they provide a targeted approach to addressing both land use and water distribution, these natural divisions of the landscape aid in organizing and directing resource management activities [
4]. Furthermore, by offering a framework for risk assessment and preventive actions, these units are essential in lessening the effects of natural disasters like floods and soil erosion. Since it maintains ecosystem health, encourages water efficiency, and lessens sensitivity to environmental risks, proper management of these regions is essential for promoting sustainable development. Investigating the drainage networks provides significant insights in understanding and assessing the natural threats and hazards including seismic activity, flash flooding, soil erosion, etc. [
5]. Management of the watershed highlights the connections between upland and downstream regions as well as the interdependencies among land use, soil health, and water resources [
6,
7].
Morphometric analysis can be described as the mathematical calculations of the Earth’s surface, focusing on its different topographic signatures [
8]. Morphometric studies began in the mid-twentieth century, utilizing conventional methods based on the manual analysis of topographic maps [
9,
10,
11,
12]. Analyzing drainage network morphometrics using traditional methods is a highly time-consuming and labor-intensive process. Innovations in computational and geospatial technologies now facilitate more accurate and efficient evaluations. In situations where topographic maps are not accessible, satellite-based terrain information, such as digital elevation models (DEMs), can be utilized to extract the morphometric characteristics of a watershed. These DEMs can be integrated smoothly into geographic information systems (GIS) and provide continuous data, unlike the segmented contours found in traditional topographic maps [
4]. The recent scientific literature utilizing DEMs for morphometric analysis includes works by the authors in Refs. [
13,
14,
15]. In addition, investigations leveraging satellite imagery and GIS technology for morphometric assessments in watershed management encompass the work of the authors referenced in [
16,
17,
18,
19].
Therefore, the analysis of the morphometric parameters using GIS and remotely sensed data and techniques offers a significant quantitative description assessment of the major morphological and hydrological characteristics present in different landscapes and Earth surface landforms. The characteristics of drainage networks within catchments and sub-catchments can be effectively modeled through the detailed examination of significant morphometric parameters, including stream order, bifurcation ratio, and stream length ratio [
9]. The advancement of physiographic quantitative methods and the description of the history and behavior of drainage networks have received significant attention in the field of geomorphology [
9,
20,
21]. The authors in Ref. [
22] suggested that the physiographic features of the various watersheds could be connected to several hydrological phenomena. Furthermore, morphometric analysis improves our comprehension of hydrologic responses, such as groundwater potential, infiltration capacity, and surface runoff generation. More precise and insightful forecasts of other catchment characteristics, like travel duration, period to peak, and the intensity of erosion processes, are additionally made possible by this approach [
23]. It is thus an effective method in ungauged watersheds where information on soil, hydrology, geology, and geomorphology are insufficient [
24,
25]. Furthermore, conserving and controlling different natural resources, assessing drainage catchments, determining the frequency of flash floods, and preserving soil erosion controls may all benefit greatly from morphometric analysis research [
15,
26]. Effective water resource management, landslide risk assessment, groundwater potential evaluation, soil erosion mitigation, and watershed activity prioritization all depend on the data acquired from the morphometric evaluation of watersheds [
15,
27,
28,
29].
Many mountainous catchments and sub-catchments are experiencing degradation and are in a significantly threatened condition due to factors such as deforestation, urban expansion, and jhum cultivation. Comprehensive management plans are essential for achieving sustainable development for these degraded watersheds [
19,
29]. Identifying priority watersheds is vital for effective management, as it informs the project costs, types, and the ranking of development initiatives. Recently, morphometric analysis has become an important area of study for policy makers and researchers, particularly in watershed management. The assessment of sub-watersheds can be directed by various goals, such as managing runoff, controlling floods, enhancing groundwater resources, and evaluating soil erosion levels. The authors in Ref. [
30] defined sub-watershed prioritization as a method for ranking sub-watersheds due to the intensity of soil erosion and the critical condition of drainage areas. When prioritizing sub-watersheds, various factors can be considered, including soil loss, land use and land cover, morphometric characteristics, and the socio-economic conditions of the local population. A wealth of scientific studies have investigated the influence of morphometry on watershed prioritization. For instance, the authors in Ref. [
31] focused on positioning check dams by prioritizing sub-watersheds using the sediment yield index (SYI) model index. The authors in Ref. [
32] conducted research in the Guhiya basin due to the sediment yield index; additionally, the authors in Ref. [
33] examined the Nagmati river watershed for soil and water conservation activities. The authors in Ref. [
15] developed a GIS-based tool for catchment prioritization to minimize potential uncertainties. The study referenced as [
34] employed morphometric analysis to determine management priorities for nine sub-watersheds of the Piperiya primary watershed. Meanwhile, the authors in [
35] utilized morphometric techniques and watershed prioritization as strategic tools for improving management planning in the Gidabo basin, Ethiopia.
By using in-depth morphometric analysis unique to the Wadi Haly watershed, which has not been thoroughly examined in the previous literature, in this study, a substantial contribution is made to the field of soil erosion research. While previous studies, such as Ref. [
24], have utilized comparable techniques, our study sets itself apart by incorporating a wider variety of morphometric parameters and a more detailed prioritization approach tailored to local hydrological and environmental factors. Additionally, in the present paper, the emphasis is on the practical implementation of our results for the sustainable management of watersheds, addressing deep and unique challenges faced by the Wadi Haly catchment that might not apply in other areas. By identifying, analyzing, and assigning the studied sub-catchments based on their sustainability to soil erosion, in the present paper, specific intervention techniques are provided that can guide local decision-makers and the allocation of resources, thereby increasing the resilience of systems for managing water resources in Saudi Arabia.
In contrast to earlier research, which frequently restricted analysis to a smaller number of morphometric parameters, in our study, a comprehensive approach is taken by integrating a wide variety of indices to reflect the hydrological and geomorphological complexity of the catchment. In particular, the areal parameters (drainage density, stream frequency, form factor, elongation ratio, circularity ratio, and compactness coefficient), linear parameters (stream order, stream number, bifurcation ratio, stream length, and length of overland flow), and relief parameters (basin relief, relief ratio, ruggedness number, and slope) are examined. A more thorough knowledge of the mechanisms affecting soil erosion in the Wadi Haly catchment is made possible by the inclusion of these many characteristics. Another unique aspect of this study is the priority strategy used. Unlike generic ranking techniques, in the present study, a weighted ranking strategy is developed that integrates the combined influence of multiple morphometric parameters. The unique hydrological and environmental features of the Wadi Haly catchment, including the region’s arid climate, sporadic and heavy rainfall events, diverse soil types, little vegetation cover, and steep slopes, were taken into consideration when designing this system. These regional factors improve the prioritizing framework’s accuracy and guarantee that it is pertinent and applicable to the difficulties encountered in this area.
Furthermore, the sub-catchments can be divided into three different erosion risk categories (high, moderate, and low) using the composite parameter created for this study. This classification makes it easier to create efficient soil and water conservation plans and helps decision-makers pinpoint areas that need urgent attention. Examples that can be explicitly implemented in the sub-catchments that our study identified as high-risk include terracing, check dams, contour farming, and reforestation projects. The methods and conclusions of this investigation have wider ramifications than just their local significance. The enlarged collection of morphometric parameters and the thorough prioritization process offer a scalable model that may be modified for application in comparable arid and semi-arid areas around the world. This scalability guarantees that the research advances watershed management techniques in other areas dealing with similar environmental issues in addition to improving our knowledge and control of soil erosion in the Wadi Haly catchment.
In the present study, the morphometric analysis and the power of the geographic information systems (GIS) in the Wadi Haly catchment are integrated to identify the areas most vulnerable to soil erosion. Furthermore, in this study, the focus is on performing a thorough morphometric evaluation, examining several parameters that influence watershed characteristics and the dynamics of erosion processes in the sub-catchments of this study. This method supports efficient land and water resource management by offering a thorough understanding of erosion-prone areas. The results of this investigation are expected to provide essential insights for decision-makers, water resource managers, and agricultural practitioners. By pinpointing regions severely impacted by soil erosion process, this study supports the formulation of specific conservation measures and effective management strategies. Ultimately, these findings will aid in promoting sustainable land use and enhancing the management of watersheds within the Wadi Haly catchment.
2. Study Catchment
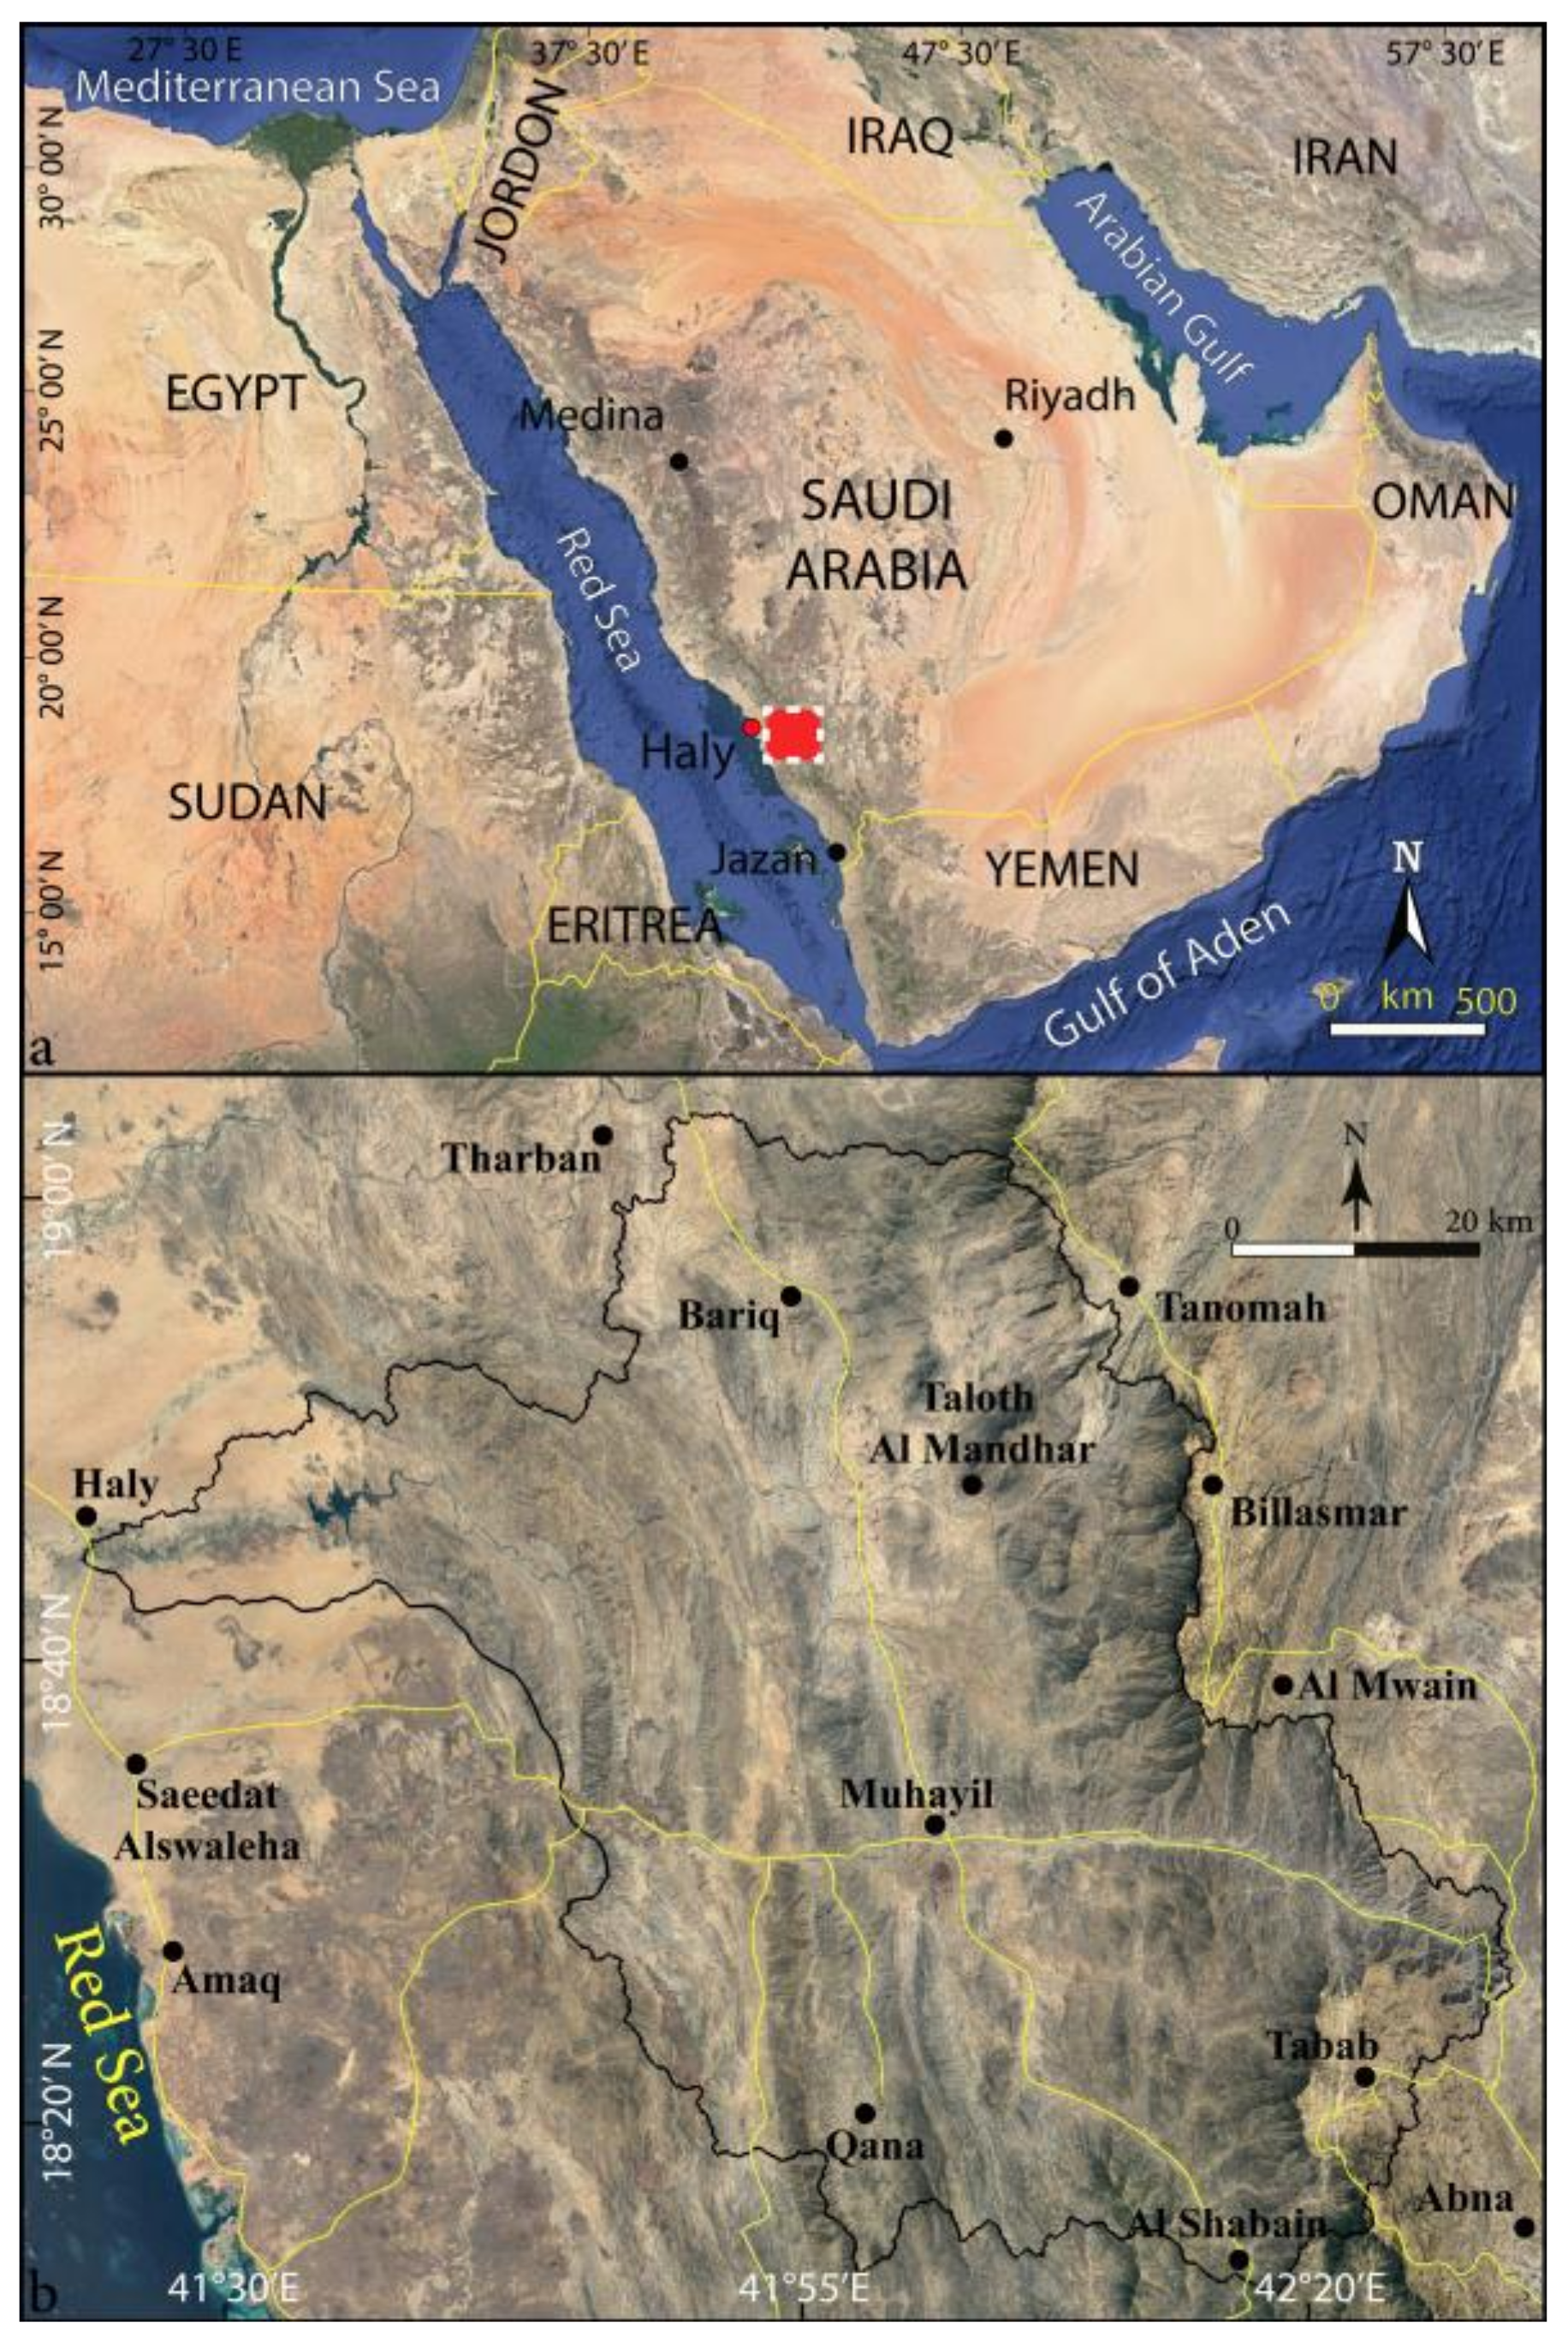
The Wadi Haly catchment is situated within the Asir Mountain region along the Red Sea coast in the southwestern part of the Saudi Arabia, primarily composed of basement rock units. It spans the latitudes 18°13′45″ to 19°02′56″ N and the longitudes 41°21′18″ to 42°29′47″ E, covering approximately 5225 km
2 and extending about 160 km (
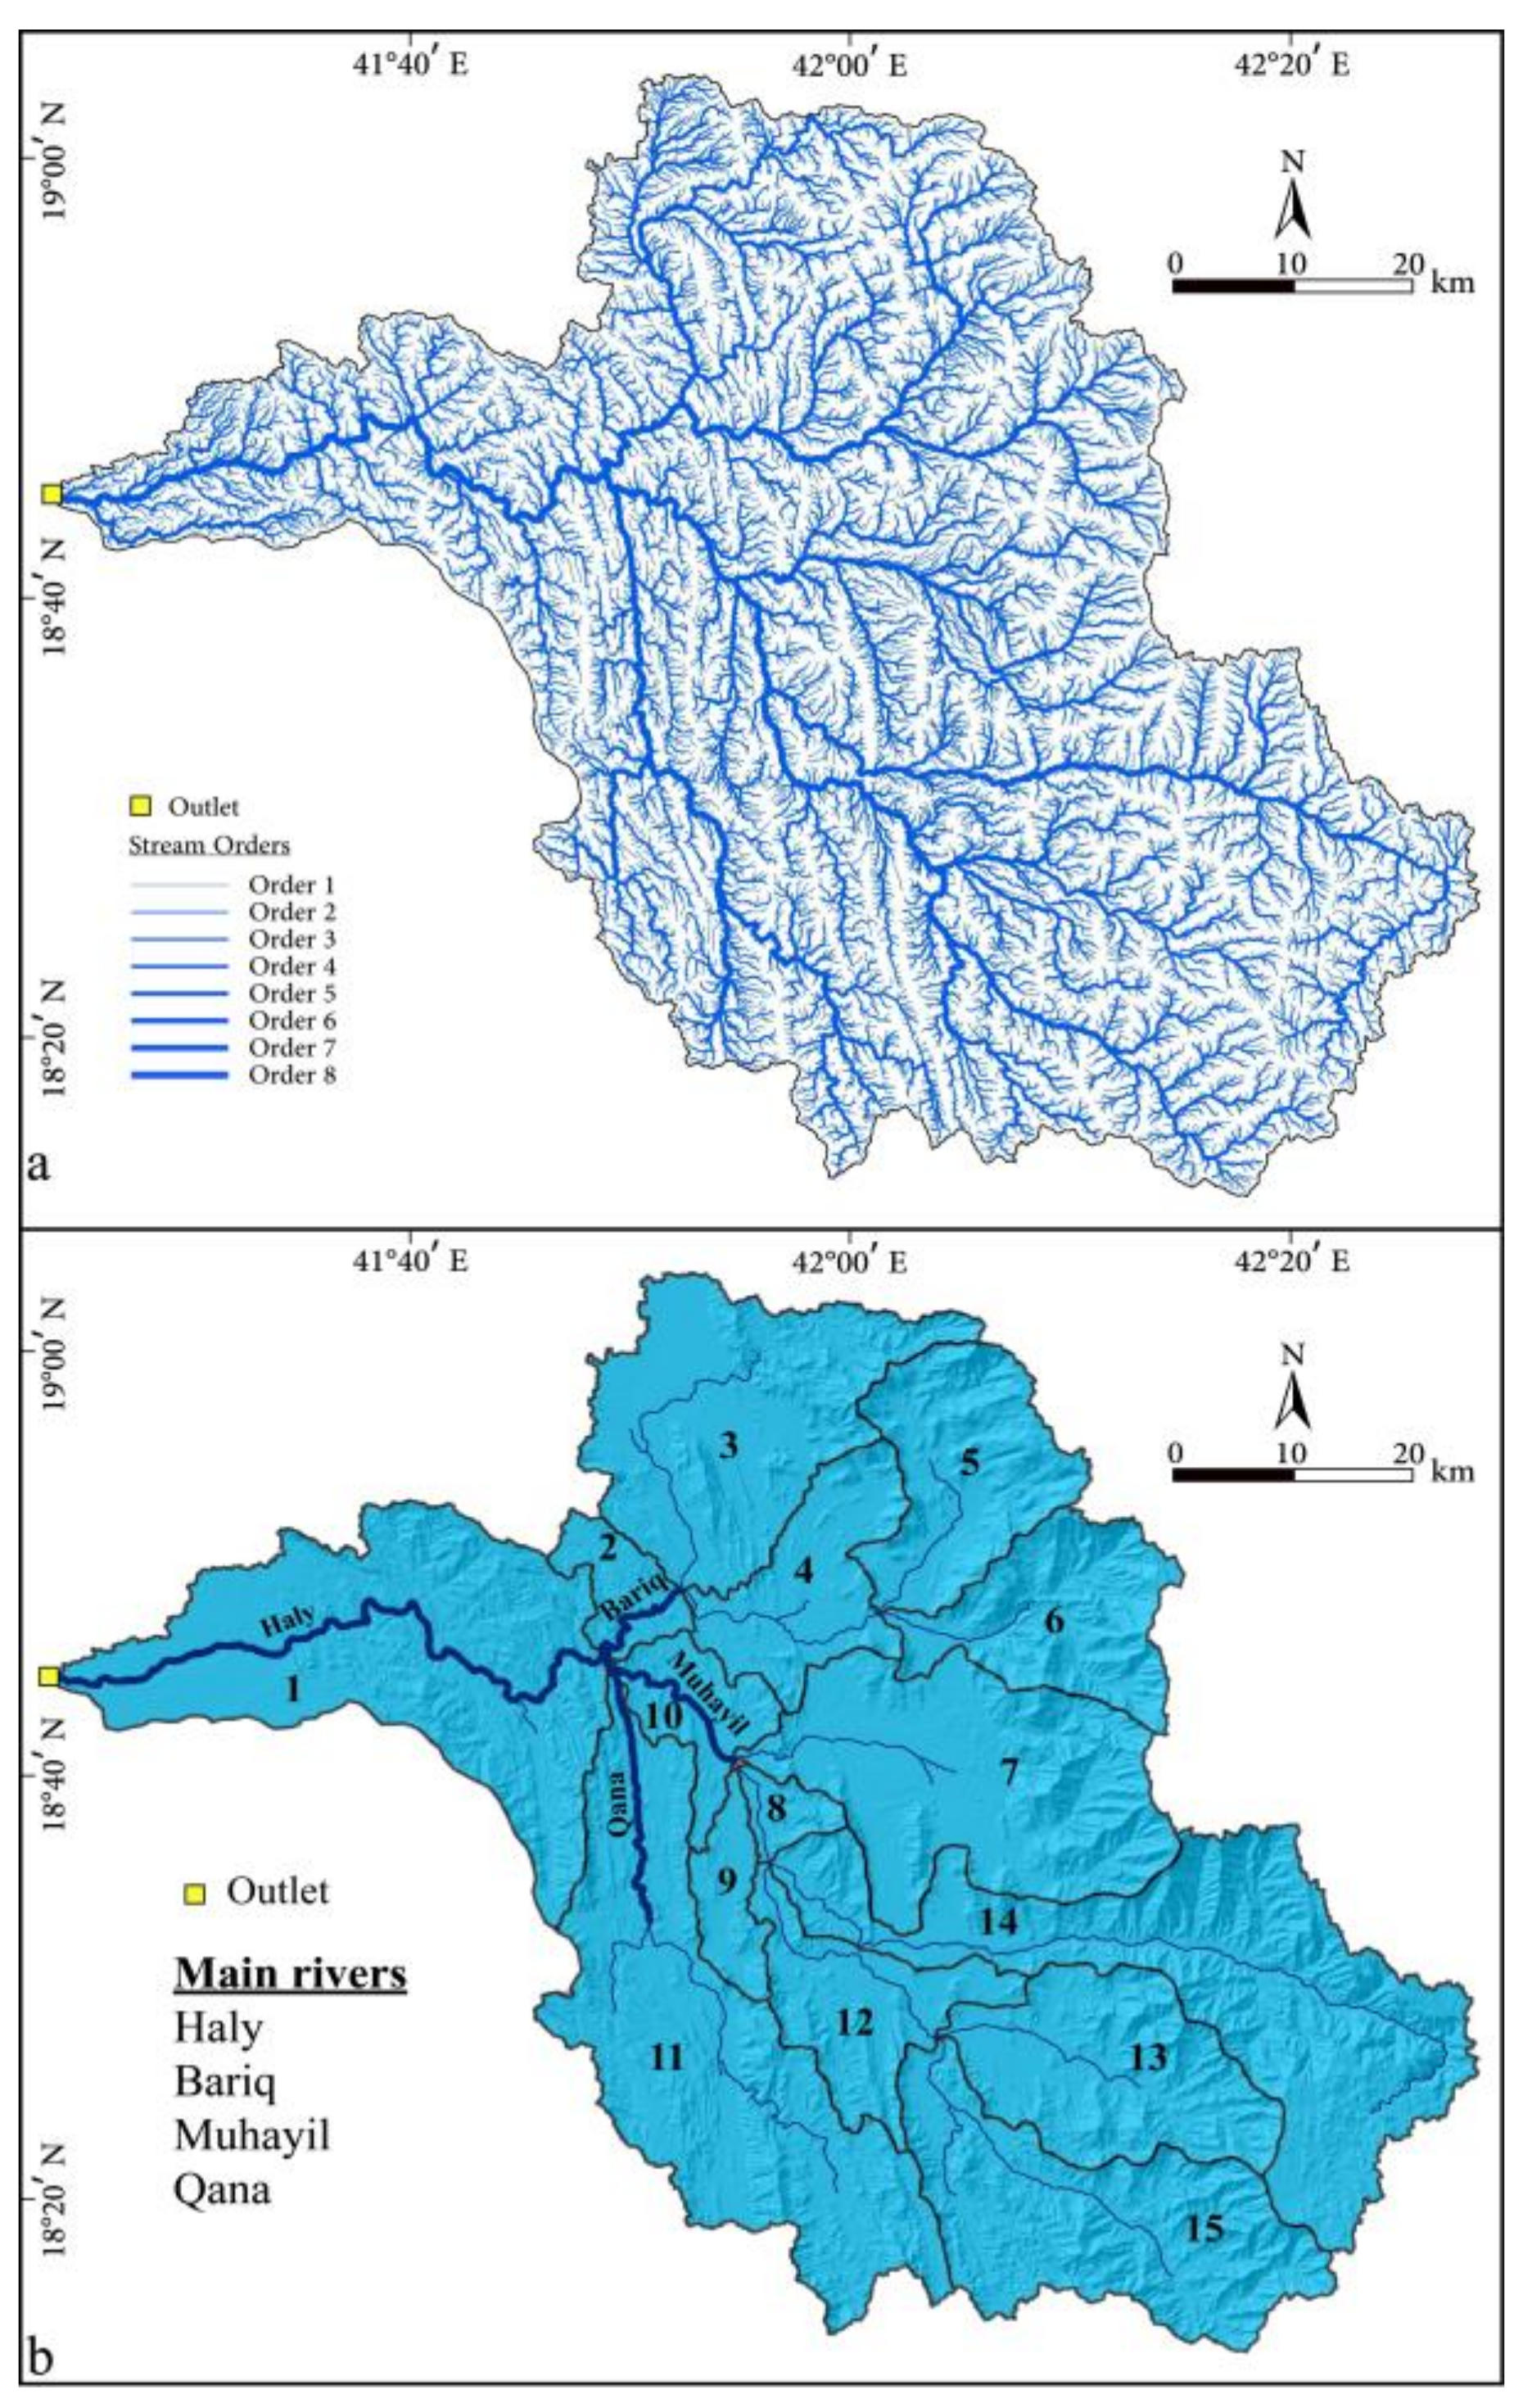
Figure 1). The landscape of the study catchment features the prominent mountains of Jabal Sawda and Jabal Thirban. The key residential areas within the region include Haly, positioned downstream along the coast of the Red Sea, and MuHayil City, which is centrally located within the catchment area (see
Figure 1). Furthermore, the Wadi Haly catchment ranks among the largest wadis on the southern Tihama Plain in Saudi Arabia. The predominant geological features of the Red Sea Hills in the southwestern part of Saudi Arabia consist of Neoproterozoic volcanic–sedimentary formations associated with the Arabian–Nubian Shield [
36]. Geologically, a thick succession of sedimentary strata, spanning from the Cambrian to the recent periods, unconformably overlies the crystalline basement (
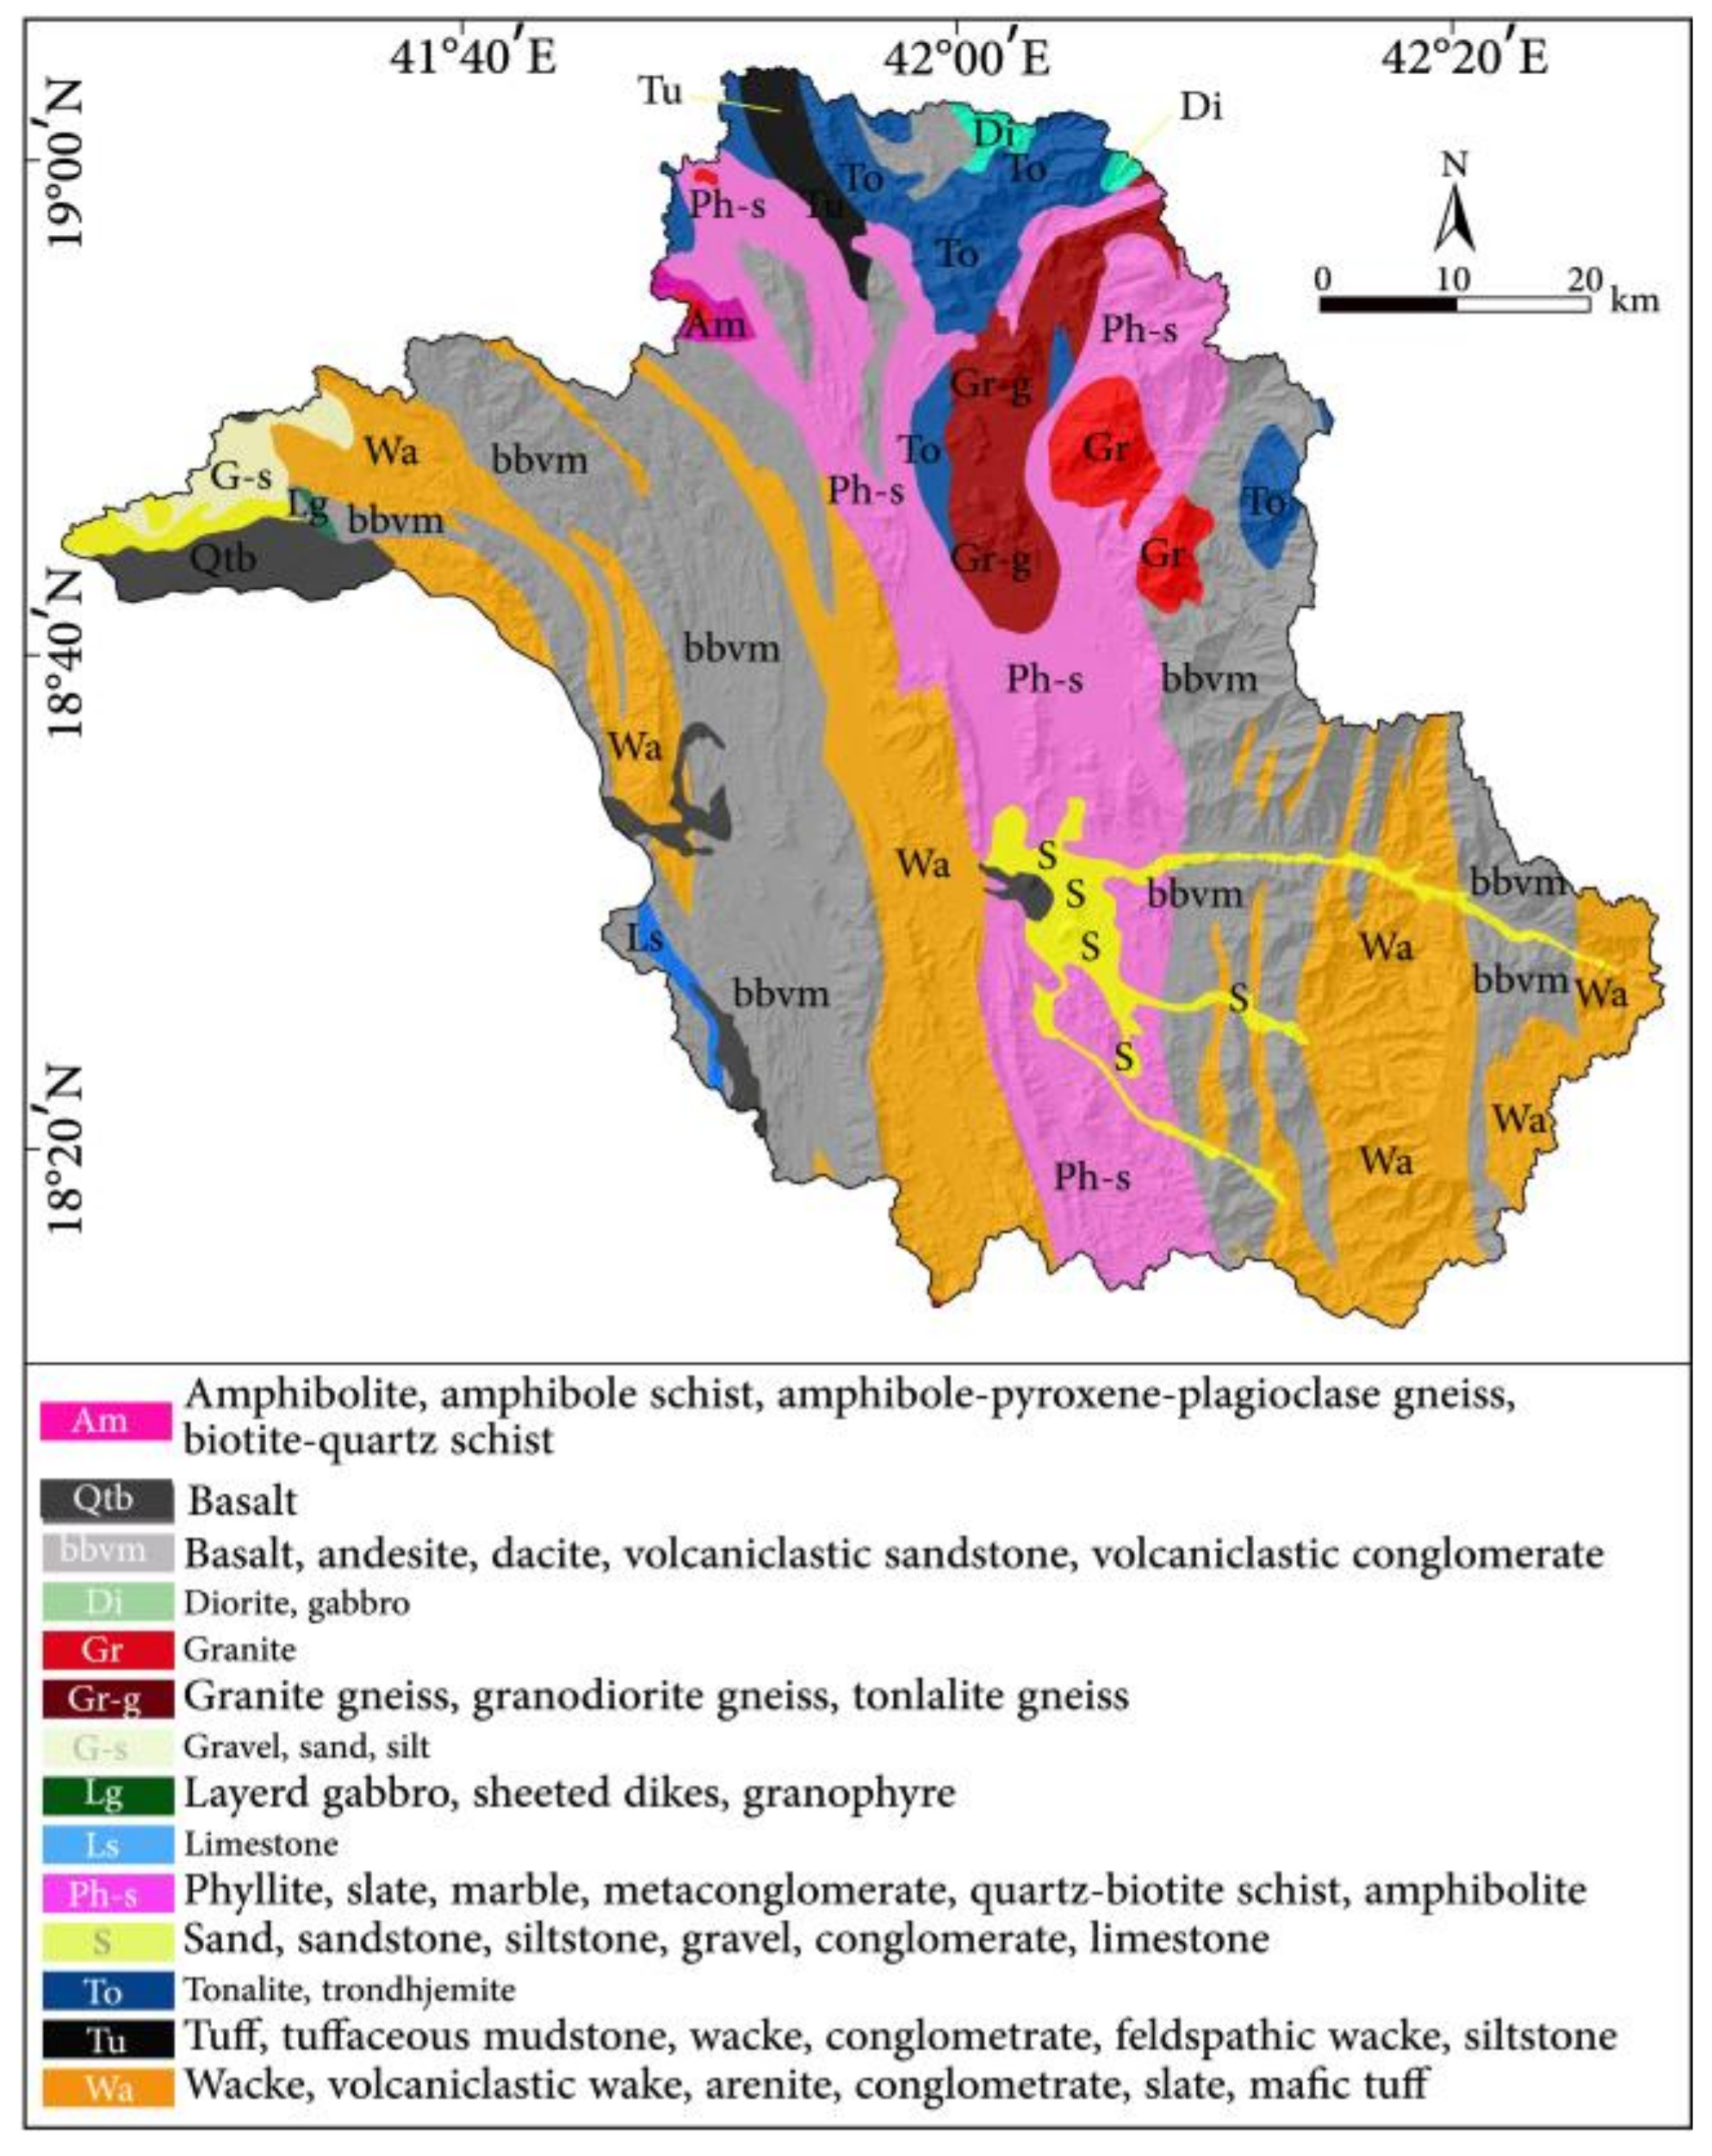
Figure 2).
Figure 2 shows the distribution of the geological units covering the study catchment. The Proterozoic crystalline rocks of the Wadi Haly catchment are characterized by numerous fractures and joints, resulting in several trending lineaments. In these arid to semi-arid regions, rainfall is inconsistent in both time and location, and its intensity can vary significantly. As a result, this can lead to sporadic flash floods that pose significant risks to dams, property, human life, and transportation [
37].
The Red Sea coast of Saudi Arabia is home to the Wadi Haly catchment, which has a varied land cover primarily composed of arid desert landscapes with little vegetation, especially in low-lying places and close to ephemeral streams. Only a small portion of the land is used for agriculture, mostly in the upstream areas, and is sustained by irrigation or seasonal rainfall. In addition, the catchment is characterized by alluvial plains below and steep topography in its higher reaches, which have an impact on the distribution of vegetation and human activity. Significant rates of erosion have been seen in regions with steep slopes and delicate soils in earlier research. For instance, the authors in Ref. [
38] emphasized how deforestation, excessive grazing, and poor land management techniques have made soil degradation worse in southern Saudi Arabia, including areas like Wadi Haly. Furthermore, in Wadi Bin Abdullah, a nearby catchment with similar geomorphological and climatic circumstances, the authors in Ref. [
39] recorded substantial rates of soil erosion and sediment movement. Their results highlight how vulnerable these catchments are to erosion during flash floods, which are common in the coastal lowlands of the Red Sea. The discussion made in these studies underscored the importance of adopting sustainable land use practices into the catchments to lower the risk of erosion and advance ecological stability. By taking these viewpoints into account, in this study, not only is the present land cover and land use in the Wadi Haly basin described, but the conclusions are also connected with more general regional issues and solutions.
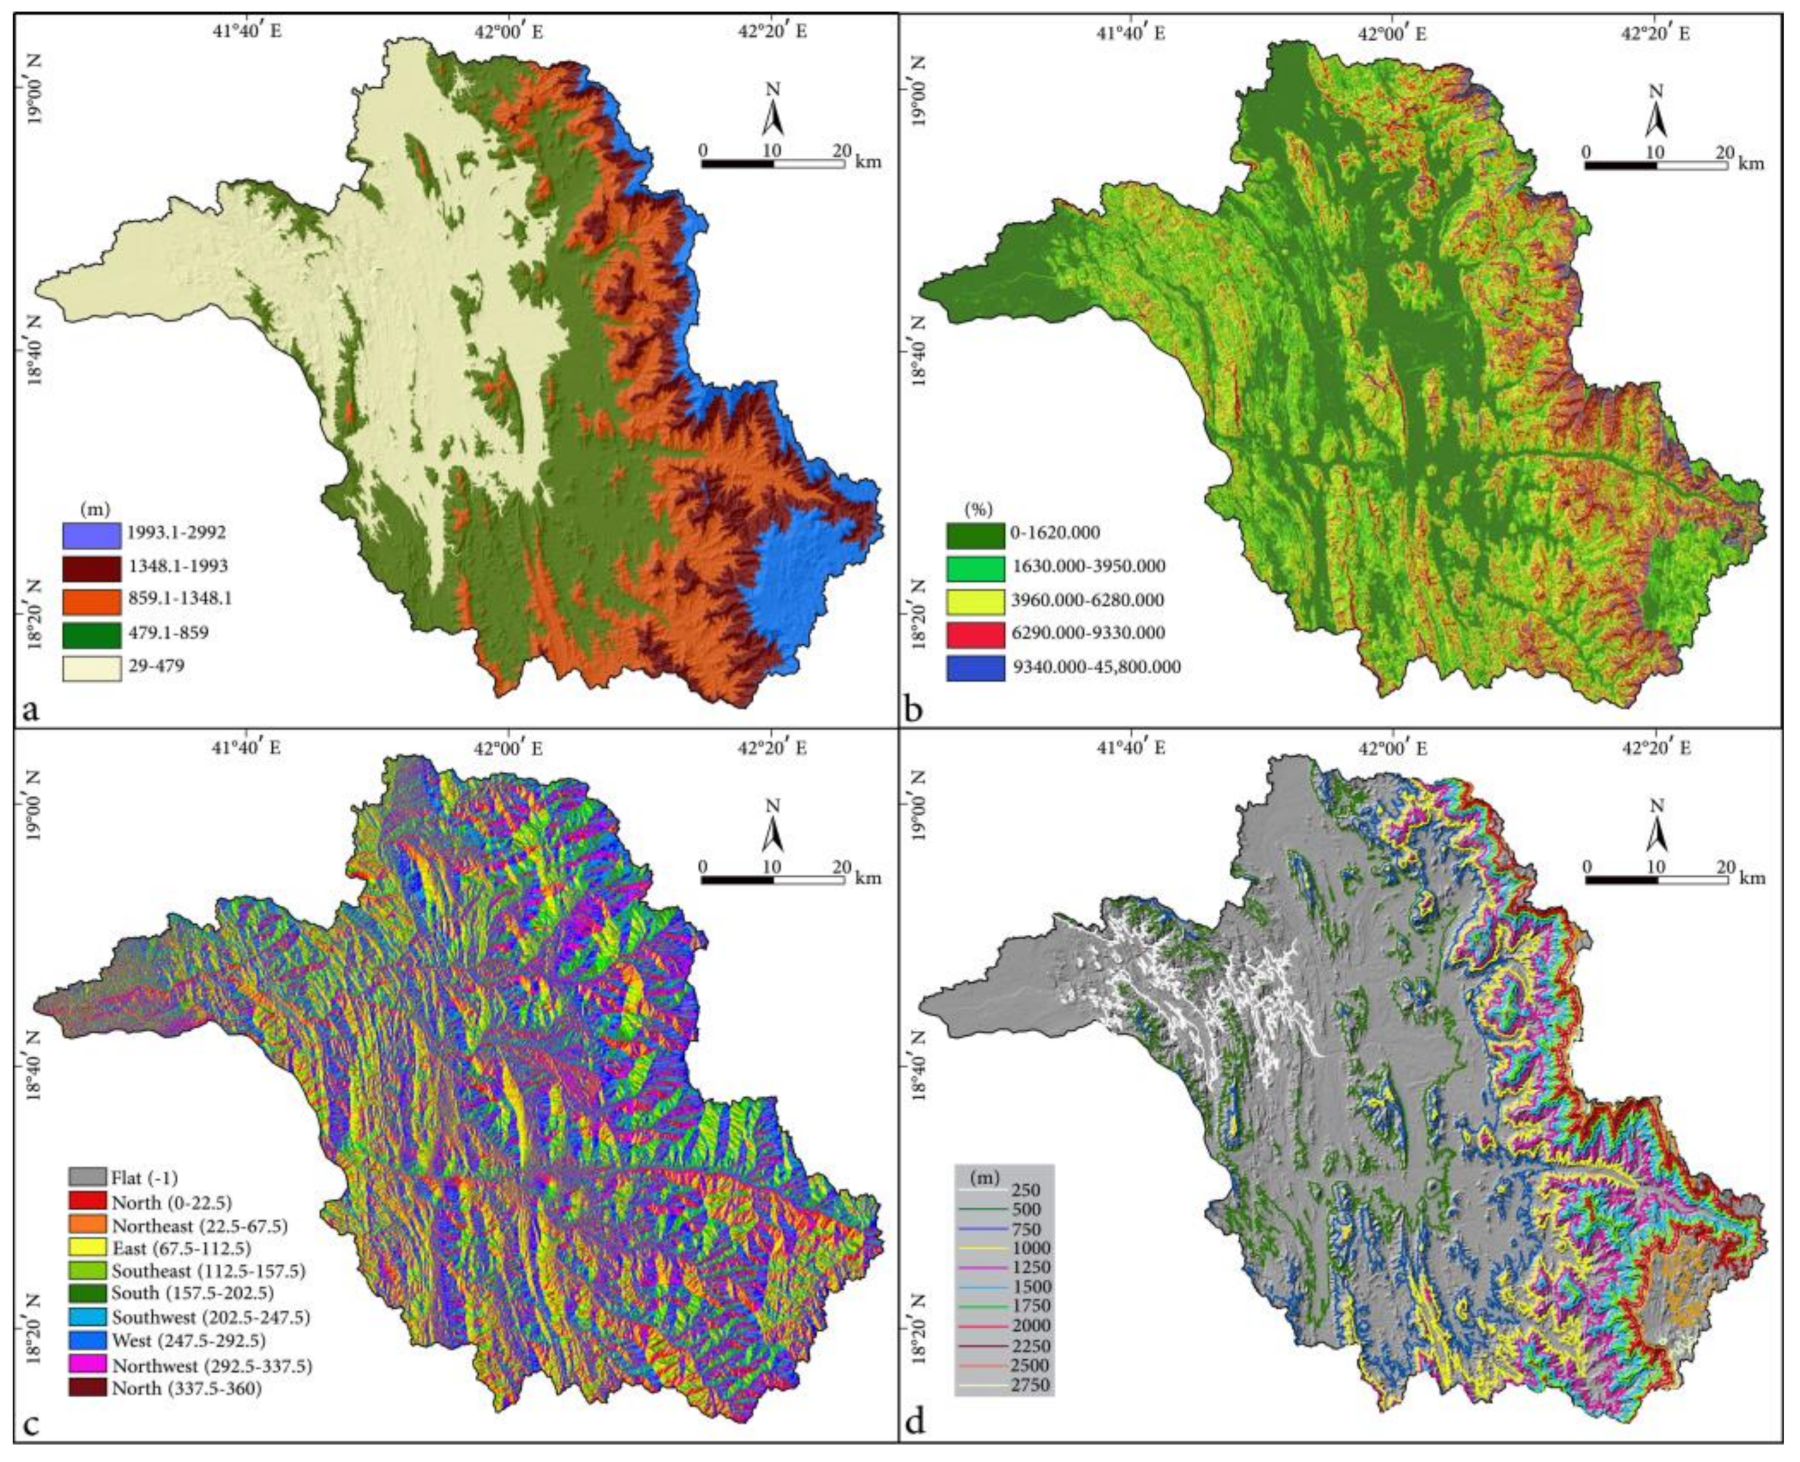
Figure 3a–d illustrate the general morphology of the study basin. The highest elevations are concentrated along the narrow eastern zones of the Wadi Haly basin. The overall slope decreases from the high elevations in the eastern parts to the lower elevations towards the Red Sea in the western parts at the basin’s mouth. Most of the Wadi Haly basin consists of mountains with high reliefs and dissected topography, divided terrain, and steep slopes. In contrast, the lower portion of the basin features a valley floor with low to moderate slopes. In summary, the slopes and various trends of the study basin are clearly depicted in
Figure 3.
3. Data and Methodology
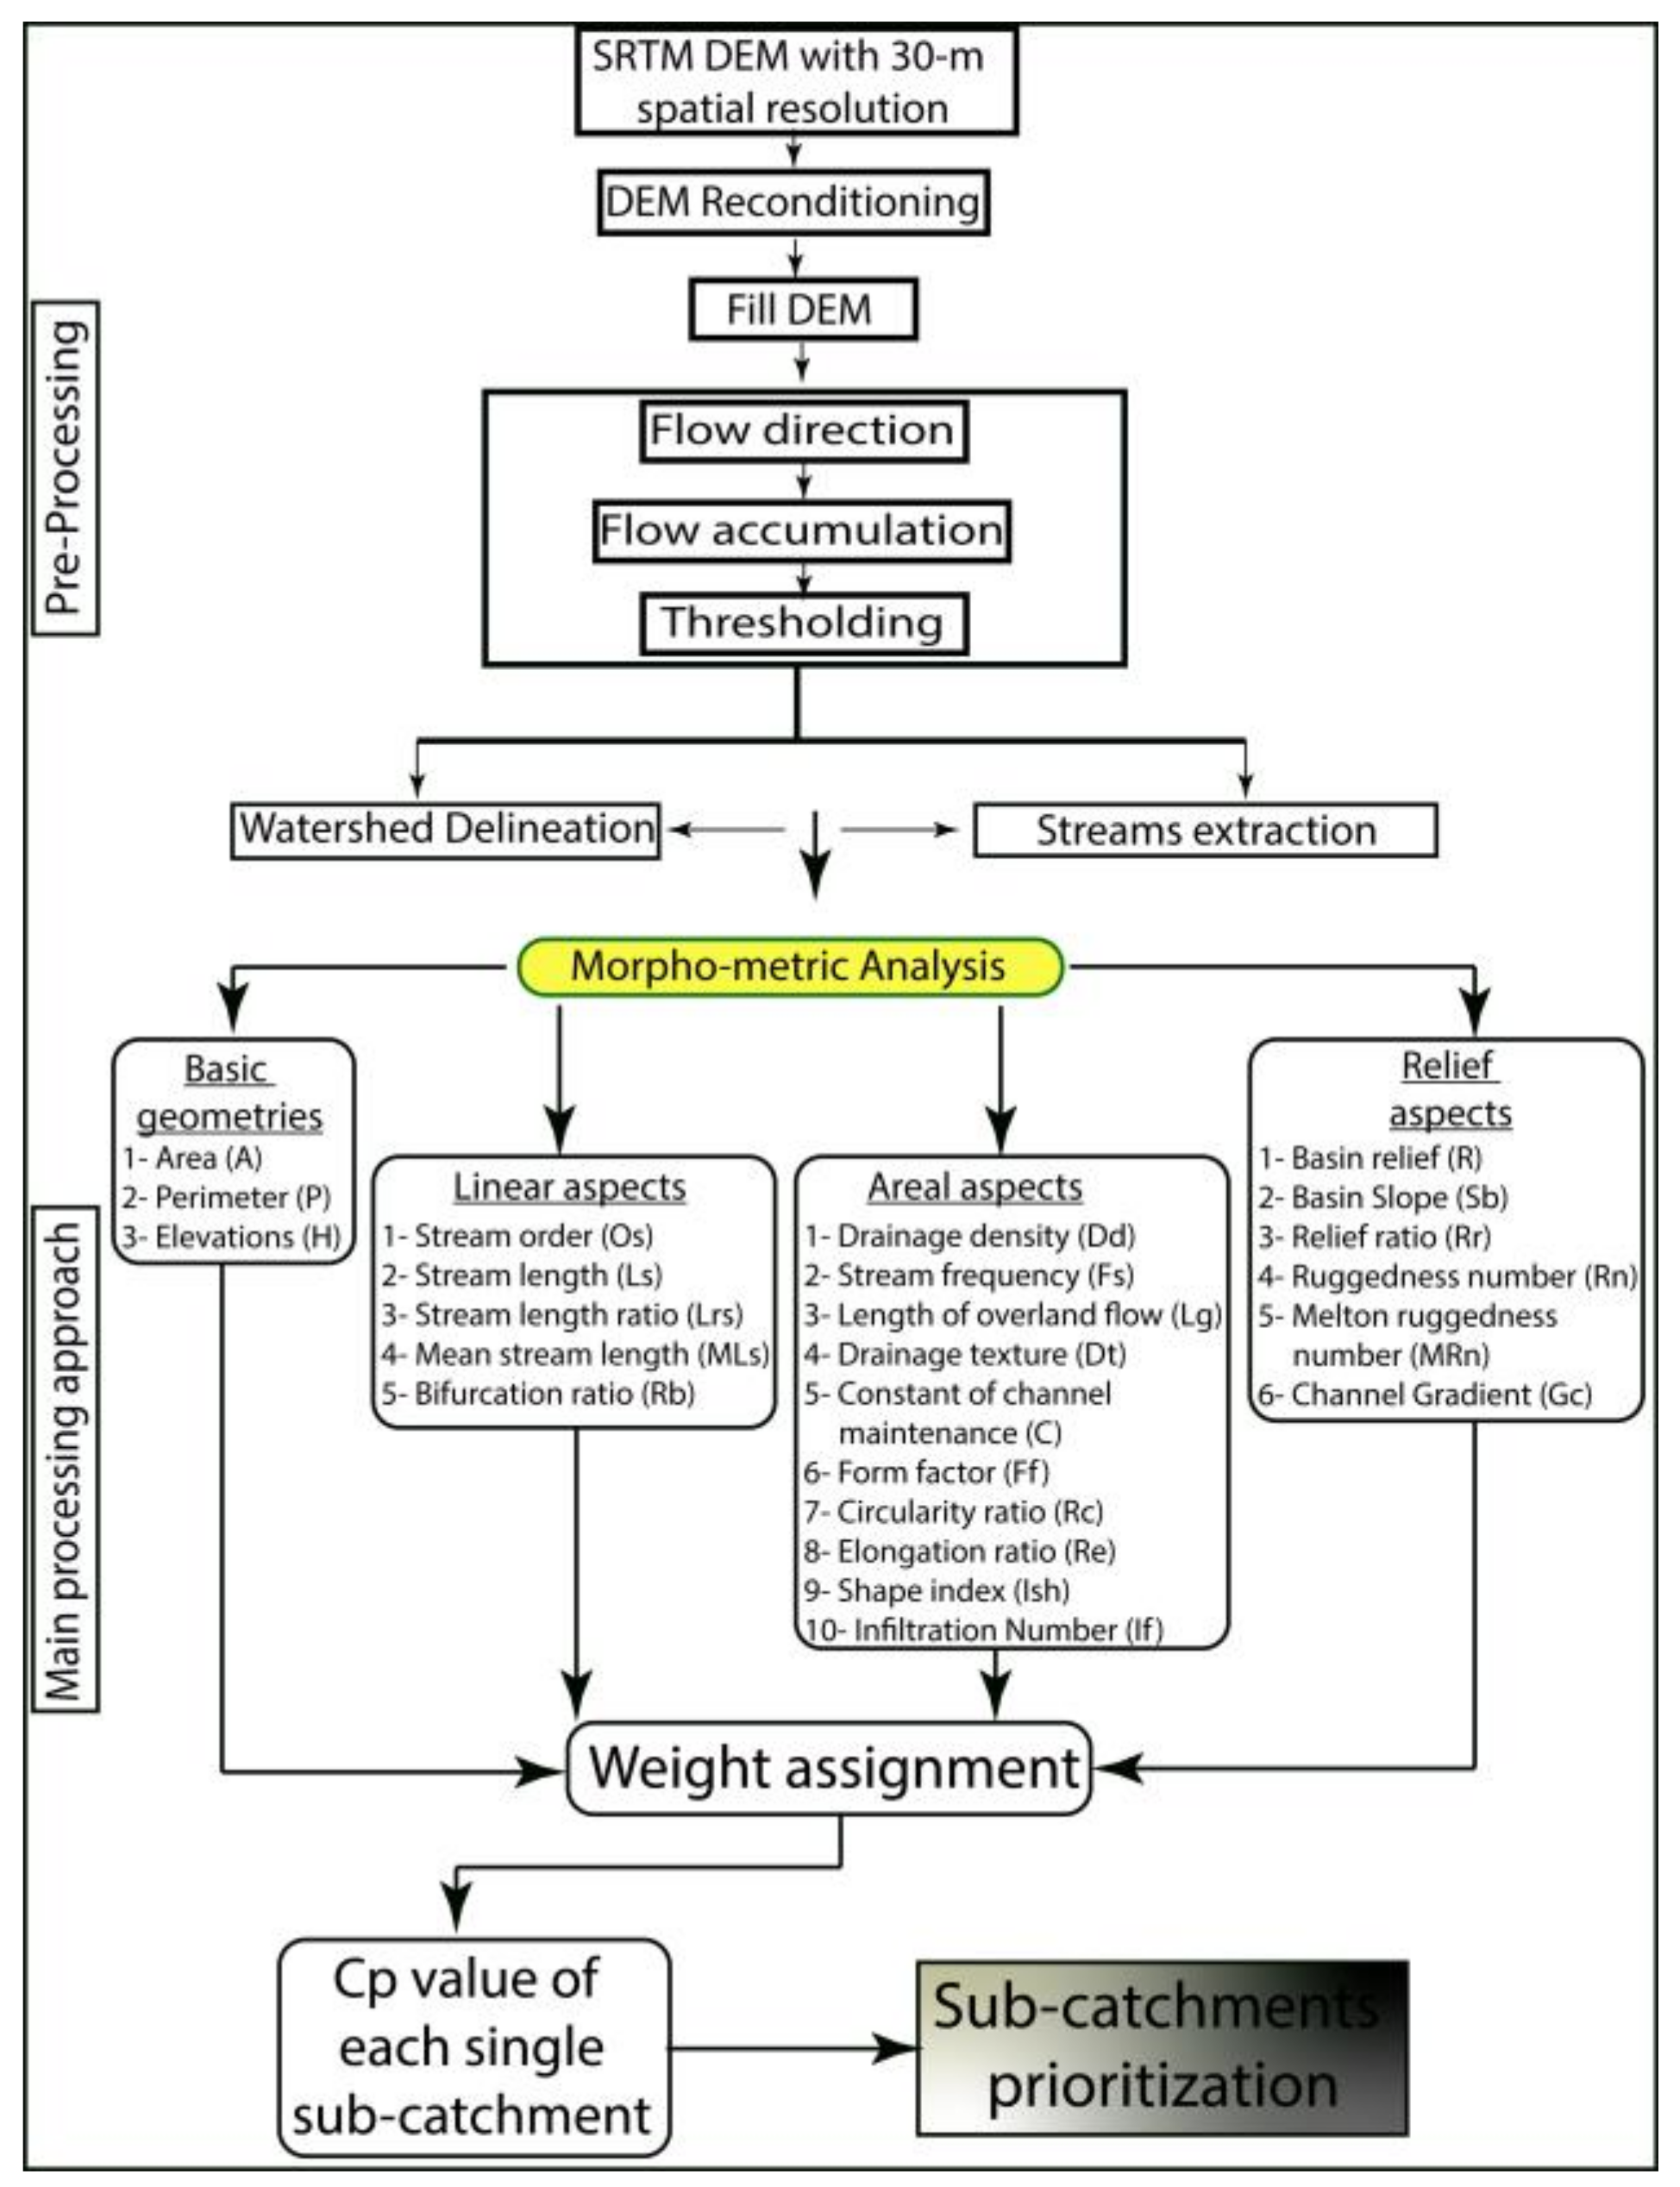
The current study employs a 12.5 m spatial resolution digital elevation model (DEM), derived from the Advanced Land Observing Satellite (ALOS) PALSAR data, accessed through the Alaska Satellite Facility. The DEM provides the critical topographic detail necessary for deriving morphometric properties and evaluating terrain structure. Developed by the Japan Aerospace Exploration Agency (JAXA), ALOS PALSAR’s L-band radar data offer reliable elevation information, capable of penetrating vegetation cover to reveal surface features even in rugged or densely vegetated areas. This dataset enabled the precise calculation of geomorphological characteristics like slope, aspect, and watershed boundaries, all of which are key to identifying soil erosion potential in the Wadi Haly catchment. In addition, we integrated topographic maps from the Saudi Geological Survey (SGS), specifically sheets 70C, 75C, 74C, and 94C, to support and enhance the DEM-derived drainage networks and watershed boundaries. These SGS topographic sheets offer detailed cartographic information, including contour lines and drainage features, which provide essential ground-level validation for DEM analysis. By combining these data sources, we achieved a refined and detailed spatial analysis of areas susceptible to erosion, as well as an in-depth understanding of watershed characteristics within the Wadi Haly catchment along Saudi Arabia’s Red Sea Coast. Using topographic maps and a digital elevation model (DEM), we conducted an analysis of the catchment area that focused on sub-catchment boundaries and drainage networks. The DEM was key for calculating the geomorphological parameters, delineating smaller catchment areas, filling any depressions, and determining flow direction and accumulation. This combination of data helped map the stream networks within the catchment, offering essential insights for identifying areas most susceptible to soil erosion. Such wide knowledge makes it possible to develop targeted soil erosion management plans that satisfy the urgent needs of different terrains, allowing conservation actions to be directed accurately where they are most required [
3,
15,
24,
29,
40] (
Figure 4). Each single sub-catchment underwent a morphometric investigation, which examined the basic, areal, relief, and linear features. A priority rank assessment was given to each of these morphometric factors based on how relevant they were to the soil erosion processes. Compound parameter (CP) was assigned for every single sub-catchment to effectively help in conservation planning. The values of the sub-catchments served as a foundation for ranking interventions based on the importance of agriculture, land use priorities, and the level of soil erosion risk. A strategy for managing soil erosion and watershed health is supported by this prioritizing technique, which is processed with the help of GIS-based technologies such as ArcGIS 10.4. ArcGIS 10.4 provides an effective way of defining conservation concerns at the local and regional scales by facilitating a thorough examination of morphometric parameters and supporting the prioritization method.
For the morphometric analysis and sub-catchment prioritization strategy in various watershed studies, ArcGIS 10.4 is a very useful software version to achieve the proposed tasks. In the present study, the basic and relief characteristics were among the tools used to prioritize sub-catchments. Significant physical attributes, including height, total area, average perimeter, entire length, and the exact number of major rivers and streams, were digitally obtained for every single sub-catchment using GIS 10.4 software. The catchment total area, or the total surface that drains into a particular form of water, was initially determined using specific spatial analysis tools. Because it identifies sub-catchments with wider surface areas that can intercept rainstorms and with longer drainage streams that allow greater water storage and flow, this catchment area is crucial for a greater understanding of the morphometric aspects. Additionally, important parameters that characterize watersheds include the total perimeter, average stream order, total stream count, and stream length. The perimeter represents the complete boundary length of the catchment. The higher-order rivers and streams are more susceptible to significant runoff and soil erosion, owing to their steeper slopes and more extensive drainage areas when compared to lower-order streams. A more complex drainage network is assigned by more major rivers and streams in each order, and longer water branches are more vulnerable to surface runoff and soil erosion processes during heavy storms because they can accumulate and carry water downhill for longer distances and periods of time. Drainage textures are classified into several categories, including <2 (very coarse textures), 2–4 (coarse textures), 4–6 (moderate textures), 6–8 (fine textures), and >8 (very fine textures), as noted in Ref. [
41].
Watershed features, encompassing derived, area-specific, and relief elements of morphometric parameters, significantly impact runoff and sediment movement, which are critical factors in assessing soil erosion risk. Watersheds characterized by steep gradients and dense drainage networks are generally at a higher risk for erosion than those with milder slopes and less dense drainage. To systematically assess this risk, the mathematical equations outlined in
Table 1 are utilized to extract parameters following the collection of fundamental morphometric data through GIS techniques. Important indices for evaluating soil erosion include drainage density (Dd) and bifurcation ratio (Rb). These indices are calculated by first establishing catchment boundaries using the Hydrology tools available in ArcGIS, generating a stream network from digital elevation model (DEM) data, and then determining the stream order along with the cumulative length of the streams in the network. Specifically, drainage density is derived by taking the total length of the streams and dividing it by the area of the catchment, while the bifurcation ratio is found by dividing the count of streams of order u. Furthermore, areal parameters derived from fundamental characteristics provide valuable insights into the catchment’s overall shape; for instance, catchments with elevated circularity ratios are typically less prone to erosion. This enables the identification of susceptible watershed regions through GIS mapping techniques that analyze the circularity ratio. In this investigation, the methodologies outlined in
Table 1 were employed using ArcGIS 10.4 to categorize the Wadi Haly catchment into 15 distinct basins, each exhibiting eight unique stream orders. The primary rivers within this catchment include Haly, Bariq, Muhayil, and Qana, each of which traverses multiple sub-catchments, thereby influencing the region’s hydrological framework.
Compound Value Estimation for Every Sub-Watershed
The compound values strategy (CP) represents an aggregated ranking system that is working to prioritize different watersheds by consolidating various morphometric effective factors into a distinct score. To calculate CP, the ranks assigned to each single morphometric factor are summed and then divided by the total count of parameters (N) considered. These ranks reflect the relationship of each single parameter to the risk of soil erosion process. Once the estimated values are computed, catchments can be organized based on their scores, with the highest level of priority for soil erosion control assigned to those watersheds exhibiting the greatest compound values. In this study, sub-catchments are evaluated and ranked due to their soil erosion rates using the computed CP by following these steps: first, identify the morphometric factors that are either positively or negatively associated with erosion risk; second, rank each factor based on its significance to erosion susceptibility; third, apply the formula /N to derive the effective compound value technique for each sub-catchment; and fourth, classify the sub-catchments into three distinct groups—high, moderate, and finally low priority—based on their soil erosion significance.
4. Results and Discussion
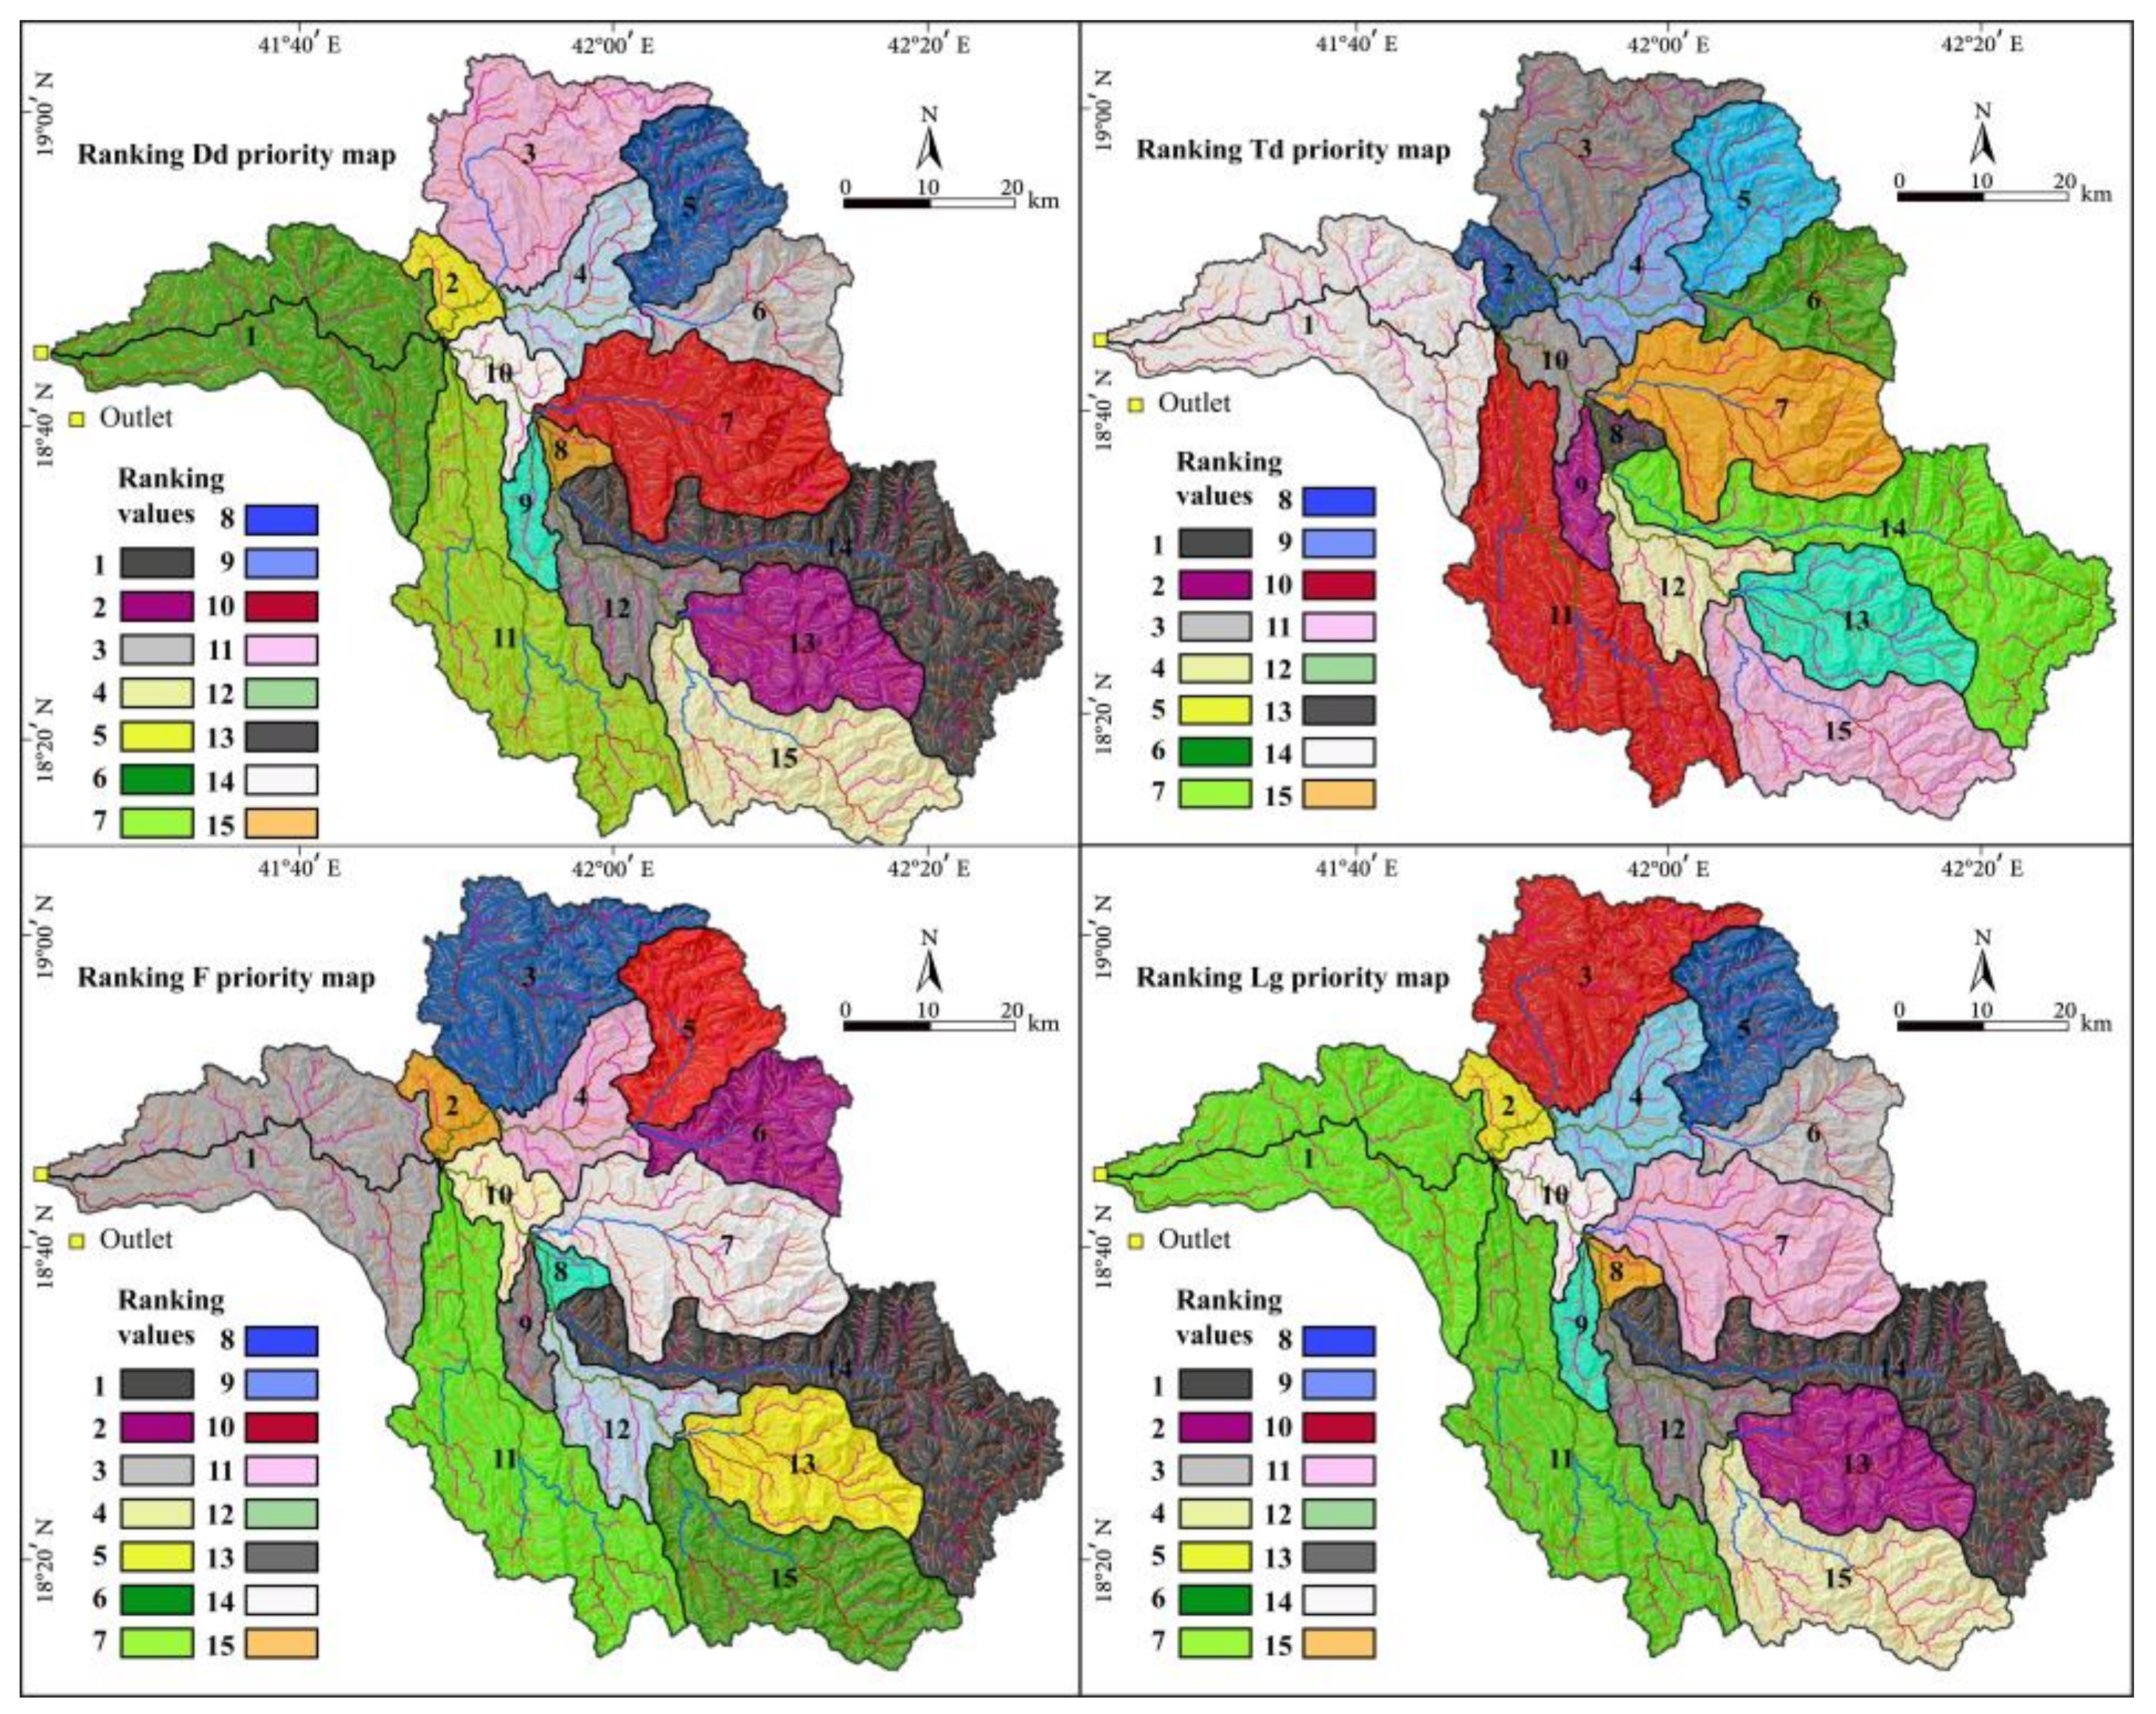
Understanding the physical features and characteristics of the Wadi Haly catchment is fundamental to assessing the potential for soil erosion and developing effective strategies to mitigate its impact, as these attributes significantly influence both the rate and severity of erosion processes. Several factors including the vegetation cover, soil composition, and morphology of the different landforms, interact to interpret how erosion occurs in the area. Furthermore, when integrated with the influence of climatic change and human activity, these various physical characteristics are essential for accurately understanding patterns of the soil erosion process. Workers can use targeted ways to stop soil degradation and provide significant insights into the regions’ unique vulnerabilities by carefully investigating the catchment’s geology, topography, and hydrology characteristics. Four very effective essential morphometric elements, namely primary, linear, areal, and relief, were examined and analyzed in order to efficiently assign and rank catchments or sub-catchments vulnerable to soil erosion risk. Examining each of these parameters is very important for enhancing our knowledge and increasing the accuracy of soil erosion forecasts, which could allow us to build detailed mitigation plans for high-risk regions. By regulating the flow and speed of water over the landscape, linear and relief aspects have a direct relation to soil erosion process, while areal morphometric parameters have typically an indirect relation to soil erosion process. In the present study, we could assign a great deal about the dynamics of erosion process and create more potent solutions to stop or at least minimize soil degradation in areas that are susceptible by thoroughly examining these parameters. In the proposed sub-catchments, this all-encompassing plan promotes long-term vulnerability and ecological health in addition to aiding with immediate mitigation efforts. The authors in Refs. [
3,
47] observed that sub-catchments with high values of the areal parameter are shorter in perimeters, circular in form, and exhibit lower levels of soil erosion process. Sub-catchments that reflect elevated values for the parameters of linear and relief aspects, including stream frequency, drainage density, total overland flow length, relief ratio, basin relief, and roughness number index, are more prone to soil erosion due to more surface runoff and high steeper slopes [
21,
35]. In this study, we explored the relationships between selected parameters and soil erosion across various catchments, including the Kalvari catchment in Iran, the Gidabo catchment in Ethiopia’s Rift Valley, the landscape of Neom City in Saudi Arabia, and the Oued Amter catchment in Northwest Morocco. This investigation indicates that the specific morphometric characteristics affecting soil erosion are unlikely to be identical across different catchments. However, the circulation ratio remains relatively constant, the outcomes of other metrics differ among the catchments, highlighting variations in their impact. Several factors, such as rainfall patterns, intensity, slope features, drainage systems tied to the topography, geology, soil composition, and land use and cover, contribute to this variability. Furthermore, in contrast to relief and linear features, areal parameters such as the elongation ratio, circularity ratio, compactness coefficient, and form factor index tend to show a weaker association with soil erosion. As depicted in
Figure 4 and
Figure 5a,b, the Wadi Haly catchment is segmented into 15 sub-catchments based on flow direction and stream flow. To evaluate the risk of soil erosion in each sub-catchment, we ranked them according to various morphometric parameters and assessed the previously identified factors.
4.1. Basic Geometries of the Wadi Haly Catchment
Basic geometric parameters play a pivotal role in hydrological modeling, watershed management, and soil erosion studies, as they allow for the assessment of how water moves through the landscape and how different features influence this movement. For instance, parameters such as catchment area, perimeter, and length can help determine the drainage efficiency and potential runoff characteristics. Furthermore, the shape of a catchment can significantly impact erosion patterns and sediment transport, which are vital for maintaining ecosystem health and preventing land degradation. Ultimately, a thorough understanding of these basic geometric parameters is essential for effective catchment management and sustainable environmental practices. The Wadi Haly catchment is 14,793.81 km
2 in total area and has a circumference (perimeter) of 487.65 km. As illustrated in
Figure 4 and
Figure 5b, the Wadi Haly sub-catchments have areas and perimeters that range from 40.06 to 691.93 km
2 and 30.82 to 211.23 km, respectively. High levels of soil erosion are typically detected in larger sub-watersheds (
Table 2). This occurs due to extended overland flow durations, which provide enough time for runoff to thoroughly wash away soil particles before they reach a stream. Therefore, the sub-catchments could be assigned from lowest perimeter to highest perimeter [
40]. Due to the results of Refs. [
40,
48], the region has higher values of characteristics that are significantly impacted by soil erosion. Nevertheless, this is not always the case for all watershed studies in the different regions. The findings of this study indicate that sub-catchments 14 and 10 hold the first and last positions, respectively, when evaluated by their perimeter values. In contrast, these sub-catchments are categorized as having moderate and high risks of soil erosion, respectively, according to the overall average ranking of all defined characteristics. To prioritize sub-catchments, the authors in Refs. [
24,
40] emphasized the importance of identifying additional effective elements that aid in soil erosion processing, such as land use actions, different soil types, slope, and climatic changes. This suggests that the area and perimeter by themselves are not capable enough of assessing soil erosion rates in sub-catchments since other factors could influence low or high classes of soil erosion process. As suggested by Refs. [
40,
49,
50], several different effective morphometric parameters, including basic, relief, linear, and areal signatures, may be applied by specialists to compare different sub-watersheds.
In addition to the previously mentioned factors, several essential parameters, including stream order index, stream number index, stream length index, and average elevation, play a crucial role in identifying catchments that are particularly susceptible to soil erosion. These parameters not only help evaluate how physical characteristics of the watershed influence erosion processes but also aid in pinpointing specific catchments that require targeted mitigation strategies. Stream order, which reflects the hierarchy and arrangement of major rivers and streams within the studied watershed, is a significant indicator of the complexity of different drainage systems. Regions of high stream order typically show steeper slopes, long streams, and dense drainage patterns all of which are characteristics that are associated with increased soil erosion potential. More intricate drainage systems can improve soil dissociation and enable quicker water flow. Faster water flow and better soil dissociation could be possible by more complex drainage networks. Workers and land leaders can more effectively manage to plan their soil conservation actions by defining these correlations, which will guarantee that the most susceptible sub-catchments receive the resources and attention they need for efficient soil erosion control techniques. Numerous workers have examined the idea of the stream order system, most notably in the studies cited in Refs. [
9,
11,
16,
40]. Streams can be defined and classified hierarchically using this method, which makes it easier to understand how they relate to their different tributaries. Researchers can successfully show how minor streams feed into larger waterways by providing streams with numerical numbers according to where they are in a drainage system. This technique not only helps in the meaning and visualizing of hydrological information but also improves our understanding of watershed dynamics and the different ecological processes that occur within the proposed systems. The investigation of stream order framework is very helpful in various fields including hydrology and environmental management, because it provides valuable information on water flow systems, sediment carrying, and the overall health of aquatic ecosystems. First-order small rivers are typically the shortest, while second-order streams start running when two first-order branches merge. This hierarchical structure continues, with two second-order streams joining to create a third-order stream, and so forth. Within the Wadi Haly catchment, various sub-catchments exhibit different stream orders, as follows: one sub-catchment has an eighth-order stream (Sub-C1), several sub-catchments contain seventh-order streams (Sub-C2, Sub-C4, Sub-C8, Sub-C10, Sub-C11, Sub-C12, and Sub-C15), and one sub-catchment has a fifth-order stream (Sub-C5) (
Table 3;
Figure 5b). Stream order is inversely related to the number of streams within a watershed, as higher-order streams are generally formed by the convergence of multiple lower-order streams, resulting in fewer streams as total stream order increases.
Table 1 illustrates the relation between total stream order, stream count, and stream length across sub-catchments in the study area, with stream counts ranging from 15,263 for the first order down to 1 at the eighth order, totaling 19,945 streams within the Wadi Haly catchment (
Table 3). Sub-catchment 11 has the highest number of streams (2588), while sub-catchment 8 has the fewest (165). This analysis underscores the importance of stream length in evaluating soil erosion potential, as longer stream paths can accelerate erosion. Geographic Information System (GIS) tools, particularly when integrated with digital elevation models (DEM), offer a precise means of measuring stream length and other morphometric characteristics, which are valuable for implementing targeted soil conservation strategies. Many studies indicate that the length of streams generally decreases as total stream order minimizes, with first-order streams typically being the longest and higher-order streams becoming progressively shorter [
24,
51,
52,
53,
54,
55].
4.2. Linear Features of the Wadi Haly Catchment
High densities of streams and channels in catchments are typically indicated by elevated values in stream length ratios, bifurcation ratios, and drainage densities, all of which can contribute to a higher susceptibility to erosion. Likewise, watersheds with longer overland flow paths and high stream frequencies often support greater water volumes and flow velocities. These characteristics, influenced by drainage structure and flow dynamics, generally correlate with a greater potential for soil erosion. In this study, stream length ratios serve as indicators of water transport efficiency, with higher ratios in lower-order streams suggesting slower flow and increased infiltration, potentially reducing erosion risks. Lower stream length ratios (Rl), on the other hand, may signal more rapid water flow, contributing to elevated erosion risks. For example, bifurcation ratios in this study range from 3.08 in sub-catchment 8 to 4.35 in sub-catchment 14, with higher bifurcation values generally indicating denser stream networks, where sediment can settle and reduce further erosion. In sub-catchment 7, a dendritic drainage pattern is supported by higher bifurcation ratios, which could amplify erosive forces and speed up runoff collection. Conversely, sub-catchment 8’s lower bifurcation ratio of 3.02 suggests a less erosion-prone environment. Previous studies on erosion-prone areas recommend prioritizing high-risk regions for resource allocation and targeted soil preservation efforts, combining bifurcation and other morphometric factors to improve erosion control and landscape sustainability. The authors in Refs. [
3,
24,
51] said that high rates of drainage density are recorded due to weak or impermeable underlying soils, steep sloping, and sparse vegetation cover. They also suggested that low topographic levels and highly penetrated underlying soils beneath dense vegetation cover are the major reasons to record low values of the drainage density parameter. The results of the current study infer that sub-catchment 14, with its high rates of permeable material, low reliefs, minimal surface runoff, and high infiltration, has a low value Dd parameter as 0.33 km/km
2 (
Table 4;
Figure 6). It can additionally suggest how well a catchment drains water because this morphometric parameter assigns the number of rivers and streams per unit area of a catchment [
16,
24,
40]. In morphometric analysis, stream frequency (F) reflects the concentration of streams in a catchment area, often showing a positive relationship with drainage density (Dd), as a higher Dd typically corresponds with an increased number of stream channels. Sub-catchments 8 and 7 exhibit the highest values for drainage density (Dd) index, drainage texture (Dt) index, and overland flow length (Lg) index, measuring 3.57 km/km
2, 18.74 km
−1, and 1.78 km, respectively (see
Table 4 and
Figure 6). These values suggest that much of the Wadi Haly catchment has a rapid runoff surface, particularly in regions having steep slopes with limited soil permeability, which commonly leads to high rates of drainage density and stream frequency. An inverse relationship is observed between overland flow length and drainage density, indicating that as drainage density increases, overland flow length generally decreases, and vice versa. Sub-catchments with lower Lg are more vulnerable to soil erosion after heavy rainfall, given their shorter flow paths, enhanced runoff, and reduced infiltration. In the Wadi Haly catchment, drainage texture is notably coarse across all sub-catchments, with Sub-C 8 and Sub-C 7 showing the minimum and maximum values of drainage texture index, respectively. Gentle slopes, as seen in Sub-C 8, facilitate easier water infiltration through more complex and sinuous stream channels (high Dt), reducing runoff velocity and subsequently lowering the risk of soil erosion. When assessing drainage texture in sub-catchments, it is essential to consider factors including climatic changes, rainfall levels, vegetation cover, geological composition, soil type, slope gradient, infiltration capacity rates, and the size and perimeter of the sub-catchment. These variables significantly impact drainage density and should be carefully analyzed to understand the drainage characteristics of the area [
3,
29,
40,
51].
Environmental management managers can utilize linear signatures like stream frequency, overland flow length, average drainage density, and drainage texture to guide the creation and implementation of soil conservation strategies. These metrics offer valuable insights into watershed hydrology and erosion susceptibility, helping to shape precise and effective erosion mitigation efforts. When integrated with additional morphometric parameters, these metrics allow environmental managers to develop targeted seasonal plans to control soil erosion, concentrating on key areas and addressing the root reasons of soil erosion [
24,
40].
4.3. Areal Features of the Wadi Haly Catchment
Catchment areas could be analyzed to identify regions at risk rates of soil erosion by examining four different areal factors, namely, total basin length, form factor index, circularity ratio index, and elongation ratio index. The basin length (Lb) specifically measures the distance along the main watercourse from the basin’s boundary to the catchment outlet [
53,
56]. According to
Table 2, the geometries assign Sub-C 14 and Sub-C 8 as the longest and shortest catchments, respectively, in the Wadi Haly catchment. As a result, Sub-C 14 is expected to exhibit a longer time of lag time index, meaning that after a rainstorm event, it will occur in more time for water to catch the basin’s outlet. Typically, smaller catchments have shorter lag times than larger ones, since water has a shorter distance to travel from the farthest points within the basin. The form factor (Ff), a digital parameter, is commonly used to define the catchment shape. Circular catchments generally have Ff values close to one, elongated catchments have greater lengths and lower Ff values, and wider, shorter catchments have the highest Ff values [
57,
58]. Furthermore, the authors in Ref. [
59] suggest that catchments with greater Ff values have longer-lasting, flatter peak flows. In this study, the elongation factor (Ef) values range from 0.17 in sub-catchment 9 to 0.8 in sub-catchment 2, indicating that most catchments are predominantly elongated (see
Table 5). Another important metric for analyzing catchment form is the circularity ratio (Rc), which offers insights into the significant hydrological characteristics of a drainage catchment. This study’s Cr 15 values, which varied from 0.19 to 0.56, further supported the watersheds’ elongated shape. When calculating the circularity ratio, the diameter of a circle is compared to the catchment’s maximum length [
15,
24]. Elevated Rc index values suggest circular catchments or sub-catchments with permeable surfaces and moderate to steep slopes, which accelerate surface runoff infiltration into the ground. Conversely, lower Rc values are typical of watersheds with impermeable planes, low elevation, and prolonged runoff concentration times. The elongation ratio (Re) also provides additional information on catchment shape, classifying it as a less elongated shape (<0.7), oval shape (0.7–0.9), or circular shape (>0.9), according to the classification method proposed by the authors in Ref. [
48]. In the current study, the Re values suggest that sub-catchments 1, 9, 11, 13, 14, and 15 are showing less in elongated catchments in shape. Additionally, the values indicate that sub-catchments 2, 3, 4, and 10 are circular in shape, while sub-catchments 5, 6, 7, 8, and 12 are oval in shape (
Table 5). Catchments become more circular and vulnerable to floods as Re values rise because of shorter concentration durations, and vice versa. Several previous studies discussed the behaviors of the effective areal morphometric parameters (catchment length, shape factor, circularity ratio, and elongation ratio) and their significant correlation with soil erosion [
15,
29,
43,
48,
60]. Furthermore, a strong relationship between stream order index, basin length index, basin perimeter index, and soil erosion were analyzed and discussed [
3,
29]. The greatest values for all relief factors including basin relief, relief ratio, roughness number index, and relative relief are found in sub-catchment 7 of the Wadi Haly catchment and this association varies due to the field of research.
4.4. Relief Characteristics of the Wadi Haly Catchment
Catchment reliefs and topographic signatures are very important morphometric features that impact watershed drainage systems and reflect the topographical structure of the catchment. For the purpose of predicting water movement and controlling soil erosion in a catchment area, these features provide information on changes in elevations, slopes, and potential flow pathways. According to the soil erosion process assessment that was performed by the authors of Refs. [
3,
48,
61,
62], defining and assigning relief parameters allows for the exact definition of different locations that are vulnerable to the soil erosion process. The effective physical characteristics of different watersheds that help in assigning their erosion risks include the following: general channel gradient, roughness, Melton ruggedness number, relief ratio, basin relief, and catchment form [
24,
62]. Defining and understanding the relationship between the soil erosion process and different relief features is very valuable for environmental workers, agricultural producers, and watershed management planners. Having this comprehensive and complete data is very valuable for building both structural and non-structural models that successfully prevent and/or minimize soil erosion risk effects. The link between soil erosion process, basin relief, and topographic signatures in a watershed is very complex and depends on several factors [
16]. Sub-catchment 14 indicates considerable basin relief, which reflects the differential between a catchment’s highest and lowest elevations (
Figure 7). This high basin relief may worsen the soil erosion process when linked with slope, topography, and drainage density factors. It could be necessary to apply target management plans in this area to assign the soil erosion process and protect different soil sources. This is according to the possibility that faster surface runoff from steeper slopes related to higher relief signatures may exacerbate soil erosion and sediment transportation [
51]. The link of basin topography to the longest assigned dimension (R) is an important metric for comprehending the different topographic signatures of the study catchment, reflecting that sub-catchments 7 and 14 in southeastern parts exhibit the highest R values, which indicate an obvious vertical drop relative to their horizontal extent. On the other hand, sub-catchment 2 indicates the lowest Rr, suggesting gentle topography signatures. High Rr index values confirm steep slopes that could be the result of the higher runoff velocity and a greater possibility of soil being dislodged and movement. Additionally, this metric not only assigns the overall steepness of a catchment but also directly links with the watershed’s vulnerability to soil erosion process. As a result, catchments and sub-catchments with high Rr index values are more vulnerable to soil erosion action than those with lower Rr index values, assigning the higher needs of focused soil erosion management plans in these susceptible areas. Complementing this investigation is the basin slope parameter, which represents the average slope across the entire sub-catchment. This technique provides a detailed and complete understanding of how variations in slope can impact and control soil stability and hydrological behavior by examining the eight neighboring elevation values encompassing each raster point within a proposed sub-catchment and calculating the slope due to the highest elevation difference going downstream. In the present study,
Figure 7 illustrates a wide range of relief and topographical signatures that could affect water flow and soil erosion patterns, with basin slope index values ranging from 23.77 for sub-catchment 1 to 138.14 for sub-catchment 8, respectively. In addition to the analysis that was obtained by basin slope index, the Melton ruggedness number (MRn) index was computed to better describe and understand the behavior of the sub-catchment terrain. This index, which is related to flow accumulation and very hard terrain, is estimated by taking the square root of the sub-catchment size and dividing it by the exact difference between the sub-catchment’s minimum and maximum elevations. The MRn index is a very useful parameter for defining the overall terrain roughness and because of the intricate correlation between slope, vegetation cover, and water flow, more ruggedness frequently corresponds to higher levels of soil erosion action. In this study, the MRn values vary from 38.60 to 153.69, offering insight into the morphological variations within the catchments. Understanding these parameters is essential for effective watershed management and erosion mitigation strategies, enabling stakeholders to prioritize higher-risk areas and develop appropriate intervention measures.
The highest results for all relief factors, including basin relief index, relief ratio index, roughness number index, and relative relief index, are observed in sub-watershed 6 of the Wadi Haly catchment. It is important to note that various research areas exhibit distinct relationships between different relief factors and soil erosion process due to a range of influencing factors. These effective parameters include changes in cover and land use, human activity, climate, geological, and geomorphological characteristics [
63]. For example, the study of sub-catchments with resistant soils could reflect a reduced relation between soil erosion and relief signatures, while research catchments with slightly loose and erodible soils may reflect higher rates of soil erosion process even in the presence of lower relief signatures. Additionally, rainfall could easily reach low-relief areas, minimizing soil erosion action. Therefore, it is very important to investigate and understand these elements and how they relate to different relief factors to develop effective soil erosion control programs in specific research regions [
40].
4.5. Prioritization Assessment of Sub-Catchments Based on Combined Values
Watershed prioritization due to morphometric evidence can successfully identify sub-catchments that are at high level of risk for soil erosion process. No single morphometric characteristic can sufficiently describe the susceptibility of sub-catchments to erosion. This limitation arises from the complex nature of soil erosion, which is influenced by a variety of significant factors, including land use, geological features, climatic conditions, and management practices. Therefore, a more holistic measure of a watershed’s vulnerability to erosion is represented by the combined value of multiple morphometric attributes. As indicated by the authors in Refs. [
15,
24,
40], it is computed by summing the numerical results of several morphometric factors and ranking them in order of relative relevance. Though the overall compound values technique can be applied to assign soil erosion risk, it is important to ask how well the watershed’s future tackling soil erosion rates are predicted [
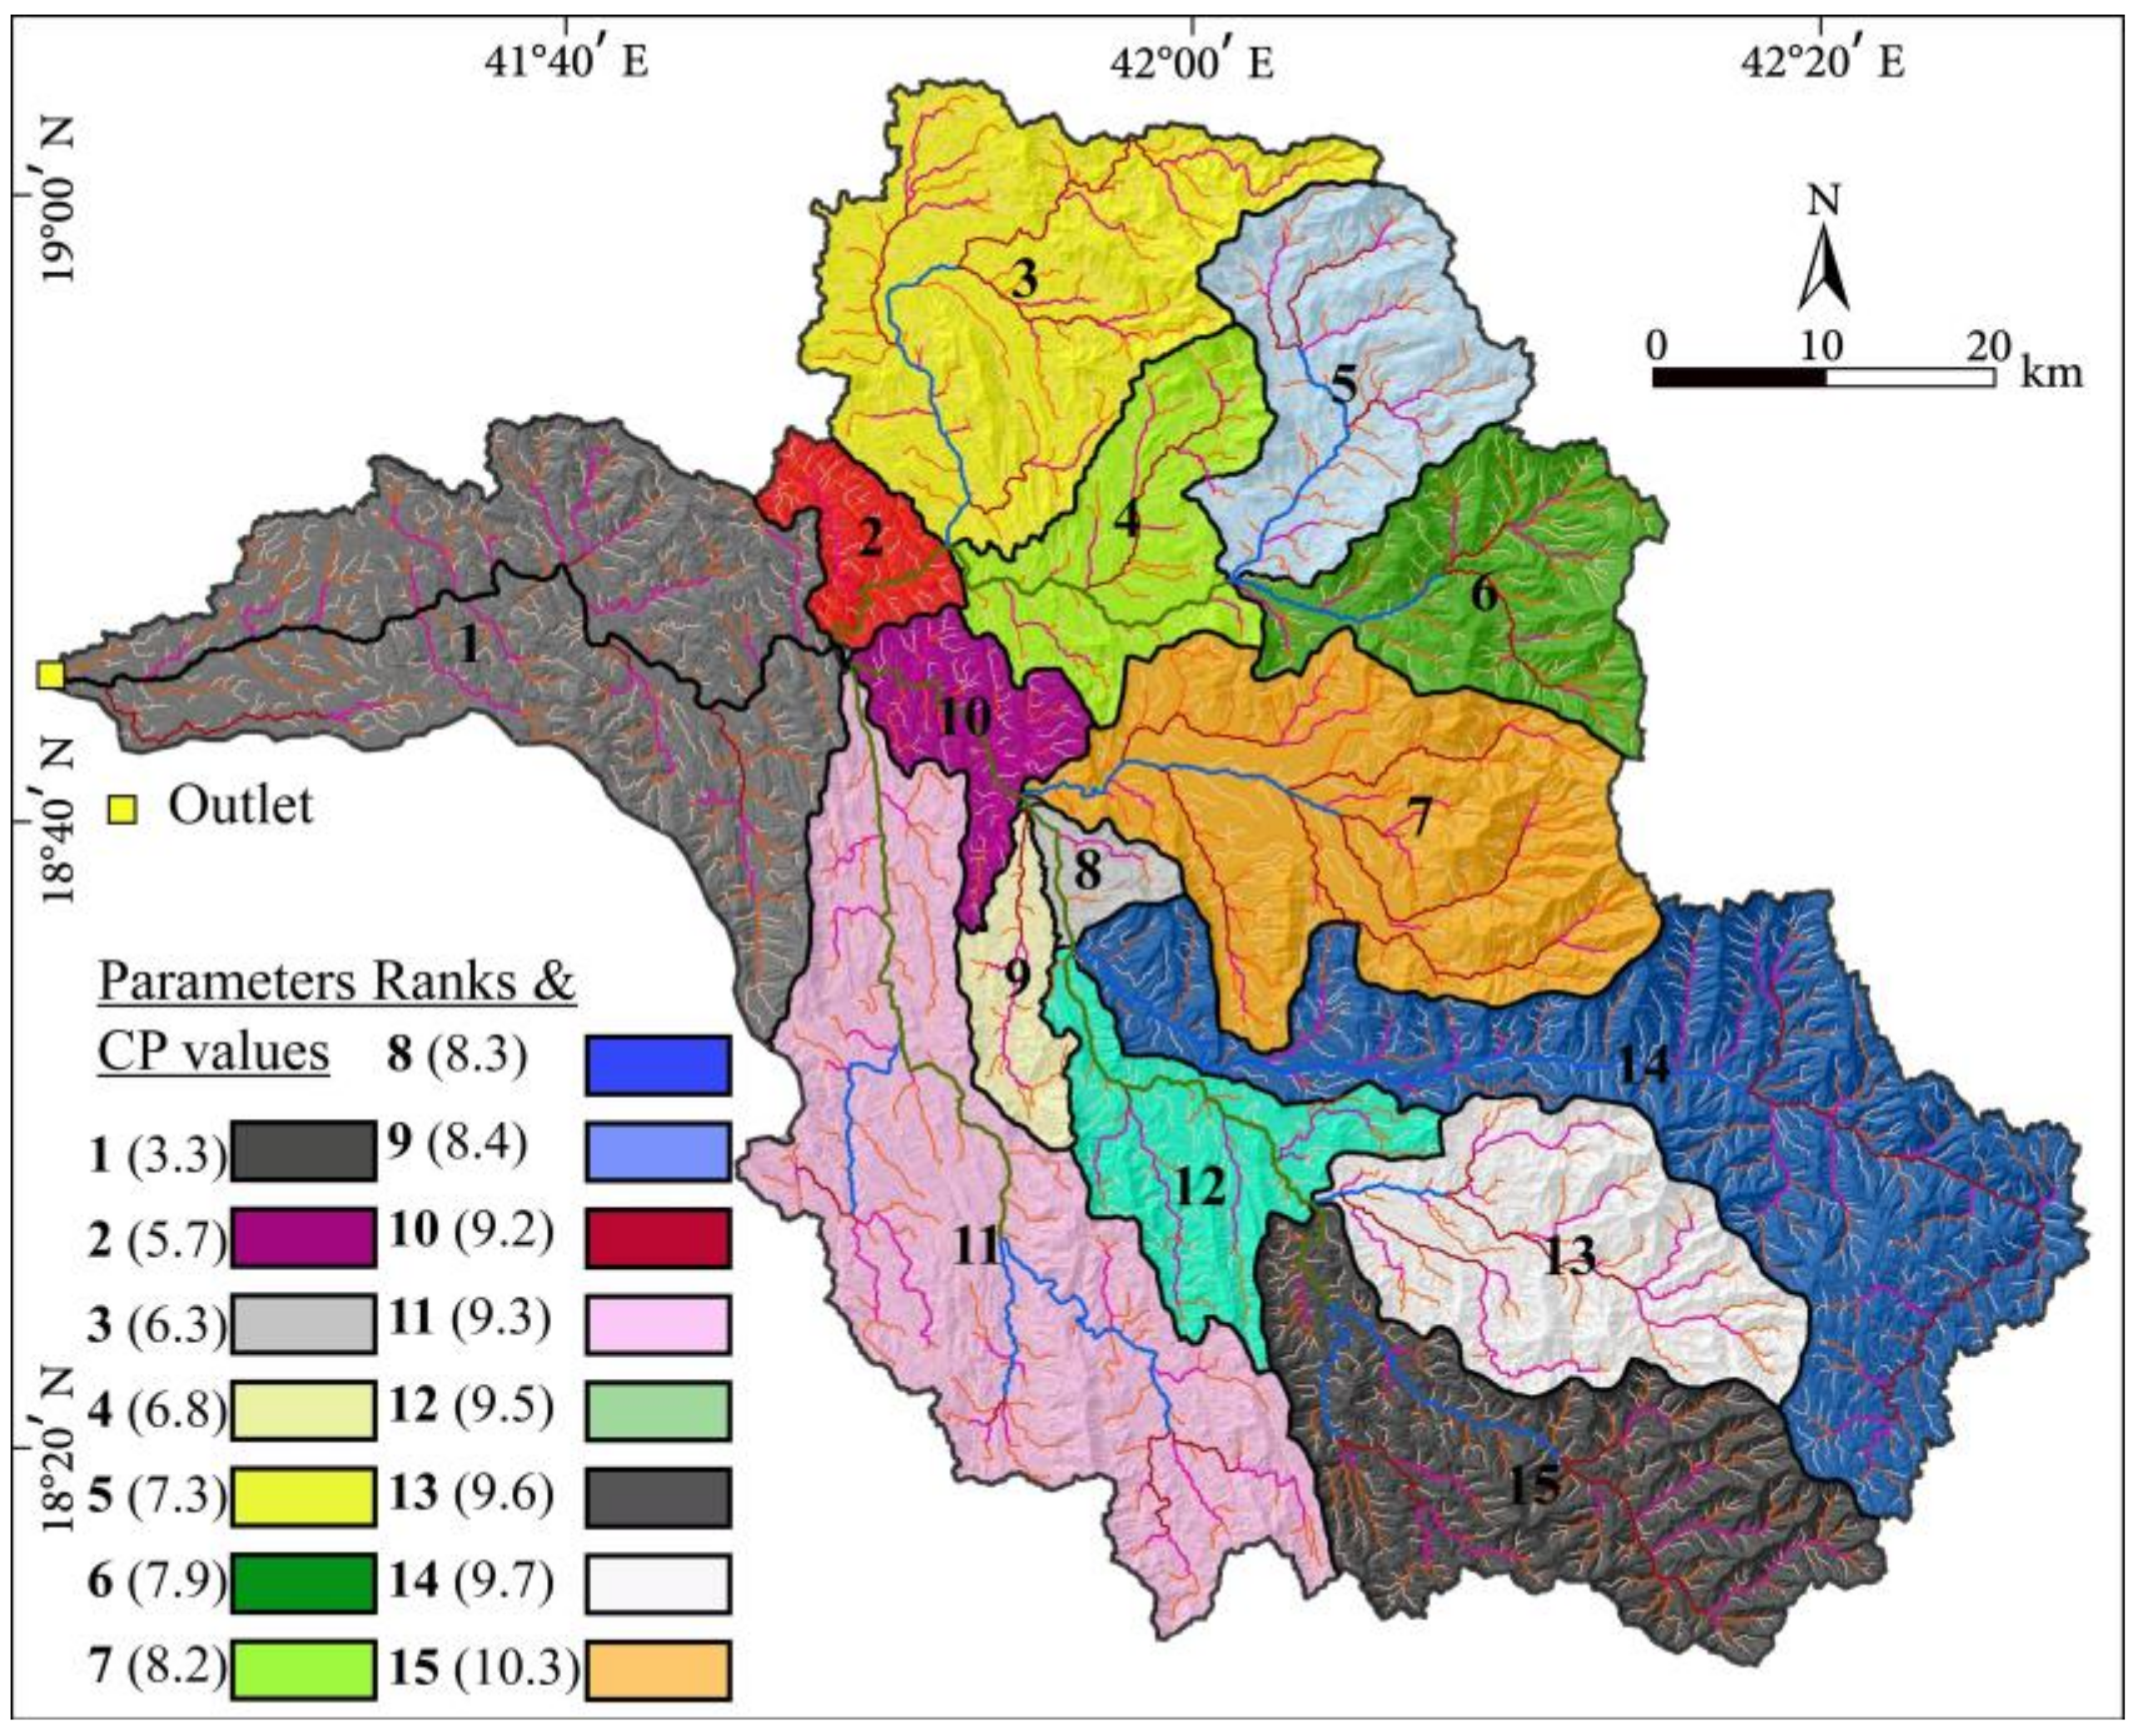
43]. In the current study, and due to their compound value, the Wadi Haly catchment is divided into the following three priority categories: high (≤7.3), moderate (7.9–9.2), and low (≥9.3) (
Figure 8). This classification could be adapted differently from catchment to another. For example, the authors in Ref. [
40] categorized Dabus catchment in Ethiopia into very high, high, moderate, and low soil erosion priority classes due to compound values such as low (≥7.51), moderate (7.5–6.51), high (6.51–6.5), and high (≤5.5). Additionally, the authors in Ref. [
64] divided the Didessa sub-watershed and Jema sub-watershed into the following three priority categories: high rates, medium rates, and low rates, based on extracted compound values of less than 2.55, 2.55 to 3.55, and more than 3.55. In the Wadi Haly catchment, Sub-C 7 has the highest compound value at 10.3 (
Figure 8).
The findings of this study reveal that four specific sub-watersheds, sub-catchments 1, 11, 12, and 13, have been marked for high priority levels due to their pronounced steepness, considerable relief, low vegetation cover, reduced infiltration capacity, and substantial runoff levels, which increase the soil erosion risk and underscore the urgent need for effective water and soil conservation interventions. These areas are crucial to local ecosystems and agriculture, where the soil health directly influences crop yields and overall ecosystem stability. Immediate actions are essential, including practices like contour bunding, river terracing, grass water-passes, in addition to gully control structures which are designed to slow water flow, mitigate gully erosion, and enhance sediment retention, thereby fostering a more stable soil structure. Beyond controlling erosion, these techniques also improve water quality by filtering sediments and pollutants before they enter water bodies and help maintain hydrological cycles to ensure water availability for agricultural and ecological needs [
65]. To address the adverse effects of soil erosion further, implementing agricultural strategies such as strip cropping and mixed cropping is necessary; these practices protect the soil from direct rainfall impact and improve soil structure and fertility through crop diversity, enhancing the resilience of agricultural systems against climatic variations and reducing dependency on chemical fertilizers. This study’s final map categorizes sub-catchments 2, 4, 5, 6, and 14 as moderate-priority, while sub-catchments 3, 8, 9, 10, and 15 fall into the low-priority category, allowing for targeted resource allocation based on specific vulnerabilities and potential impacts (
Figure 9). In moderate-priority areas, agronomic practices like contour farming, mulching, and strip cropping should be employed, tailored to the unique conditions of each sub-catchment, considering factors such as soil type, land use, and prevailing climatic conditions. Local authorities and experts must consider the priority areas highlighted by morphometric analysis and area-specific data to ensure that interventions are scientifically grounded and contextually relevant. Furthermore, considering populations in the development and implementation of these techniques suggests a feeling of accountability and ownership for land management sustainability. Particular workshops and specific educational strategies can improve understanding of the soil conservation value and provide local stakeholders with the ways they need to adjust strategies into process. Experts and researchers in using morphometric analysis pertinent to the adjustment of different locations should evaluate these spots and give suggestions based on their wide knowledge and information. Applying the integration of morphometric analysis assessments, area-specific information, and professional reports, experts can successfully implement effective programs related to water and soil conservation. Finally, initiating successful and sustainable conservation strategies that not only protect the environment but also improve agricultural products and resistance to climate change requires combining community involvement, local knowledge and information, and specific scientific research.
4.6. Practical Implementation for Sustainable Management of Wadi Haly Catchment
This study’s conclusions have important ramifications for managing catchments sustainably in Saudi Arabia, especially when it comes to tackling the problem of soil erosion in dry and semi-arid areas like the Wadi Haly catchment. Finding high-risk sub-catchments, such as sub-catchments 1, 7, 11, 12, and 13, provides a targeted starting point for putting specific soil conservation measures into action. For these places, practical solutions like check dam construction, contour farming, and terracing are strongly advised. In erosion-prone areas across the world, these techniques have been shown to be successful in regulating surface runoff, decreasing soil erosion, and improving water infiltration. Furthermore, implementing vegetative cover practices like agroforestry or reforestation can improve soil-water retention, stabilize the soil even more, and lessen the effects of severe episodic rainfall episodes, which are typical of the Wadi Haly catchment.
This study is built on the foundation of earlier erosion control initiatives in Saudi Arabia. To counteract sedimentation and improve groundwater recharge, for instance, projects utilizing check dams and water harvesting structures have been put into place in areas such as the provinces of Asir and Najran and Wadi Al-Lith basin (e.g., [
66,
67]). These initiatives showed how engineering-based solutions can effectively reduce erosion in regions with little vegetation and steep slopes. However, a major drawback of many earlier initiatives was the absence of a methodical strategy to rank the regions that needed assistance. This gap is filled by the prioritizing framework created in this study, which combines morphometric indices and geospatial tools in a data-driven technique. This guarantees that erosion prevention strategies are not only successful but also strategically implemented in the areas with the greatest need.
Additionally, the findings of this study are in line with Saudi Arabia’s Vision 2030 goals, especially those pertaining to climate adaption, water resource management, and environmental sustainability. In this study, a reproducible approach is offered that may be applied to more watersheds across the nation by combining sophisticated geospatial analysis with customized prioritization techniques. Combining contemporary technologies like remote sensing and GIS-based monitoring systems with more conventional methods like terracing and gabion structures will help future erosion control initiatives. By facilitating the ongoing evaluation of soil erosion dynamics, these technologies can promote long-term sustainability and adaptive management. To create an integrated framework for watershed conservation and sustainable land use management throughout Saudi Arabia, cooperation between governmental entities, local populations, and environmental researchers is crucial to success.
5. Conclusions
In this study, the critical and common issue of the soil erosion process and its significant impact on agricultural productivity and water resource management in the Wadi Haly catchment, Saudi Arabia, are emphasized, demonstrating that both human and natural factors contribute to soil erosion, which adversely affects local economies and ecosystems. The increasing sediment deposition resulting from soil erosion poses serious challenges for areas both upstream and downstream of the study site. Through a comprehensive analysis, we categorized the sub-catchments into three distinct priority classes for soil erosion management by employing several effective parameters of morphometry, including basic parameters, linear parameters, relief parameters, and areal parameters. Utilizing geospatial analysis and mathematical computations, we identified the sub-catchments most at risk for soil erosion, calculating a compound factor derived from multiple morphometric metrics such as total area, perimeter, stream length, relief ratio, and drainage density, which provided a holistic assessment of each catchment’s vulnerability. This classification revealed high-priority areas for intervention, specifically sub-catchments 1, 7, 11, 12, and 13, which require immediate management strategies to mitigate soil loss, while sub-catchments 3, 8, 9, 10, and 15 were identified as lower priority, reflecting a differentiated approach to resource allocation and management efforts. The immediate application of conservation practices is crucial in high-priority areas, where implementing strategies such as contour bunding, terracing, and vegetative cover can substantially reduce erosion risk. Additionally, this study acknowledges the potential limitations posed by using 12.5 m resolution data, which could have affected the precision and specificity of morphometric assessments; thus, we recommend that future research utilize higher-resolution digital elevation models (DEMs) to enhance the accuracy of erosion vulnerability assessments, facilitating a more reliable representation of fine-scale geomorphological features critical for understanding erosion dynamics. Ultimately, this research underscores the importance of integrating remote sensing and GIS technologies to test erosion-prone spots and quantify soil erosion process rates effectively, equipping land managers with targeted plans informed by rigorous morphometric analysis to enhance soil and water conservation strategies that safeguard vital resources and promote sustainable agricultural practices in the Wadi Haly catchment.


