Article

Study on the Influence Characteristics of Excavation Face Instability of New Tunnels Orthogonally Crossing Existing Tunnels

by
Shaokun Ma
1,
Zhang Zhou
1,
Zhibo Duan
2,*,
Zhen Huang
1,
Benfu He
1,
Pengtao An
1,* and
Jinmei Li
1
1
School of Civil Engineering and Architecture, Guangxi University, Nanning 530004, China
2
Department of Civil Engineering, Tsinghua University, Beijing 100084, China
*
Authors to whom correspondence should be addressed.
Appl. Sci. 2024, 14(22), 10521; https://doi.org/10.3390/app142210521
Submission received: 18 September 2024 / Revised: 29 October 2024 / Accepted: 12 November 2024 / Published: 15 November 2024

Abstract

:
This study aims to solve the problem of stability of the excavation surface of a new tunnel crossing an existing tunnel orthogonally. The relative horizontal spacing between the two tunnels is taken as an influencing factor, and transparent soil model tests are conducted and expanded with numerical simulations. Finally, the active destabilization mechanism and influence characteristics of the excavation surface of the two tunnels at different horizontal spacings, vertical spacings, and tunnel diameter ratios are obtained. The results show that when the excavated face is destabilized, the existing tunnel located in front of and above the excavation surface limits the development of the upper “silo” and the transfer of soil stress in the destabilized area, and the ultimate support pressure is reduced by 17.6% and 8.7%, respectively. This effect increases as the vertical spacing between the two tunnels decreases and the tunnel diameter ratio increases. At this point, the deformation trend of the existing tunnel cross-section is reflected as “elliptical-shaped”. This trend is more apparent when the vertical spacing between the two tunnels and the tunnel diameter ratio are decreased. The protection of the existing tunnel should be strengthened at this time.

1. Introduction

With the development of subway construction in China, the construction of shallow underground space is becoming increasingly congested, leading to frequent overlapping between multiple tunnel lines [1,2,3,4]. One of the more prevalent overlapping cases is the orthogonal crossing of new subway tunnels beneath existing tunnels [5,6,7]. Especially in the case of an orthogonal crossing during shield tunneling, the change in the relative position of the two tunnels and the coupling effect of the support and unloading of existing tunnels induce complex forces and deformation mechanisms in the soil of the excavation face. This presents great challenges to the shield excavation of urban subway tunnels.
Numerous academics have conducted relevant finite element simulation and model test assessments to address the structural deformation and the safety and stability of new tunnels crossing under/above existing tunnels. Scholars have combined 3D finite element analysis with model testing to determine the impact zones of new tunnel construction on existing tunnels [8,9]. Relevant finite element studies also show that if the impact of the construction joints on the existing tunnel is taken into account, then its shading effect on the new tunnels is weakened [10]. Furthermore, relevant studies have found through numerical simulation that when the new tunnel is inclined to pass under the existing tunnel in close proximity, the settlement and torsional deformations of the existing tunnel are greatest in the area of the intersection [11]. Some scholars have explored the impact of different construction sequences and digging speeds on the internal force variation of existing tunnels and on surface deformation during overlapping shield tunneling with multiple lines using physical modeling experiments [12,13]. The studies showed that the construction sequence of excavating the lower part of a new tunnel first and then excavating the upper part was better, and that the acceleration of the shield excavation speed results in an increase in force on and deformation of the existing tunnel. Another study has shown that different types of existing tunnels are affected differently by shield tunneling [14]. Studies based on centrifugal testing further revealed that the displacement of and stress on existing tunnels vary approximately linearly with the growth in the ground loss rate and grouting rate of the new tunnel [15]. Furthermore, the effect of the underpass method on the additional internal forces and deformation of the existing tunnel is more significant, with vertical tensile deformation of the existing tunnel occurring [16].
Model tests are a useful tool for validating numerical models. However, the lack of transparency in the soil samples used in these tests makes it challenging to reveal the internal deformation law of unstable strata, and the insertion of sensors into the model tests will likely cause damage to the original structure of the soil body, which may result in a large test error. Therefore, in response to the shortcomings of the current model test setup, transparent clays with a high degree of visualization become an alternative to natural soils [17,18,19,20]. Currently, the usefulness of model tests based on transparent soils has been recognized in many disciplines [21,22,23,24,25]. Ma [26] carried out excavation surface stability studies by conducting six transparent soil modeling tests using a self-designed modeling device. The results revealed that in clay-gravel composite strata, the shape of the soil destabilization damage mode was a combination of a wedge and an inverted truncated cone at 0.5 times the tunnel diameter and 1.0 times the tunnel diameter burial depths, as well as a combination of a wedge and a prism at 2.0 times the tunnel diameter burial depth. Duan [27] validated the accuracy of the transparent soil model test using a coupled DEM- CFD approach. Duan [27] also systematically analyzed the microscopic change trend of the composite stratum as well as the impact of soil stress after the destabilization of the excavation surface.
While numerous scholars have analyzed the force and deformation control mechanism of existing tunnels with subways orthogonally underpassing them, there have been relatively few studies that have investigated the stability of the excavated surface of the new tunnels. The majority of the present transparent clay model tests employ transparent sandy soil for the study; however, the study of the stability of the excavated surface with a focus on the shield orthogonal underpassing of existing tunnels using transparent clay is seldom reported. Therefore, the present study carries out model tests of shield orthogonally crossing existing tunnels based on transparent clay. The model tests reveal the influence mechanism of the relative horizontal distance between the two tunnels on the stability of the excavation face. Then, the numerical calculation model is established, which is corroborated with the experimental results of the model to further explore the influence of the relative positions of the two tunnels, as well as the diameter ratio of the two tunnels, on the force damage characteristics of the soil body; moreover, the deformation of the existing tunnel is explored.

2. Model Test

The present investigation employs the shield excavation surface stability model test system developed by Guangxi University. The excavation surface stability model tests of existing shield orthogonal underpassing tunnels are carried out taking into account the influence of the horizontal spacing between the two tunnels. The test system consists primarily of a model box, a new tunnel model, an acquisition system, an existing tunnel model, and a control system. The schematic diagram and actual setup of the test device are shown in Figure 1.

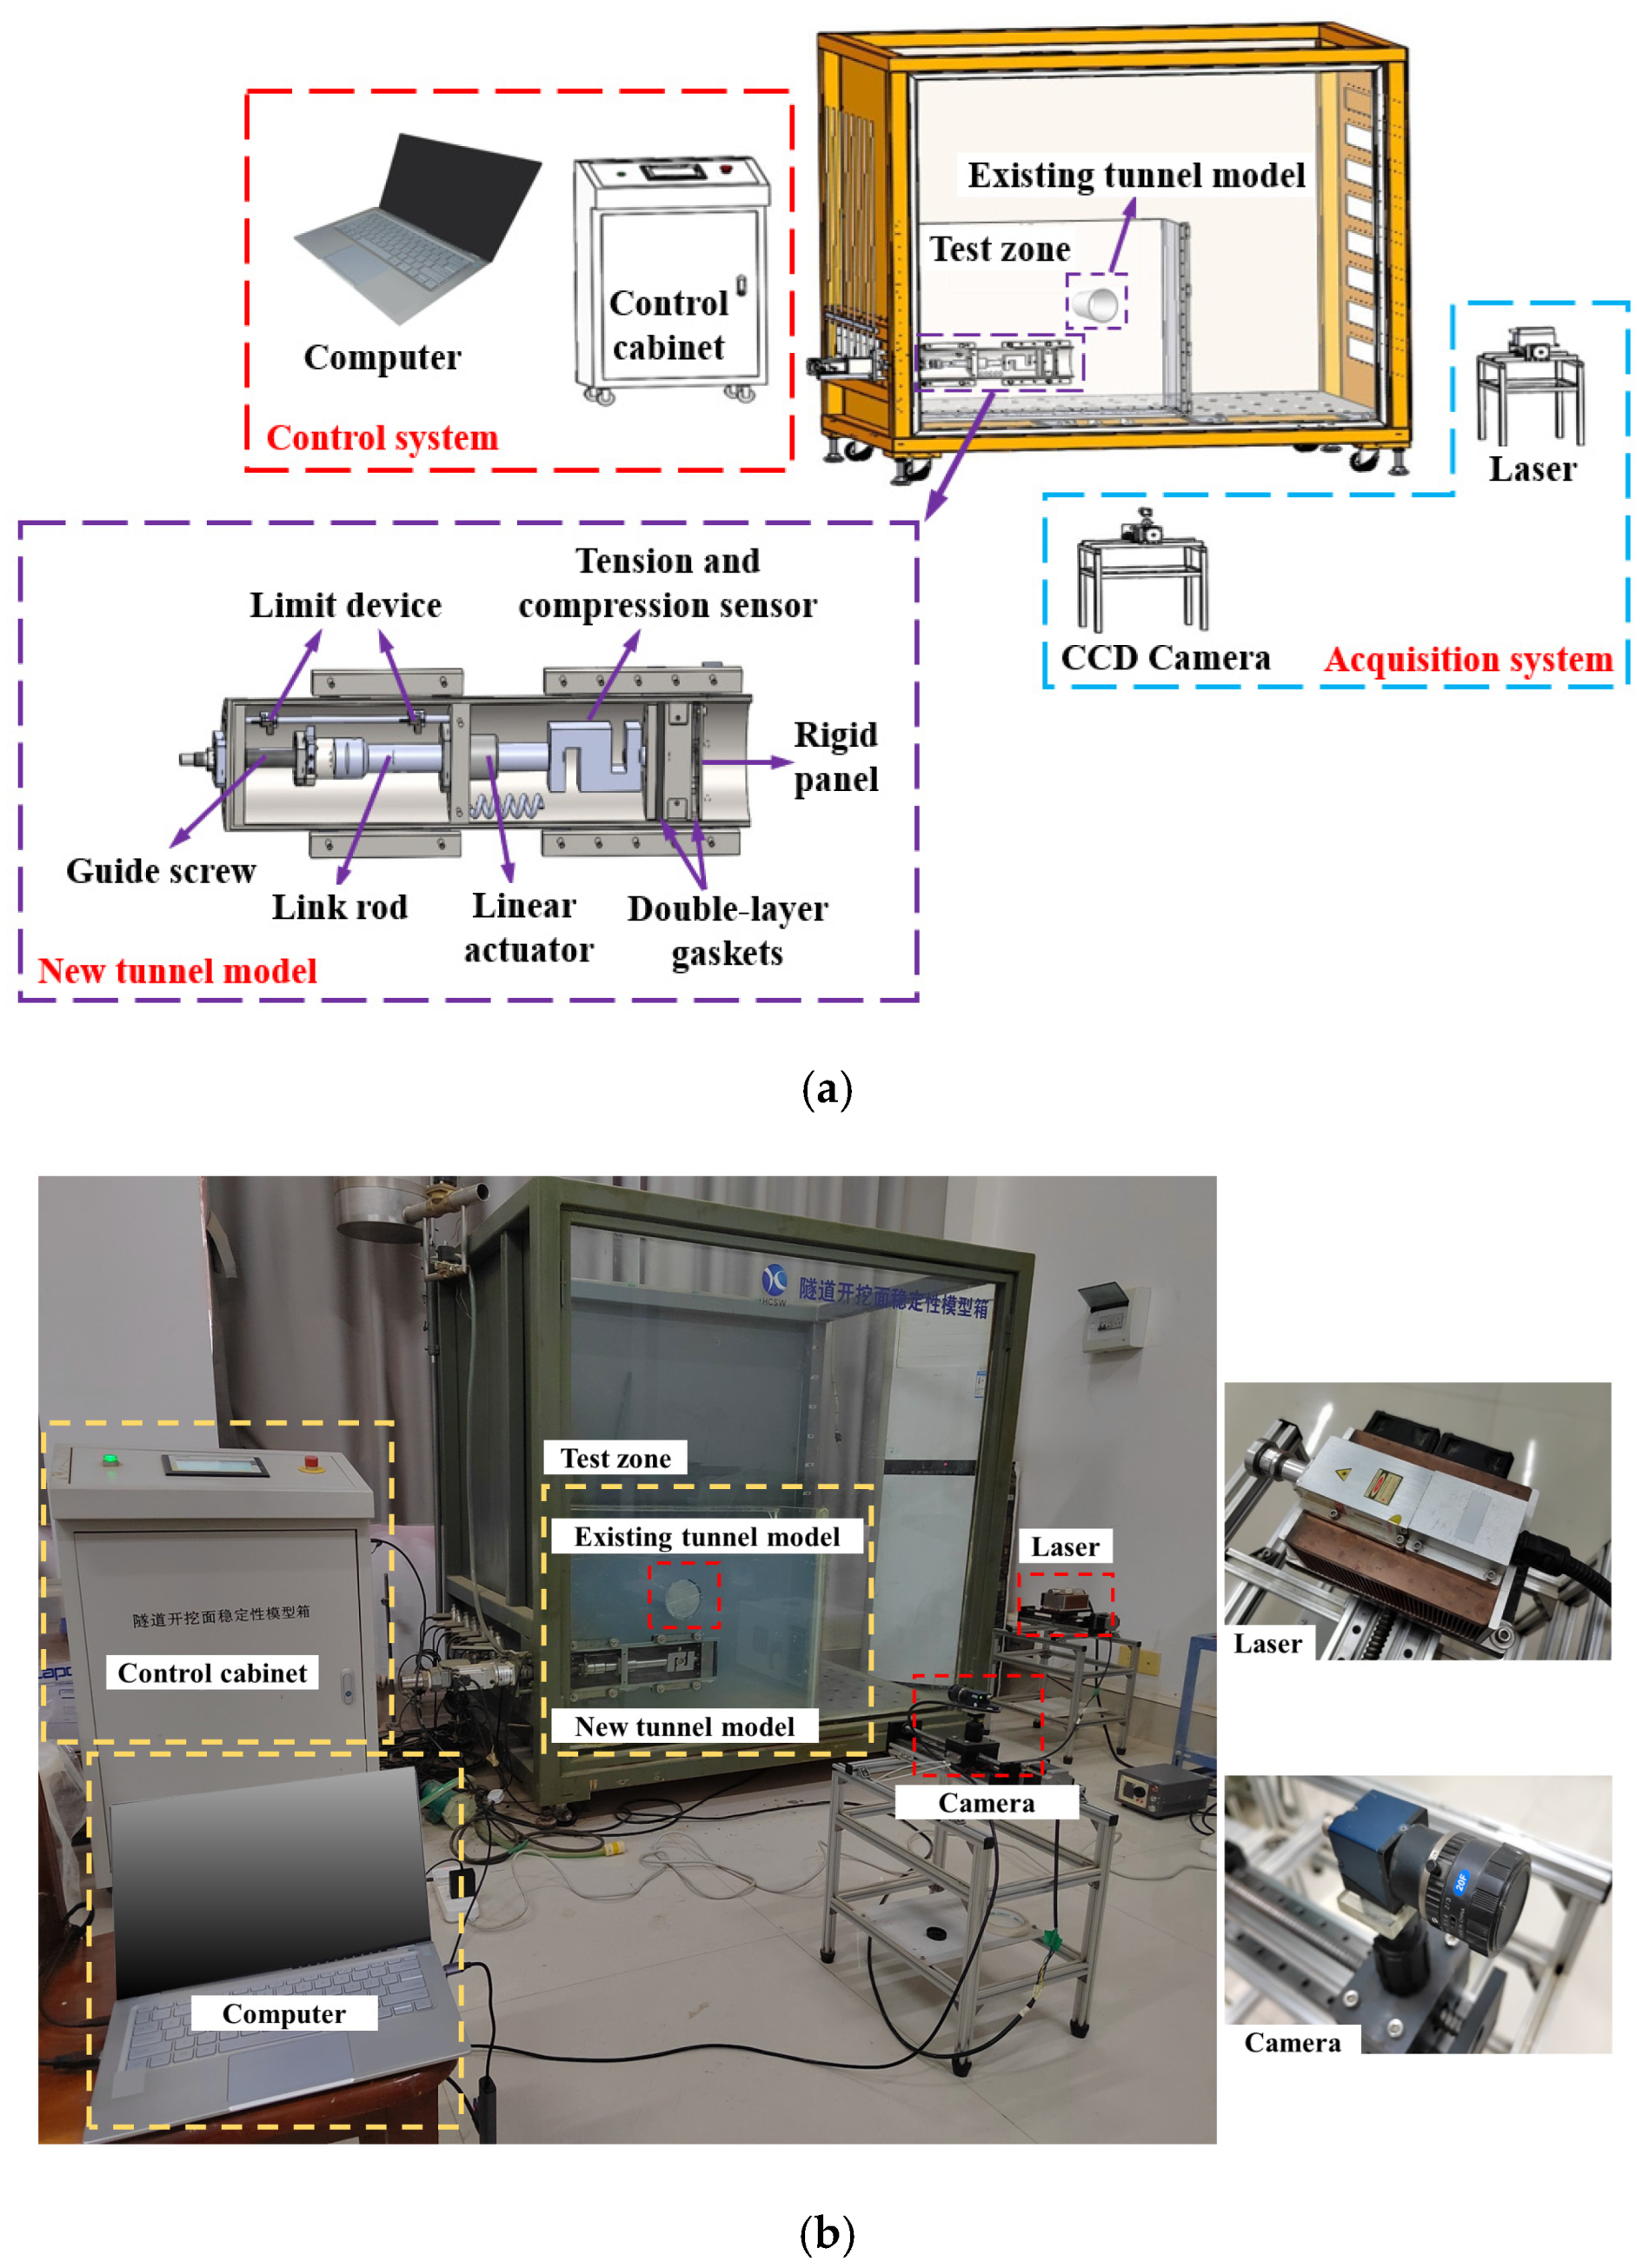
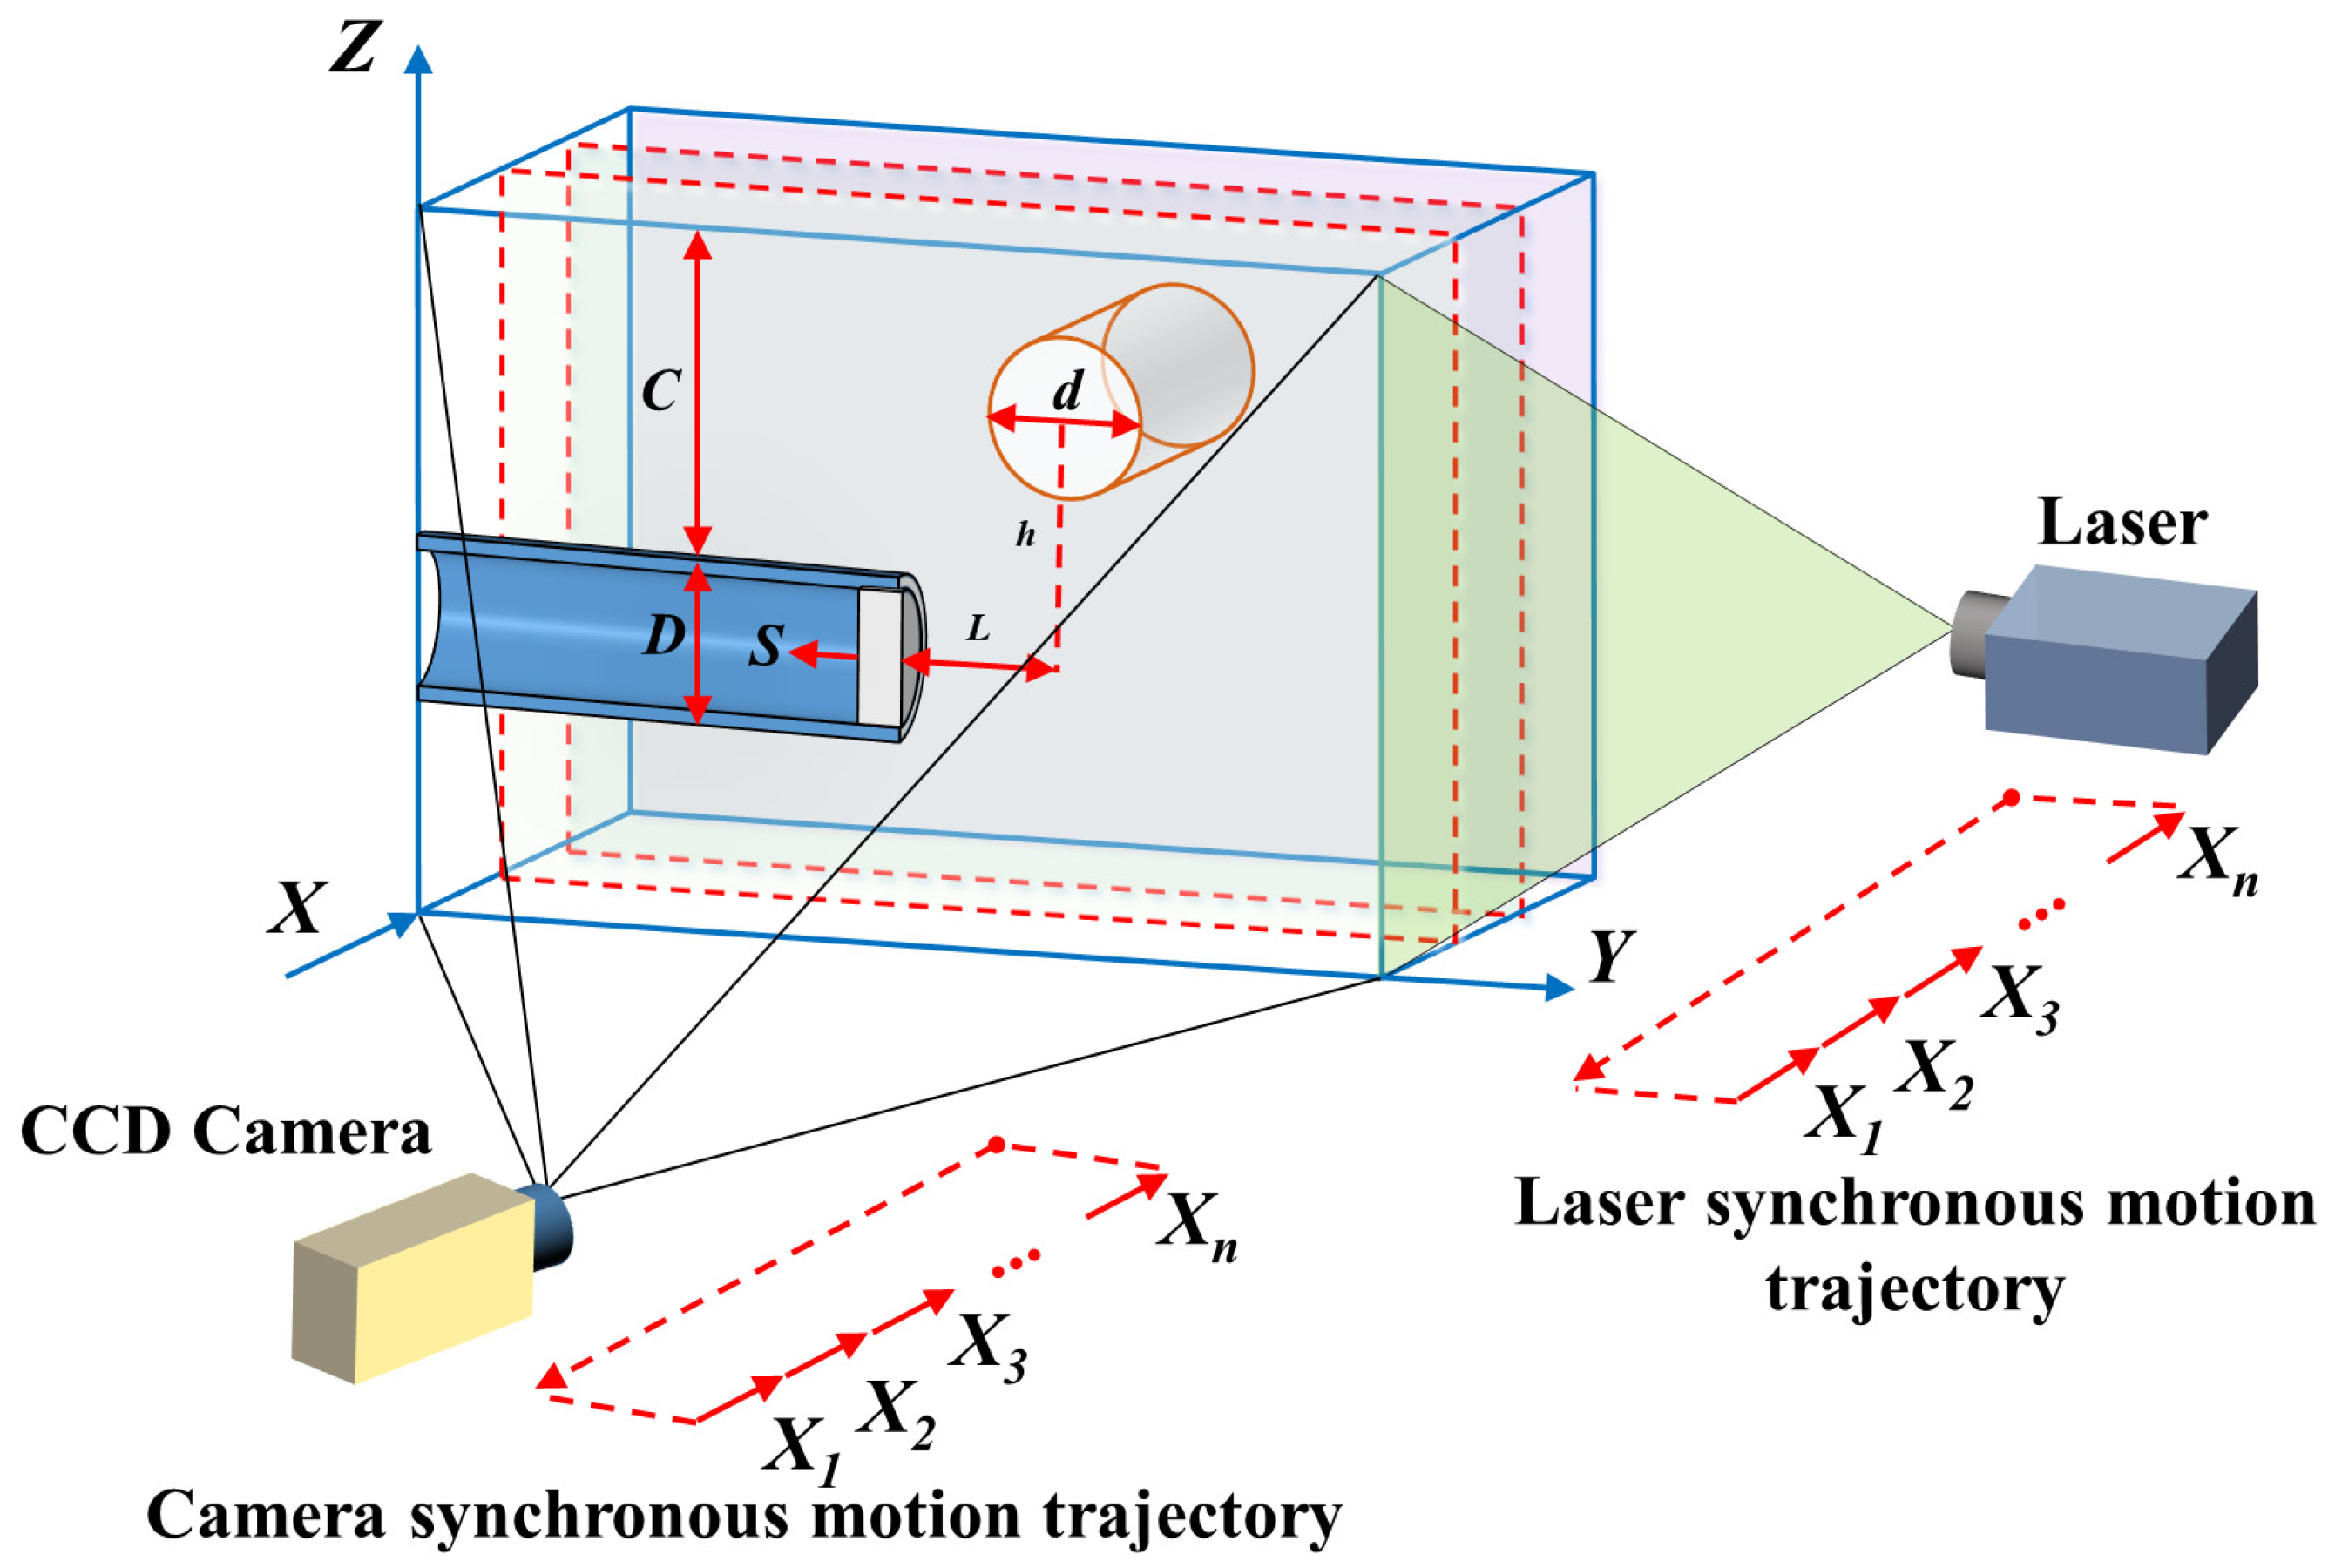
2.1. Model Test Equipment

The front panel of the model device is made of tempered glass, and an L-shaped partition made of Plexiglas is set up inside the model box to form the test area shown in Figure 1a, with the dimensions of 0.85 m × 0.22 m × 0.75 m (length × width × height). The new tunnel model is a semi-structural model connected to tempered glass. It is built with a scale of 1:50, and has an outer diameter of 120 mm (6 m in prototype scale) and an inner diameter of 108 mm. The entire body of the new tunnel is made of 304 stainless steel [28]. The new tunnel is fitted with interconnected rigid excavation panels, tension and pressure sensors, screws, bearings, and limiters. The excavation panels are driven backward using motors, and rubber gaskets are installed in the excavation panels to seal the interior of the tunnel.
The displacement control method is used in this test to simulate the progressive instability of the excavated face [29,30]. During the test, a control system made up of a control cabinet and a computer is used to control the setbacks of the rigid excavation panels in the new tunnel, simulating the active destabilizing damage to the excavation face. The support pressure of the excavation face is monitored in real-time using the tension-pressure sensors that are installed inside the new tunnel.
The test acquisition system is composed of two parts: a data acquisition device placed behind the excavation panel to measure the support pressure, and an image acquisition device with a laser and an industrial camera to capture photographs [28]. During the test, as the excavation panel backs up to the distance required for the test, the computer controls the synchronized movement of both the moving platform located in the lower part of the laser and the industrial camera. This allows the industrial camera to take photos of different laser-irradiated soil sections and, ultimately, obtain photos of different soil sections at different backed-up distances. The image acquisition motion trajectory is schematically shown in Figure 2.
As shown in Figure 3, this test uses a round tube made of Plexiglas with an external diameter of 120 mm to simulate the existing tunnel. One end of the existing tunnel model is fixed on one side of the test area, and for each test, different horizontal fixing positions are changed to simulate the different phases of the shield tunneling passing orthogonally under the existing tunnel.

2.2. Test Schemes

The tests primarily investigate the effects of different horizontal spacings between the two tunnels on the instability mode of the excavation surface during orthogonal shield tunneling. The test program is shown in Table 1 and Figure 4. The depth of the new tunnel C (C = 2D, D is the diameter of the new tunnel), the vertical distance between the two tunnels h (h = 1D), and the diameter ratio of the two tunnels d/D (d/D = 1, d is the diameter of the existing tunnels) are kept unchanged. Four sets of excavation instability tests are set up, considering different horizontal spacings between the two tunnels (S is the retreat distance of the excavation surface). L is the horizontal distance between the excavation face of the new tunnel and the center axis of the existing tunnel. L/D is the ratio of this horizontal distance to the diameter of the new tunnel, and a negative value indicates that the excavation face has crossed the center axis of the existing tunnel.

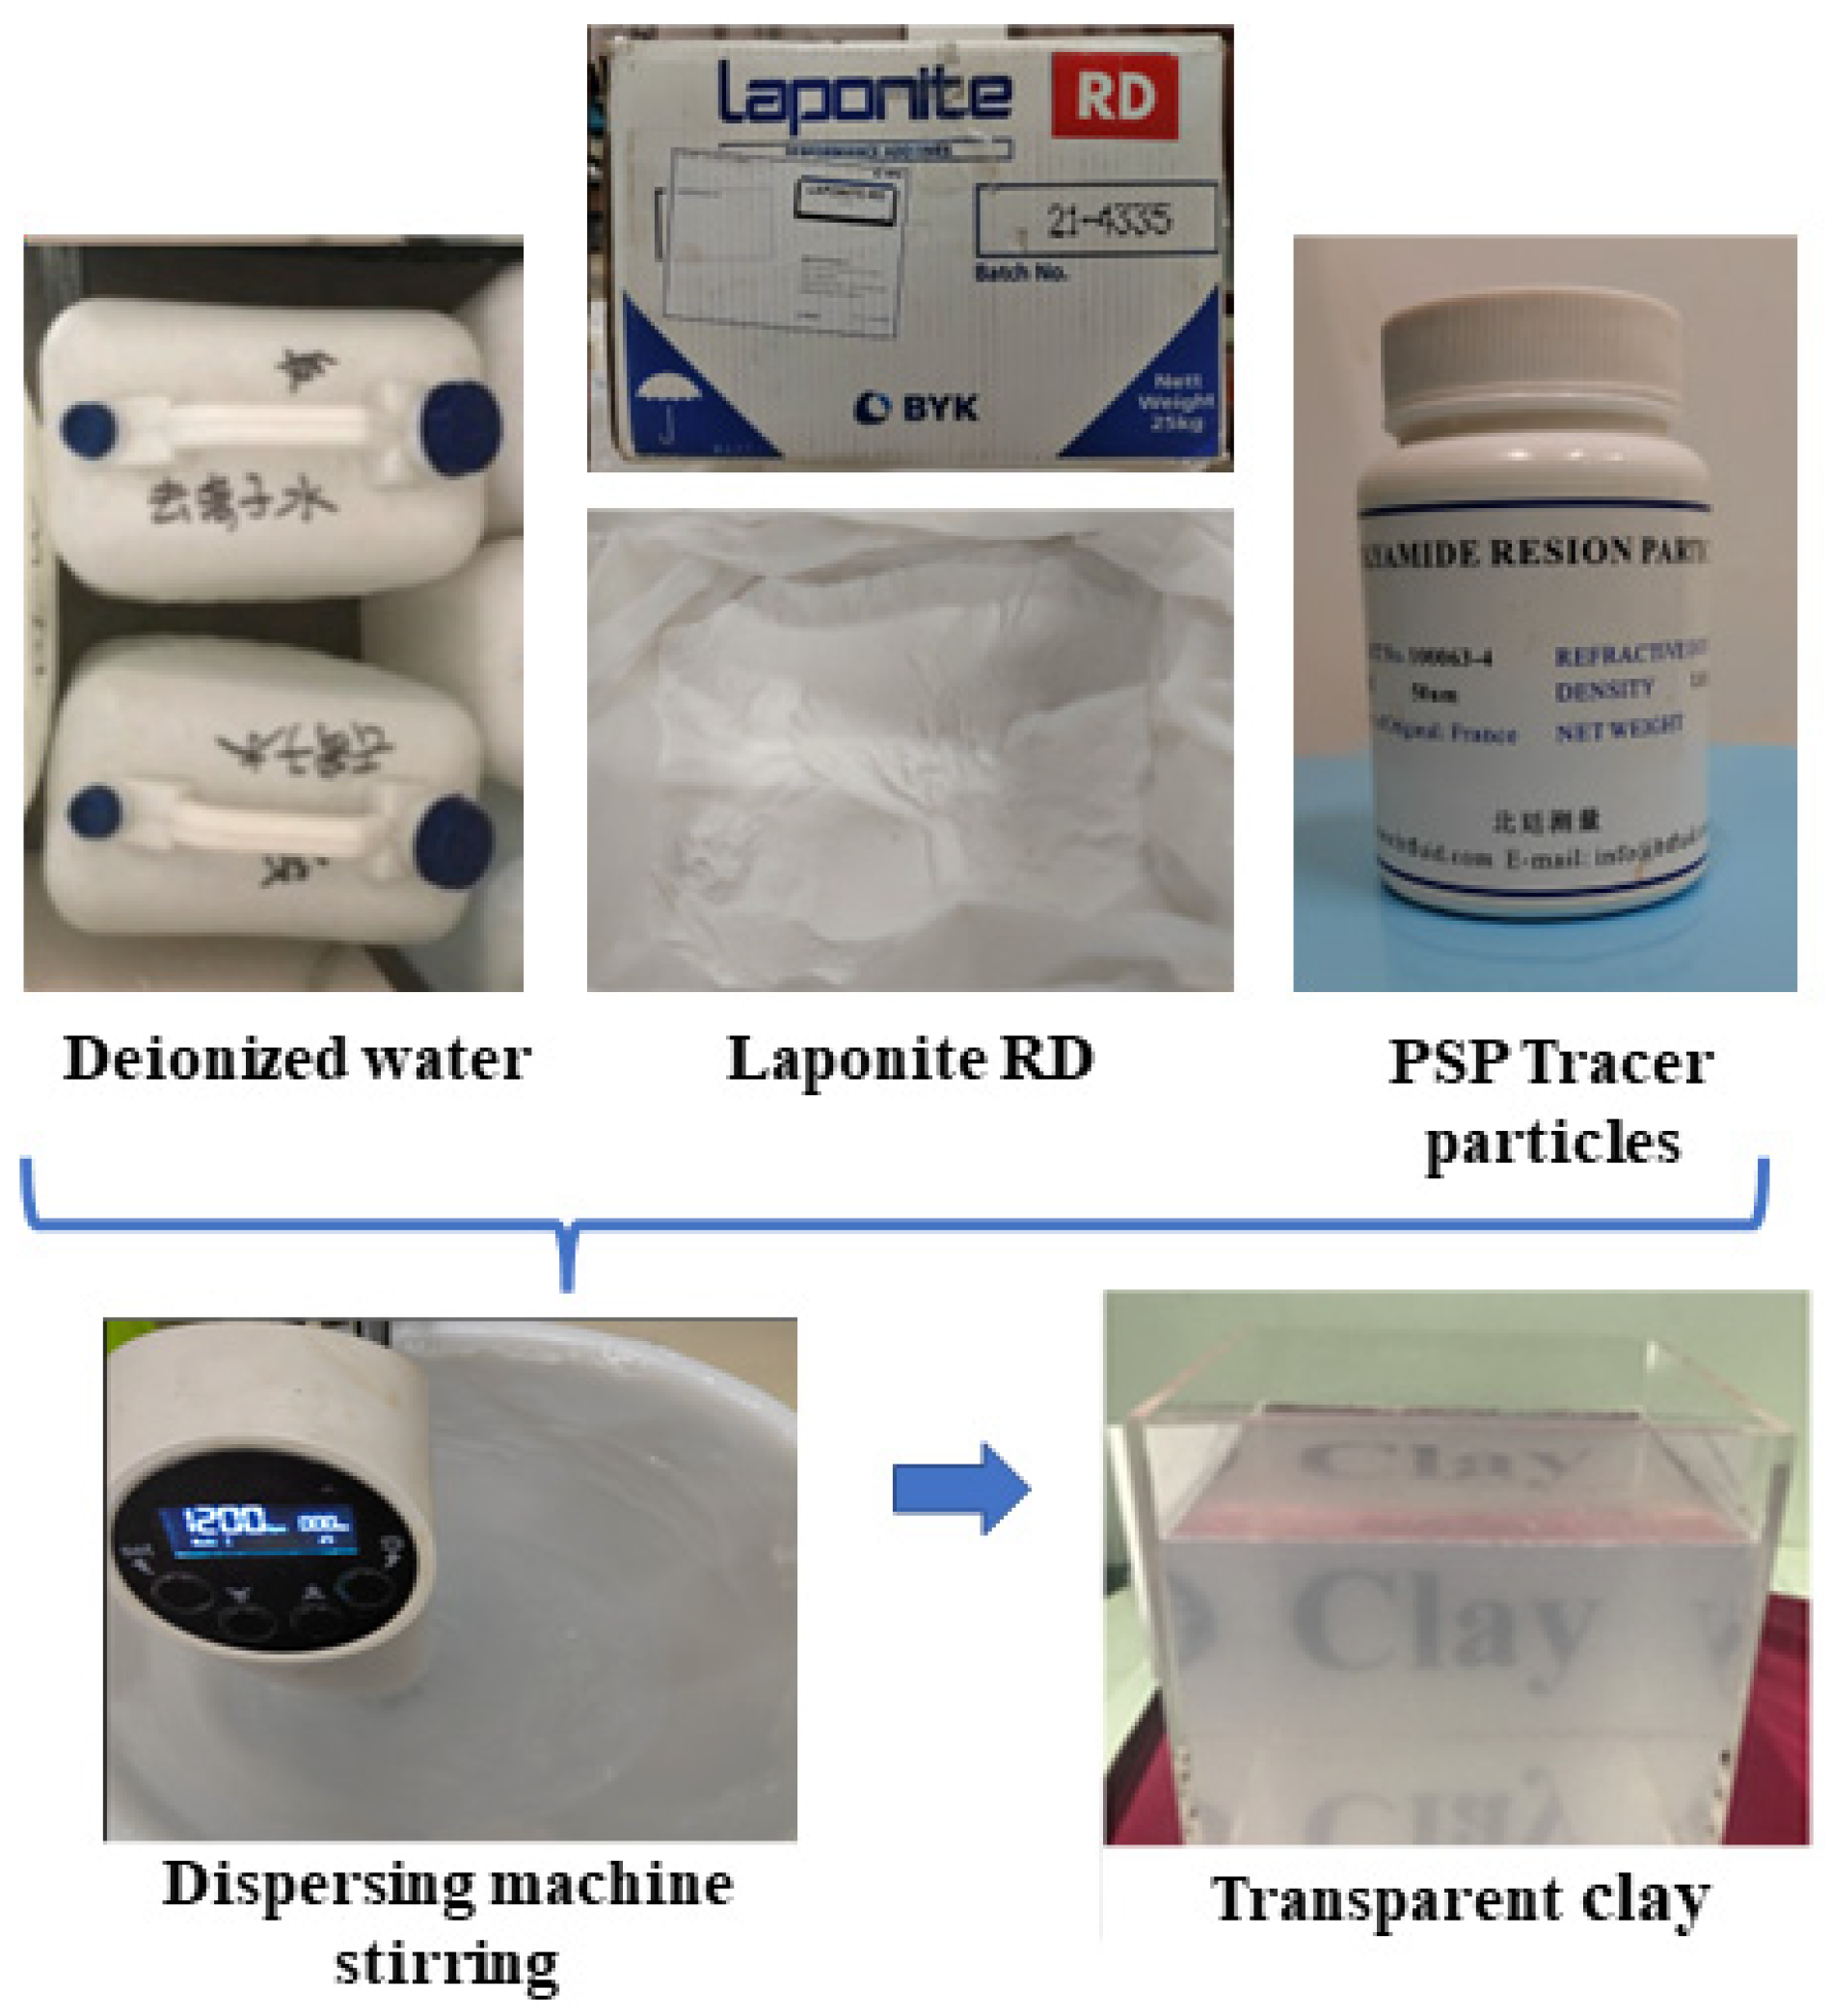
2.3. Test Preparation

To visually measure the internal damage pattern of the soil after the destabilization of the excavation surface, a transparent clay material is used in this experiment. The colorless transparent clay is created by mixing the Laponite RD powder with deionized water at high speed, resulting in hydration and swelling. Laponite RD is a white powder primarily composed of layered silicate. The properties of the Laponite RD material are listed in Table 2.
The research and practical applications conducted by several scholars have confirmed that this transparent clay material closely resembles the characteristics of natural soft clay. Therefore, transparent clay is suitable as a substitute for natural clay in model tests [31,32,33]. The relevant physico-mechanical parameters of the transparent clay are shown in Table 3.
The process of formulating Laponite RD powder to make transparent clay is shown in Figure 5, and the detailed procedure is as follows:
(1) The mass ratio of deionized water to Laponite RD powder required for the preparation of transparent clay is 24:1. The two materials are weighed following the burial depth of the experimental design;
(2) When the primary materials are ready, the PSP tracer particles [28] are added to the deionized water and stirred with a disperser. Once thoroughly blended, the Laponite RD powder is added and the mixture continued to be stirred for more than 20 min;
(3) After thorough mixing, the mixture is poured into the model box and cured for 2~4 days.

2.4. Test Procedure

The following are the primary steps of the test:
(1) The existing tunnel model is installed;
(2) The transparent clay is prepared and slowly transferred to the model box. The mixture is poured to an appropriate burial depth and left to set for 2–4 days;
(3) The computer system is connected to the control cabinet and industrial camera. After ensuring a dark test environment, the laser is turned on and the camera is adjusted to capture a clear picture;
(4) The servo motor is operated using software that corresponds to the control cabinet in the computer, driving the excavation panel backward at a speed of 0.05 mm/min [30]. Every 1 mm backward movement is rested for 20 min, and then the two moving platforms are controlled to start synchronous movement while taking pictures of the soil cross-section at different locations.

2.5. Test Results

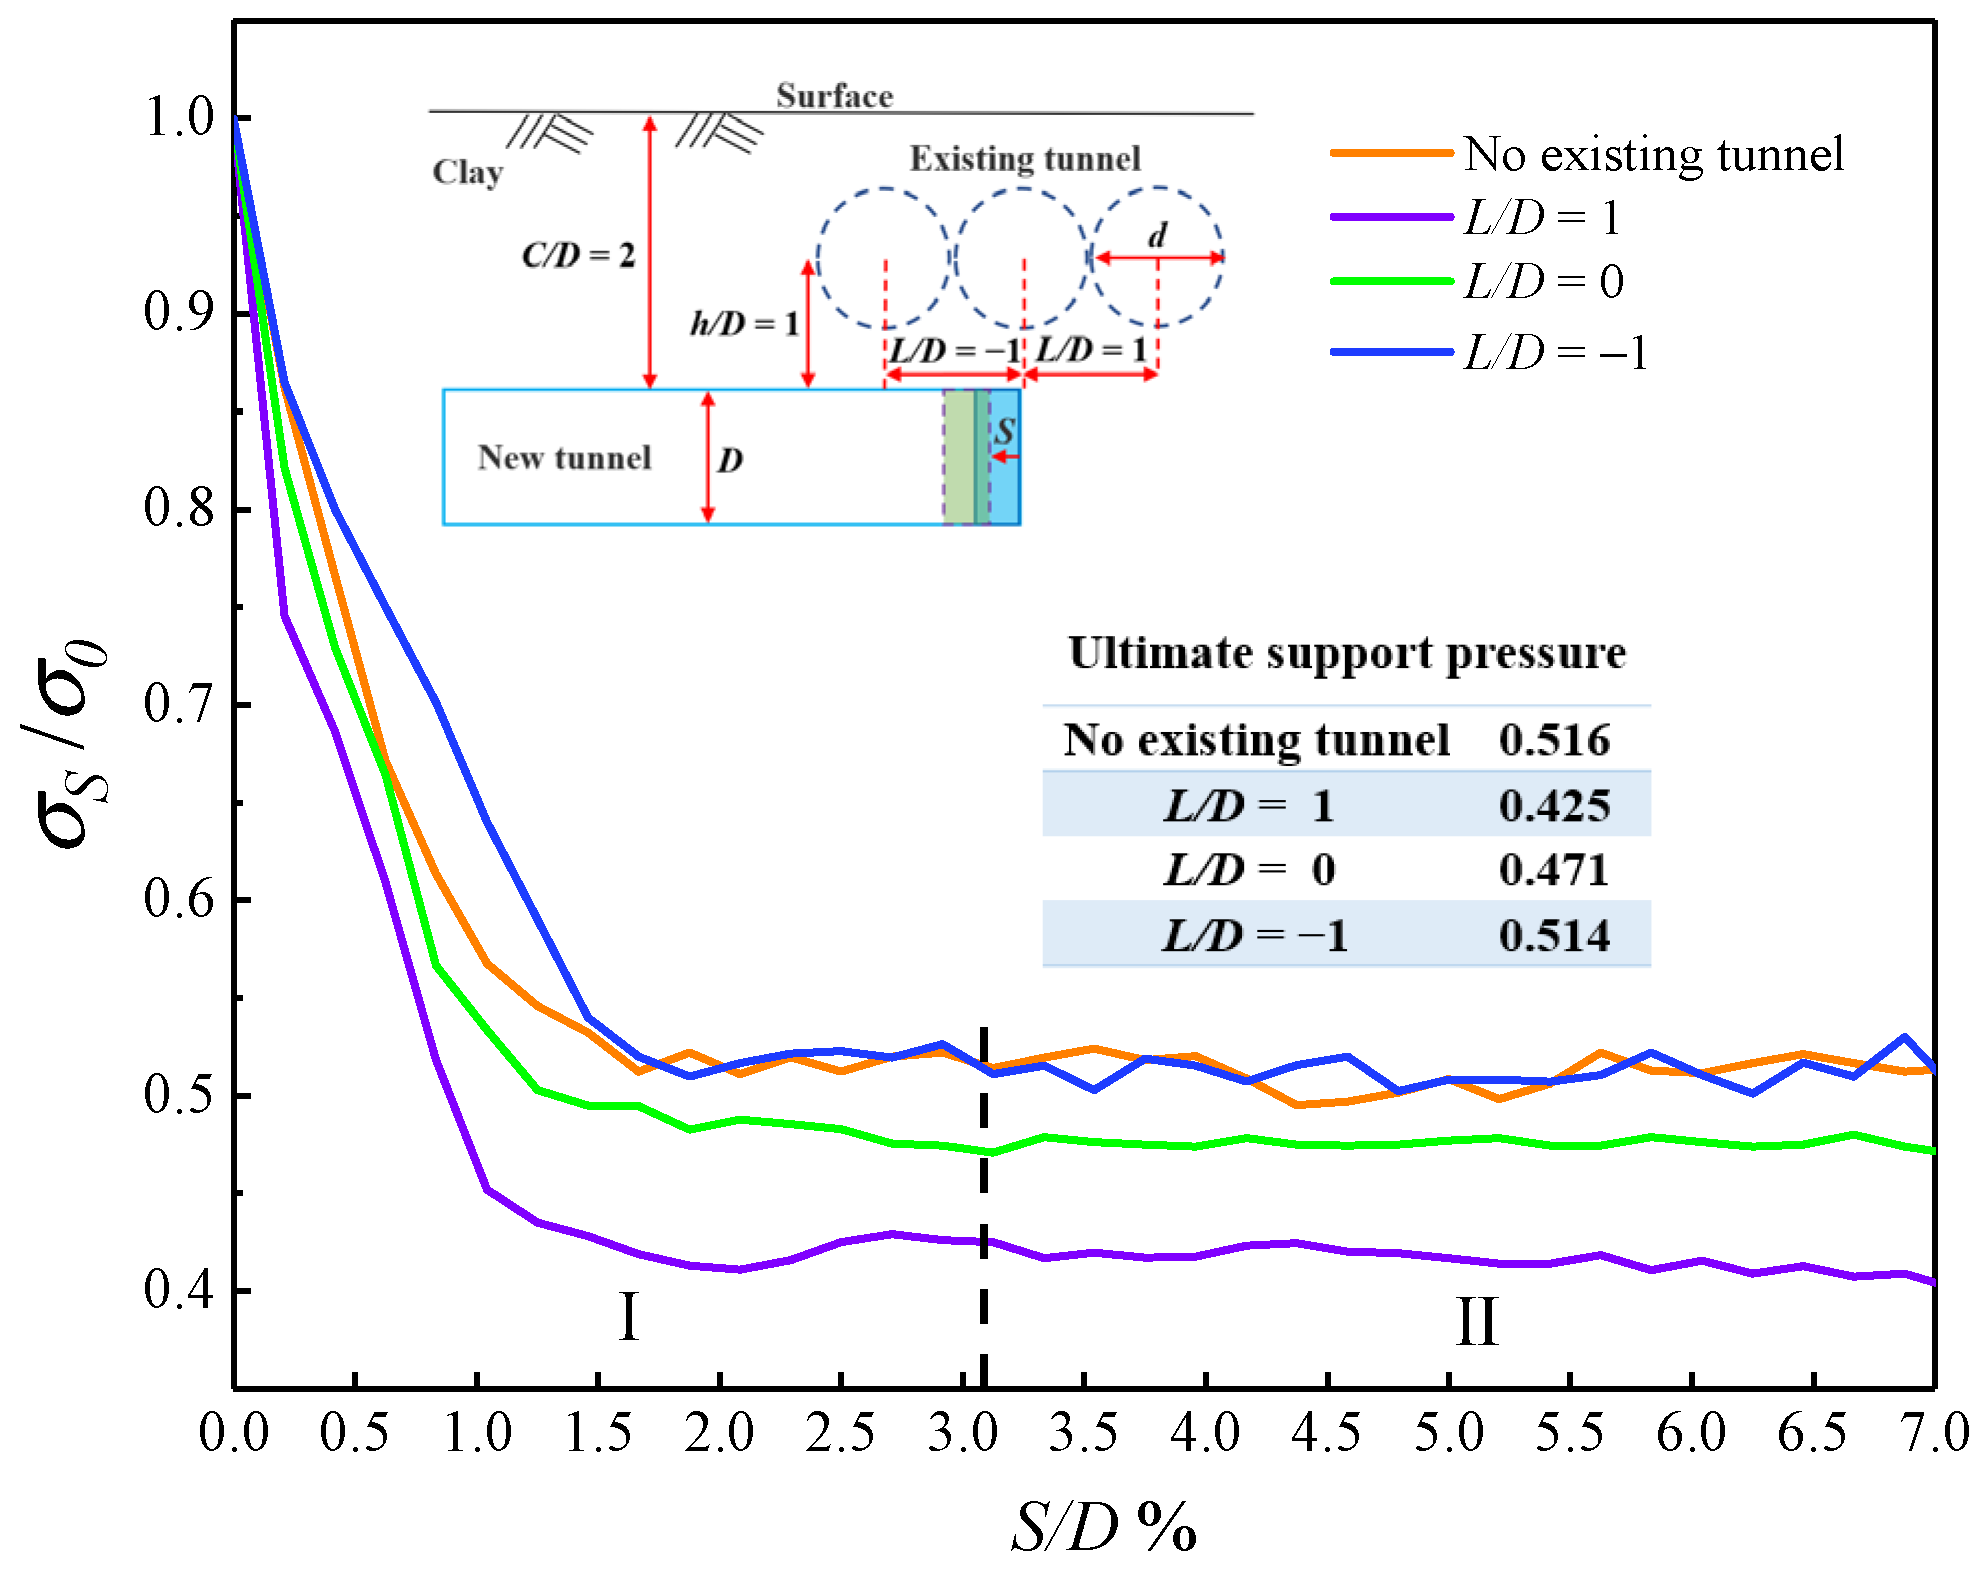
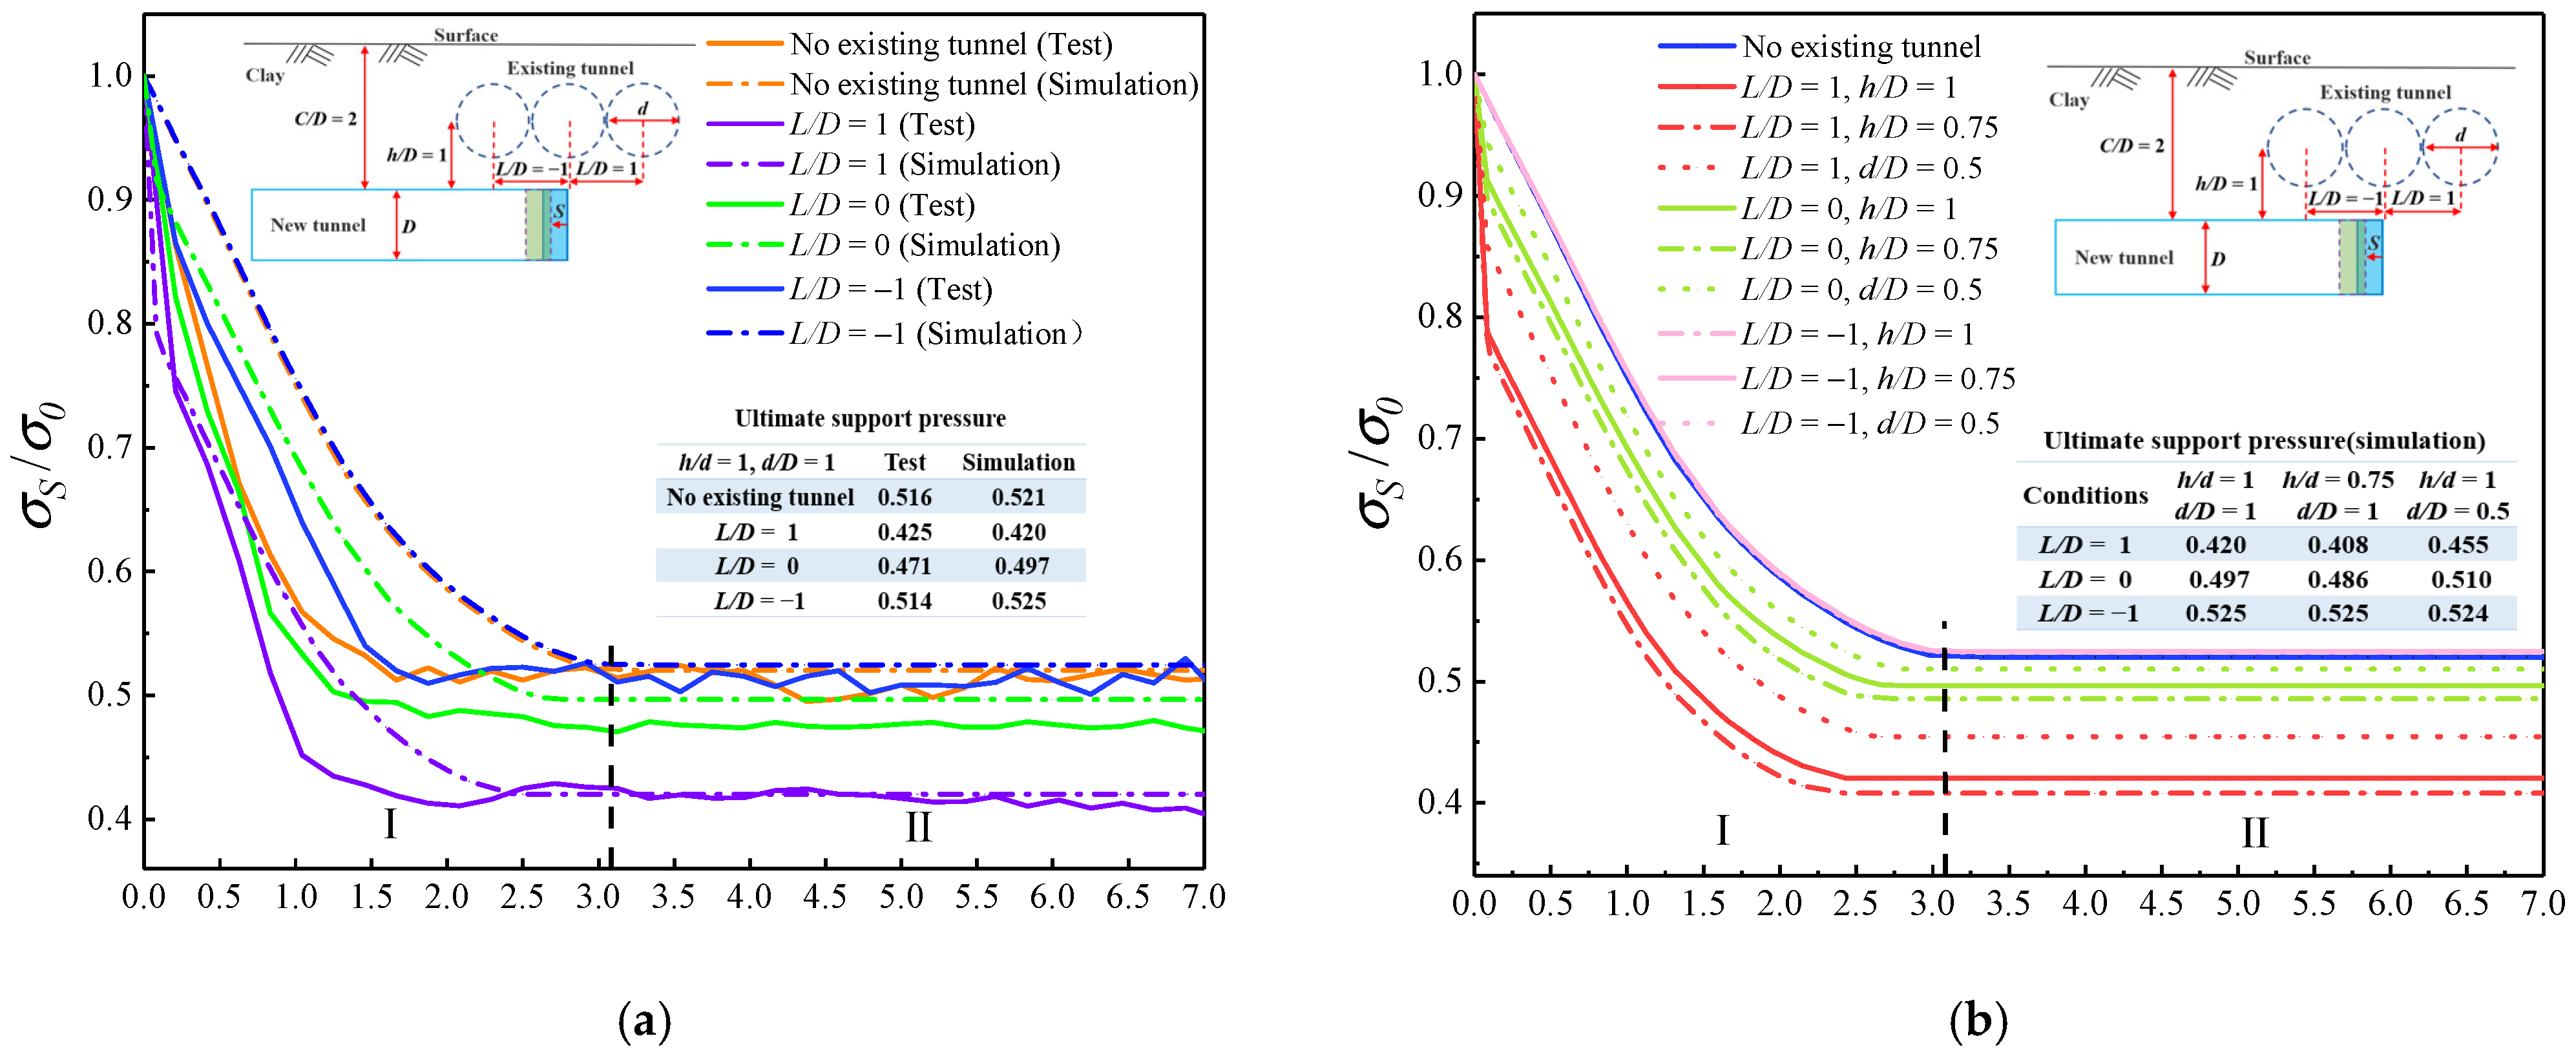
2.5.1. Support Pressure Ratio

Figure 6 shows the relationship between the support pressure ratio (σs0, where σ0 is the initial support pressure at the excavation face and σs is the support pressure at the excavation face at different moments of backward displacement) and the relative displacement (S/D%) of the excavation face from the model tests for four cases: one case with no existing tunnel, as well as L/D = 1, 0, and −1. The trend of support pressure change can be divided into two phases. After the excavation surface is destabilized, the support pressure shows a sharp decrease in the first phase, with the decrease concentrated in the range of 49–58%. The second phase is characterized by the gradual stabilization of the support pressure ratio with the increase in the excavation surface backward displacement. At this stage, the support pressure is the ultimate support pressure. Compared to the ultimate support pressure in the case without the existing tunnel, the ultimate support pressure is shown to be lower by 17.6% and 8.7%, respectively, when the L/D = 1 and the L/D = 0. This is because the existing tunnels play a supporting role for the upper soil above, preventing the direct transfer of soil stress to the lower strata and effectively limiting the development of the damage zone. When L/D = 1, there is a large overlap between the area where the existing tunnel is located and the destabilization zone of the excavation face. In this scenario, the ultimate support pressure of the excavation surface is at its lowest because the existing tunnel uses its deformation to counteract the stress release of the soil in the original destabilized area. When L/D = −1, the ultimate support pressure is the closest to that without the existing tunnel, which indicates that the influence of the existing tunnel is the least at this time.

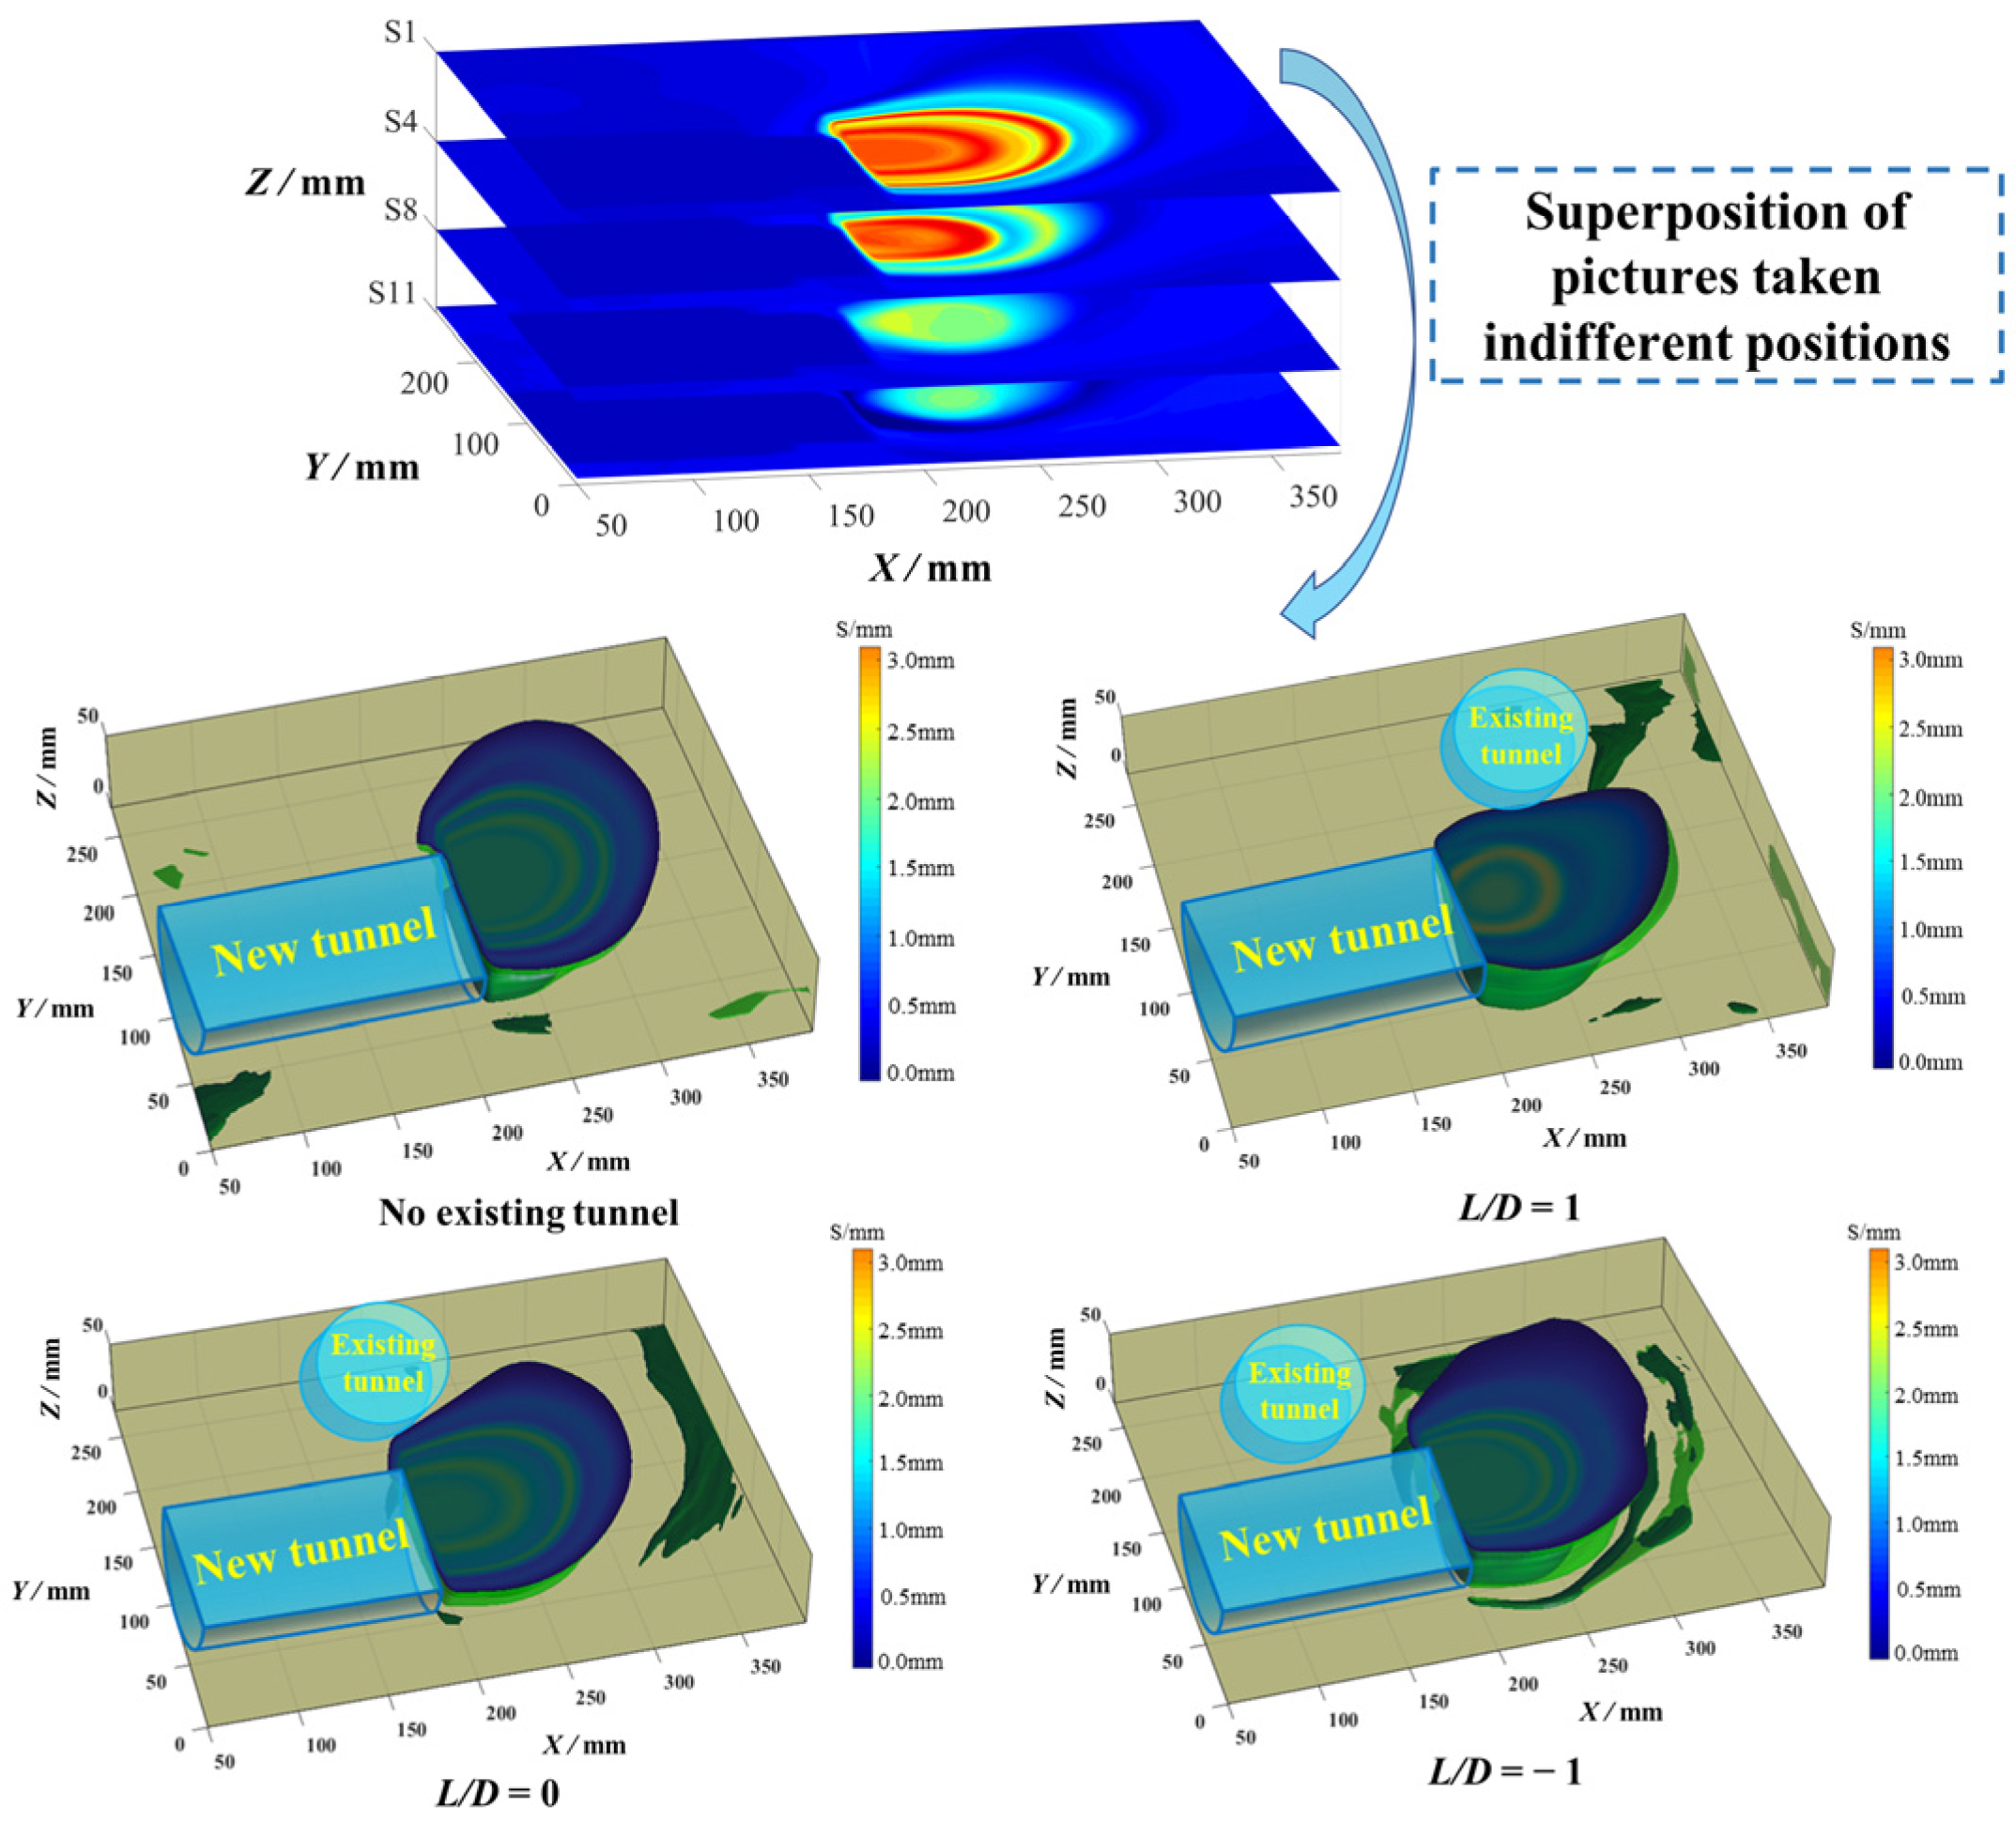
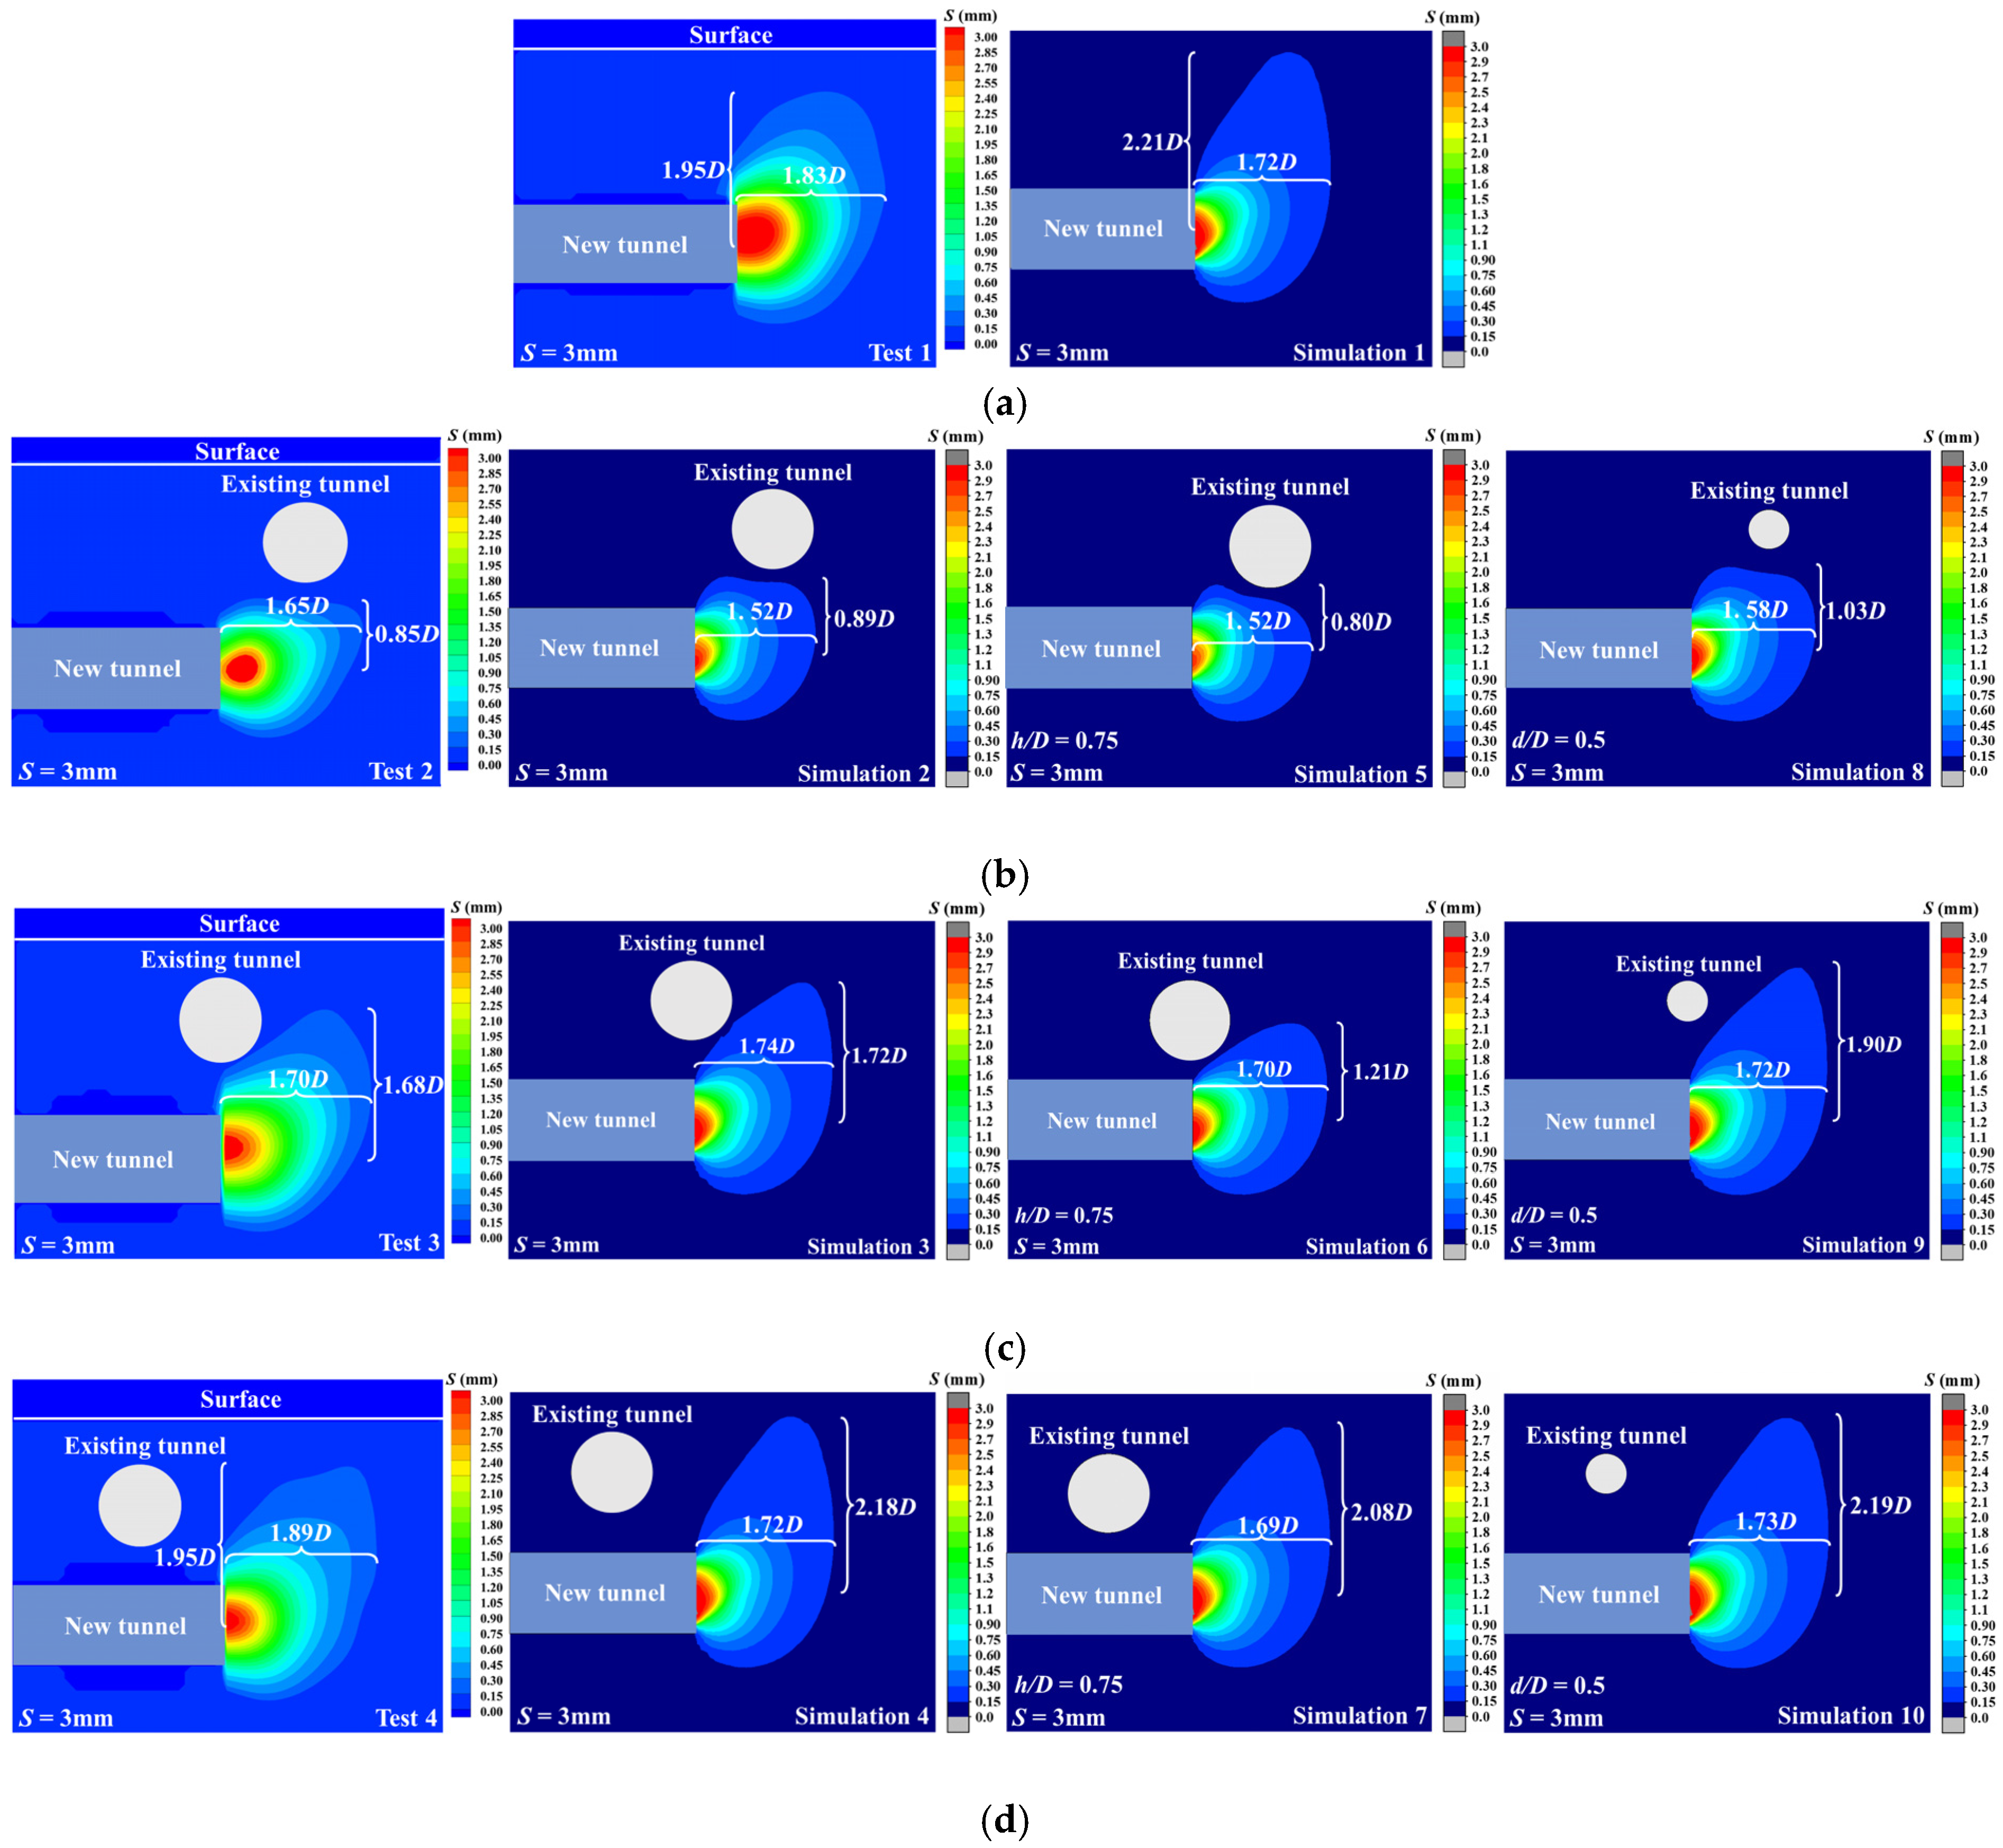
2.5.2. Soil Deformation Patterns

During the test, the computer controls the synchronized movement of the laser and the industrial camera, and 11 photographs are taken for every 1 mm of retreat of the excavated surface [26]. Figure 7 shows the cloud map of the soil deformation area after the excavation surface is destabilized. It is obtained by processing the photos taken at different moments in the test through particle image velocimetry. The test results show that the soil destabilization zone of each case essentially enters a state of equilibrium when the excavation surface setback distance S = 3 mm or so. Accordingly, the soil destabilization and deformation region when S = 1 mm, 2 mm, and 3 mm are selected for further analysis.
Under typical working conditions without the existing tunnel, the soil body ahead of the excavation undergoes stress release when the excavation face recedes by 1 mm. This eliminates the original stress state; however, due to the small distance of destabilization, no significant deformation of the soil body ahead of the excavation occurs. As the excavation face recedes, the soil body’s destabilization area expands gradually and extends to the surface. When the excavation face recedes by 3 mm, the damage mode of the soil body mainly consists of the logarithmic spiral body and the silo body above the excavation face. This finding is consistent with the conclusions of Liu [34] and Lei [35]. The existing tunnel has the greatest influence on the soil damage pattern when the excavation face is approaching it (L/D = 1). The damage form of the soil above the excavation face, in this case, is reflected as the extension of the soil along the outer contour of the existing tunnel to the surface, and the existing tunnel restricts the formation of the upper silo. When L/D = 0, the area of the upper silo in the destabilization region becomes narrower and the deformation trend of the soil body is reflected as a progression towards the surface along the side of the existing tunnel. When the excavation has already passed through the existing tunnel (L/D = −1), the existing tunnel has little effect on the soil in the destabilization zone.
The 11 photographs taken at different moments of instability of the excavation surface are reconstructed using the 3D reconstruction program developed by Ma [26], from which the 3D displacement field of the soil instability region can then be obtained. Figure 8 shows the three-dimensional displacement field of the soil destabilization region at S = 3 mm. It can be observed that the damaged area along the negative Z-axis of the 3D damage body model for each condition gradually decreases. This is because, as one moves farther away from the center section of the new tunnel along the Z-axis, the diameter of the corresponding section of the new tunnel becomes smaller, resulting in less influx of soil after destabilization, and the deformation area of the soil body is gradually reduced. This demonstrates that the stability problem of the excavated surface under the presence of an existing tunnel is a three-dimensional problem.

3. Finite Element Simulation

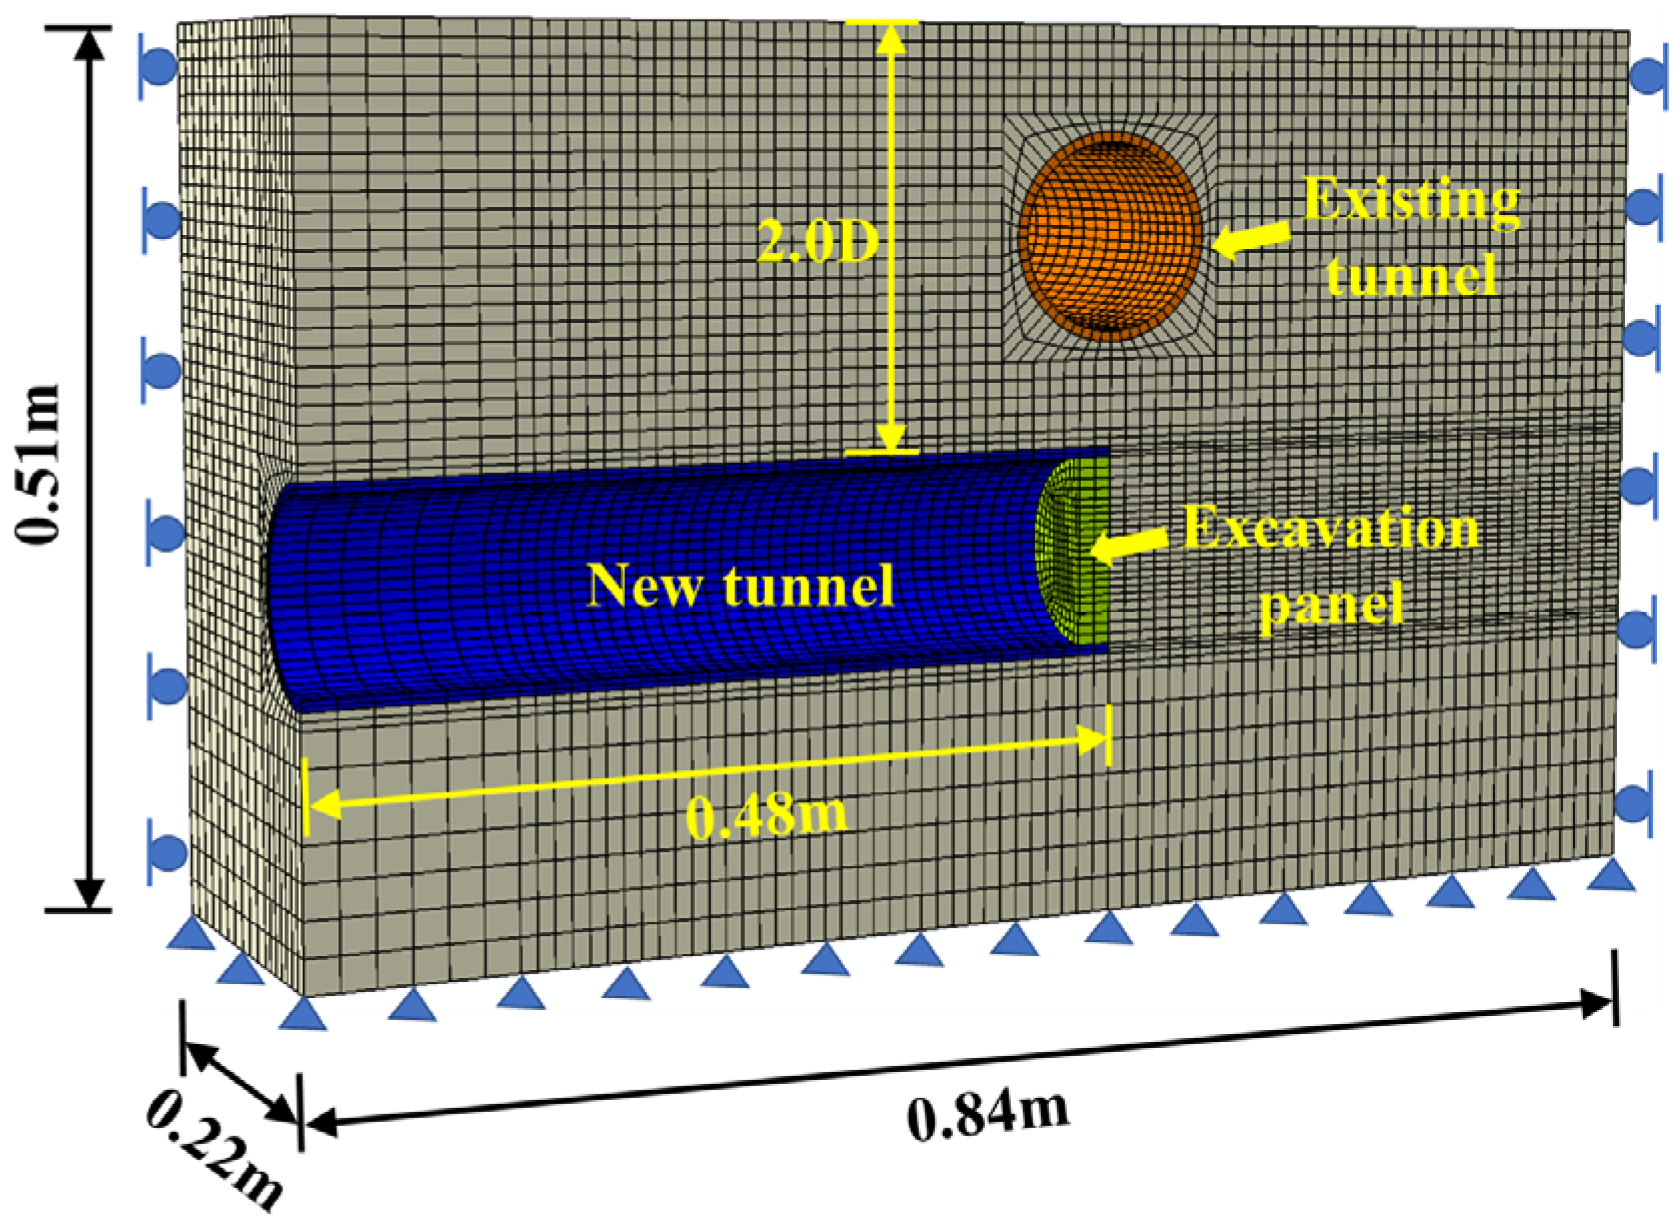
3.1. Finite Element Modeling

A 3D numerical model is developed consisting of a homogeneous clay layer, a new tunnel, an existing tunnel, and a shield excavation panel, as shown in Figure 9. The dimension of the model is 840 mm × 220 mm × 510 mm. The new tunnel and the existing tunnel have an outer diameter of 120 mm and an inner diameter of 108 mm. The depth of the overlying clay layer of the new tunnel is 2D. The tunnel excavation surface and the soil around the existing tunnel are divided into a denser fine mesh, while the soil area away from the tunnel is divided into a coarse mesh to balance the accuracy and computational efficiency. The clay layer, the new tunnel, the existing tunnel, and the shield excavation panel are modeled using C3D8 cells, with a total number of 66,940 cells. The interactions between the soil and the tunnel are defined as ‘hard contact’ in the normal direction and as friction contact in the tangential direction. The boundary conditions of the soil model are fixed constraints at the bottom, normal constraints at the sides, and free constraints at the top. Normal constraints are set on the side of the existing tunnel close to the new tunnel, and fixed constraints are set on the side of the existing tunnel away from the new tunnel to minimize the influence of boundary effects. The excavated panels are loaded with displacement loads in the horizontal direction and fixed in the rest of the directions to prevent rotation during the simulated pullback instability. The soil is modeled using the Mohr–Coulomb ideal elastic-plastic model, and the two tunnel linings and shield excavation panels are modeled using ideal elastic materials. The structural material parameters are listed in Table 4. Because the stability of excavation faces is the main focus of the study, the coupling effect between groundwater and soil is not considered.

3.2. Finite Element Simulation Schemes

The numerical simulation scheme is shown in Table 5. With the goal of further investigating the stability of the excavation surface with varying horizontal spacing between the two tunnels in the clay stratum, the parameters of numerical simulation schemes 1–4 are kept the same as the model test schemes. Based on schemes 1–4, the vertical spacing h between the two tunnels is reduced in schemes 5–7 from 1D to 0.75D to study the stability of the excavation surface when the vertical spacing between the two tunnels differs in the clay stratum. In schemes 8–10, the diameter d of the existing tunnels is reduced from 1D to 0.5D to study the stability of the excavation surface when the diameter ratios between the two tunnels vary.
To simulate the excavation instability process, the initial ground stress equilibrium of the model is necessary to establish. Since this study primarily focuses on investigating the effect of the progressive instability of the excavation surface and does not require simulation of the excavation process of the existing and new tunnels, the corresponding soil layers in the two tunnels are removed during the modeling process. Furthermore, the two tunnels and the excavation panels are treated as existing underground structures, and the ground stress equilibrium stage is established using predefined fields. The instability of the excavation surface is simulated by repeatedly applying horizontal displacement loads to the shield excavation panels, and the displacement loads applied in each analysis step correspond to the experimental process.

3.3. Finite Element Simulation Results

3.3.1. Comparison of Experimental Results with Finite Element Simulation Results

The support pressure ratio curves obtained from numerical simulation schemes 1–4 and the corresponding model tests are shown in Figure 10a. As can be seen from the diagram, the support pressure ratio curves under each existing tunnel condition are similar to the results obtained when there is no existing tunnel. The changing trend of the support pressure ratio can still be divided into two phases, as mentioned in Section 2.5.1. The maximum discrepancy between the values of the ultimate support pressure ratios obtained from the numerical simulation and the model test is about 5.5%, which initially verifies the reliability of the numerical model.
Figure 10b shows the support pressure ratio curves after reducing the vertical distance and diameter ratio of the two tunnels in the numerical simulation. Compared to the numerical simulation conditions of h/D = 1 and d/D = 1, the reduction of the vertical distance of the two tunnels (h/D = 0.75 and d/D = 1) lowers the ultimate support pressure at L/D = 1 and L/D = 0 by about 2.9% and 2.2%. This phenomenon can be attributed to the fact that the decrease in the vertical distance between the two tunnels allows for a larger area of the upper soil layer to be supported by the existing tunnels, thereby isolating the stress transfer from the upper soil to the lower soil to a greater extent. The existing tunnel further hinders the development of the soil arch zone, and the reduction of the lower soil arch zone enables the soil within the range to reattain a stable state after a shorter backward displacement. The reduction of the tunnel diameter ratio (h/D = 1, d/D = 0.5) increases the ultimate support pressure at L/D = 1 and L/D = 0 by about 8.3% and 2.6%, respectively. The decrease in the tunnel diameter of the existing tunnel weakens its interaction with the surrounding soil and reduces the area of soil that can be confined. Therefore, the stress transfer from the soil above the existing tunnel is more direct. After the destabilization of the excavation surface, the soil arch area develops to the ground surface more obviously, so it needs a larger ultimate support force to make the excavation surface reach a stable state again.
As shown in Figure 11, the soil destabilization deformation maps (S = 3 mm) obtained from the test for each working condition are processed to produce the corresponding displacement contour maps, which are then compared to the results of numerical simulation schemes 1–10. The soil damage patterns derived from the numerical simulation of conditions 1–4 are consistent with the model test results. The main source of discrepancy between the two is the variation in the extent of the soil deformation area. Specifically, the error range of the farthest distance from the excavation surface in the horizontal direction is about 2.4–9%, while the error range of the maximum height extending upward from the excavation surface axis in the vertical direction is about 2.4–13.3%. These findings further confirm that the soil deformation pattern is consistent with the model test results.
In addition, compared to h/D = 1, the soil destabilization area under different horizontal spacing conditions reduces when h/D = 0.75. When L/D = 1, the maximum height of the destabilization area extending from the central axis of the excavation surface to the ground surface is reduced by about 10%, and the whole damage mode is reflected as the extension of the gap between the two tunnels. When L/D = 0, the furthest distance of influence in the horizontal direction is reduced by about 2.3%, while the maximum height of extension in the vertical direction is reduced by about 30%. When L/D = −1, the maximum height of extension in both horizontal and vertical directions is slightly reduced by about 1.75% and 4.6%, respectively. This indicates that when the vertical spacing between the two tunnels is reduced, the existing tunnel limits the further extension of the soil damage zone to the surface. This reduces the probability of collapse damage at the surface to a certain extent.
The difference between the destabilization modes of cases d/D = 1 and d/D = 0.5 is the extension height of the destabilized zone towards the ground surface. Compared to d/D = 1, the maximum extension height of the destabilized zone towards the ground surface at each horizontal spacing for d/D = 0.5 increases, reaching approximately 9.2%, 10.5%, and 0.5% for L/D = 1, L/D = 0, and L/D = −1, respectively. When the diameter ratio of the two tunnels is reduced, the supporting effect of the existing tunnel on the upper soil body and the tube–soil interaction is reduced. Consequently, the soil arch area needs to develop more extensively towards the surface to bring the excavated surface back to a stable condition.

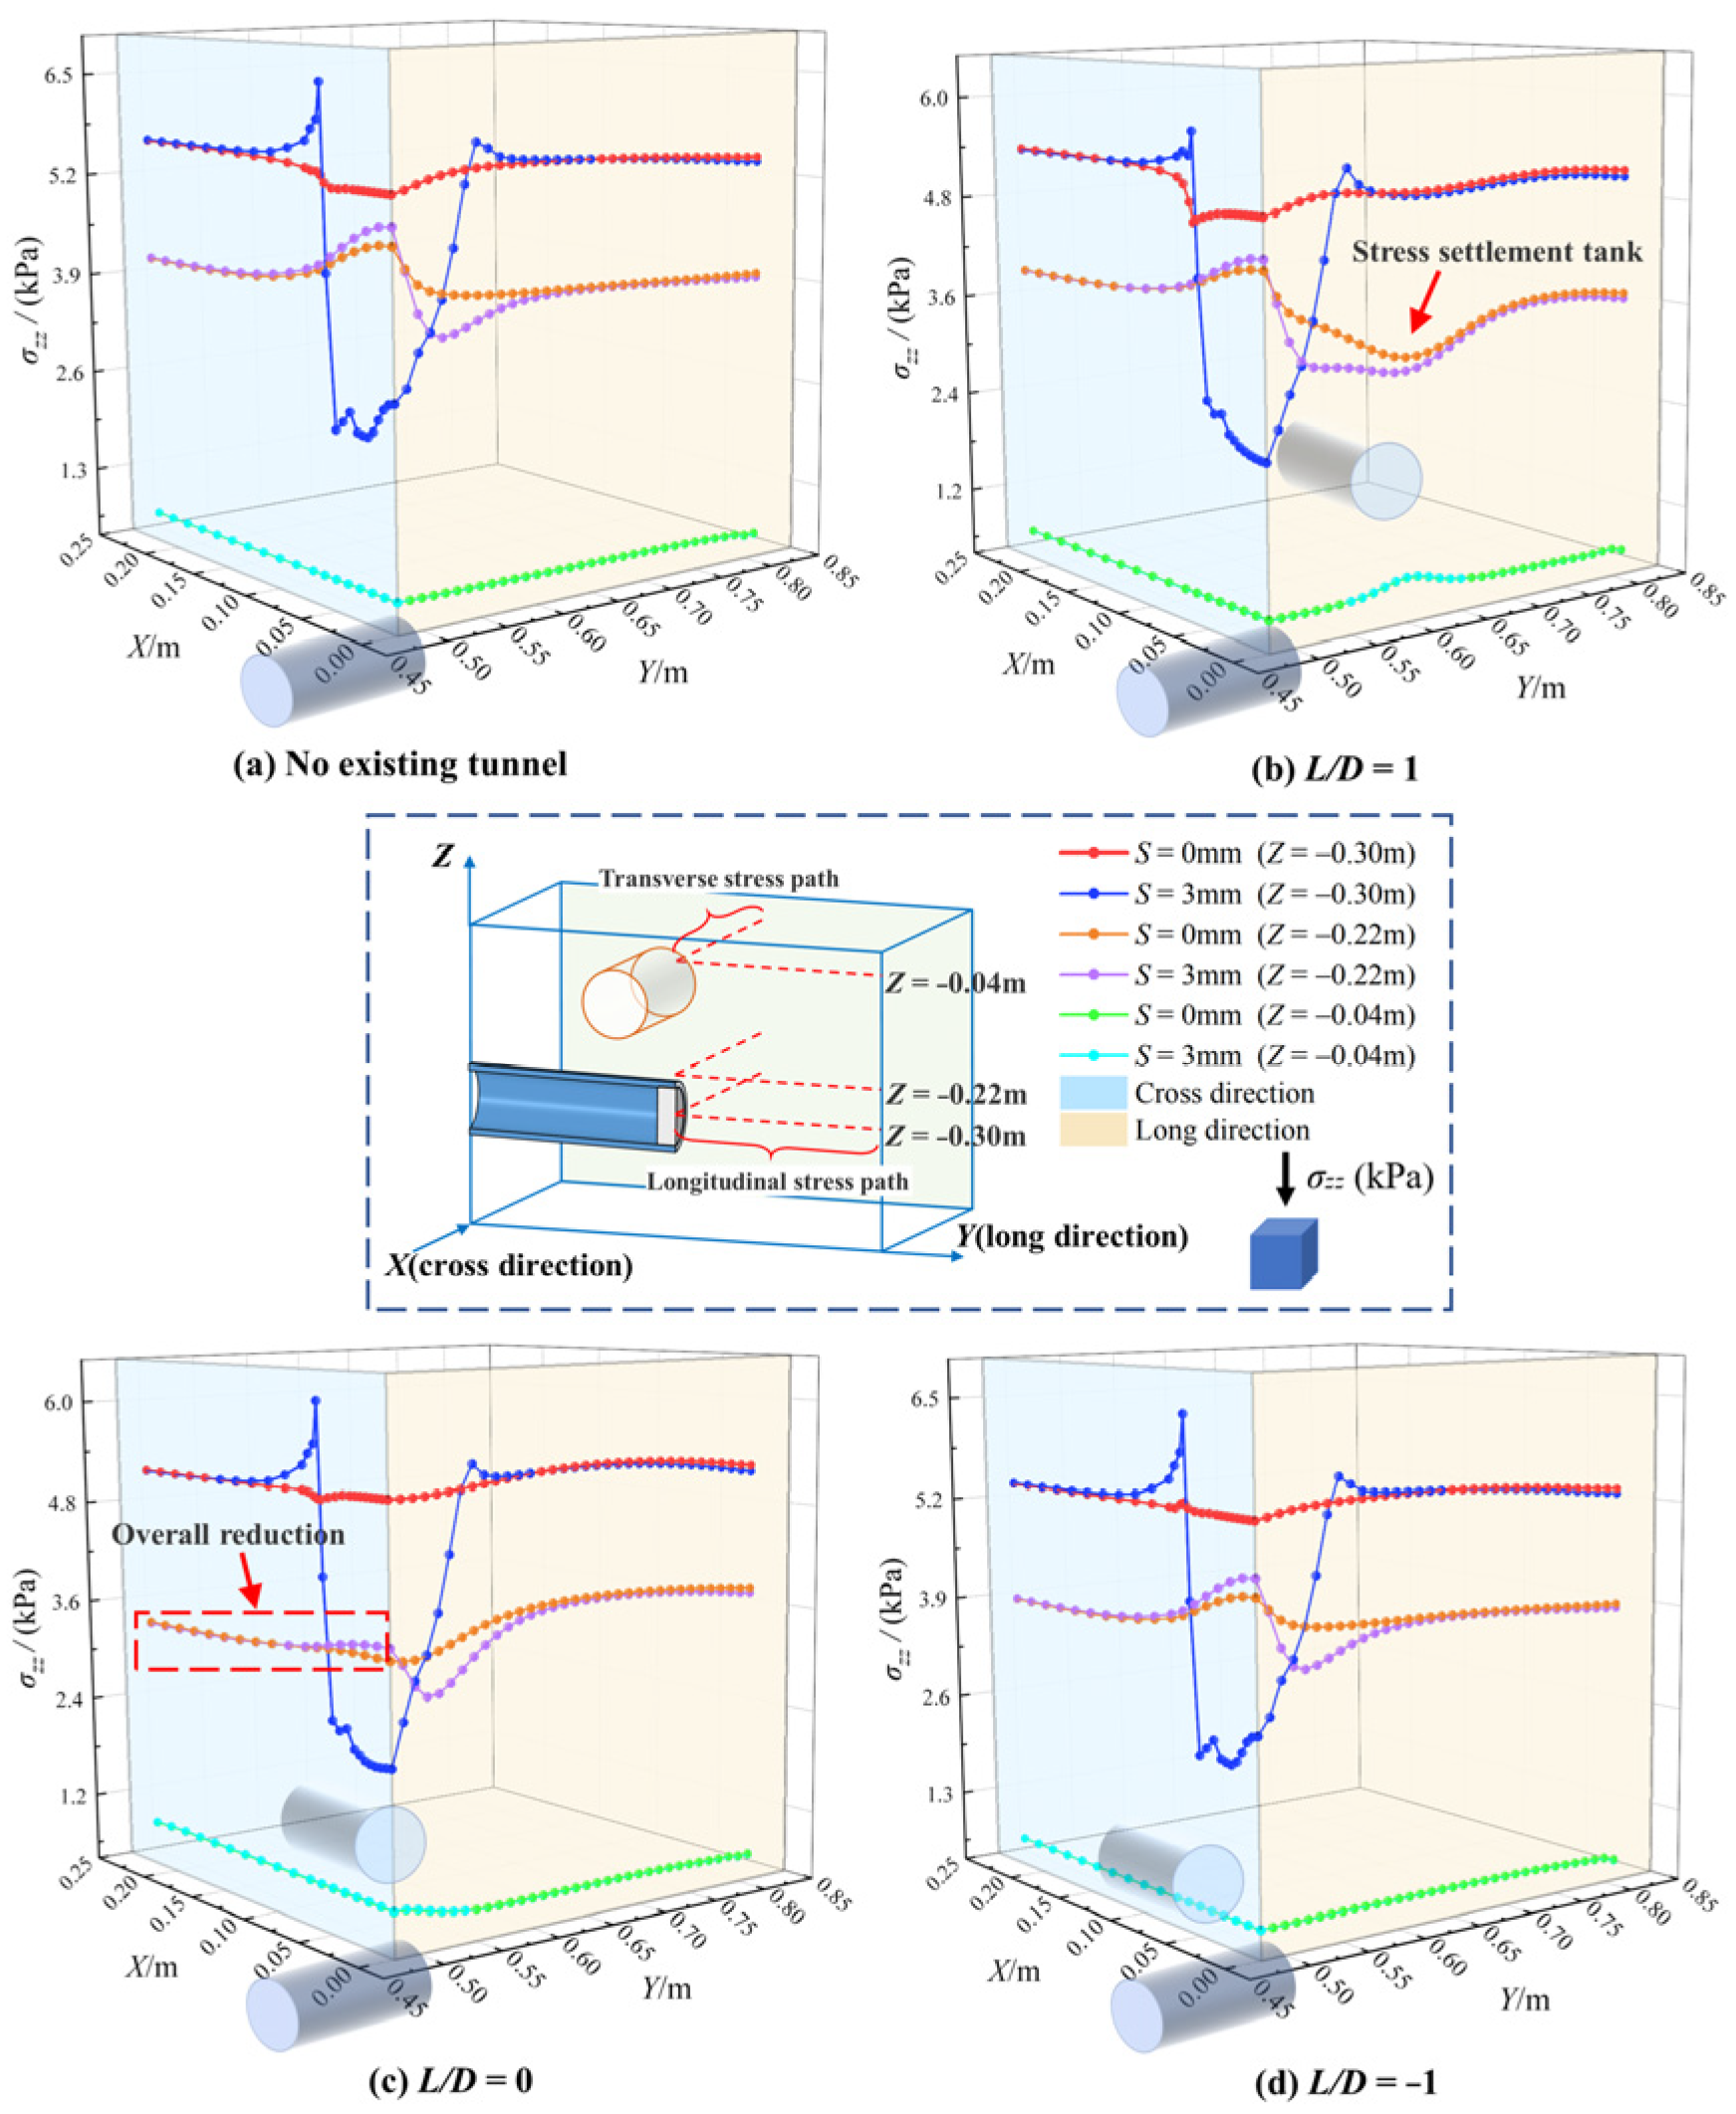
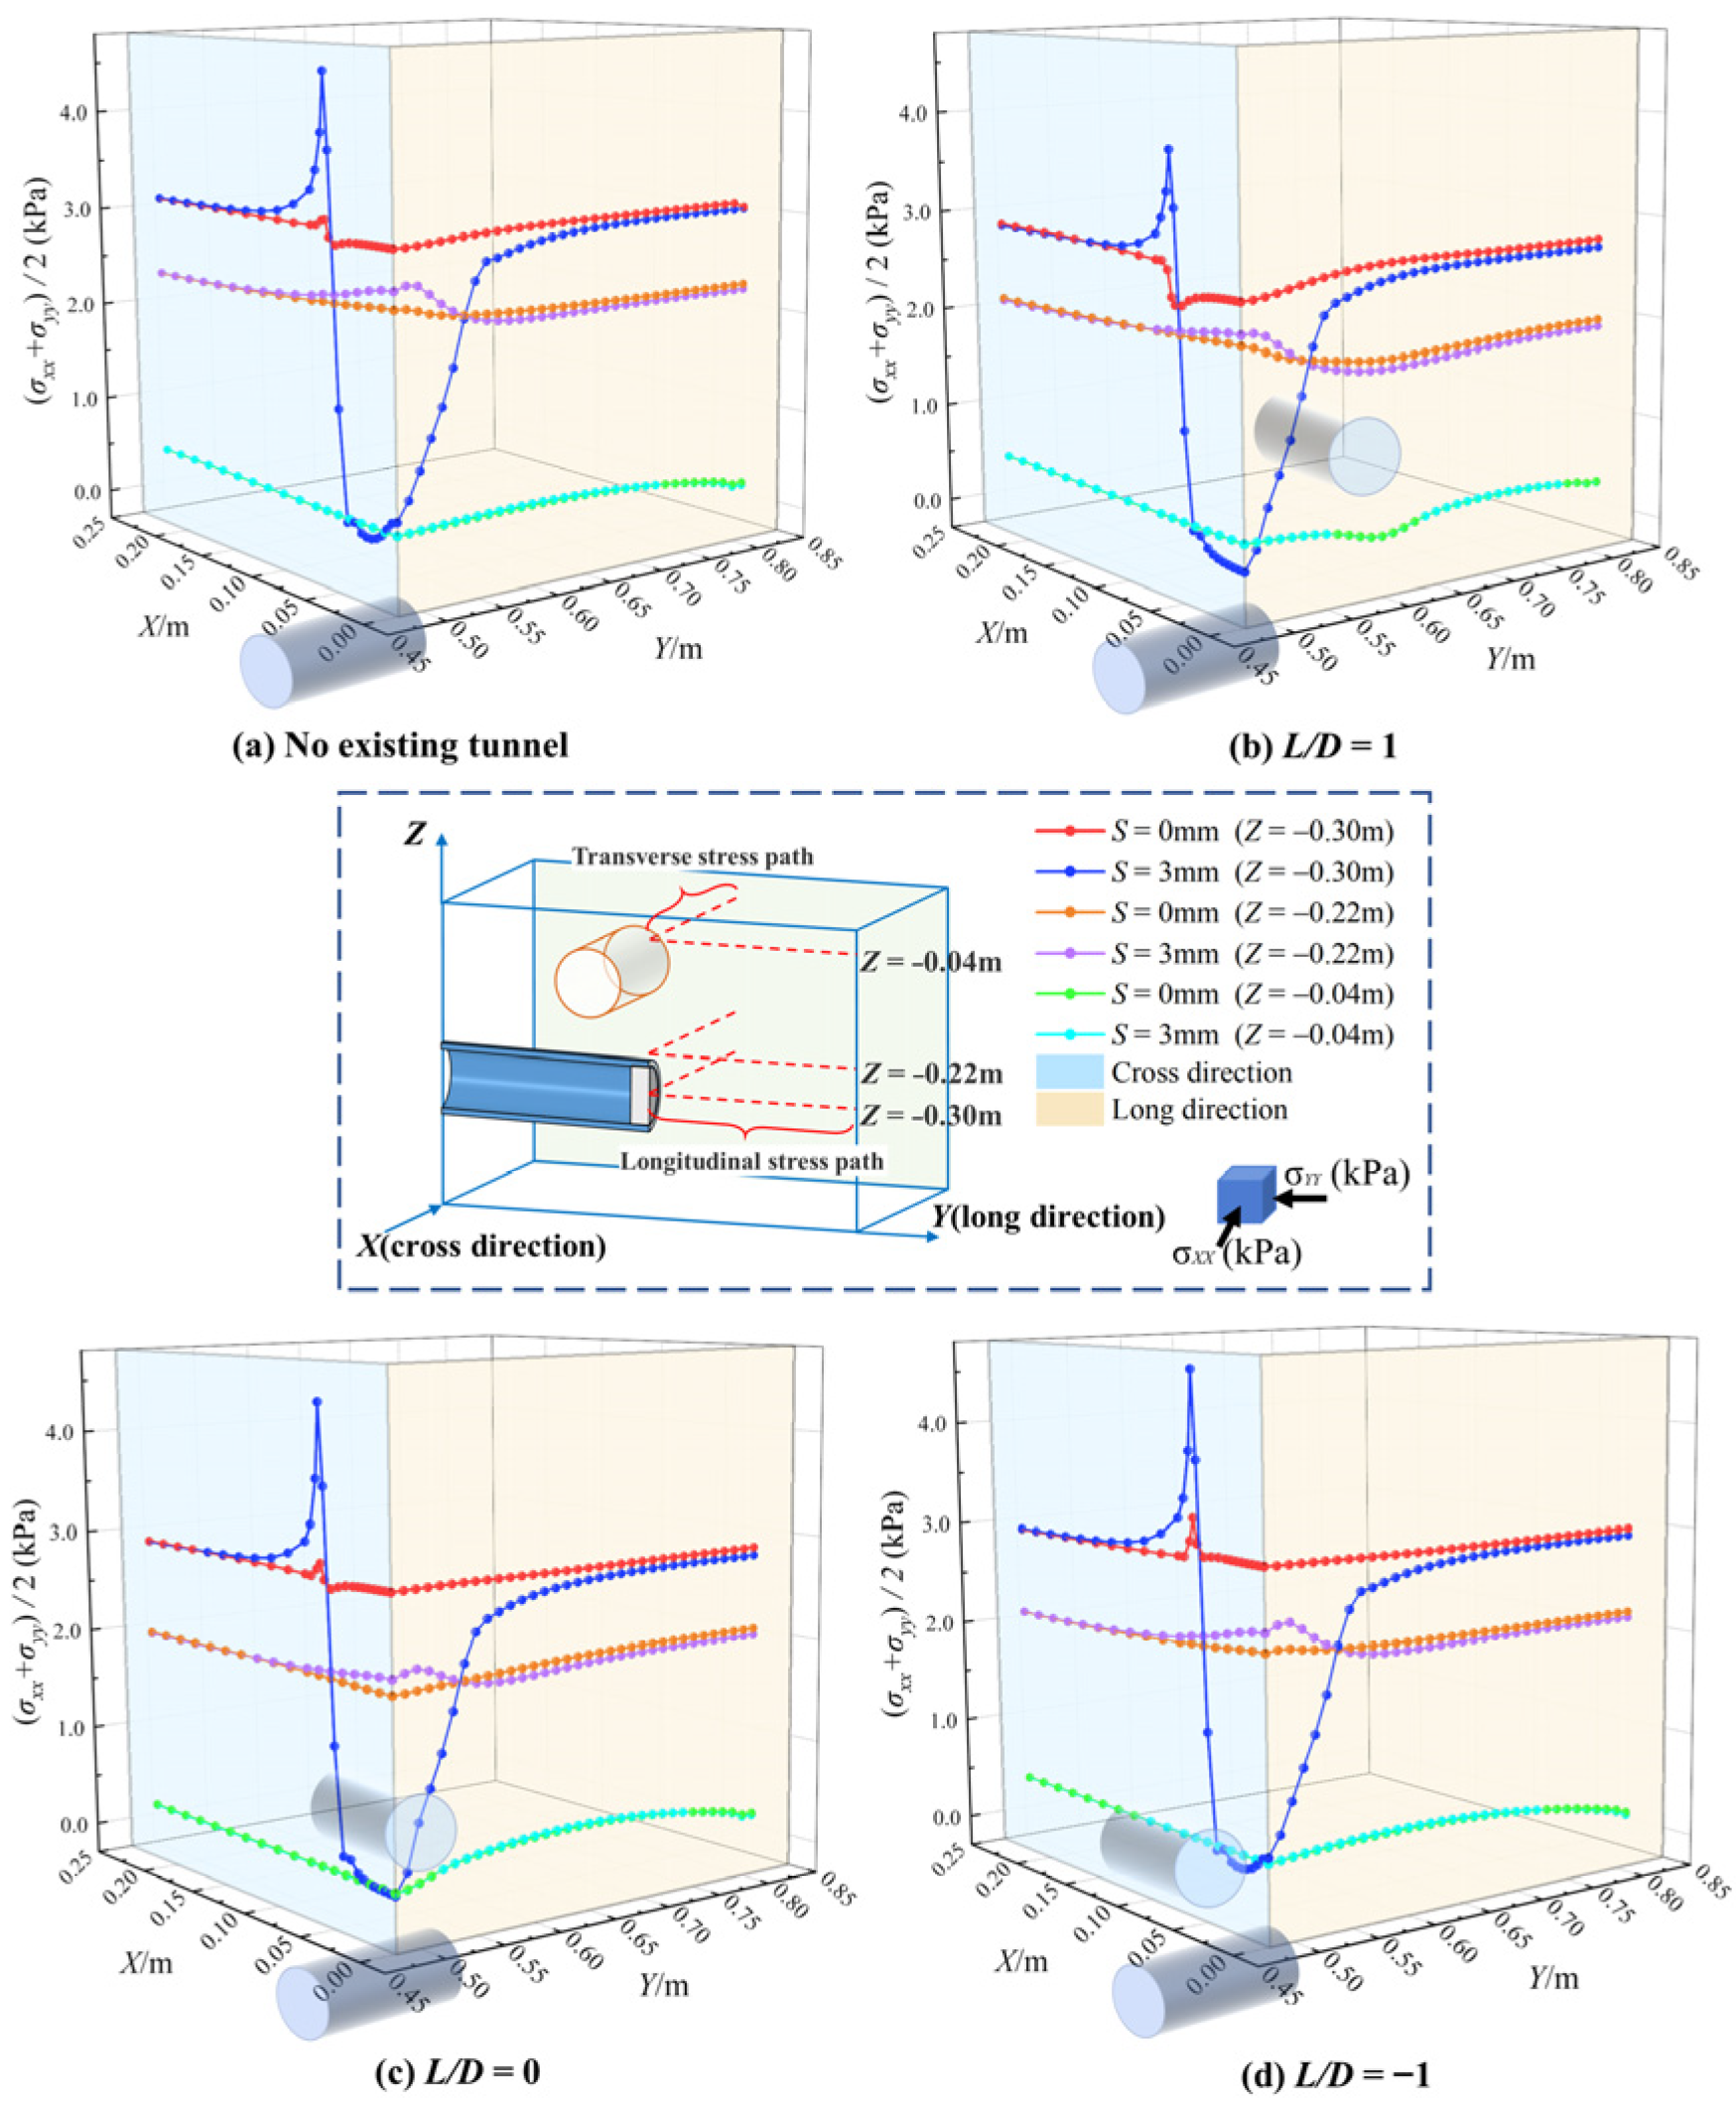
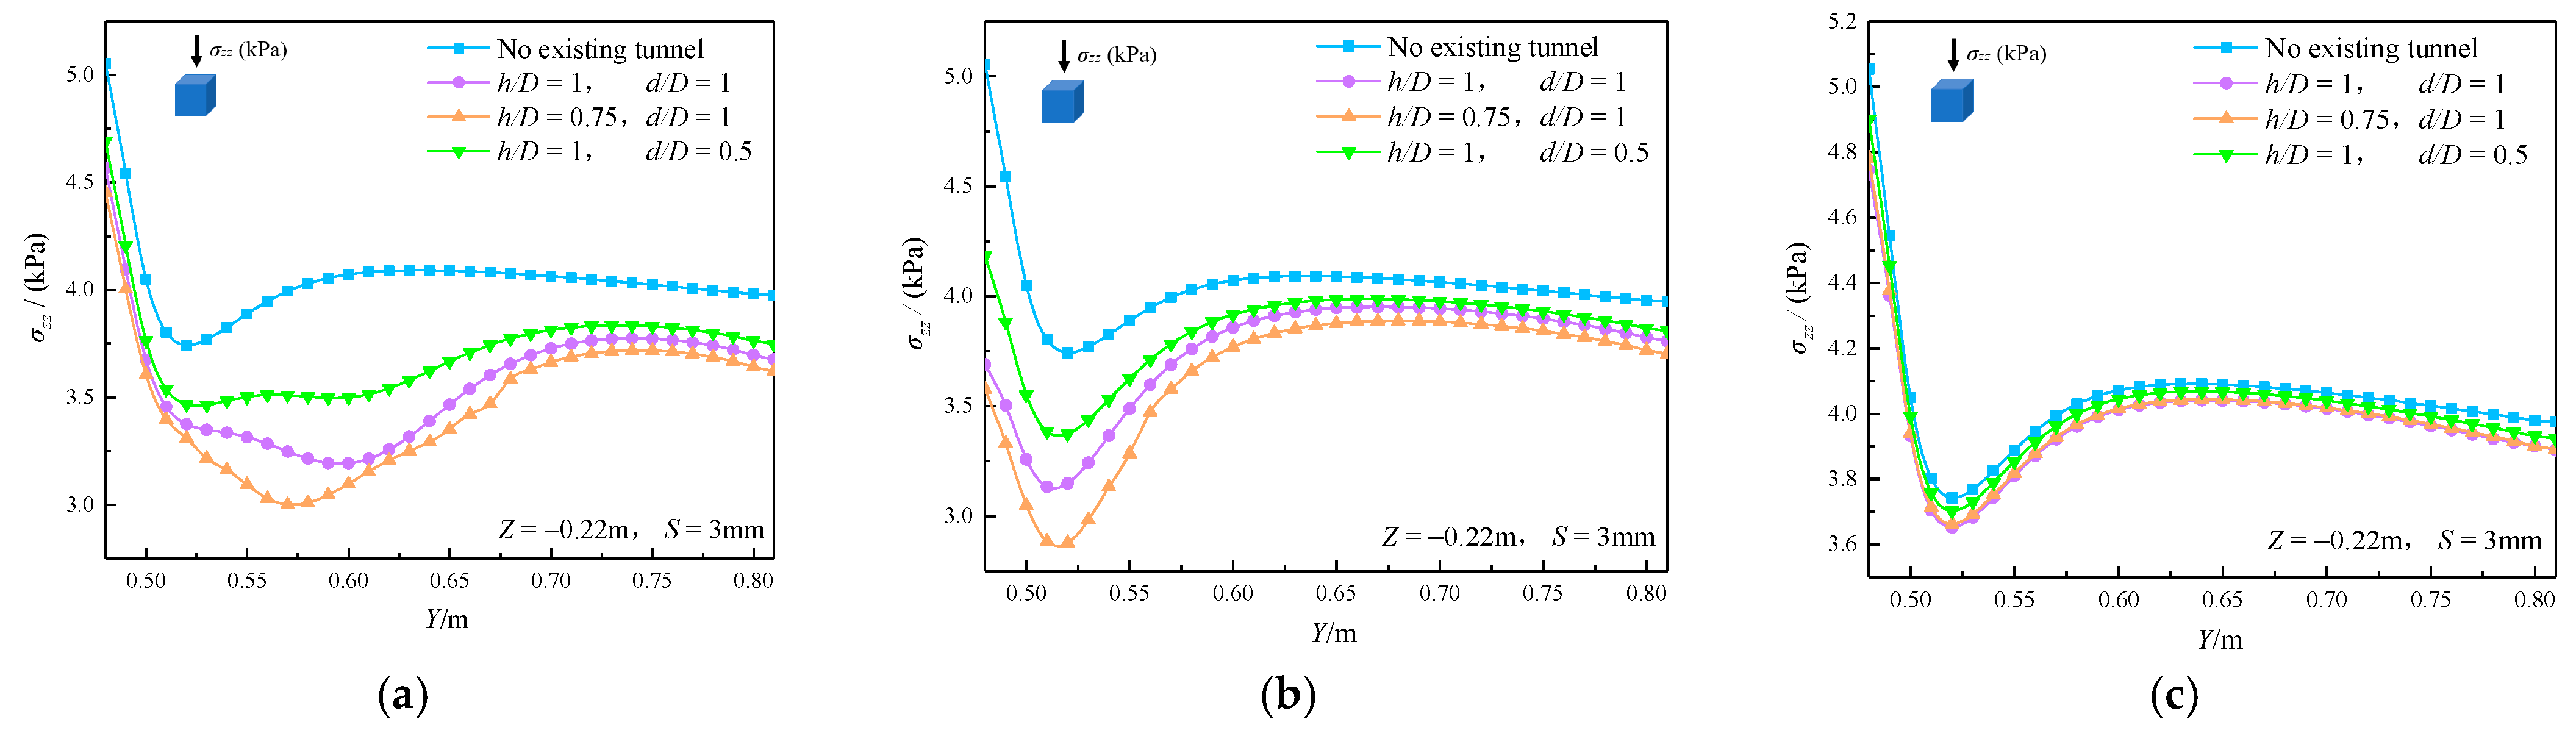
3.3.2. Changes in Soil Stresses

To have a more detailed understanding of the stress trends in the soil after the excavation surface is destabilized, soil stress points are selected in numerical simulation conditions 1–4 along the transverse and longitudinal stress paths in different cross-sections in front of the excavation surface (Z = −0.30 m, −0.22 m, −0.04 m). Soil stresses at different setback stages are analyzed. The stress paths, soil vertical stresses, and average horizontal stress changes are shown in Figure 12 and Figure 13. As shown in the figure, Z = −0.30 m marks the center of the excavation face of the new tunnel, Z = −0.22 m marks the location between the two tunnels, and Z = −0.04 m marks the location above the existing tunnels. The vertical stress and average horizontal stress of the soil body are σzz and (σxx + σyy)/2, respectively.
As shown in Figure 12, when the excavation surface retreat distance is 3 mm, the soil body in front of the excavation undergoes stress unloading. The vertical stress of the soil body on both sides of the stress path at the center of the excavation surface (Z = −0.30 m) is significantly reduced for all horizontal spacing. The minimum vertical stress varies in the range of 51.02–53.87% as opposed to the initial stress state, wherein the area of the soil body with reduced vertical stress in each condition at this stage develops at a distance of 0.42 D–0.5 D from the center of the excavation surface. As the distance of the soil body from the excavation surface increases, the vertical stress of the soil body gradually increases until it becomes stable. This might be because this area is located at the boundary of the soil arch, which is subjected to the transmission of the soil pressure at the far end. A comparison of the vertical stresses in the two directions of the stress paths reveals that the transverse stress path has higher vertical stresses than the longitudinal direction. This is because the soil in this region is adjacent to the new tunnel, and following destabilization, the soil in front of the excavation is driven into the tunnel. This leads to the interaction between the soil in this region and the new tunnel, increasing vertical stresses.
Comparing the conditions between cases with and without the existing tunnel reveals that the existing tunnel has a greater impact on the soil stresses when L/D = 1 and L/D = 0, primarily in the soil between the two tunnels. When Z = −0.22 m and S = 0 mm, Figure 12b shows a stress settling in the soil body under the existing tunnels, with an average vertical stress reduction in the longitudinal direction of about 10.8%. Figure 12c shows an overall reduction in initial vertical stress along the transverse axis, wherein the average vertical stresses in the transverse direction are reduced by about 20.8%. This reflects that the existing tunnel balances some of the stresses in the upper soil by self-deformation and isolates the transmission of vertical stresses from the upper soil. Z = −0.04 m marks the area above the existing tunnel, where the vertical stresses of the soil body always remain in a relatively stable state.
Figure 13 illustrates that the average horizontal stress in the soil body of each path follows a similar trend to that of vertical stress, except for minute differences. The minimum average horizontal stress at Z = −0.30 m has a larger shrinkage value, which is concentrated in the range of 89.2–92.5%, whereas at Z = −0.22 m, there is no visible change in the average horizontal stress when L/D = 0 and L/D = 1. Therefore, the presence of existing tunnels has less influence on the average horizontal stress of the soil body.
To reveal the changing law of soil stress in the change of vertical spacing and diameter ratio between two tunnels, the vertical stress and average horizontal stress change curves of the soil body in the longitudinal stress path (Z = −0.22 m) at S = 3 mm are plotted as shown in Figure 14 and Figure 15.
Figure 14a,b shows that when the vertical spacing between the two tunnels is reduced, the vertical stresses in the soil below the existing tunnel decrease to varying degrees. This shows that the vertical stresses shared by the existing tunnel increase with the increase in the tunnel depths, reinforcing its role as the “support” for the upper soil, which leads to an overall reduction in the vertical stresses in the soil layer below the existing tunnel. When h/D = 0.75, the vertical stresses in the soil layer under the two conditions of L/D = 1 and L/D = 0 exhibit evident reduction zones compared to that of h/D = 1, with minimum vertical stresses lowered by about 6% and 8.1%, respectively. When the diameter ratio of the two tunnels is reduced, the supporting effect of the existing tunnel is weakened, resulting in an increase in the vertical stresses in the soil at each cross-section underneath the tunnels. When d/D = 0.5, the vertical stresses for the cases of horizontal spacings L/D = 1 and L/D = 0 increase significantly compared to those at d/D = 1, with average vertical stresses in the longitudinal direction increasing by about 4.1% and 2.6%, respectively.
The average horizontal stress in the soil for each condition follows a similar trend to the vertical stress. Figure 15a,b indicates that when h/D = 0.75, the change curves of the average horizontal stress in the soil for cases of L/D = 1 and 0 show a more noticeable shrinkage zone than that of h/D = 1, and the minimum average horizontal stress in the longitudinal direction is lowered by about 11.9% and 4.3%, respectively. The reduction in the tunnel diameter ratio causes an increase in the average horizontal stress in the soil underneath the existing tunnel. When d/D = 0.5, the average horizontal soil stresses in the longitudinal direction for L/D = 1 and L/D = 0 increase significantly compared to those at d/D = 1, increasing by about 6.1% and 4.4%, respectively.

3.3.3. Deformation Trend of Existing Tunnel

Table 6 shows the cross-sectional deformation trend of the existing tunnel for the different horizontal spacings between the two tunnels, vertical spacings, and tunnel diameter ratios. The table shows that for numerical simulation scenarios 2–4, when the existing tunnel is located in front of (L/D = 1) or directly above (L/D = 0) the excavation surface, the cross-section of the existing tunnel is deformed elliptically. This is mainly due to the formation of the stress-unloading region in front of the destabilized excavation surface; the side of the existing tunnel near the excavated surface tends to move toward the stress-unloading region, which gradually evolves from a circle to an ellipse. Different horizontal spacings of the two tunnels cause the tunnel cross-section to deform along different angles. The angles between the long axis of the deformation ellipse and the horizontal centerline of the tunnel are about 109.3° and 57.9° when L/D = 1 and L/D = 0, respectively. Due to the different locations of the relative stress unloading zones, the deformation directions of the two conditions differ significantly. The long axis of the elliptic section is longer when L/D = 1, and the existing tunnel is most affected by the destabilization of the excavation surface. Although the existing tunnel is closer to the unloading zone of the excavation surface when L/D = 0, its inclination to form an ‘ellipse-shaped’ deformed cross-section is limited by the newly built tunnel underneath. When L/D = −1, the existing tunnel is farther away from the excavation surface and thus is least affected.
When h/D = 0.75, the ‘ellipse’ trend of the existing tunnel becomes more noticeable. This indicates that the existing tunnel is now closer to the destabilization zone of the excavation surface and is greatly affected by the stress unloading zone. The angle between the deformed ellipse’s long axis and the tunnel’s horizontal centerline increases for L/D = 1 and L/D = 0, and the maximum deformation of the cross-section varies with the spacing between the two tunnels.
When d/D = 0.5, the existing tunnel for L/D = 1 is affected by the stress unloading zone and moves downward. The lower half of the cross-section essentially shows expansion deformation towards the excavation surface, while the upper half of the tunnel undergoes inward depression deformation due to the extrusion of the soil body on both sides and the loading of the soil body from above. When L/D = 0, the deformation trend of the cross-section of the existing tunnel mainly shows ‘elliptical’ deformation, inclining towards the stress unloading zone, wherein the radial deformation increment of the lower half of the cross-section is larger.

4. Conclusions

This study aims to discuss the effects of the destabilization of the excavation surface when the shield is underpassing an existing tunnel. The study adopts laboratory model tests and finite element simulation to analyze the impact of various parameters on the deformation of the existing tunnel and the surrounding soil. The parameters included in the study are horizontal spacing, vertical spacing, and tunnel diameter ratios between the two tunnels. The main conclusions of this study are as follows:
(1) For horizontal spacings of L/D = 1 and L/D = 0, compared to the ultimate support pressure in the case without the existing tunnel, the ultimate support pressure is shown to be lower by 17.6% and 8.7%, respectively. As the horizontal spacing between the two tunnels is reduced, the impact of the existing tunnel on the excavation face gradually weakens. For a constant horizontal spacing between the two tunnels, the ultimate support pressure of the excavation face decreases with decreasing vertical spacing between the two tunnels. Conversely, the ultimate support pressure of the excavation face increases with a decreasing tunnel diameter ratio between the two tunnels.
(2) When L/D = 1 and L/D = 0, the presence of existing tunnels mainly restricts the development of the upper silo in the destabilization mode, which narrows the influence range in the horizontal and vertical directions. The reduction in the horizontal spacing between the two tunnels, the reduction in the tunnel-to-diameter ratio, and the increase in the vertical spacing weaken this restrictive effect.
(3) For the soil located between the two tunnels (Z = −0.22 m), the existing tunnels prevent the transfer of stresses from the upper soil, which reduces the vertical and average horizontal stresses in the soil below the existing tunnels, with the initial average vertical stress in the longitudinal direction shrinking by about 10.8% for L/D = 1, and by about 20.8% for L/D = 0 = in the transverse direction. When the horizontal spacing between the two tunnels is constant, the reduction tendency becomes more and more obvious as the vertical spacing between the tunnels decreases and the tunnel-to-diameter ratio increases.
(4) When L/D = 1 and L/D = 0, the deformation of the existing tunnel is mainly characterized by an elliptical deformation inclining towards the soil stress release zone. However, the deformation direction of the two tunnels varies considerably when the relative positions of the tunnels are changed. The deformation of the existing tunnel is extensive when L/D = 1, and increases with the reduction in the vertical spacing between the two tunnels. As the tunnel-to-diameter ratio is decreased, the deformation of the existing tunnel mainly manifests as an overall settlement towards the stress-release zone. Therefore, in each working condition of the shield orthogonal underpass, although when L/D = 1 the stability of the excavation surface plays a certain support role, at this time the existing tunnel subject to the excavation surface destabilization zone, which has the greatest impact; thus, at this point, measures to strengthen the existing tunnel protection should be implemented.

Author Contributions

Conceptualization, S.M. and Z.H.; validation, Z.D. and Z.Z.; investigation, Z.H.; writing—original draft preparation, Z.Z.; writing—review and editing, P.A., B.H. and J.L. All authors have read and agreed to the published version of the manuscript.

Funding

This research was funded by the National Natural Science Foundation of China (No. 52268062 and No. 52278337), the Guangxi Key Project of Nature Science Foundation (No. 2020GXNSFDA238024), and the Systematic Project of Guangxi Key Laboratory of Disaster Prevention and Engineering Safety (No. 2022ZDK025).

Institutional Review Board Statement

Not applicable.

Informed Consent Statement

Not applicable.

Data Availability Statement

The original contributions presented in the study are included in the article, further inquiries can be directed to the corresponding author.

Conflicts of Interest

The authors declare no conflicts of interest.

References

  1. Guan, L.; Wang, P.; Ding, H.; Qin, J.; Xu, C.; Feng, G. Analysis of Settlement of an Existing Tunnel Subjected to Undercrossing Tunneling Based on the Modified Vlasov Model. Int. J. Geomech. 2024, 24, 04023300. [Google Scholar] [CrossRef]
  2. Ou, X.; Liu, Y.; Li, C.; Zhou, X.; Chen, Q.; Zhou, Y.; Zhang, Q. Analysis of the Interaction Effects of Shield Structure Oblique Passing under an Existing Tunnel. Appl. Sci. 2022, 12, 5569. [Google Scholar] [CrossRef]
  3. Liu, X.; Fang, Q.; Jiang, A. Deformation analysis of existing tunnels with shearing and bending stiffness reduction at movement joints. Tunn. Undergr. Space Technol. 2022, 123, 104408. [Google Scholar] [CrossRef]
  4. Zhang, D.; Huang, Z.; Li, Z.; Zong, X.; Zhang, D. Analytical solution for the response of an existing tunnel to a new tunnel excavation underneath. Comput. Geotech. 2019, 108, 197–211. [Google Scholar] [CrossRef]
  5. Fang, Q.; Liu, X.; Zeng, K.; Zhang, X.; Zhou, M.; Du, J. Centrifuge modelling of tunnelling below existing twin tunnels with different types of support. Undergr. Space 2022, 7, 1125–1138. [Google Scholar] [CrossRef]
  6. Jin, D.; Yuan, D.; Liu, S.; Li, X.; Luo, W. Performance of Existing Subway Tunnels Undercrossed by Four Close-ly Spaced Shield Tunnels. J. Perform. Constr. Facil. 2019, 33, 04018099. [Google Scholar] [CrossRef]
  7. Jiang, B.; Chen, L.; Yang, J.S.; Wang, S.; Ng, C.W.W. Effects of twin-tunnel excavation on an existing horse-shoe-shaped tunnel considering the influence of a settlement joint. Can. Geotech. J. 2017, 54, 1346–1355. [Google Scholar] [CrossRef]
  8. Zhang, J.; Ye, L.; Yan, C.; Yan, B.; Wei, P.; Feng, J. Study on Construction Influence of Shield Tunnel of Urban Rail Transit on Large-Section Mining Tunnel. Adv. Civ. Eng. 2020, 2020, 1–20. [Google Scholar] [CrossRef]
  9. Boonyarak, T.; Ng, C.W.W. Three-dimensional influence zone of new tunnel excavation crossing underneath existing tunnel. JGS Spec. Publ. 2016, 2, 1513–1518. [Google Scholar] [CrossRef]
  10. Fu, J.; Zhao, N.; Qu, Y.; Yang, J.; Wang, S. Effects of twin tunnel undercrossing excavation on the operational high speed railway tunnel with ballastless track. Tunn. Undergr. Space Technol. 2022, 124, 104470. [Google Scholar] [CrossRef]
  11. Lai, H.; Zheng, H.; Chen, R.; Kang, Z.; Liu, Y. Settlement behaviors of existing tunnel caused by obliquely un-der-crossing shield tunneling in close proximity with small intersection angle. Tunn. Undergr. Space Technol. 2020, 97, 103258. [Google Scholar] [CrossRef]
  12. Liu, S.; Wang, Y.; Zhou, H.; Sun, C.; Lin, D. Model Test on Approaching the Construction of Multi-Line Over-lapping Shield Tunnels for Up- and Down-Crossing. Processes 2022, 10, 500. [Google Scholar] [CrossRef]
  13. Yang, J.; Liu, C.; Chen, Q.; Xie, X. Performance of overlapped shield tunneling through an integrated physical model tests, numerical simulations and real-time field monitoring. Undergr. Space 2017, 2, 45–59. [Google Scholar] [CrossRef]
  14. Lin, Q.; Lu, D.; Lei, C.; Tian, Y.; Kong, F.; Du, X. Mechanical response of existing tunnels for shield un-der-crossing in cobble strata based on the model test. Tunn. Undergr. Space Technol. 2022, 125, 104505. [Google Scholar] [CrossRef]
  15. Li, P.; Du, S.; Ma, X.; Yin, Z.; Shen, S. Centrifuge investigation into the effect of new shield tunnelling on an existing underlying large-diameter tunnel. Tunn. Undergr. Space Technol. 2014, 42, 59–66. [Google Scholar] [CrossRef]
  16. Weng, X.; Yu, H.; Niu, H.; Hu, J.; Han, W.; Huang, X. Interactive effects of crossing tunnel construction on ex-isting tunnel: Three-dimensional centrifugal test and numerical analyses. Transp. Geotech. 2022, 35, 100789. [Google Scholar] [CrossRef]
  17. Iskander, M.G.; Lai, J.; Oswald, C.J.; Mannheimer, R.J. Development of a Transparent Material to Model the Geotechnical Properties of Soils. Geotech. Test. J. 1994, 17, 425–433. [Google Scholar] [CrossRef]
  18. Iskander, M.G.; Liu, J.; Sadek, S. Transparent Amorphous Silica to Model Clay. J. Geotech. Geoenviron. Eng. 2002, 128, 262–273. [Google Scholar] [CrossRef]
  19. Ezzein, F.M.; Bathurst, R.J. A Transparent Sand for Geotechnical Laboratory Modeling. Geotech. Test. J. 2011, 34, 590–601. [Google Scholar] [CrossRef]
  20. Guzman, I.L.; Iskander, M. Geotechnical Properties of Sucrose-Saturated Fused Quartz for Use in Physical Modeling. Geotech. Test. J. 2013, 36, 448–454. [Google Scholar] [CrossRef]
  21. Ni, Q.; Hird, C.C.; Guymer, I. Physical modelling of pile penetration in clay using transparent soil and particle image velocimetry. Géotechnique 2010, 60, 121–132. [Google Scholar] [CrossRef]
  22. Qi, C.; Zheng, J.; Zuo, D.; Chen, G. Measurement on soil deformation caused by expanded-base pile in trans-parent soil using particle image velocimetry (PIV). J. Mt. Sci. 2017, 14, 1655–1665. [Google Scholar] [CrossRef]
  23. Yuan, B.; Li, Z.; Zhao, Z.; Ni, H.; Su, Z.; Li, Z. Experimental study of displacement field of layered soils sur-rounding laterally loaded pile based on transparent soil. J. Soils Sediments 2021, 21, 3072–3083. [Google Scholar] [CrossRef]
  24. Le, X.; Cui, X.; Zhang, M.; Xu, Z.; Dou, L. Behavior Investigation of Necking Pile with Caps Assisted with Transparent Soil Technology. Sustainability 2022, 14, 8681. [Google Scholar] [CrossRef]
  25. Wang, Z.; Li, C.; Ding, X. Application of transparent soil model tests to study the soil-rock interfacial sliding mechanism. J. Mt. Sci. 2019, 16, 935–943. [Google Scholar] [CrossRef]
  26. Ma, S.; Duan, Z.; Huang, Z.; Liu, Y.; Shao, Y. Study on the stability of shield tunnel face in clay and clay-gravel stratum through large-scale physical model tests with transparent soil. Tunn. Undergr. Space Technol. 2022, 119, 104199. [Google Scholar] [CrossRef]
  27. Duan, Z.; Yang, J.; Ma, S.; Huang, Z. Study on instability mechanism of tunnel face in clay-gravel strata under confined water conditions based on DEM-CFD coupling method. Comput. Geotech. 2023, 164, 105769. [Google Scholar] [CrossRef]
  28. Ma, S.; Wei, R.; Shao, Y.; Huan, Z.; Duan, Z. 3D visual model tests on stability of tunnel excavation surface based on transparent soil. Chin. J. Geotech. Eng. 2021, 43, 1798–1806. [Google Scholar]
  29. Kirsch, A. Experimental investigation of the face stability of shallow tunnels in sand. Acta Geotech. 2010, 5, 43–62. [Google Scholar] [CrossRef]
  30. Lü, X.; Zhou, Y.; Huang, M.; Zeng, S. Experimental study of the face stability of shield tunnel in sands under seepage condition. Tunn. Undergr. Space Technol. 2018, 74, 195–205. [Google Scholar] [CrossRef]
  31. Wallace, J.F.; Rutherford, C.J. Geotechnical Properties of LAPONITE RD®. Geotech. Test. J. 2015, 38, 20140211. [Google Scholar] [CrossRef]
  32. Chini, C.M.; Wallace, J.F.; Rutherford, C.J.; Peschel, J.M. Shearing Failure Visualization via Particle Tracking in Soft Clay Using a Transparent Soil. Geotech. Test. J. 2015, 38, 20140210. [Google Scholar] [CrossRef]
  33. Ye, T. Experimental Observation and Theoretical Analysis on the Bubbles’Shape Within Transparent Soft Soil; Zhejiang University: Zhejiang, China, 2018. [Google Scholar]
  34. Liu, Y.; Lei, H.; Ma, C.; Guan, B. Three-dimensional stability analysis of shied tunnel face adjacent to existing tun-nels. Chin. J. Geotech. Eng. 2023, 45, 1374–1383. [Google Scholar]
  35. Lei, H.; Liu, Y.; Hu, Y.; Jia, R.; Zhang, Y. Active Stability of the Shield Tunneling Face Crossing an Adjacent Existing Tunnel: Transparent Clay Model Test and DEM Simulation. Can. Geotech. J. 2023, 60, 864–884. [Google Scholar] [CrossRef]
Figure 1. Model test system: (a) Construction graph; (b) System physical diagram.
Applsci 14 10521 g001
Figure 2. Image acquisition synchronous motion trajectory.
Applsci 14 10521 g002
Figure 3. Existing tunnel model.
Applsci 14 10521 g003
Figure 4. Diagram of the test scheme.
Applsci 14 10521 g004
Figure 5. Configuration of transparent soil.
Applsci 14 10521 g005
Figure 6. Support pressure ratio (for different horizontal spacings).
Applsci 14 10521 g006
Figure 7. Soil instability deformation area (for different horizontal spacings).
Applsci 14 10521 g007
Figure 8. Three-dimensional reconstruction of the instability zone (S = 3 mm).
Applsci 14 10521 g008
Figure 9. 3D numerical model.
Applsci 14 10521 g009
Figure 10. Support pressure ratio (test and simulation): (a) Different horizontal spacing; (b) Different vertical spacing and tunnel diameter ratio.
Applsci 14 10521 g010
Figure 11. Comparison of soil displacement fields (model test and numerical simulation): (a) No existing tunnel; (b) L/D = 1; (c) L/D = 0; (d) L/D = −1.
Applsci 14 10521 g011
Figure 12. Vertical stress change of soil mass (different horizontal spacings).
Applsci 14 10521 g012
Figure 13. Average horizontal stress change of soil mass (different horizontal spacings).
Applsci 14 10521 g013
Figure 14. Vertical stress of the soil between the two tunnels under different working conditions: (a) L/D = 1; (b) L/D = 0; (c) L/D = −1.
Applsci 14 10521 g014
Figure 15. Average stress of the soil between the two tunnels under different working conditions: (a) L/D = 1; (b) L/D = 0; (c) L/D = −1.
Applsci 14 10521 g015
Table 1. Model test schemes.
SchemesStratumNew Tunnel Depth (C/D)Tunnel-to-Diameter Ratio (d/D)Relative Vertical Distance (h/D)Relative Horizontal Distance (L/D)
1Clay21No existing tunnel
2Clay2111
3Clay2110
4Clay211−1
Table 2. Properties of Laponite RD [31].
ParameterValue
Reported shipped water content, %<10%
Refractive index1.5
Specific gravity2.53
Liquid limit, LL1150
Plasticity index, PI910
Surface area, nm21100
Single crystal dimension, nm25 × 0.92
Table 3. Physico-mechanical parameters of the transparent clay [33].
ParameterValue
Permeability coefficient, cm/s0.405~1.14 × 10−7
Coefficient of consolidation, cm2/s3.555~13.520 × 10−6
Porosity ratio12.244~22.417
Cohesion, kPa0.555
Angle of internal friction, °11.034°
Table 4. Structural material parameters [31,33].
Materialγ (kN/m3)E/MPavc/kPaφ
Clay19.80.0630.30.55511.034
Excavation panel78.5206,0000.3
Tunnel lining2534,5000.2
Note: γ = Total bulk weight; E = Elastic modulus; v = Poisson’s ratio; c = Cohesion; φ = Angle of in ternal friction.
Table 5. Finite element simulation schemes.
ConditionsStratumDepth of Tunnel C/DExisting Tunnel Diameter d/DVertical Spacing of Two Tunnels h/DHorizontal Spacing of Double Tunnels L/D
1Clay21No existing tunnel
2Clay2111
3Clay2110
4Clay211−1
5Clay210.751
6Clay210.750
7Clay210.75−1
8Clay20.511
9Clay20.510
10Clay20.51−1
Table 6. Radial deformation of the existing tunnel cross-section.
Working ConditionApplsci 14 10521 i001Applsci 14 10521 i002Applsci 14 10521 i003
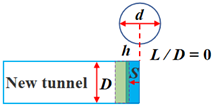
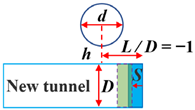
Schemes 2~4
h/D = 1
d/D = 1
S = 3 mm
Applsci 14 10521 i004Applsci 14 10521 i005Applsci 14 10521 i006
Schemes 5~7
h/D = 0.75
d/D = 1
S = 3 mm
Applsci 14 10521 i007Applsci 14 10521 i008Applsci 14 10521 i009
Schemes 8~10
h/D = 1
d/D = 0.5
S = 3 mm
Applsci 14 10521 i010Applsci 14 10521 i011Applsci 14 10521 i012
Disclaimer/Publisher’s Note: The statements, opinions and data contained in all publications are solely those of the individual author(s) and contributor(s) and not of MDPI and/or the editor(s). MDPI and/or the editor(s) disclaim responsibility for any injury to people or property resulting from any ideas, methods, instructions or products referred to in the content.

