Article

Effects of CO2 Aeration and Light Supply on the Growth and Lipid Production of a Locally Isolated Microalga, Chlorella variabilis RSM09

by
Aiya Chantarasiri
and
Sunisa Ungwiwatkul
*
Faculty of Science, Energy and Environment, King Mongkut’s University of Technology North Bangkok, Rayong Campus, Bankhai, Rayong 21120, Thailand
*
Author to whom correspondence should be addressed.
Appl. Sci. 2024, 14(22), 10512; https://doi.org/10.3390/app142210512
Submission received: 29 September 2024 / Revised: 4 November 2024 / Accepted: 12 November 2024 / Published: 14 November 2024

Abstract

:
The Chlorophyceae algae, specifically Chlorella spp., have been extensively researched for biodiesel production. This study focused on the alga Chlorella variabilis RSM09, which was isolated from a brackish-water environment at Raksamae Bridge in Klaeng District, Rayong Province, Thailand. The effects of the carbon dioxide gas (CO2) concentration (0.03%, 10%, 20%, 30%, 40%, and 50% v/v), light intensity (3000, 5000, and 7000 Lux), and photoperiod (12:12, 18:6, and 24:0 h L/D) on algal growth and lipid production were investigated. The results indicated that C. variabilis RSM09 achieved optimal growth under 20% v/v CO2 aeration, with an optical density of approximately 2.91 ± 0.27, a biomass concentration of 1.32 ± 0.14 g/L, and a lipid content of 21.96 ± 0.29% (wt.). Among the three different light intensities, higher optical density (4.20 ± 0.14), biomass (1.79 ± 0.25 g/L), and lipid content (20.75 ± 2.0% wt.) were at the 5000 Lux of light intensity. Additionally, the photoperiod of 24:0 h (L/D) produced the highest biomass at 1.86 ± 0.21 g/L, followed by the 18:6 h light/dark photoperiod with a biomass of 1.65 ± 0.17 g/L, and the 12:12 h light/dark photoperiod with 1.35 ± 0.43 g/L. In contrast, the 18:6 h L/D photoperiod yielded a higher lipid concentration of 25.22 ± 2.06% (wt.) compared to the others. All cultured microalgae showed significant effects on fatty acid composition. Palmitic (16:0), linoleic (C18:2), and linolenic (C18:3) acids were predominant in C. variabilis RSM09 under all photoperiods. This study exhibited that the microalga C. variabilis RSM09 has great potential as a feedstock for biodiesel production.

1. Introduction

The two major problems facing humanity today are the global energy crisis and global warming, caused mainly by growing population expansion, rapid industrialization, and a greater consumption of fossil fuels. Therefore, current research has been focused on developing clean energy and sustainable fuels that may replace and reduce the usage of fossil fuels [1,2,3]. Several alternative energy sources have been studied and implemented, for example, solar energy, wind, hydroelectric, geothermal, and biofuel sources. Among all these renewable energies, biofuel is arguably a potential alternative source that can replace fossil-based fuel [4]. Biofuels are fuel produced from organic materials (plant, animal, and algae), which can be solid, liquid, or gas. Currently, microalgae are being promoted as the suitable feedstock for third-generation biofuels [5].
Microalgae are oleaginous microorganisms and microalgal lipids can be used as feedstock in biodiesel production [6]. Microalgae-based biodiesel has many benefits, such as having a high lipid content and fast growth rate and being easily modified by biotechnological techniques [7]. Microalgae cells are made up of many components. The main components are lipids; 2–70% of the lipid content by total dry weight can be extracted from the algal biomass, but it does vary according to the growth conditions and species type [8]. The potential of algae-based biodiesel production depends on the selection of suitable strains regarding profitable yields and lipid quality [9]. Although the maximum biomass productivity of algae will be found under optimal cultivation conditions, it does not serve as a guarantee of the maximum lipid content. Some species have high lipid content, but their growth rate is prolonged. It has been reported that the lipid content of Botryococcus braunii could reach 75% of the dry weight, but it is associated with low biomass productivity. Most common microalgae (Chlorella, Dunaliella, Isochrysis, Nannochloropsis, Scenedesmus, Spirulina) possess lipid contents in a range of 15–50%, but they have higher biomass productivity [10]. This indicates that the selection of suitable strains of microalgae is essential. Some factors, such as algae’s ability under specific environmental conditions and the ability to uptake nutrients by algae, should be considered before selecting the most suitable strains or sufficient species for use as biodiesel feedstock [8].
Besides biodiesel production, it has been reported that microalgae have a high potential for CO2 capture. Microalgal biomass contains approximately 0.5 g carbon of g dry weight. All of this carbon is typically derived from atmospheric CO2. Theoretically, microalgae could fix about 183 tons of CO2 in producing 100 tons of biomass [11]. Thus, biological CO2 sequestration using photosynthetic microalgae for CO2 mitigation has received widespread attention. Bhakta et al. [12] revealed that the growth of mixed microalgae, including Chlorella sp., Scenedesmus sp., Sphaerocystis sp., and Spirulina sp., cultured under 20–50% (v/v) CO2 concentration was higher than that of ambient air (0.03% CO2) and showed high CO2 sequestration, 150–291 mg/g. The microalgal consortium, which contained dominantly Scenedesmus spp., could grow well at 30% (v/v) CO2 aeration with the maximum values of lipid content (27.60% of dry weight) and the CO2 fixation rate (0.0271 gCO2 /L/day) [13]. The CO2 fixation rate of microalgae was associated with the photosynthesis efficiency and cell density of microalgae. Also, CO2 fixation efficiency of microalgae depends on the microalgal species, nutrient supply, light intensity, temperature, pH, photo-bioreactor type, CO2 concentration, and CO2 flow rate [14,15,16].
The green algae Chlorella spp. have received much attention in recent years because of their excellent potential as a feedstock for the manufacture of high-value products and biofuels [17]. In addition, in the large-scale production of Chlorella, the growth rate and productivities of biomass and lipids are the main parameters required to evaluate the economic feasibility [18]. Biomass and lipid productivities in microalgae are influenced by several factors, such as the pH, culture medium, CO2 aeration, and light supply [19]. Light serves as the essential energy source that facilitates photosynthesis in microalgae. Excessive light intensity may lead to decreased efficiency due to photo-inhibition, whereas insufficient light intensity will become a limiting factor for the growth rate and lipid production [20]. This study aims to isolate and characterize the growth of C. variabilis RSM09. Additionally, to enhance our understanding of species-specific product optimization, the effects of CO2 concentration and light supply on the growth, biomass, and lipid production of C. variabilis RSM09 were also determined.

2. Materials and Methods

2.1. Collection and Isolation of Microalgae

The microalgae were collected from a brackish-water environment at Raksamae Bridge, Klaeng District, Rayong Province, Thailand (12°43′06.3″ N, 101°39′22.8″ E) (Figure 1) using a 20 µm-mesh size of a plankton net. The microalgae samples (20 mL) were enriched with 80 mL of Bold’s Basal medium (BBM) [21] and incubated at ambient-temperature (around 28–32 °C) aeration with 10% (v/v) CO2 under continuous illumination with white LED lamps (3000 Lux) for 7 days. Next, microalga was isolated using the streak method. Pure colonies of isolated microalgae were obtained after repeated plating on the BBM agar medium and systematically examined under a light microscope. The isolated microalga was then cultivated with 5 mL of BBM in a 10 mL laboratory glass bottle and incubated at the described conditions. Stock cultures were then diluted 1 in 50 (v/v) as an inoculum for larger cultures in each experiment.

2.2. Genetic Identification of Isolated Microalgae

The isolated microalga was preliminary morphologically identified using an Eclipse E200 microscope (Nikon, Tokyo, Japan). The genomic DNA of the isolated microalga was extracted and purified using the DNA Trap I kit (DNA TEC, Kasetsart University, Bangkok, Thailand) following the protocol provided by DNA TEC. To identify the microalgal species, two molecular markers, the internal transcribed spacer (ITS) region and the chloroplast small subunit rRNA, were used. The primer pair and PCR conditions for amplifying the ITS region were described by Odeh et al. [22], while those for the chloroplast small subunit rRNA were provided by Burja et al. [23]. The amplified genes were purified and sequenced by Macrogen Inc. (Seoul, Republic of Korea). The nucleotide sequences were aligned using the BLASTn suite and a megablast algorithm from the National Center for Biotechnology Information (NCBI, Bethesda, MD, USA). The phylogenetic tree of isolated microalga was analyzed and generated by SeaView software version 4.7 (Laboratoire de Biométrie et Biologie Evolutive, Université de Lyon, Lyon, France) and Figtree software version 1.4.4 (Institute of Evolutionary Biology, University of Edinburgh, Edinburgh, UK) using the neighbor-joining (NJ) method for 10,000 bootstrap replications. The resulting nucleotide sequences were deposited in the GenBank database of NCBI under the accession numbers ON167513 (for the resulting ITS region) and ON161758 (for the resulting chloroplast small subunit rRNA).

2.3. Effect of CO2 Concentration on Growth of Microalgae

The isolated microalga was genetically identified as Chlorella variabilis RSM09. It was cultivated in a 500 mL modified laboratory glass bottle with a 300 mL working volume of Bold’s Basal medium, and the initial cell density was used at 0.05 (optical density, OD, at 680 nm). The cultures were incubated with different levels of CO2 concentration (0.03–50% v/v CO2, balanced with N2) at a flow rate of 0.2 volume-to-volume per minute (vvm), under continuous illumination with white LED lamps (3000 Lux) for 12 days.

2.4. Effect of Light Intensity and Photoperiod on Growth of Microalgae

To explore the effect of various light intensities, C. variabilis RSM09 was cultured in a 500 mL laboratory glass bottle, containing 300 mL of Bold’s Basal medium, and the initial cell density was used at 0.1 (optical density, OD, at 680 nm). The culture was incubated at ambient-temperature (around 28–32 °C) aeration with 20% (v/v) CO2 under continuous illumination with three light intensities including 3000, 5000, and 7000 Lux (69, 115, and 161 µmol/m2/s) for 14 days. Next, C. variabilis RSM09 with an initial cell density of 0.05 was cultivated at the same described conditions except for the light intensity and photoperiod. The culture was grown under 5000 Lux of light intensity in three different photoperiods of 12:12, 16:8, and 24:0 h light/dark cycles.

2.5. Microalgal Growth Determination

Microalgal growth was monitored by measuring optical density (OD) every two days using a GENESYS 20 spectrophotometer at 680 nm (OD680, Menlo Park, CA, USA). The dry weight of microalgae was determined on the initial and final day of each cultivation using a modified method of Yoo et al. [24]. A 10 mL microalgae suspension was collected and filtered through pre-weighted 0.45 µm filter paper using vacuum filtration equipment. After being washed with distilled water, the filter was dried at 60 °C for 48 h. The algal biomass concentration was calculated based on dry weight (g/L), which was determined gravimetrically.

2.6. Microalgal Lipid Extraction

The lipid content of microalgae was extracted using a procedure adapted from Bligh and Dyer [25]. In brief, 15 mL chloroform/methanol (2:1, v/v) was added to 0.5 g of freeze-dried microalgal biomass. The extraction process was performed using an ultrasonic device, Model Vibra-Cell VCX130PB (130 W, 20 kHz) (Sonics & Materials, Inc., Newtown, CT, USA), at a 30% amplitude for 10 min. After that, the solvent layer was separated by centrifugation at 5000 rpm for 10 min, and the extracts were evaporated to dryness in a fume hood. Lipid contents were measured gravimetrically.

2.7. Fatty Acid Composition Analysis

Fatty acid methyl esters (FAMEs) were prepared by transesterification using a modified method of Slover and Lanza [26]. FAMEs were analyzed using gas chromatography (GC Agilent 7890a) with a flame ionization detector (GC-FID) and a 100 m × 0.25 mm × 0.2 µm CP-Sil 88 column (Agilent Technologies, Santa Clara, CA, USA). The conditions for GC were as follows: an injector temperature of 240 °C, a detector temperature of 250 °C, and a 1 µL injection with a 50:1 split ratio, and the column temperature gradient was 70 °C for 1 min, followed by an increase to 175 °C at the rate of 13 °C/min, and then to 215 °C at the rate of 4 °C/min, and finally being held at 240 °C for 12 min. Helium was used as carrier gas at flow rates of 0.38 mL/min.

2.8. Statistical Analysis

All the experiments were performed in triplicate. A one-way analysis of variance (ANOVA) was used to analyze all the data. The analysis was carried out using SPSS version 28.0 for Windows. The value of a significant level of p < 0.05 was regarded as statistically significant.

3. Results and Discussion

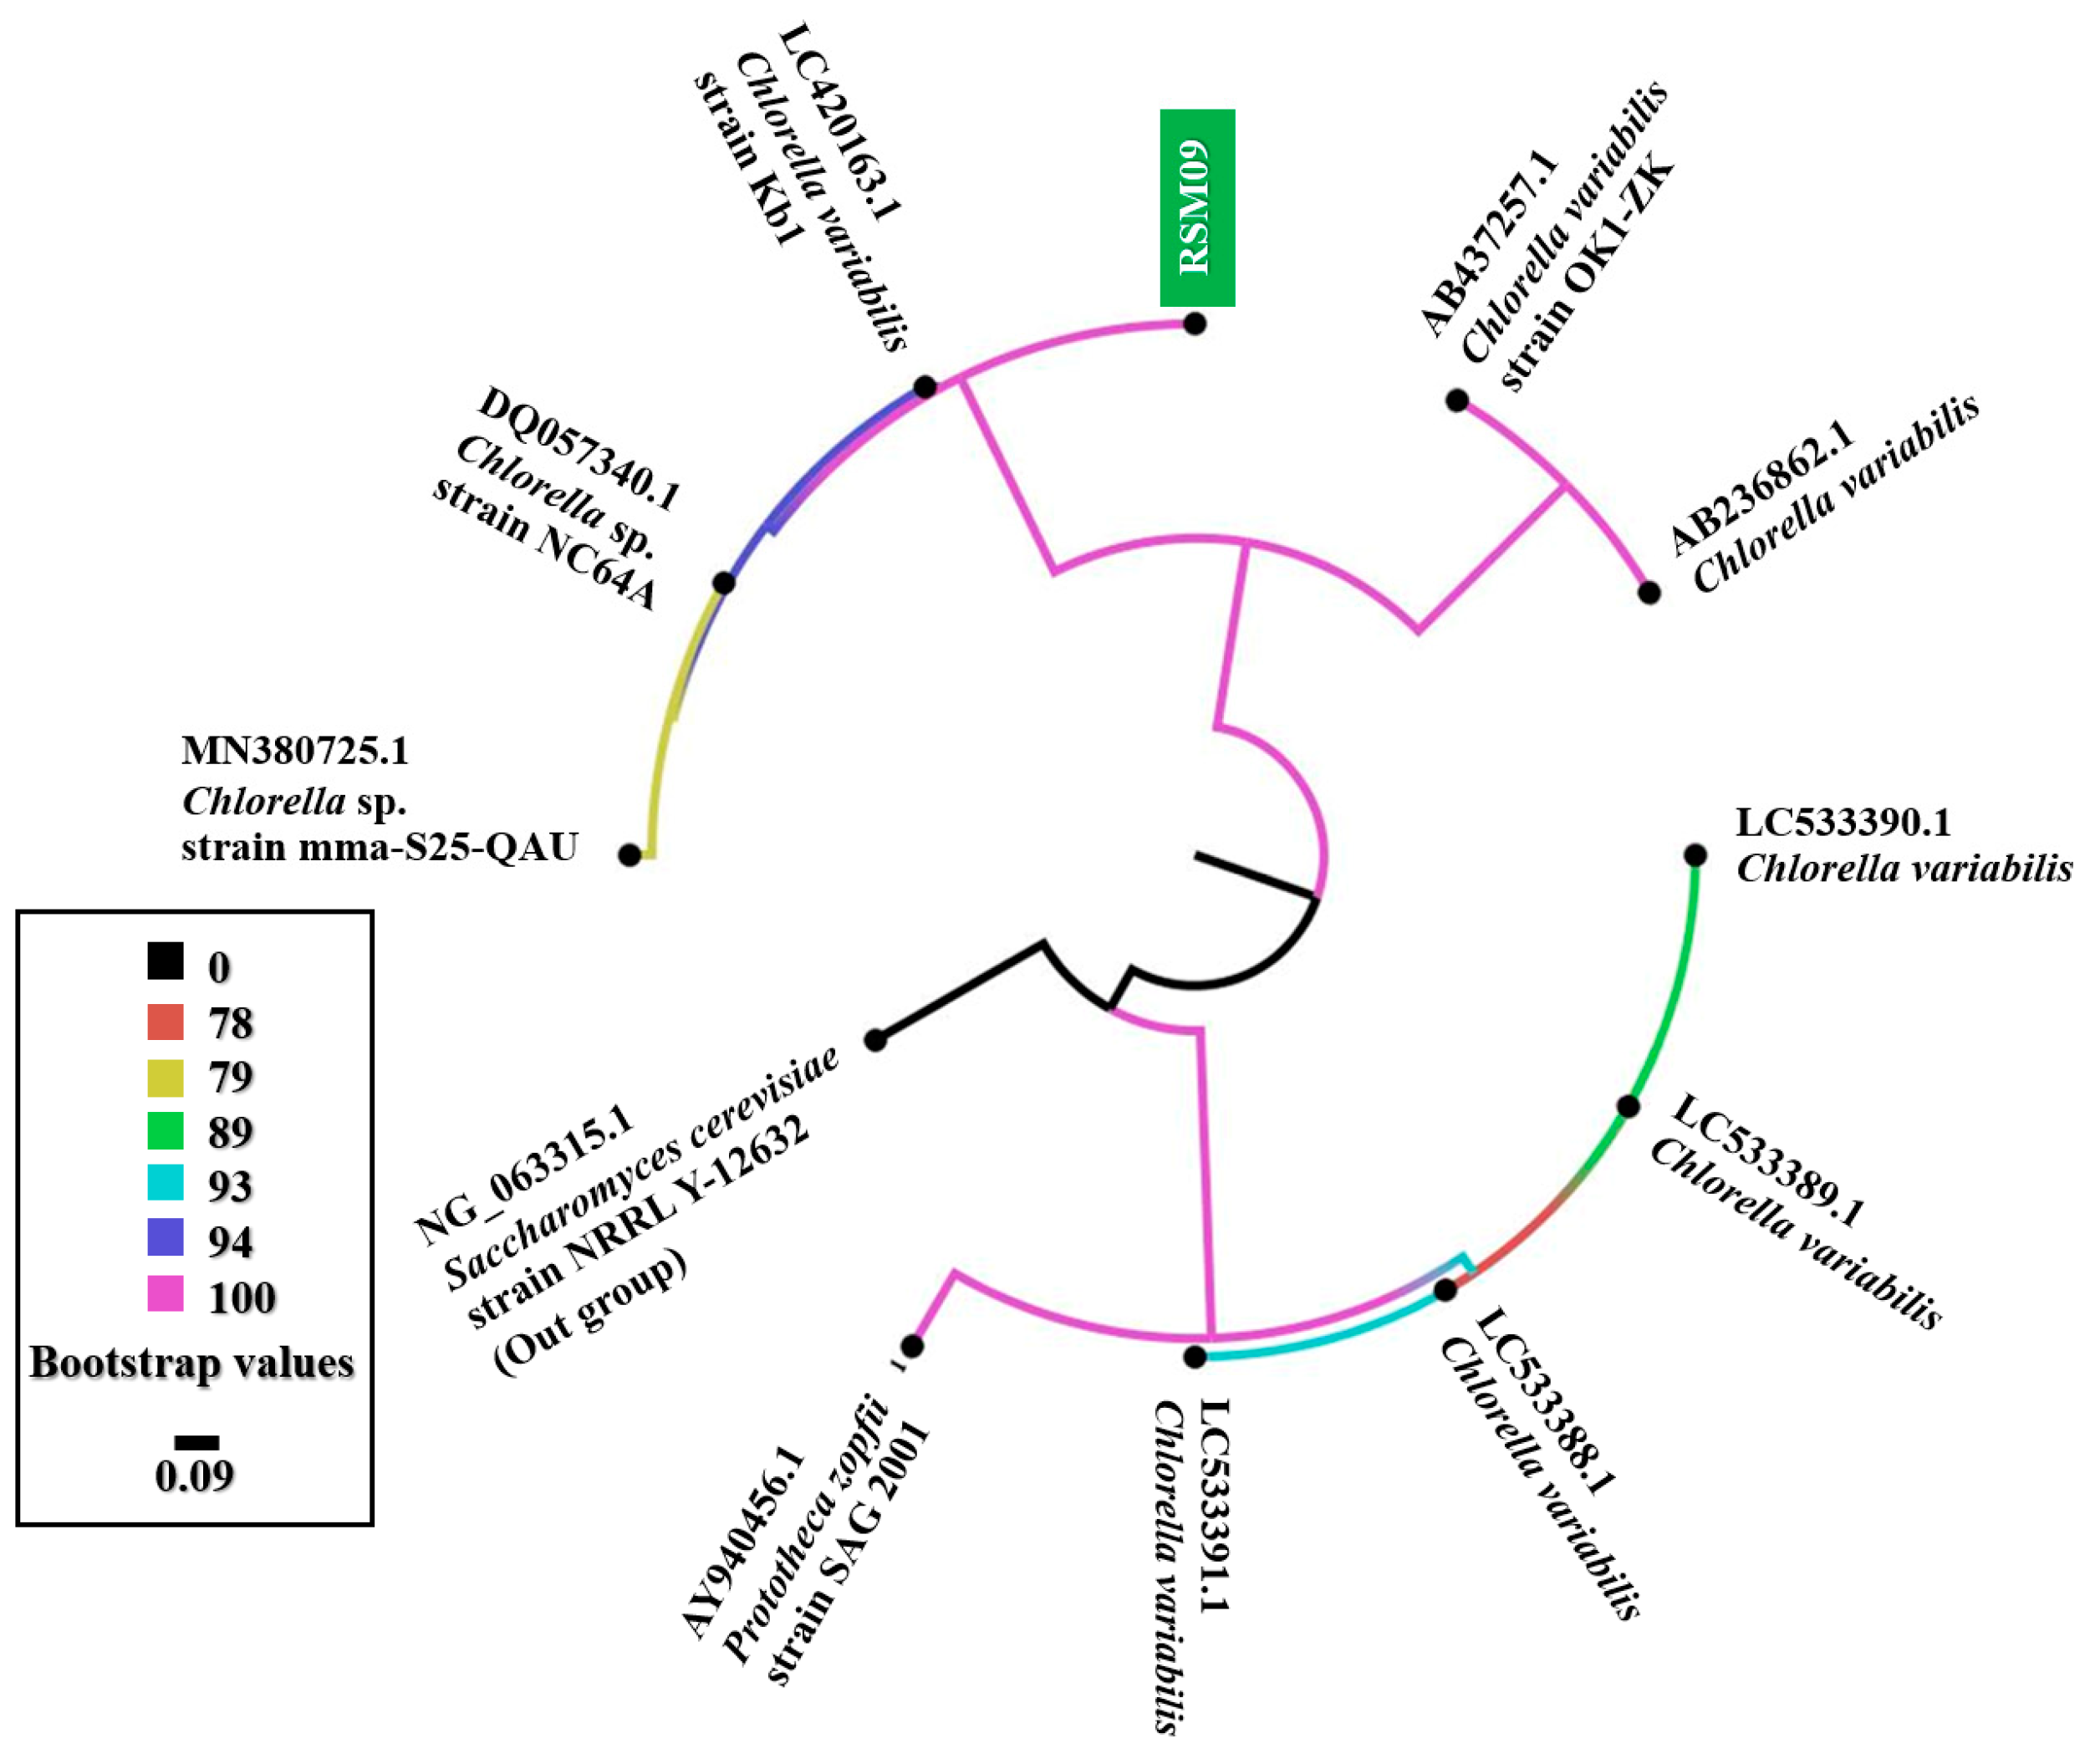
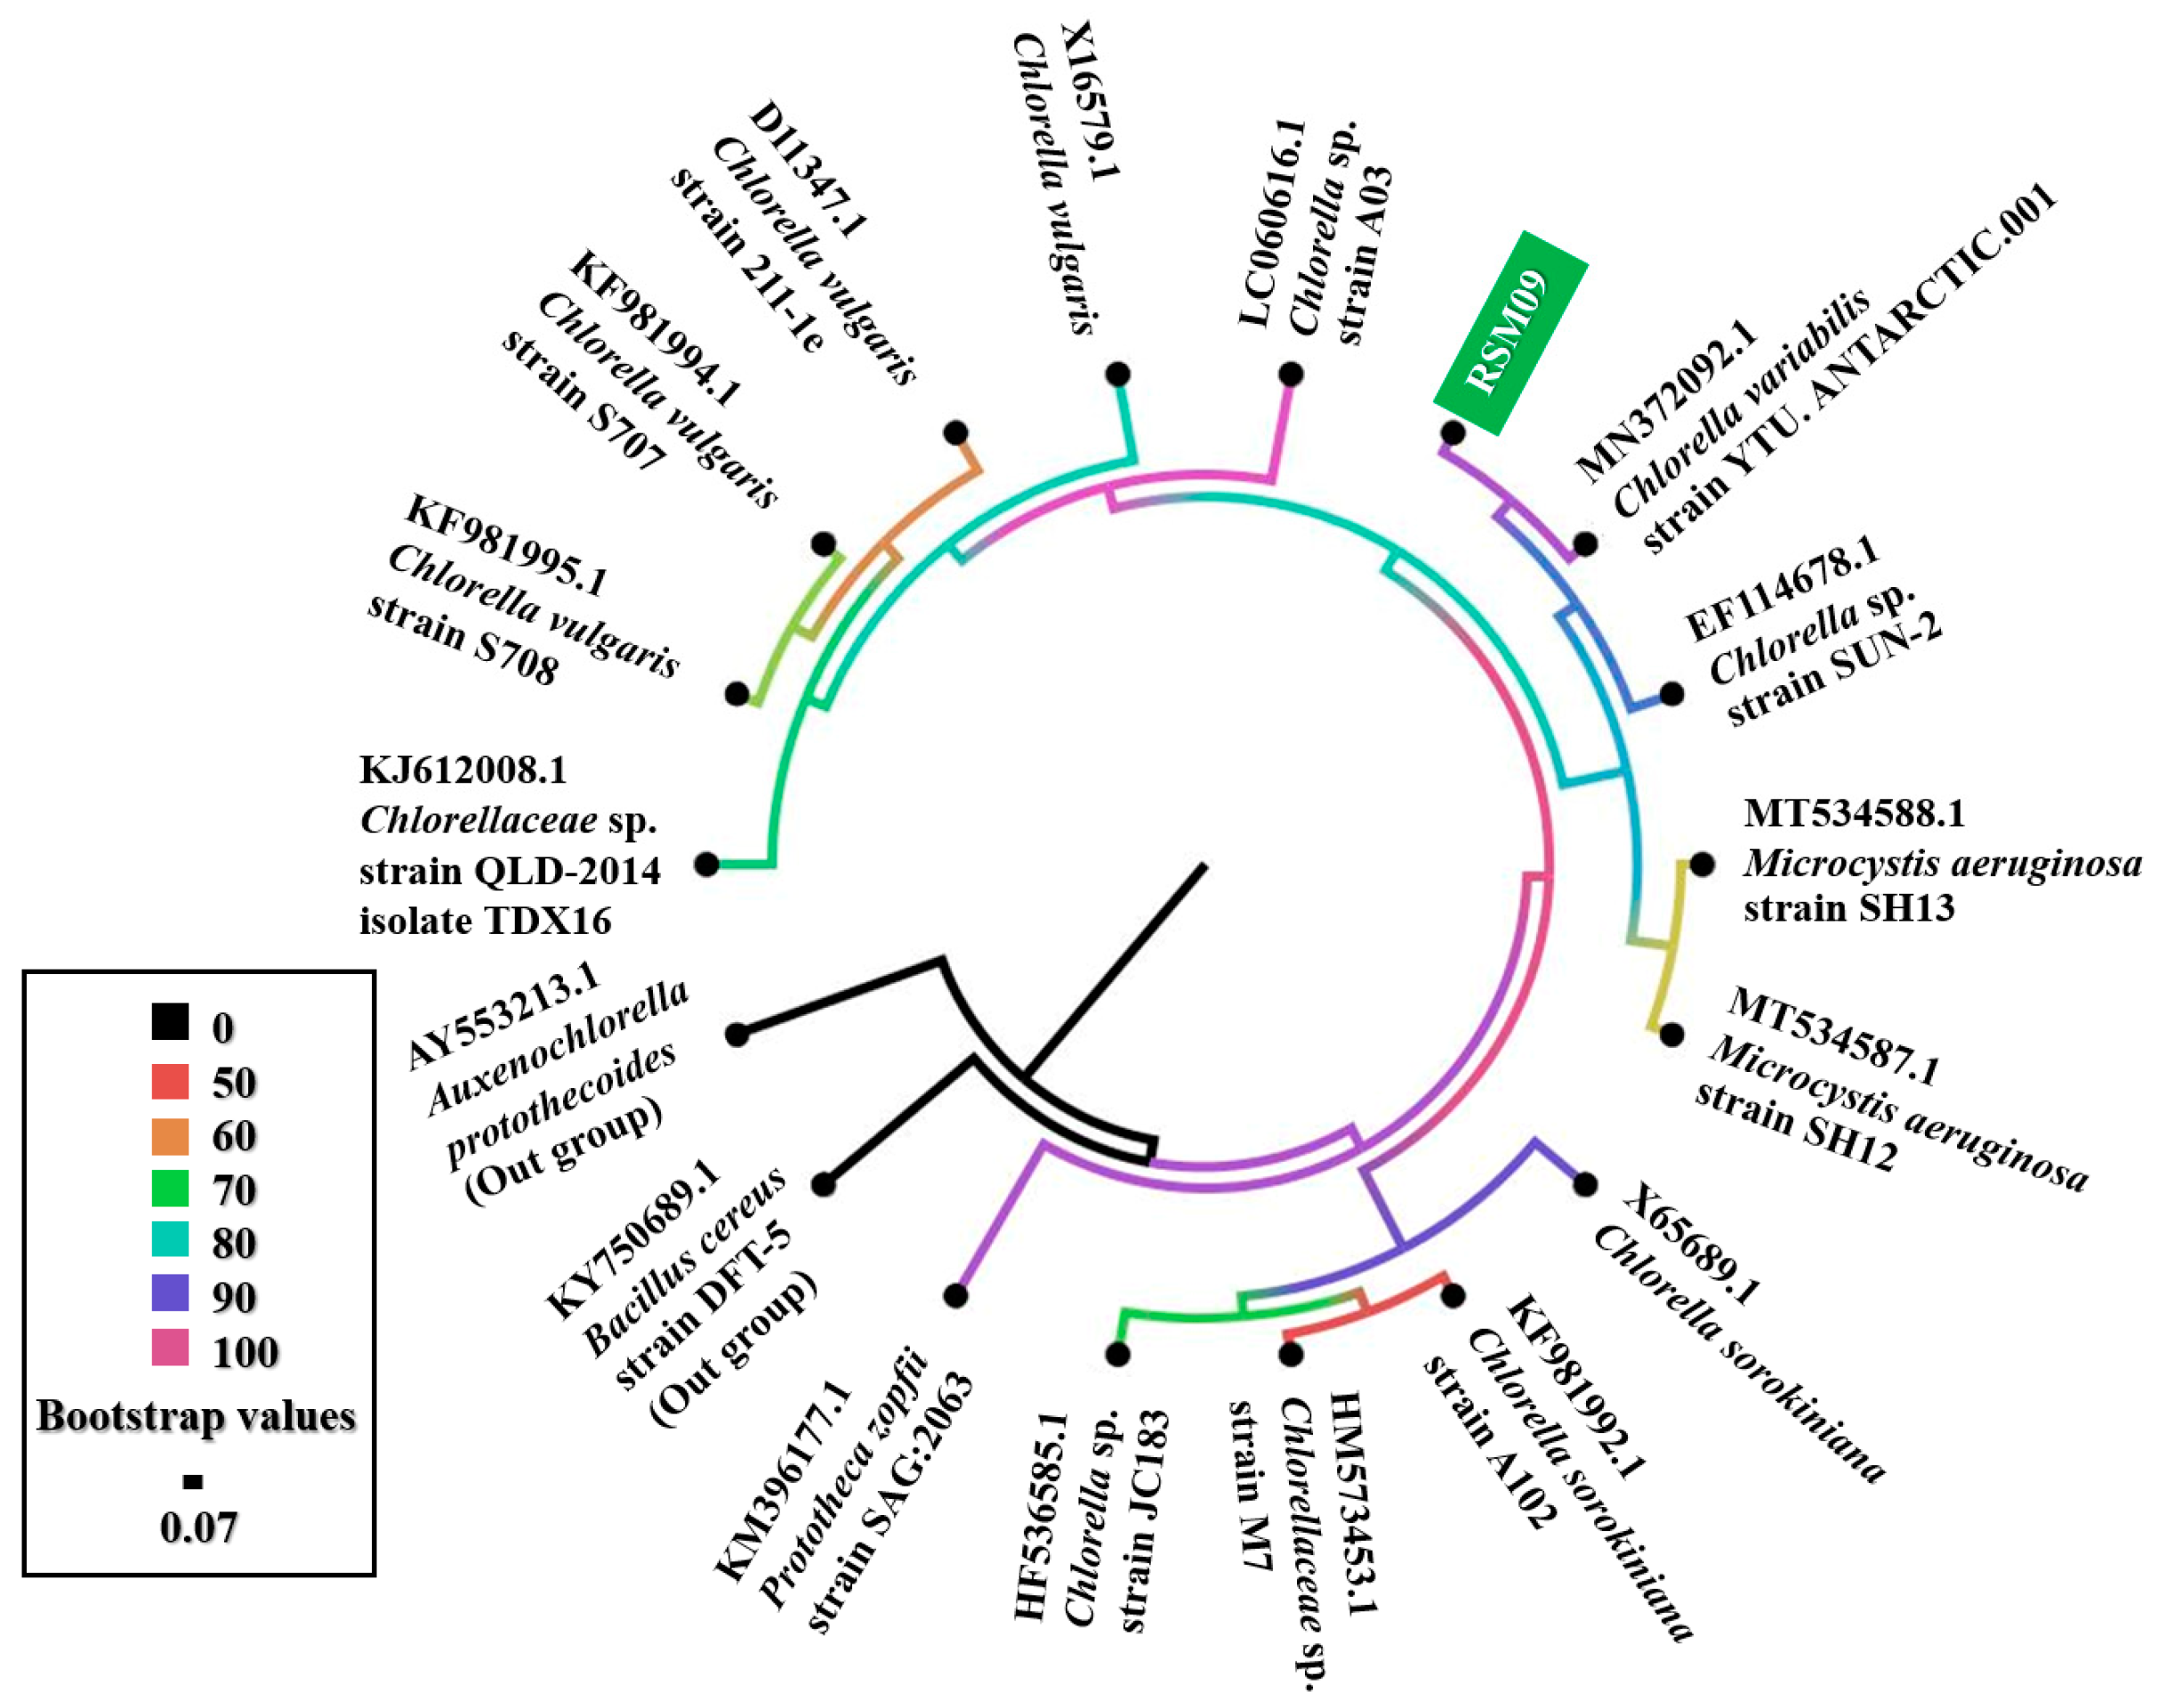
3.1. Genetic Identification of Isolated Microalgae

The isolated microalga was extracted for genomic DNA, and then PCR-amplified for ITS regions and chloroplast small subunit rRNA. The PCR products were purified, nucleotide-sequenced, and nucleotide-aligned for genetic identification. The alignment results from the BLASTn suite based on a megablast algorithm of the NCBI revealed that the ITS region of isolated microalga was closely related to Chlorella variabilis Kb1 (accession number LC420163.1) with a 99% query coverage and 99.10% identity, while the chloroplast small subunit rRNA of isolated microalga was closely related to Chlorella variabilis YTU. ANTARCTIC.001 (accession number MN372092.1) had a 99% query coverage and 98.79% identity. The resulting E values obtained from the nucleotide alignment were zero. The phylogenetic trees generated by Seaview software with the BIONJ algorithm for 10,000 bootstraps are shown in Figure 2 and Figure 3. Finally, the isolated microalga was designated as C. variabilis RSM09. The resulting nucleotide sequences were deposited in the GenBank database of NCBI under the accession numbers ON167513 and ON161758.

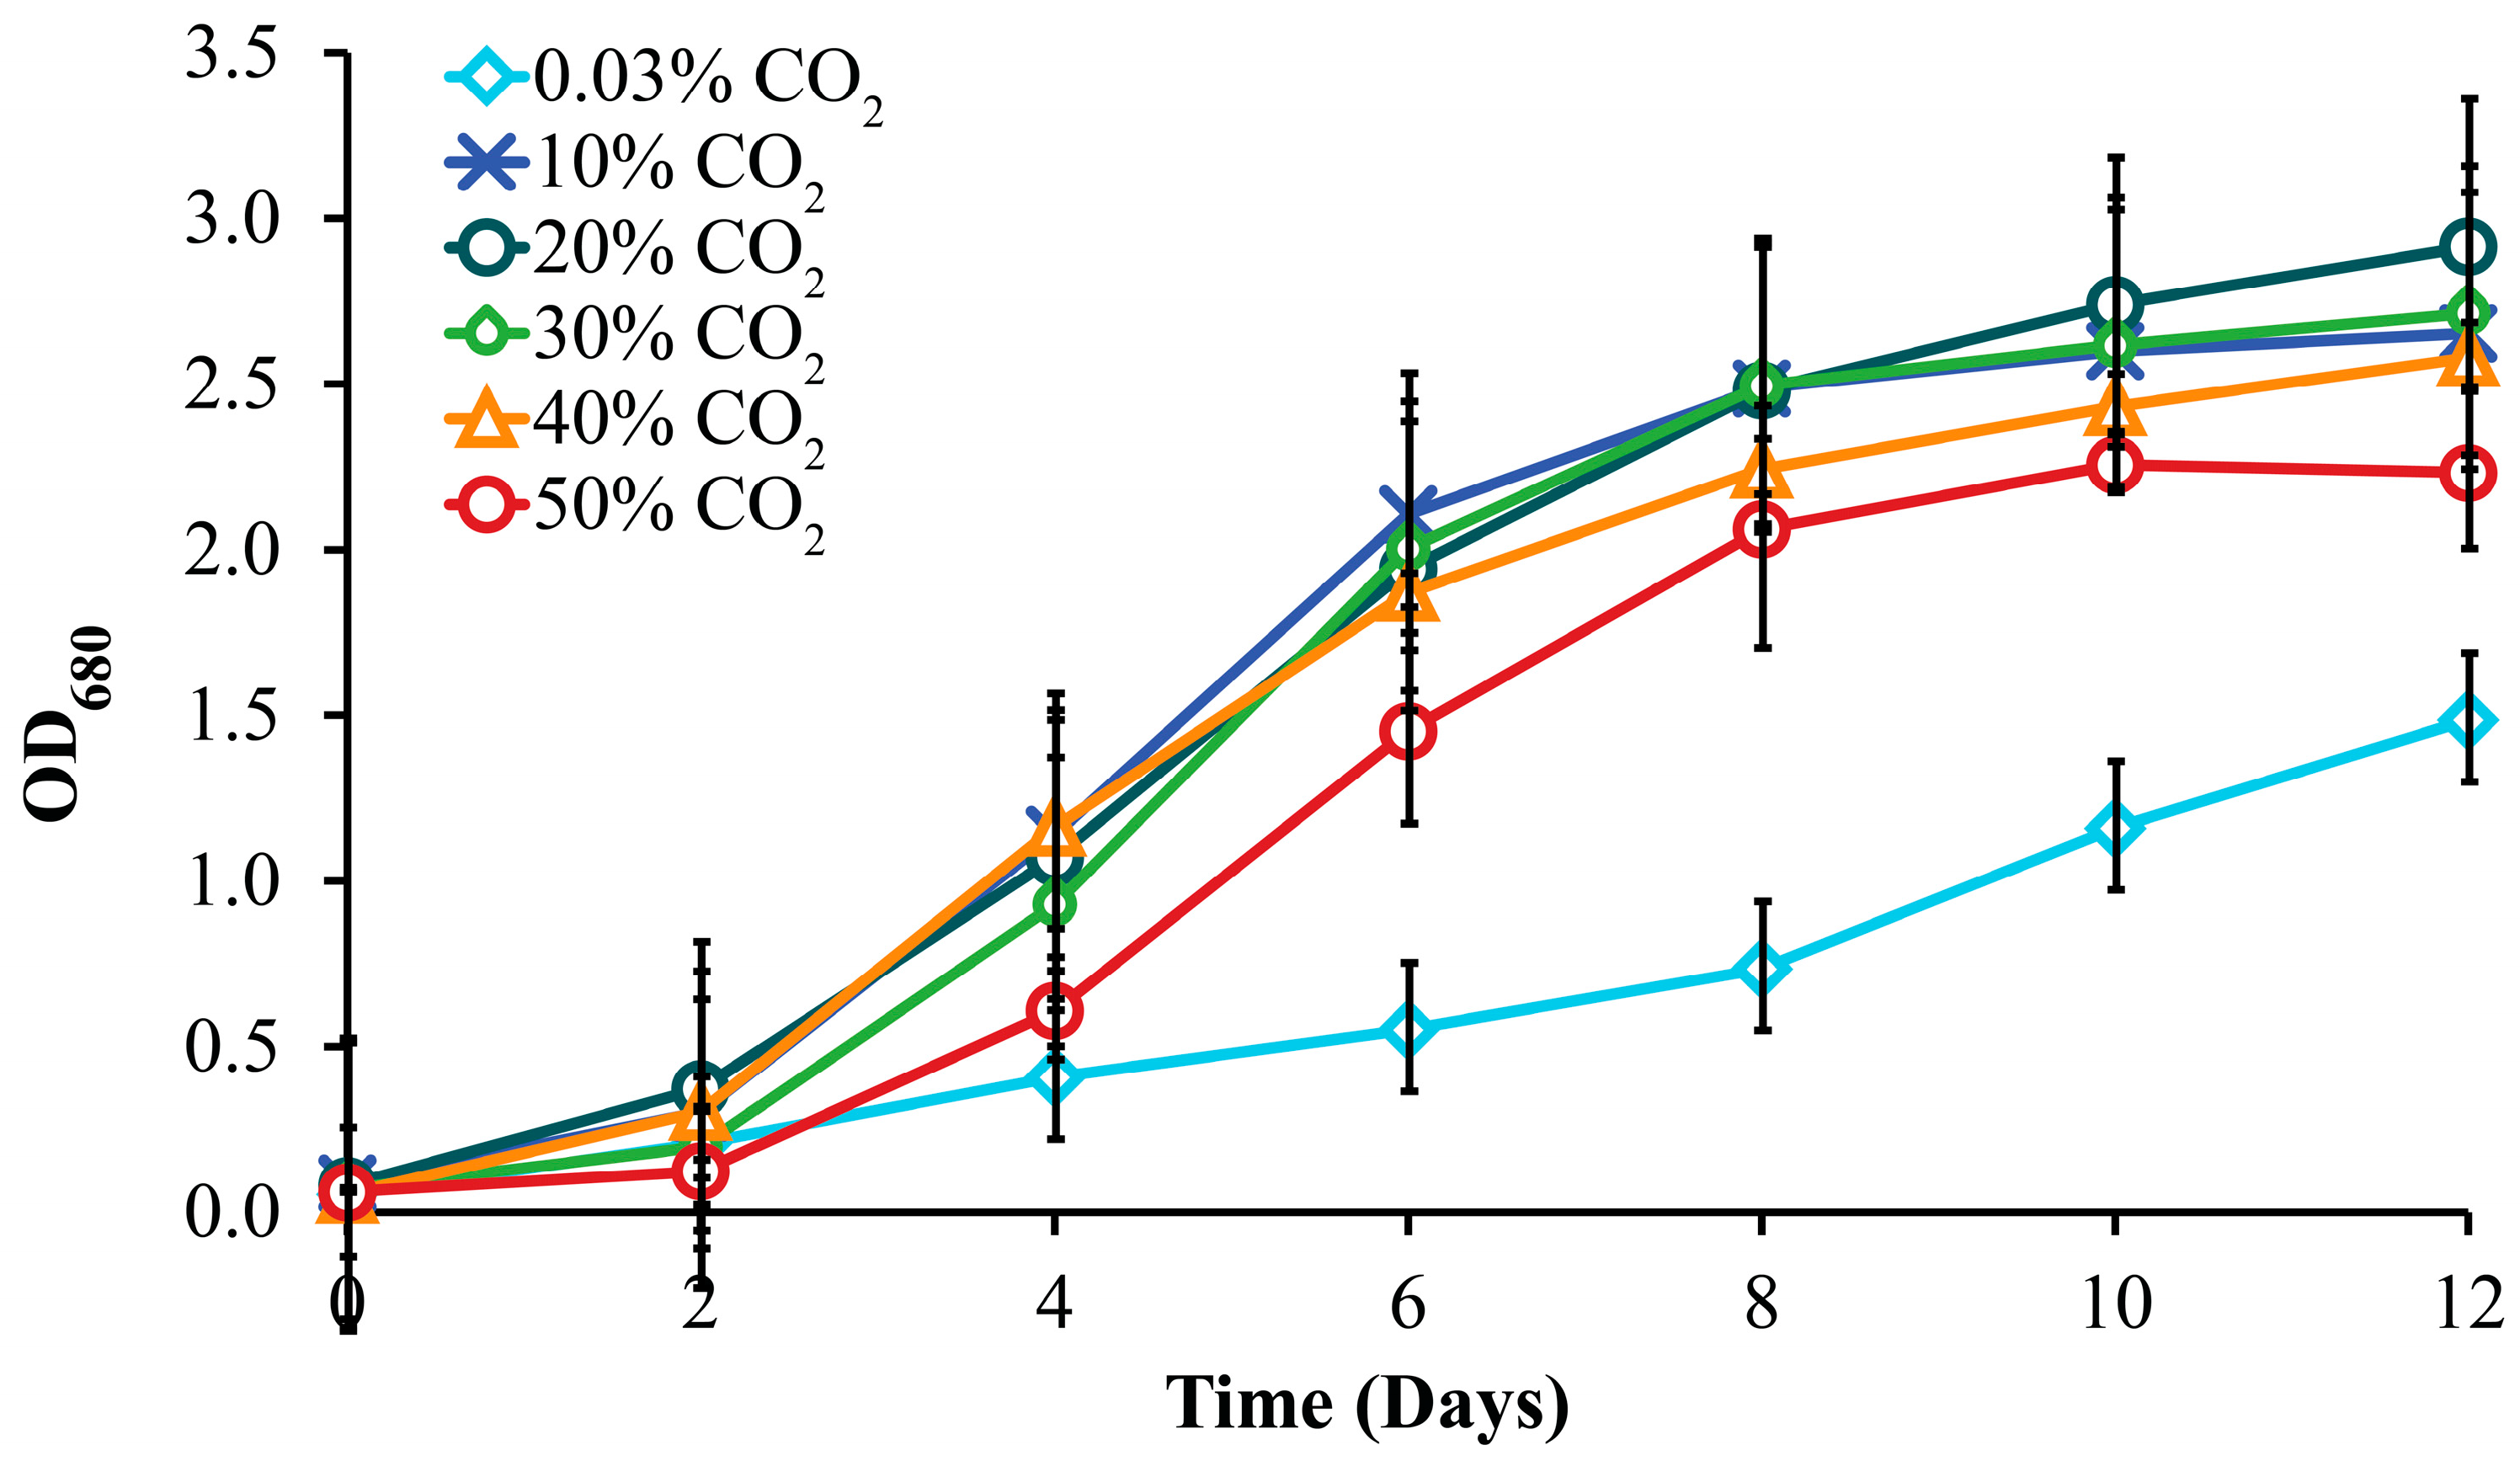
3.2. Effect of CO2 Concentration

CO2 is the primary source of carbon for microalgal growth. Microalgal biomass consists of approximately 50% carbon of the dry cell weight. All of this carbon is usually received from CO2 [11]. When CO2 is dissolved in an aqueous environment, it always remains in equilibrium with H2CO3, CO32−, and HCO3 and its concentration is dependent on the temperature and pH of the solutions [27]. Generally, flue gasses released by most industrial facilities contain CO2 concentrations of around 10–20%, and it has been reported that emissions from cement plants can reach up to 35% CO2 [28]. Additionally, it has been found that Chlorella species can grow in conditions with a 50% CO2 concentration [29,30]. Thus, CO2 concentrations ranging from 0.03% to 50% were chosen for algal cultivation in this study. The effect of different CO2 concentrations on microalgae growth is illustrated in Figure 2. The growth curve showed that the microalgae could grow up to 50% CO2 without any inhibition, and the maximum optical density of 2.91 ± 0.27 was obtained from 20% v/v CO2 aeration. The effects of different CO2 concentrations on microalgal biomass and lipid production are shown in Figure 4. The result found that the dry weight of C. variabilis RSM09 under 10–50% (v/v) CO2 concentration was significantly higher than that of 0.03% CO2 (p < 0.05). The highest microalgal dry weight was 1.32 ± 0.14 g/L with 20% v/v CO2 supplementation, while the lowest was obtained under 0.03% v/v CO2 supplementation (ambient air) with 0.5 ± 0.02 g/L. These results indicate that using CO2 for microalgae cultivation could promote microalgal growth. Similar results were also found with Chlorella vulgaris. The alga grew faster and had a higher growth rate with 15% CO2 than 0.03% CO2 [31]. Tang et al. [29] reported that the microalgae Scenedesmus obliquus SJTU-3 and C. pyrenoidosa SJTU-2 were able to grow at 50% (v/v) CO2 supplementation and they grew well under the range of 5% to 20% (v/v) CO2 supplementation. They also observed that high levels of CO2, ranging from 30 to 50% (v/v), were beneficial for the lipid accumulation of microalgae. According to the results of lipid content (Figure 5), the highest lipid content is 21.96 ± 0.29% wt. at 20% CO2 and the lowest lipid content is 12.48 ± 0.12% wt. at 50% CO2.

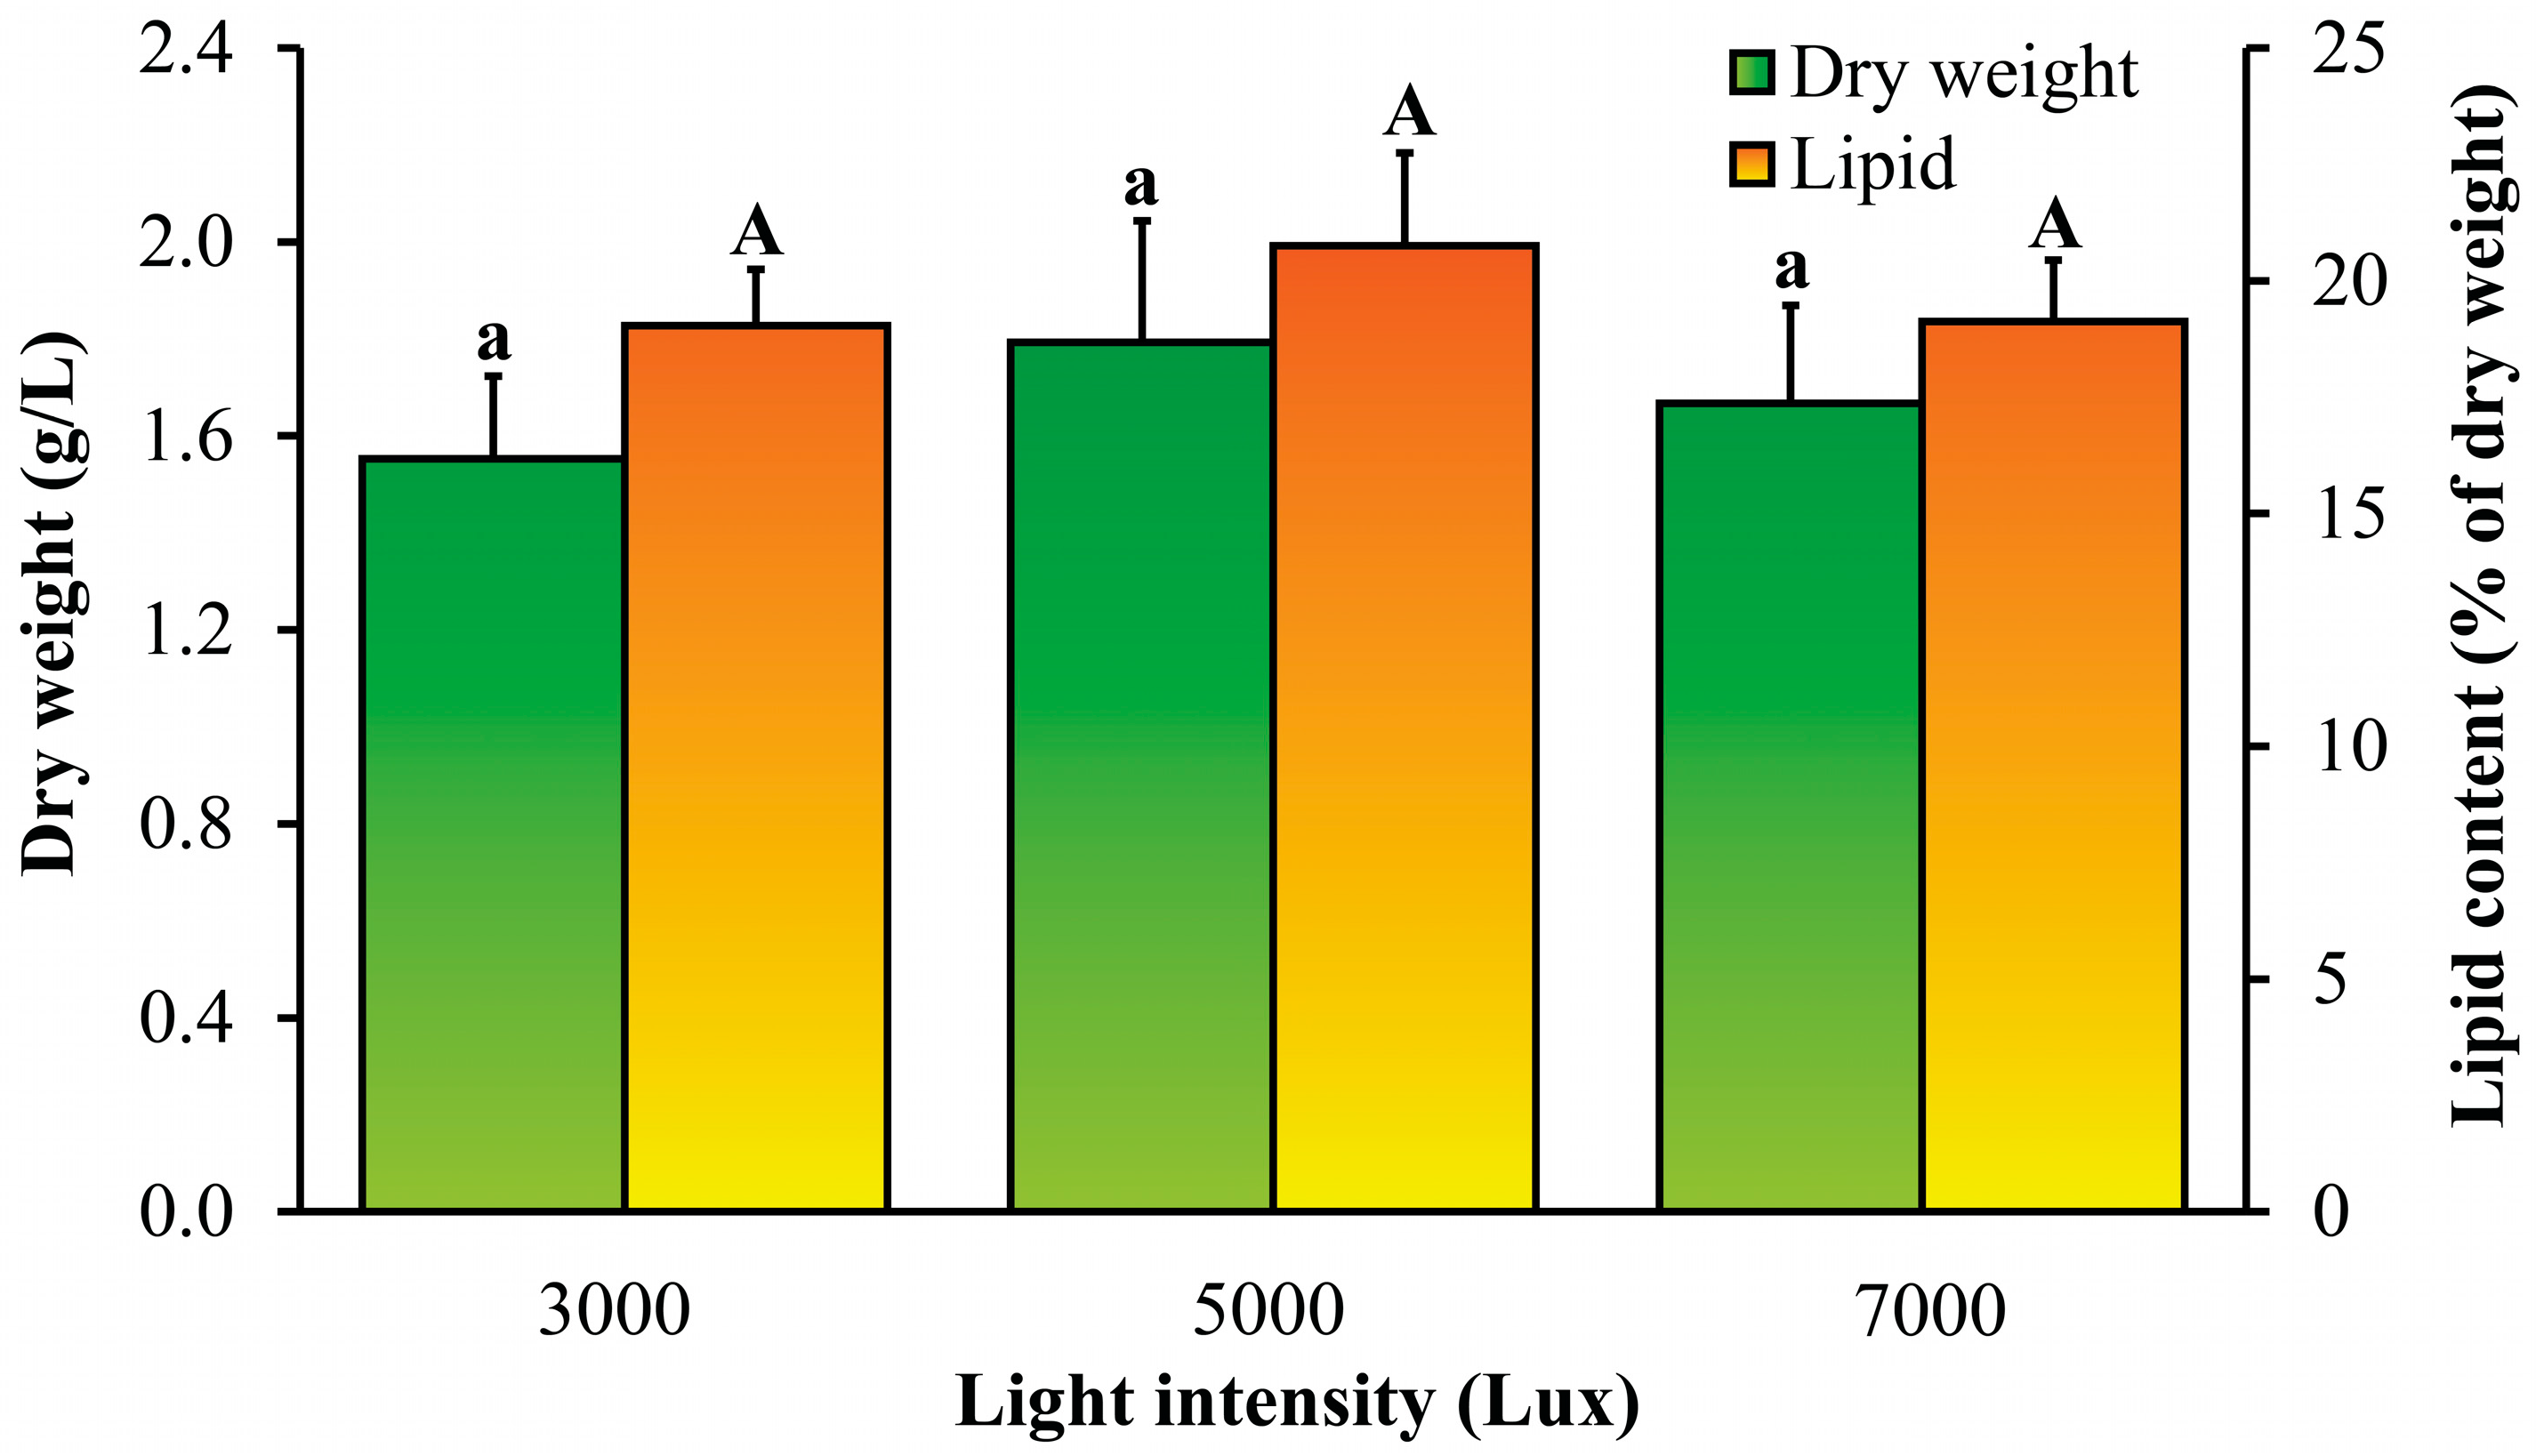
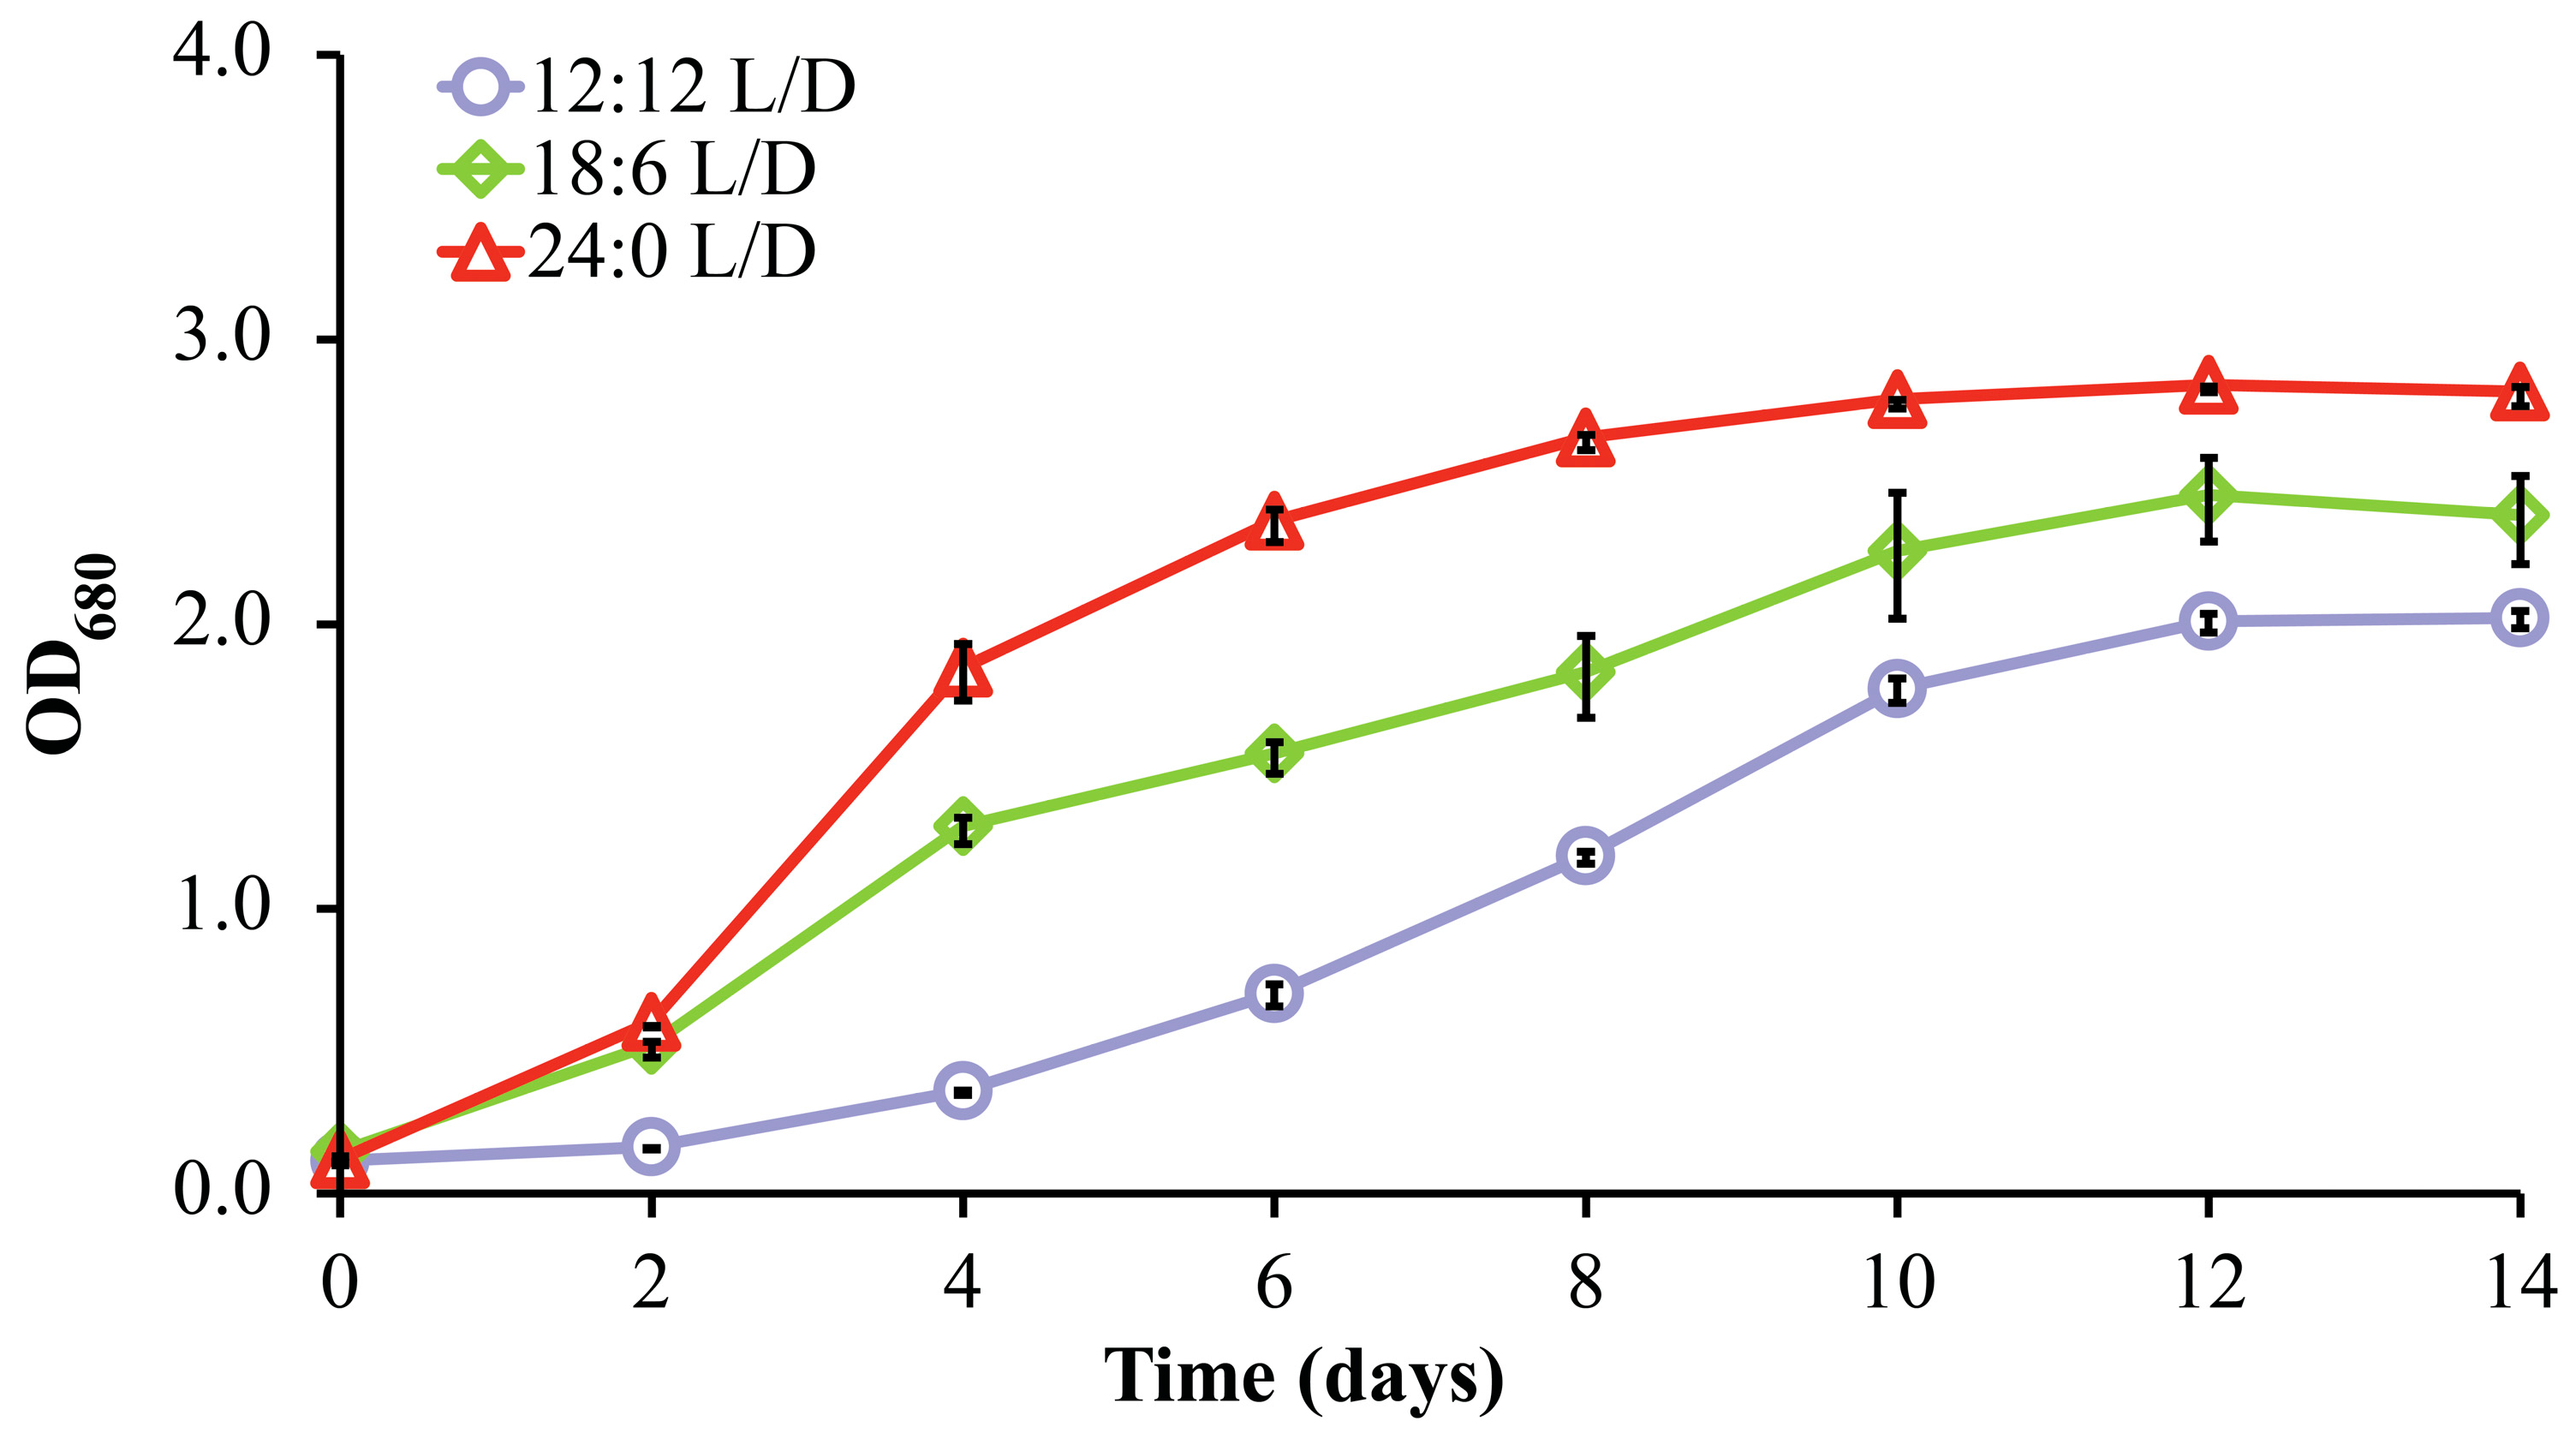
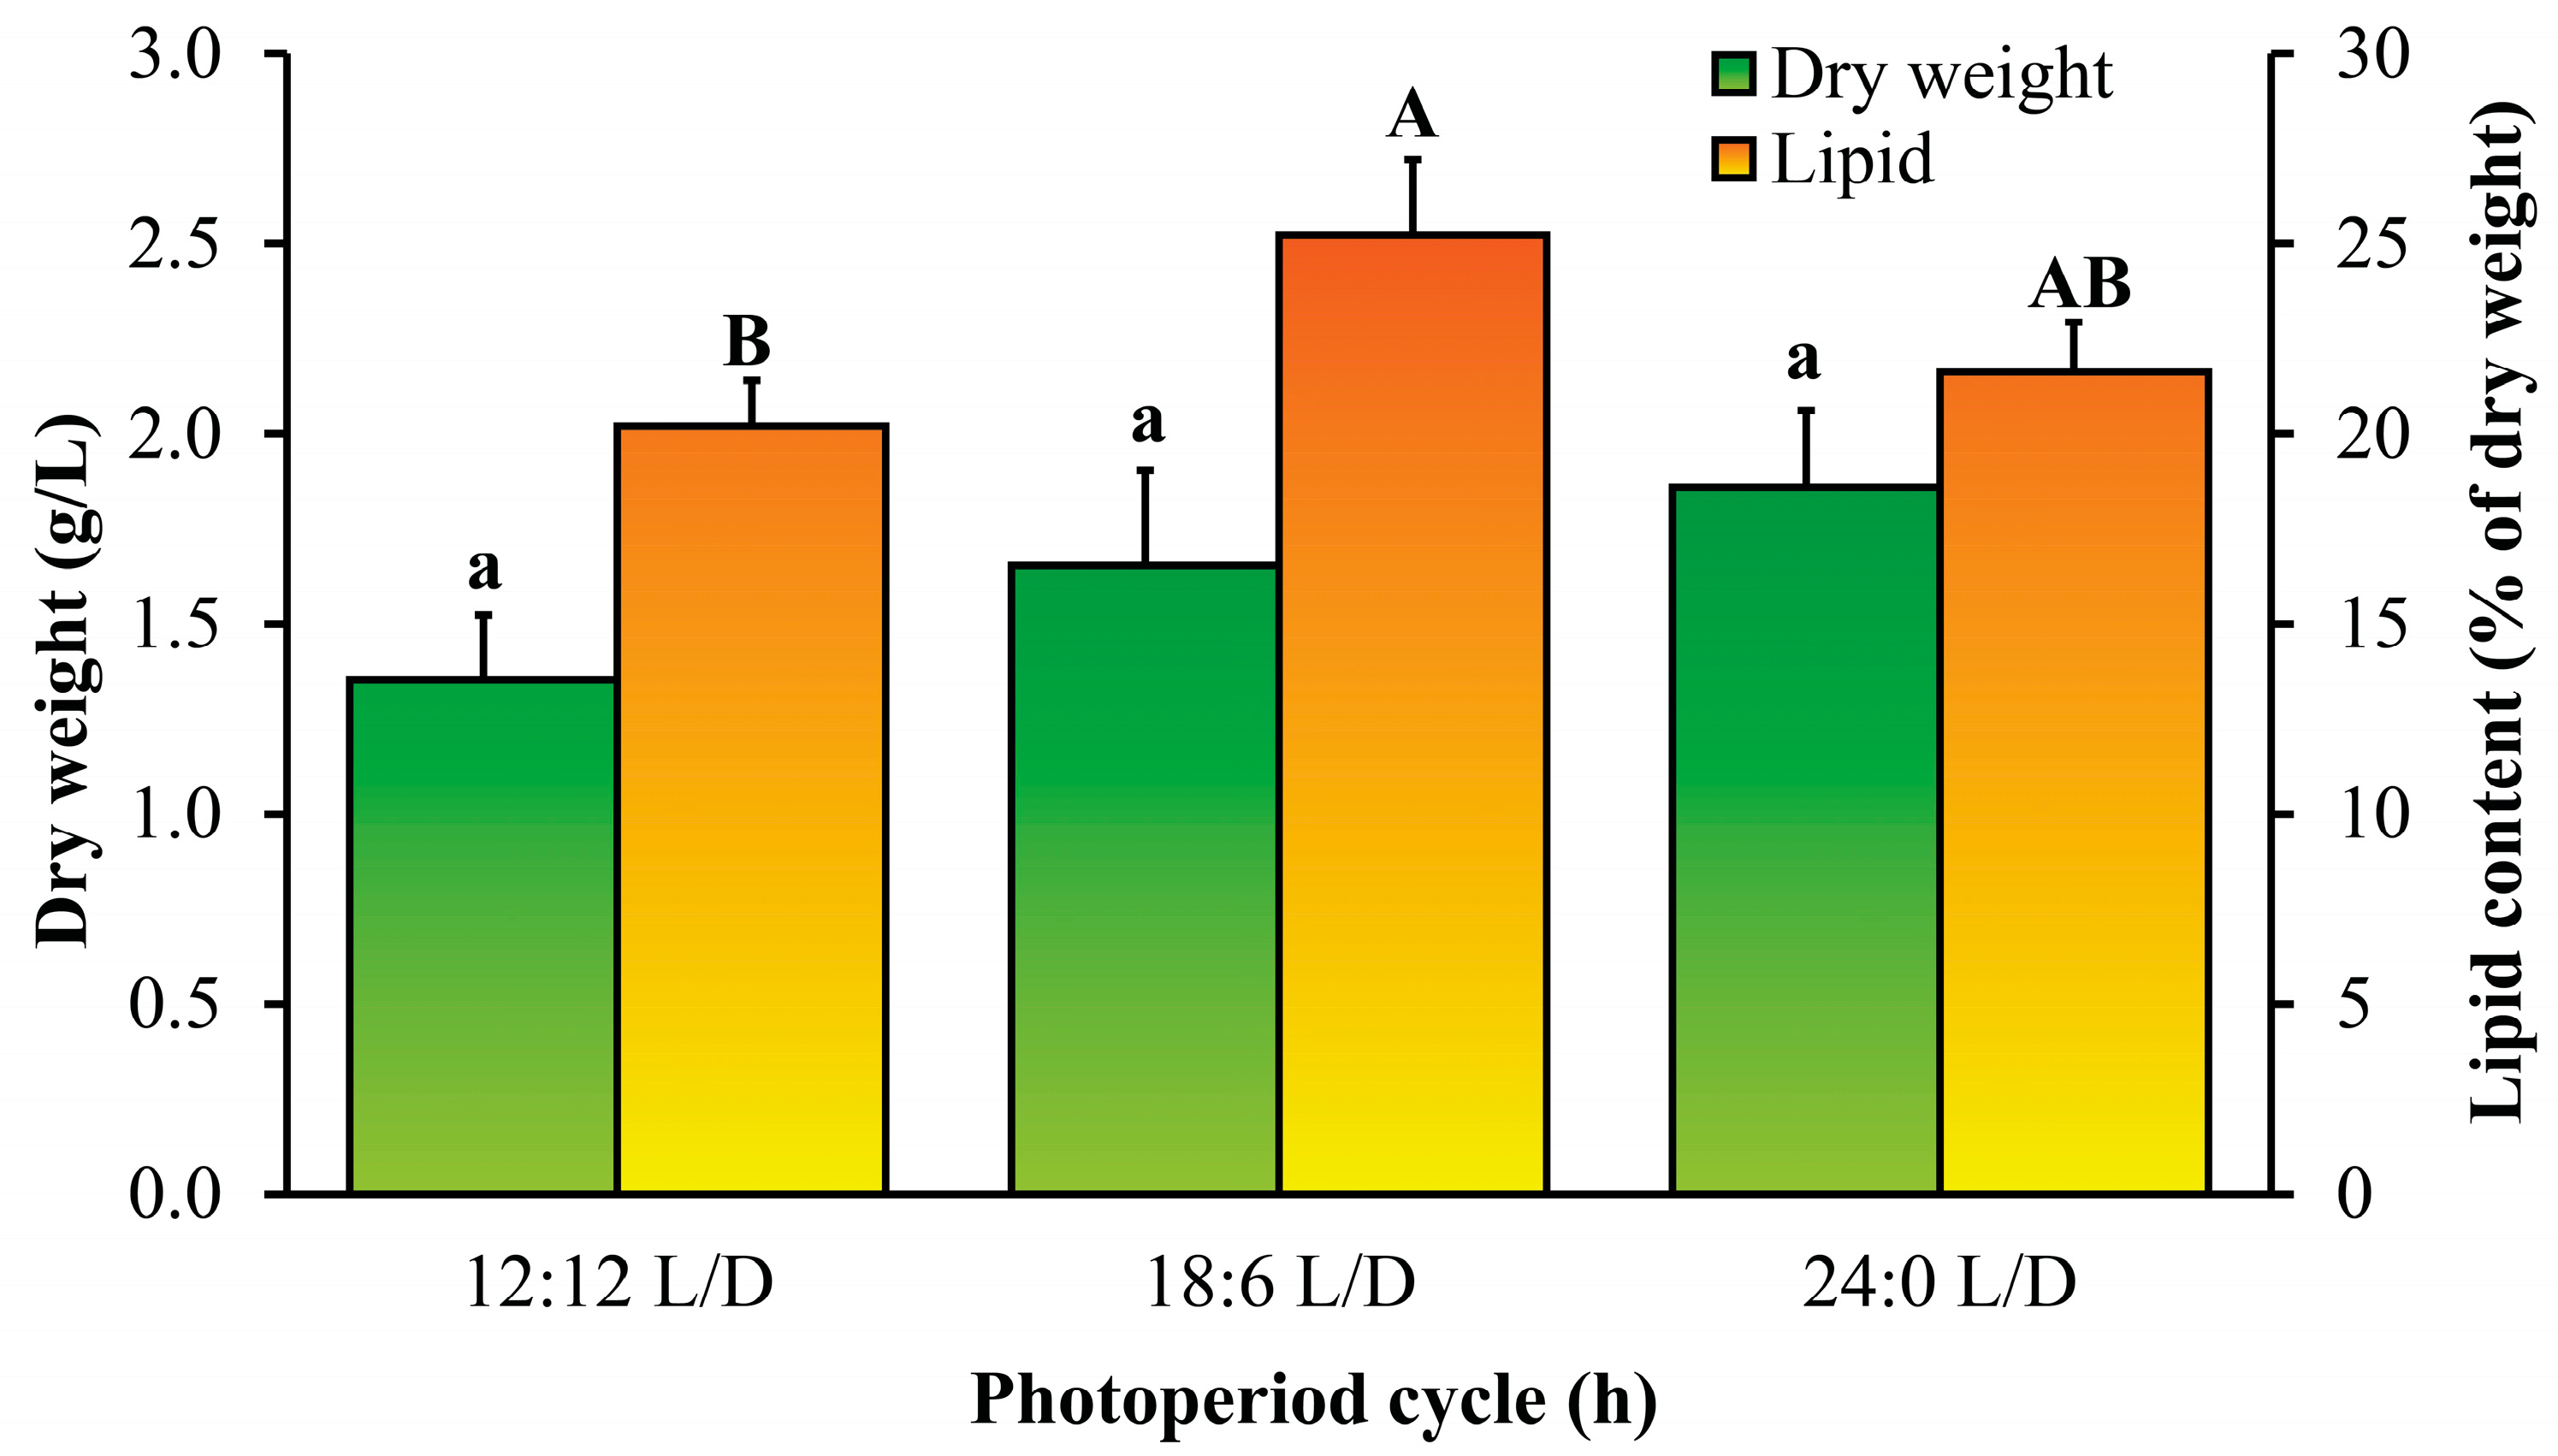
3.3. Effects of Light Intensity and Photoperiod

Light intensity is an environmental factor that plays a vital role in the growth and CO2 fixation of microalgae. In photosynthesis production, microalgae require a light/dark system. They require a light system to produce organic cofactors (ATP and NADPH) and a dark system to synthesize biomolecules for algae growth (e.g., carbohydrates, protein, and lipids) [32]. The light intensity levels for the inhibition and saturation of algal growth depend upon the propriety of other environmental factors such as CO2 concentration, temperature, and nutrient supplementation [33]. In this study, the microalga, C. variabilis RSM09, was cultivated under different light intensities. Figure 6 illustrates the cell growth curve of C. variabilis RSM09 at light intensities of 3000, 5000, and 7000 Lux, respectively, in the 24:0 h (light/dark) photoperiod. In the first two days, all the cultures showed slow growth, indicating that the cells were in the adaptation period (lag phase). From day 2 to 6, all the cultures entered the exponential growth phase during which the cells multiplied fast. From day 6 onwards, the cultures entered the early stationary phase. The highest optical density (4.20 ± 0.14) was achieved at the light intensity of 5000 Lux whereas the lowest cell density (3.87 ± 0.10) was obtained at the light intensity of 7000 Lux.
Figure 7 shows the biomass and lipid concentrations of C. variabilis RSM09 under different light intensities during a 14-day culture period.
From Figure 7, the dry weights of C. variabilis RSM09 were found between 1.55 ± 0.17 g/L and 1.79 ± 0.25 g/L under different light intensities. The dry weight is highest under 5000 Lux, accounting for 1.79 ± 0.25 g/L. The result is similar to that reported by Shu et al. [34]. They found that the biomass concentration reached the maximum at 5000 Lux with 1884 ± 12.55 mg/L. For photoautotrophic microalgae, the light supply significantly impacts cell development and CO2 fixation in the photosynthetic system. It may also alter the biochemical makeup of the microalgae, such as its content of lipids or carbohydrates [35]. In this study, the lower total lipid content of C. variabilis RSM09 was detected under 3000 lux, while it is higher under 5000 Lux (Figure 7). Mandotra et al. [36] reported that a light intensity of 5000–6000 Lux could promote the lipid accumulation of Scenedesmus abundans with a maximum lipid content of 32.77 ± 0.6% wt.
The effect of three different lengths of photoperiod conditions at a light intensity of 5000 Lux on the growth of C. variabilis RSM09 for 14 days of the cultivation period is illustrated in Figure 8. The results indicate that microalgal growth increased as the photoperiod extended from 12:12 to 24:0 h (L/D cycle). Figure 9 shows the biomass concentration and lipid content of C. variabilis RSM09 under different photoperiods. It found that the photoperiod had a high effect on biomass concentration. The increase in dry cell weight was associated with increased light duration. The lowest dry weight (1.35 ± 0.43 g/L) was observed at 12:12 h L/D, and the highest dry weight (1.86 ± 0.21 g/L) was found at 24:0 h L/D at the end of the cultivation period. More extended light periods encourage photosynthesis, and biomass concentration may be raised by altering the intensity and wavelength. Contreras-Ropero et al. [37] reported that when compared with the control (12:12 photoperiod), the biomass of Oscillatoria sp. OSCI_UFPS001 was increased significantly by up to 1.6 g/L at a photoperiod of 24:0 (L/D cycle).
In this study, the photoperiod or light/dark cycles at different lengths also significantly affect algal lipid accumulation. The lipid content was lower at 24:0 h L/D compared to 18:6 h L/D under the light intensity of 5000 lux with a lipid content of 25.22 ± 2.06% wt. (Figure 9). The results indicate that higher biomass corresponds to greater lipid content. Additionally, microalgae grown under various light intensities and light/dark cycles exhibited considerable variations in their overall chemical composition, pigment concentration, and photosynthetic activity [38].

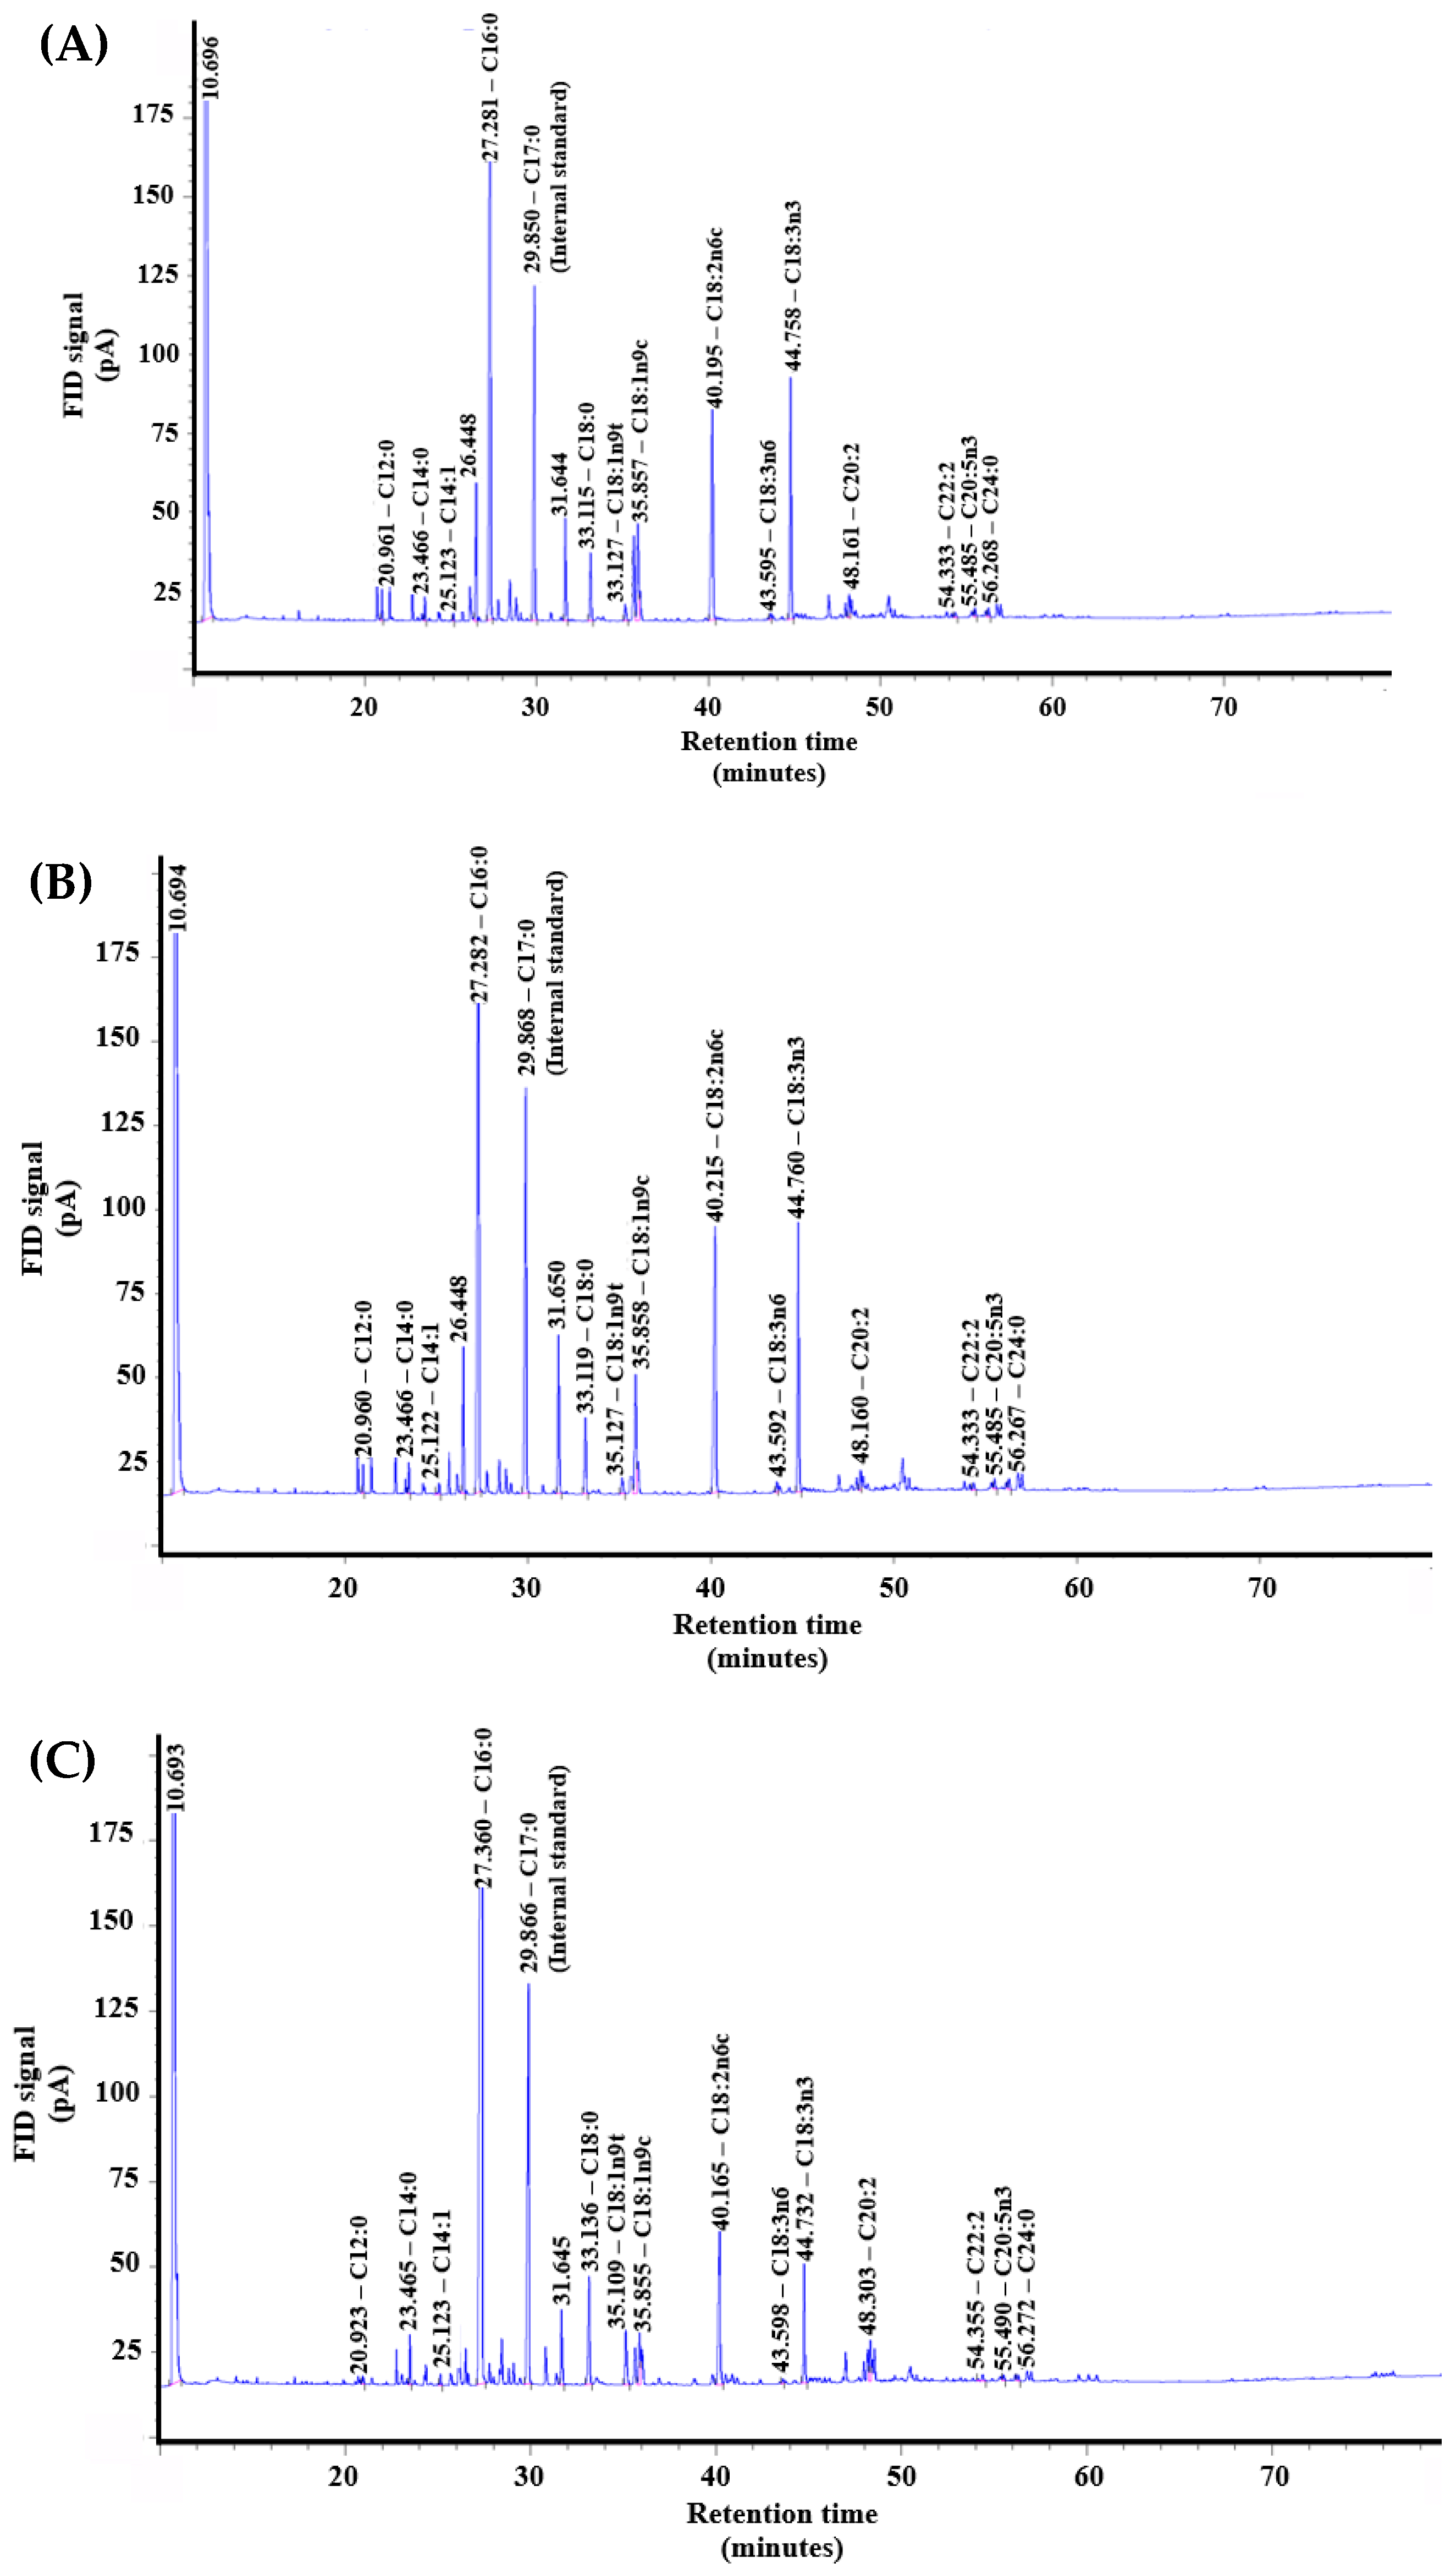
3.4. Fatty Acid Composition of Lipids from C. variabilis RSM09

Obtaining a suitable lipid composition for biofuel generation is just as crucial as increasing the overall volume of lipids generated from microalgae. The lipid generated from microalgal species typically has a lipid profile that is mainly composed of C16 and C18 fatty acids, comparable to that of vegetable oils, making it appropriate for the generation of biodiesel [35]. The lipids extracted from C. variabilis RSM09 under three different photoperiods were utilized for transesterification. The FAME analysis was performed by GC-FID. A representative chromatogram of the FAME analysis using GC-FID is depicted in Figure 10. The FAME profiles of C. variabilis RSM09 under three different photoperiods are shown in Table 1.
According to photoperiod acclimation, all cultured microalgae had patterns of fluctuation in the concentration of identical fatty acid classes. Palmitic (16:0), linoleic (C18:2), and linolenic (C18:3) acids were predominant in C. variabilis RSM09 under all photoperiods. These results were in accordance with those of Amini Khoeyi et al. [39] and Lim et al. [40]. Within biodiesel production, feedstock must possess a high lipid content and a suitable fatty acid profile. The ratio of various fatty acids significantly influences the overall properties of the fuel [41]. The fatty acid methyl ester (FAME) profile of C. variabilis RSM09 reveals that its primary fatty acids are palmitic acid (C16:0), linoleic acid (C18:2), and linolenic acid (C18:3). Among the other components, the percentage of palmitic acid is the highest, at 45.09%, 42.27%, and 70.50% of dry weight under different photoperiods of 12:12, 18:6, and 24:0 h L/D, respectively. Pekkoh et al. [41] indicated that the high abundance of palmitic acid in biodiesel contributes to its elevated cetane number and exceptional oxidative stability. In addition, cultivated microalgae under 24:0 h L/D had a higher value of SFA than those under 18:6 h and 12:12 h L/D, whereas cultivated microalgae under 18:6 h L/D had a higher value of MFA and PFA than the others. The results indicated that decreasing light duration was associated with increased MUFA and PUFA and decreased SFA. The alteration in the fatty acid composition of microalgae exposed to different light durations might be explained by the fact that these lipids, being the principal component of chloroplast membranes, play a vital role in the formation of the photosynthetic apparatus of the algae [39]. According to Klyachko-Gurvich et al. [42], PUFAs are crucial for maintaining the function of the photosynthetic membrane and are also crucial for acclimating to low-light conditions. On the other hand, the biosynthesis of SFA requires high amounts of photosynthetically produced ATP and NADPH, and high chlorophyll a content may help to support high SFA production [43]. Thus, the change in fatty acid composition in this study may be one adaptive response of C. variabilis RSM09 under various light durations.

4. Conclusions

In the present study, C. variabilis RSM09 was cultured at various CO2 concentrations ranging from 0.03% to 50% (v/v), light intensities (3000, 5000, and 7000 Lux), and photoperiods (12:12, 18:6, and 24:0 h L/D) to examine microalgal growth lipid production. The results revealed that the CO2 concentration of 20% v/v, the light intensity of 5000 Lux, and a photoperiod of 18:6 h L/D were practically suitable for culturing C. variabilis RSM09. Under these conditions, the biomass reached 1.65 ± 0.17 g/L with a lipid content of 25.22 ± 2.06% wt. According to the FAME profiles, the main fatty acids from C. variabilis RSM09 biomass included palmitic acid, stearic acid, linoleic acid, and linolenic acid. These findings suggest that these suitable conditions can enhance growth, lipid concentration, and the production of key fatty acids suitable for biodiesel production.

Author Contributions

Conceptualization, S.U. and A.C.; methodology, S.U. and A.C.; investigation, S.U. and A.C.; writing—original draft preparation, S.U. and A.C.; writing—review and editing, S.U. and A.C.; funding acquisition, S.U. and A.C. All authors have read and agreed to the published version of the manuscript.

Funding

This research was funded by King Mongkut’s University of Technology North Bangkok. Contract no. KMUTNB-63-KNOW-015.

Institutional Review Board Statement

Not applicable.

Informed Consent Statement

Not applicable.

Data Availability Statement

The original contributions presented in the study are included in the article, further inquiries can be directed to the corresponding author.

Acknowledgments

The authors greatly thank the Faculty of Science, Energy and Environment, King Mongkut’s University of Technology North Bangkok, Rayong Campus, for their support.

Conflicts of Interest

The authors declare no conflicts of interest.

References

  1. Medipally, S.R.; Yusoff, F.M.; Banerjee, S.; Shariff, M. Microalgae as Sustainable Renewable Energy Feedstock for Biofuel Production. Biomed. Res. Int. 2015, 2015, 519513. [Google Scholar] [CrossRef] [PubMed]
  2. Shuba, E.S.; Kifle, D. Microalgae to Biofuels: ‘Promising’ Alternative and Renewable Energy, Review. Renew. Sustain. Energy Rev. 2018, 81, 743–755. [Google Scholar] [CrossRef]
  3. Chhandama, M.V.L.; Satyan, K.B.; Changmai, B.; Vanlalveni, C.; Rokhum, S.L. Microalgae as a Feedstock for the Production of Biodiesel: A Review. Bioresour. Technol. Rep. 2021, 15, 100771. [Google Scholar] [CrossRef]
  4. Khan, M.A.H.; Bonifacio, S.; Clowes, J.; Foulds, A.; Holland, R.; Matthews, J.C.; Percival, C.J.; Shallcross, D.E. Investigation of Biofuel as a Potential Renewable Energy Source. Atmosphere 2021, 12, 1289. [Google Scholar] [CrossRef]
  5. Chowdhury, H.; Loganathan, B. Third-Generation Biofuels from Microalgae: A Review. Curr. Opin. Green. Sustain. Chem. 2019, 20, 39–44. [Google Scholar] [CrossRef]
  6. Hossain, A.B.M.S.; Salleh, A.; Boyce, A.N.; chowdhury, P.; Naqiuddin, M. Biodiesel Fuel Production from Algae as Renewable Energy. Am. J. Biochem. Biotechnol. 2008, 4, 250–254. [Google Scholar] [CrossRef]
  7. Huang, G.; Chen, F.; Wei, D.; Zhang, X.; Chen, G. Biodiesel Production by Microalgal Biotechnology. Appl. Energy 2010, 87, 38–46. [Google Scholar] [CrossRef]
  8. Mata, T.M.; Martins, A.A.; Caetano, N.S. Microalgae for Biodiesel Production and Other Applications: A Review. Renew. Sustain. Energy Rev. 2010, 14, 217–232. [Google Scholar] [CrossRef]
  9. Nascimento, I.A.; Marques, S.S.I.; Cabanelas, I.T.D.; Pereira, S.A.; Druzian, J.I.; de Souza, C.O.; Vich, D.V.; de Carvalho, G.C.; Nascimento, M.A. Screening Microalgae Strains for Biodiesel Production: Lipid Productivity and Estimation of Fuel Quality Based on Fatty Acids Profiles as Selective Criteria. Bioenergy Res. 2013, 6, 1–13. [Google Scholar] [CrossRef]
  10. Chu, W.-L. Strategies to Enhance Production of Microalgal Biomass and Lipids for Biofuel Feedstock. Eur. J. Phycol. 2017, 52, 419–437. [Google Scholar] [CrossRef]
  11. Chisti, Y. Biodiesel from Microalgae. Biotechnol. Adv. 2007, 25, 294–306. [Google Scholar] [CrossRef] [PubMed]
  12. Bhakta, J.N.; Lahiri, S.; Pittman, J.K.; Jana, B.B. Carbon Dioxide Sequestration in Wastewater by a Consortium of Elevated Carbon Dioxide-Tolerant Microalgae. J. CO2 Util. 2015, 10, 105–112. [Google Scholar] [CrossRef]
  13. Boonma, S.; Chaiklangmuang, S.; Chaiwongsar, S.; Pekkoh, J.; Pumas, C.; Ungsethaphand, T.; Tongsiri, S.; Peerapornpisal, Y. Enhanced Carbon Dioxide Fixation and Bio-oil Production of a Microalgal Consortium. Clean 2015, 43, 761–766. [Google Scholar] [CrossRef]
  14. Chiu, S.-Y.; Kao, C.-Y.; Chen, C.-H.; Kuan, T.-C.; Ong, S.-C.; Lin, C.-S. Reduction of CO2 by a High-Density Culture of Chlorella sp. in a Semicontinuous Photobioreactor. Bioresour. Technol. 2008, 99, 3389–3396. [Google Scholar] [CrossRef] [PubMed]
  15. Cheng, J.; Huang, Y.; Feng, J.; Sun, J.; Zhou, J.; Cen, K. Improving CO2 Fixation Efficiency by Optimizing Chlorella PY-ZU1 Culture Conditions in Sequential Bioreactors. Bioresour. Technol. 2013, 144, 321–327. [Google Scholar] [CrossRef]
  16. Li, S.; Luo, S.; Guo, R. Efficiency of CO2 Fixation by Microalgae in a Closed Raceway Pond. Bioresour. Technol. 2013, 136, 267–272. [Google Scholar] [CrossRef]
  17. Dragone, G. Challenges and Opportunities to Increase Economic Feasibility and Sustainability of Mixotrophic Cultivation of Green Microalgae of the Genus Chlorella. Renew. Sustain. Energy Rev. 2022, 160, 112284. [Google Scholar] [CrossRef]
  18. Chankhong, K.; Chotigeat, W.; Iewkittayakorn, J. Effects of Culture Medium on Growth Kinetics and Fatty Acid Composition of Chlorella sp. T12. Songklanakarin J. Sci. Technol. 2018, 40, 1098–1104. [Google Scholar]
  19. Metsoviti, M.N.; Papapolymerou, G.; Karapanagiotidis, I.T.; Katsoulas, N. Effect of Light Intensity and Quality on Growth Rate and Composition of Chlorella Vulgaris. Plants 2019, 9, 31. [Google Scholar] [CrossRef]
  20. Indrayani, I.; Haslianti, H.; Asmariani, A.; Muskita, W.; Balubi, A.M. Growth, Biomass and Lipid Productivity of a Newly Isolated Tropical Marine Diatom, Skeletonema sp. UHO29, under Different Light Intensities. Biodiversitas 2020, 21, 1498–1503. [Google Scholar] [CrossRef]
  21. Kumaran, K.; Lam, M.K.; Tan, X.B.; Uemura, Y.; Lim, J.W.; Khoo, C.G.; Lee, K.T. Cultivation of Chlorella Vulgaris Using Plant-Based and Animal Waste-Based Compost: A Comparison Study. Procedia Eng. 2016, 148, 679–686. [Google Scholar] [CrossRef]
  22. Odeh, W.; Sweiss, M.; Ahmad, F.H.; Arabeyyat, Z.; Alnsour, W.; Aldabbas, M.; Hasan, M. Isolation and Identification of Green Microalgae from Northern Jordan. J. Pure Appl. Microbiol. 2023, 17, 2205–2214. [Google Scholar] [CrossRef]
  23. Burja, A.M.; Tamagnini, P.; Bustard, M.T.; Wright, P.C. Identification of the Green Alga, Chlorella vulgaris (SDC1) Using Cyanobacteria Derived 16S RDNA Primers: Targeting the Chloroplast. FEMS Microbiol. Lett. 2001, 202, 195–203. [Google Scholar] [CrossRef] [PubMed]
  24. Yoo, C.; Jun, S.-Y.; Lee, J.-Y.; Ahn, C.-Y.; Oh, H.-M. Selection of Microalgae for Lipid Production under High Levels Carbon Dioxide. Bioresour. Technol. 2010, 101, S71–S74. [Google Scholar] [CrossRef] [PubMed]
  25. Bligh, E.G.; Dyer, W.J. A Rapid Method for Total Lipid Extraction and Purification. Can. J. Biochem. Physiol. 1959, 37, 911–917. [Google Scholar] [CrossRef]
  26. Slover, H.T.; Lanza, E. Quantitative Analysis of Food Fatty Acids by Capillary Gas Chromatography. J. Am. Oil Chem. Soc. 1979, 56, 933–943. [Google Scholar] [CrossRef]
  27. Kumar, K.; Dasgupta, C.N.; Nayak, B.; Lindblad, P.; Das, D. Development of Suitable Photobioreactors for CO2 Sequestration Addressing Global Warming Using Green Algae and Cyanobacteria. Bioresour. Technol. 2011, 102, 4945–4953. [Google Scholar] [CrossRef]
  28. Wawrzyńczak, D. Industrial Carbon Dioxide Capture and Utilization Technology. In The Carbon Chain in Carbon Dioxide Industrial Utilization Technologies; CRC Press: Boca Raton, FL, USA, 2022; pp. 1–15. [Google Scholar]
  29. Tang, D.; Han, W.; Li, P.; Miao, X.; Zhong, J. CO2 Biofixation and Fatty Acid Composition of Scenedesmus Obliquus and Chlorella Pyrenoidosa in Response to Different CO2 Levels. Bioresour. Technol. 2011, 102, 3071–3076. [Google Scholar] [CrossRef]
  30. Solovchenko, A.; Khozin-Goldberg, I. High-CO2 Tolerance in Microalgae: Possible Mechanisms and Implications for Biotechnology and Bioremediation. Biotechnol. Lett. 2013, 35, 1745–1752. [Google Scholar] [CrossRef]
  31. Wong, Y.-K.; Ho, K.C.; Lai, P.-K.; Leung, C.-C.; Ho, Y.-M.; Lee, O.-K.; Yung, K.-L.; Leung, H.-M. A Study on Algal Growth Behaviour under Different Sparing Period of CO2 Supplementation. In Proceedings of the 1st International Conference on Beneficial Uses of Algal Biomass, ICBUAB, Hong Kong, China, 5–8 November 2013; pp. 19–28. [Google Scholar]
  32. Al-Qasm, M.; Raut, N.; Talebi, S.; Al-Rajhi, S.; Al-Barwani, T. A Review of Effect of Light on Microalgae Growth. In Proceedings of the World Congress on Engineering, London, UK, 4–6 July 2012. [Google Scholar]
  33. Sorokin, C.; Krauss, R.W. The Effects of Light Intensity on the Growth Rates of Green Algae. Plant Physiol. 1958, 33, 109–113. [Google Scholar] [CrossRef]
  34. Shu, C.-H.; Tsai, C.-C.; Chen, K.-Y.; Liao, W.-H.; Huang, H.-C. Enhancing High Quality Oil Accumulation and Carbon Dioxide Fixation by a Mixed Culture of Chlorella sp. and Saccharomyces Cerevisiae. J. Taiwan. Inst. Chem. Eng. 2013, 44, 936–942. [Google Scholar] [CrossRef]
  35. Ho, S.-H.; Chen, C.-Y.; Chang, J.-S. Effect of Light Intensity and Nitrogen Starvation on CO2 Fixation and Lipid/Carbohydrate Production of an Indigenous Microalga Scenedesmus Obliquus CNW-N. Bioresour. Technol. 2012, 113, 244–252. [Google Scholar] [CrossRef] [PubMed]
  36. Mandotra, S.K.; Kumar, P.; Suseela, M.R.; Nayaka, S.; Ramteke, P.W. Evaluation of Fatty Acid Profile and Biodiesel Properties of Microalga Scenedesmus Abundans under the Influence of Phosphorus, PH and Light Intensities. Bioresour. Technol. 2016, 201, 222–229. [Google Scholar] [CrossRef] [PubMed]
  37. Contreras-Ropero, J.E.; Lidueñez-Ballesteros, V.S.; Rodríguez-Bohórquez, A.D.; García-Martínez, J.B.; Urbina-Suarez, N.A.; López-Barrera, G.L.; Barajas-Solano, A.F.; Bryan, S.J.; Zuorro, A. The Effect of LEDs on Biomass and Phycobiliproteins Production in Thermotolerant Oscillatoria sp. Appl. Sci. 2022, 12, 11664. [Google Scholar] [CrossRef]
  38. Wahidin, S.; Idris, A.; Shaleh, S.R.M. The Influence of Light Intensity and Photoperiod on the Growth and Lipid Content of Microalgae Nannochloropsis sp. Bioresour. Technol. 2013, 129, 7–11. [Google Scholar] [CrossRef]
  39. Amini Khoeyi, Z.; Seyfabadi, J.; Ramezanpour, Z. Effect of Light Intensity and Photoperiod on Biomass and Fatty Acid Composition of the Microalgae, Chlorella Vulgaris. Aquac. Int. 2012, 20, 41–49. [Google Scholar] [CrossRef]
  40. Lim, K.C.; Zaleha, K. Effect of Photoperiod on the Cellular Fatty Acid Composition of Three Tropical Marine Microalgae. Malays. Appl. Biol. J. 2013, 42, 41–49. [Google Scholar]
  41. Pekkoh, J.; Duangjan, K.; Phinyo, K.; Kaewkod, T.; Ruangrit, K.; Thurakit, T.; Pumas, C.; Pathom-aree, W.; Cheirsilp, B.; Gu, W.; et al. Turning Waste CO2 into Value-Added Biorefinery Co-Products Using Cyanobacterium Leptolyngbya sp. KC45 as a Highly Efficient Living Photocatalyst. Chem. Eng. J. 2023, 460, 141765. [Google Scholar] [CrossRef]
  42. Klyachko-Gurvich, G.L.; Tsoglin, L.N.; Doucha, J.; Kopetskii, J.; Shebalina (ryabykh), I.B.; Semenenko, V.E. Desaturation of Fatty Acids as an Adaptive Response to Shifts in Light Intensity 1. Physiol. Plant 1999, 107, 240–249. [Google Scholar] [CrossRef]
  43. Arora, N.; Philippidis, G.P. Insights into the Physiology of Chlorella Vulgaris Cultivated in Sweet Sorghum Bagasse Hydrolysate for Sustainable Algal Biomass and Lipid Production. Sci. Rep. 2021, 11, 6779. [Google Scholar] [CrossRef]
Figure 1. Sampling location of C. variabilis RSM09 from brackish water at Raksamae Bridge, Klaeng, Rayong, Thailand (source: Google Earth and Google Maps Streetview).
Applsci 14 10512 g001
Figure 2. The circular phylogenetic tree of the isolated microalga (ITS region) shown using the BIONJ algorithm for 10,000 bootstraps. The phylogenetic tree was analyzed by SeaView software version 4.7 and Figtree software version 1.4.4.
Applsci 14 10512 g002
Figure 3. The circular phylogenetic tree of the isolated microalga (chloroplast small subunit rRNA) shown using the BIONJ algorithm for 10,000 bootstraps. The phylogenetic tree was analyzed by SeaView software version 4.7 and Figtree software version 1.4.4.
Applsci 14 10512 g003
Figure 4. Growth curve of C. variabilis RSM09 under different CO2 concentrations. Error bars show ± S.D. of three replicates.
Applsci 14 10512 g004
Figure 5. Dry weight and lipid content of C. variabilis RSM09 under different CO2 concentrations. Different letters represent statistically significant difference (p < 0.05).
Applsci 14 10512 g005
Figure 6. Growth curve of C. variabilis RSM09 under different light intensities in 24:0 h photoperiod. Error bars show ± S.D. of three replicates.
Applsci 14 10512 g006
Figure 7. Dry weight and lipid content of C. variabilis RSM09 under different light intensities in 24:0 h photoperiod. Different letters represent statistically significant difference (p < 0.05).
Applsci 14 10512 g007
Figure 8. Growth curve of C. variabilis RSM09 under 5000 Lux of light intensity in different photoperiods (12:12, 18:6, and 24:0 h L/D cycles). Error bars show ± S.D. of three replicates.
Applsci 14 10512 g008
Figure 9. Dry weight and lipid content of C. variabilis RSM09 under 5000 Lux of light intensity in different photoperiods (12:12, 18:6, and 24:0 h L/D cycles). Different letters represent statistically significant difference (p < 0.05).
Applsci 14 10512 g009
Figure 10. GC-FID chromatogram for FAME analysis of lipids extracted from C. variabilis RSM09 under different photoperiods—(A) 12:12 (L/D cycle), (B) 18:6 (L/D cycle), and (C) 24:0 (L/D cycle).
Applsci 14 10512 g010
Table 1. FAME compositions of C. variabilis RSM09 cultivated under different photoperiods.
Fatty AcidFAME Composition (% of Total FAME)
12:12 L/D18:6 L/D24:0 L/D
Lauric (C12:0)0.860.700.24
Myristic (C14:0)0.680.790.96
Myristoleic (C14:1)0.260.380.26
Palmitic (C16:0)45.0942.2770.50
Stearic (C18:0)4.404.375.18
Oleic (C18:1)7.828.265.23
Linoleic (C18:2)18.2921.068.35
Linolenic (C18:3)17.7617.475.71
Eicosadienoic (C20:2)1.821.371.79
Eicosapentaenoic (C20:5)0.700.750.33
Docosadienoic (C22:2)0.580.730.65
Tetracosanoic (C24:0)1.741.850.80
Saturated fatty acids (SFAs)52.7749.9877.68
Monounsaturated fatty acids (MUFAs)8.088.645.49
Polyunsaturated fatty acids (PUFAs)39.1541.3816.83
Disclaimer/Publisher’s Note: The statements, opinions and data contained in all publications are solely those of the individual author(s) and contributor(s) and not of MDPI and/or the editor(s). MDPI and/or the editor(s) disclaim responsibility for any injury to people or property resulting from any ideas, methods, instructions or products referred to in the content.

