Abstract
Light non-aqueous phase liquids (LNAPLs), which include various petroleum products, are a significant source of groundwater contamination globally. Once introduced into the subsurface, these contaminants tend to accumulate in the vadose zone, causing chronic soil and water pollution. The vadose zone often contains lens-shaped bodies with diverse properties that can significantly influence the migration and distribution of LNAPLs. Understanding the interaction between LNAPLs and these lens-shaped bodies is crucial for developing effective environmental management and remediation strategies. Prior research has primarily focused on LNAPL behavior in homogeneous media, with less emphasis on the impact of heterogeneous conditions introduced by lens-shaped bodies. To investigate the impact of lens-shaped structures on the migration of LNAPLs and to assess the specific effects of different types of lens-shaped structures on the distribution characteristics of LNAPL migration, this study simulates the LNAPL leakage process using an indoor two-dimensional sandbox. Three distinct test groups were conducted: one with no lens-shaped aquifer, one with a low-permeability lens, and one with a high-permeability lens. This study employs a combination of oil front curve mapping and high-density resistivity imaging techniques to systematically evaluate how the presence of lens-shaped structures affects the migration behavior, distribution patterns, and corresponding resistivity anomalies of LNAPLs. The results indicate that the migration rate and distribution characteristics of LNAPLs are influenced by the presence of a lens in the gas band of the envelope. The maximum vertical migration distances of the LNAPL are as follows: high-permeability lens (45 cm), no lens-shaped aquifer (40 cm), and low-permeability lens (35 cm). Horizontally, the maximum migration distances of the LNAPL to the upper part of the lens body decreases in the order of low-permeability lens, high-permeability lens, and no lens-shaped aquifer. The low-permeability lens impedes the vertical migration of the LNAPL, significantly affecting its migration path. It creates a flow around effect, hindering the downward migration of the LNAPL. In contrast, the high-permeability lens has a weaker retention effect and creates preferential flow paths, promoting the downward migration of the LNAPL. Under conditions with no lens-shaped aquifer and a high-permeability lens, the region of positive resistivity change rate is symmetrical around the axis where the injection point is located. Future research should explore the impact of various LNAPL types, lens geometries, and water table fluctuations on migration patterns. Incorporating numerical simulations could provide deeper insights into the mechanisms controlling LNAPL migration in heterogeneous subsurface environments.
1. Introduction
Most petroleum products are non-aqueous phase liquids (NAPLs), which are generally immiscible with water. Those NAPLs that are less dense than water are referred to as light non-aqueous phase liquids (LNAPLs) [1]. Globally, LNAPL pollution has become a common phenomenon and is affecting people’s living environment to varying degrees. According to the U.S. Environmental Protection Agency, about 22% of the groundwater in the U.S. is contaminated by LNAPLs, which has become one of the top three sources of organic pollutants in the U.S. Once LNAPL has leaked into the ground, due to its special physicochemical properties, this type of pollutant will not migrate downward through the diving surface, and is commonly found in the vadose zone, which is highly stable and not easily degraded, resulting in the continuous contamination of the soil and groundwater [2]. Due to factors such as changes in the water table and soil structure, there are lenticular bodies with different pore structures, permeability properties, and thicknesses distributed in the vadose zone, and the lenticular bodies have a direct influence on the migration and diffusion process of LNAPLs. Lenticular bodies may adsorb an LNAPL or act as obstacles to block its transport, or cause LNAPL to form local aggregation in the vadose zone or promote its migration through the connecting channels between the lenticular bodies. Therefore, it is of practical significance and research significance to carry out the study on the migration and distribution characteristics of lenticular bodies in the vadose zone for environmental management and environmental protection.
Zheng Defeng et al. designed a two-dimensional sand flume experiment to simulate the leakage of LNAPLs in unsaturated and saturated zones, and depicted the oil front curves at certain time intervals to derive the basic characteristics of LNAPL transport in subsurface environments, establishing an oil front prediction model based on the experiments to obtain the distribution law of the transport of oil fronts over time [3]. Yuying Pan selected three different lithological combinations and analyzed the NAPL transport law based on the shape of oil fronts at different moments, and found that the type of NAPLs, the initial soil water content, the low-permeability lens, the leakage location, and the lithological mutation interface all affect the transport path and speed of NAPLs, and simulated the effects of rainfall and water table changes on the redistribution of NAPLs [4]. Xuan Ren set up a simulated tank experiment to investigate the blocking ability of LNAPL lens body thickness and the inhomogeneous interfaces formed by different R-values on the vertical transport of LNAPLs by observing the shape and extent of the wetting front of diesel fuel [5]. Lingyun Luo measured the thickness of the lens body formed by LNAPL in the air-packed zones of medium and coarse sand media by simulating the oil frontal surface maps recorded in the experiments and compared it with the predictions of the BC model and the VG model [6]. Yongtao Li used a homemade two-dimensional seepage tank to record the position of oil flow fronts through colorless Plexiglas, and carried out a study on the oil redistribution characteristics of the oil repellent process, the rising and falling water table, and the infiltration of precipitation after an oil spill in homogeneous medium sand, homogeneous coarse sand, upper medium sand and lower coarse sand, and the interbedded fine sand in the course sand [7]. Meanwhile, researchers set up the lithology and flow field changes of the vadose zone according to different experimental purposes. Zhenhui Zhu et al. simulated the migration process of diesel oil in porous media under different conditions through a one-dimensional soil column test setup, and analyzed the law of diesel oil vertical migration in sandy soils with two different grain sizes [8]. Wu et al. simulated the movement of diesel–water two-phase flow in glassy sand porous media with different grain sizes in the groundwater saturated zone, and obtained the saturation distribution of oil–water two-phase flow by the method of image analysis, thus making the quantitative analysis of saturation in multiphase flow possible [9]. Based on two media under fine sand and chalk sand, Zuo Rui et al. investigated the retention process of LNAPL pollutants in the capillary zone during the transport process and simulated the LNAPL transport process under the shallow point source leakage scenario through two-dimensional sand tank experiments [10]. Liu Hanle et al. investigated the transport mechanism and distribution characteristics of LNAPL under laminar inhomogeneous conditions in the unsaturated zone through indoor experiments, and found that the abrupt surface and locally dense lenticular body of the medium can change the migration path of the LNAPL, and the fluctuation of the groundwater level can also cause the redistribution of the LNAPL [11]. Abdul carried out laboratory column experiments to study the transport of petroleum products in the sandy porous medium and, by designing two experiments of falling and rising water tables, it was found that the fluctuation of the water table affects the depth of penetration and horizontal diffusion of petroleum [12]. Marina simulated the spillage of non-aqueous phase liquid (NAPL) in the unsaturated zone above the water table by a two-dimensional experiment, and found that the front advances at a constant rate during the penetration process, and when the NAPL encounters the capillary fringes when migrating downward, the majority of the contaminants are contained in a pancake-like lens located at the top of the capillary fringe, and fluctuations in the diving surface cause contaminants to spread to a larger area [13]. Wipfler et al. investigated the effect of the sloping sand layer on the redistribution of LNAPL overflow in the unsaturated zone through two-dimensional experiments, and found that the capillary pressure is the main controlling factor influencing the migration of the LNAPL in the air-packed zone [14]. Kamaruddin investigated the penetration, redistribution, and attenuation mechanism of LNAPL in the unsaturated zone based on two-dimensional experiments. Currently, in the study of LNAPLs, the high-density resistivity method has become a commonly used method for investigating contaminated sites, and has been applied in many indoor and outdoor contaminated sites, which can better provide information on the image of subsurface contaminated areas and thus study the mechanism of the migration process of LNAPLs. Govindarajan et al. used magnetic resonance imaging (MRI) to observe the migration of LNAPL trapped in wet sand during the natural evaporation of water from a porous medium [15]. Teramoto et al. measured the extent of LNAPL ground migration and distribution more accurately through the measurement of saturation by a high-resolution laser-induced fluorescence (LIF) technique [16], and found the above-mentioned conventional quantitative techniques do not adequately meet the demand for three-dimensional, nondestructive, and real-time measurements [17]. Iravani et al. used spectral induced polarization (SIP) and time domain reflectometry (TDR) to measure the complex resistivity and relative permittivity of DNAPL contaminants and concluded that there is a functional relationship between temperature and complex resistivity and relative permittivity [18]. Cardiff et al. utilized oscillatory hydrodynamic chromatography (OHC) imaging to monitor NAPL-contaminated zones, which can be easily obtained from the presence of NAPL in the water [19]. NAPL penetration rates in aquifers can be easily obtained, and OHC can be used as supplementary data to more accurately characterize NAPL-contaminated areas in combination with other geophysical methods [20]. Delaney et al. documented the changes in soil resistivity due to petroleum contamination of natural fine-grained soils in both the laboratory and in the field, and oil contamination was found to result in positive and negative resistivity anomalies associated with the soil [21]. Philippe et al. monitored diesel migration using a micro-resistivity array and time-delay ERT imaging with off-the-shelf commercial instrumentation and inversion software, and found it to be well suited for monitoring the dispersion of diesel fuel (LNAPL) contamination in the unsaturated and saturated zone of an unconfined sandy aquifer [22]. Yuying P et al. analyzed the migration process of LNAPL in an inhomogeneous soil layer by using the high-density resistivity method combined with three-dimensional inversion, and investigated the migration and diffusion of LNAPL during the fluctuation of groundwater level. The team also used a homemade resistivity probe to dynamically simulate and monitor the migration of diesel fuel in porous media, and determined the location of the LNAPL transport front by plotting resistivity curves and wavelet analysis [23]. Liu Hanle et al. simulated the transport of LNAPL pollutants in a three-dimensional non-homogeneous sand channel through indoor experiments, and used high-density resistivity imaging to obtain a process map of the resistivity values with time, and found that high-density resistivity imaging is feasible and effective for three-dimensional, dynamic monitoring of the transport of light non-aqueous phase liquids in non-homogeneous porous media [24]. Philippe et al. used a micro-resistivity array to monitor the diesel migration process and showed that diesel migrates vertically downward as it passes through the unsaturated zone until it begins to expand horizontally upon encountering the water table. The team also used time-shifted ERT imaging of micro-resistivity arrays to analyze the effect of bioremediation barriers on the migration of LNAPL contamination under unsaturated and saturated zone conditions [22]. Halihan et al. used resistivity imaging (ERI) to detect the transport mechanism of NAPL in a two-dimensional sandbox, and the results showed that the technique was able to detect NAPL thicknesses of more than 3.3 cm in the stratum [25]. Jian M et al. investigated abandoned perfume factories using ERT, which was able to depict areas of LNAPL contamination at high resolution and in agreement with borehole data, providing a more economical remediation cost [26]. Orlando et al. used resistivity and ground-penetrating radar to measure the electrical resistivity and permittivity of DNAPL-contaminated multiphase flow systems, and the combination of the two different electromagnetic methods can better explain complex multiphase flow systems [27]. Therefore, in this study, the high-density resistivity method was used to monitor the effect of lenticular bodies in the vadose zone on the migration pattern and distribution characteristics of LNAPL.
In summary, researchers have employed a suite of innovative experimental and simulation techniques, including two-dimensional flume experiments, high-density resistivity imaging technology, magnetic resonance imaging (MRI), and laser-induced fluorescence (LIF) technology, to delve deeply into the migration behavior of light non-aqueous phase liquids (LNAPLs) under various environmental conditions. These studies have uncovered a key phenomenon: after an LNAPL leaks, due to its unique physicochemical properties, it does not penetrate the water table to continue migrating downward but tends to accumulate and remain stable in the unsaturated zone, resistant to natural degradation. This characteristic leads to the long-term contamination of soil and groundwater resources. Furthermore, the research has found that the type of LNAPL, the initial soil moisture content, the specific location of the leak, and the abrupt interfaces in geological structures all significantly affect the migration pathways and rates of the LNAPL. These findings are crucial for predicting and simulating the migration of LNAPLs. Researchers have also further explored how natural conditions such as rainfall events and changes in groundwater levels affect the redistribution of LNAPLs through simulations. In reality, fluctuations in the groundwater table can significantly impact the redistribution of a residual phase LNAPL within the smear zone. These secondary sources often lead to persistent contamination of both groundwater and soil [28,29]. Although research on LNAPLs has been conducted by scholars in both field investigations and laboratory studies, the medium arrangement in existing experimental sandboxes is relatively simple, with most focusing on the migration patterns of LNAPL under homogeneous medium conditions, and few considering the conditions under different lens-shaped bodies. Moreover, these research methods often rely solely on direct observation or high-density electrical methods, which have their limitations.
To investigate the impact of lens-shaped structures on the migration of light non-aqueous phase liquids (LNAPLs), and to understand how different types of these structures affect the distribution characteristics of LNAPL migration, this paper builds upon the research of numerous scholars. It simulates the LNAPL leakage process using a two-dimensional indoor sandbox model. Diesel fuel is taken as a typical representative of LNAPLs. We conduct three distinct test groups: the no lens-shaped aquifer test group (using fine sand of uniform particle size), the low-permeability lens test group (where fine sand is locally interspersed with pulverized clay), and the high-permeability lens test group (where fine sand is locally interspersed with coarse sand). This study employs a combination of oil front curve mapping and high-density resistivity imaging techniques to systematically assess how the presence of lens-shaped structures affects the migration behavior, distribution patterns, and corresponding resistivity anomalies of LNAPL. Through this integrated analytical approach, we are able to gain a comprehensive understanding of how lens-shaped structures influence the migration dynamics of LNAPL and how they alter the response of resistivity. This research not only helps to reveal the regulatory mechanisms of lens-shaped structures on LNAPL migration but also holds significant implications for optimizing groundwater remediation strategies and assessing environmental risks.
2. Experimental Principles
2.1. Experimental Setup and Materials
The experimental setup utilizes a custom-made transparent plexiglass sandbox, measuring 120 × 20 × 55 cm, which is primarily composed of two sections: the test area and the water level adjustment area. The test area is centrally filled with a medium, while the water level adjustment area is located on both sides of the sandbox. The sidewalls of this area are equipped with water level adjustment holes, with eight holes per side spaced 5 cm apart, connected to Mariotte bottles to maintain a stable water head. The test area and the water level adjustment area are hydraulically connected by a perforated partition with a hole diameter of 0.1 cm. The partition is wrapped with gauze to ensure stable water flow and to prevent soil from entering the water level adjustment area. At the bottom of the sandbox, seven drainage holes are installed, each equipped with a filter to prevent soil loss, and controlled by water-stopping clips for drainage. The medium is placed inside the sandbox, and water is introduced through the water level adjustment area, allowing the water level to rise gradually. Once a water film forms on the surface of the soil, the system is left to stand for 24 h before the bottom drainage is opened. The water is then naturally drained by gravity until completely dry, and this process is repeated three times to achieve a uniform and stable unsaturated state of the medium. The leakage point is strategically located at the center of the test area. The entire leakage process is controlled by a peristaltic pump to regulate the amount and rate of pollutant discharge. The test setup is shown in Figure 1. The method of data acquisition used in this test is the intelligent high-density electro photometry system of Chongqing Top Technology Co. Ltd., which consists of the electro photometer mainframe, computer, power supply, intelligent switches, wireless transmission system, cables and copper electrodes. The particle analysis of the test medium gave the media properties as indicated in Table 1.
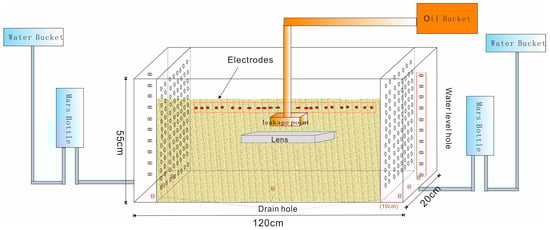
Figure 1.
Diagram of the experimental setup.

Table 1.
Indicators of media properties.
In this experiment, No. 0 light diesel oil was used as a representative of LNAPL. With a density of 0.84 g/mL, a kinematic viscosity coefficient of 3.0–8.0 mm2, a boiling point of 180–370 °C, being flammable and non-volatile, insoluble in water, soluble in ethanol and other organic solvents, and with a high degree of safety in operation, No. 0 diesel oil was chosen as a representative pollutant in the study of LNAPL. At the same time, in order to clearly record and photograph the LNAPL migration process, the diesel fuel was dyed red using Sudan Red as it melts in organic matter and does not dissolve in water. The physical properties of the test LNAPL representative media are shown in Table 2.
Table 2.
Basic Physical Properties of Diesel Fuel.
2.2. Experimental Procedure and Principle
According to the different test conditions, it was divided into the no lens-shaped aquifer test group, the low-permeability lens test group, and the high-permeability lens test group. Firstly, the two sides of the sand tank partition and the bottom drain were placed in the screen to prevent the loss of sand and soil. Uniformly fill the main medium and compact every 10 cm, with a total of 55 cm filled. A lens body (20 × 20 × 5 cm) is placed at a height of 45 cm, and a leakage trough is placed at a height of 50 cm. A peristaltic pump is used to continuously and quantitatively pump 4600 mL of oil into the leakage trough of the sand box at a speed of 4 rpm. A camera is placed outside the sand box, taking a photo every 15 min to record the migration and redistribution process of LNAPL at different times. The images are then redrawn into digital images using CorelDRAW 2018 software. Twenty-four electrodes (1 × 24) are arranged on top of the sand box with an electrode spacing of 4 cm, measuring in seven layers, using a concentrated cable. The power supply time is 500 ms, the power-off time is 50 ms, the gradient threshold is 100 mv/s, the overload delay is 500 ms, and data is collected every 15 min. The dipole–dipole arrangement measurement method (Figure 2) was used to calculate the resistivity ρ by supplying power downward through the power supply electrodes A and B, and measuring the potential difference between the measurement electrodes M and N. The calculation formula is as follows:
where is the resistivity (Ω∙m), is the geometry coefficient, is the observed potential difference (V), is the supply current, and AM, AN, BM, BN are the distances (m) between the corresponding electrodes. The measured resistivity was called apparent resistivity. To determine the true resistivity values of the subsurface, apparent resistivity datasets undergo data inversion [30]. In order to clearly reflect the resistivity characteristics of the LNAPL during the migration process, the background resistivity of the sandbox medium was measured before the leakage occurred, followed by time-shifted differential inversion. Time-lapse inversion of the obtained ERT data was carried out using software Res2DINV [31]. The high-density resistivity model inversion using the least-squares method with 5 iterations and an error value selected to be less than 10% was as follows:
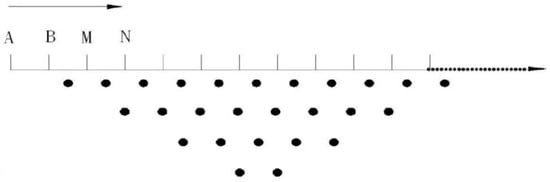
Figure 2.
Schematic diagram of the measurement method.
J is the partial derivative matrix; JT is the transpose matrix of J; u is the damping factor; d is the modification vector of the model parameters; g is the residual vector, which is the difference between the measured and simulated logarithmic values of the calculated resistivity; and is the smoothing matrix.
3. Experimental Results
3.1. Characterization of LNAPL Migration Rates
3.1.1. The No Lens-Shaped Aquifer Test Group
After leaking in homogeneous fine sand, the LNAPL formed an ellipsoidal shape and diffused uniformly in all directions. The degree of vertical diffusion was greater than the horizontal, with vertical migration fronts appearing rounded and smooth. This indicates that the vertical migration speed was rapid. In contrast, some horizontal migration fronts exhibited a jagged, folded distribution, suggesting the presence of small-scale medium heterogeneity within the soil matrix. As observed from the migration profile diagram in Figure 3a, the horizontal migration velocity of the LNAPL gradually decreases over time. The vertical migration velocity can be divided into three phases. In the early stage (first 65 min), the LNAPL migrated horizontally and vertically due to gravity and capillary forces, with horizontal migration initially faster than vertical, at rates of 0.18 cm/min and 0.15 cm/min, respectively. This was due to the significant capillary force in the fine sand, favoring early horizontal spread. However, as the diesel volume increased, vertical migration rates rose to 0.17 cm/min, surpassing horizontal rates, due to the oil’s weight. During the middle stage (65–160 min), horizontal migration contracted at 33 cm depth, as increased water content in the medium reduced LNAPL adsorption and decreased medium porosity, increasing capillary resistance and slowing LNAPL infiltration. In the late stage (160–315 min), vertical migration slowed and the oil front widened horizontally, as the LNAPL accumulated at the capillary fringe, favoring horizontal migration. The continuing leak intensified the LNAPL’s gravitational force, surpassing capillary forces, allowing the LNAPL to displace water and continue migrating slowly until the leak stopped.
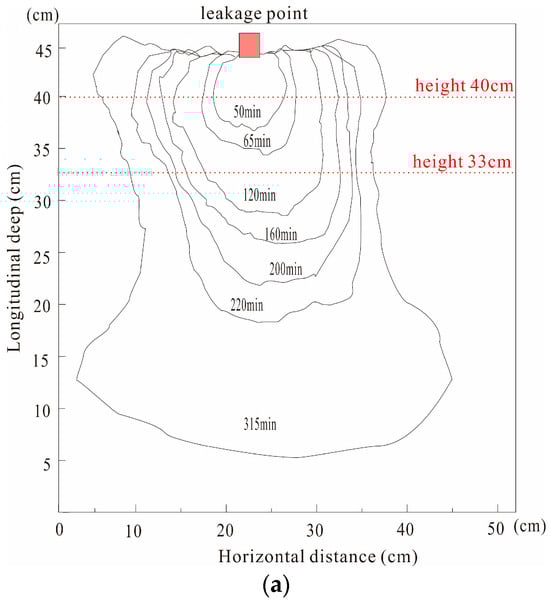
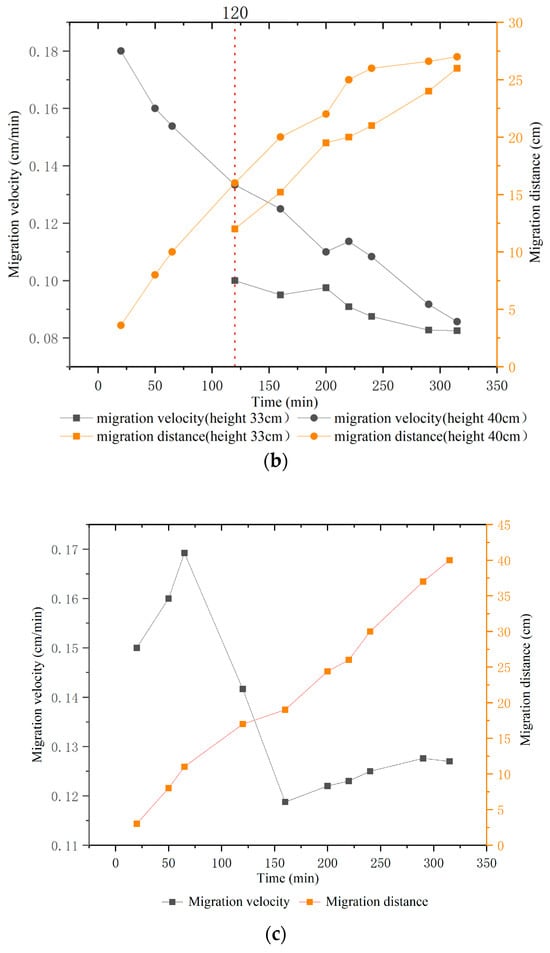
Figure 3.
Variation in the LNAPL migration velocity (No lens-shaped aquifer). (a) Migration process. (b) Lateral migration velocity at different heights. (c) Vertical migration velocity.
3.1.2. The Low-Permeability Lens Test Group
In the early stage of LNAPL leakage, the LNAPL diffused uniformly in the form of an ellipsoid within the homogeneous fine sand. Upon reaching the weak lens body, there was an obvious “flow-around” effect [32]. The LNAPL oil front generally diffused uniformly from the center outwards, with similar horizontal migration distances on both sides at any given time. By 300 min, LNAPL had infiltrated to a depth of 33 cm, marking a transition in both vertical and horizontal migration rates (Figure 4). The infiltration process was twofold:
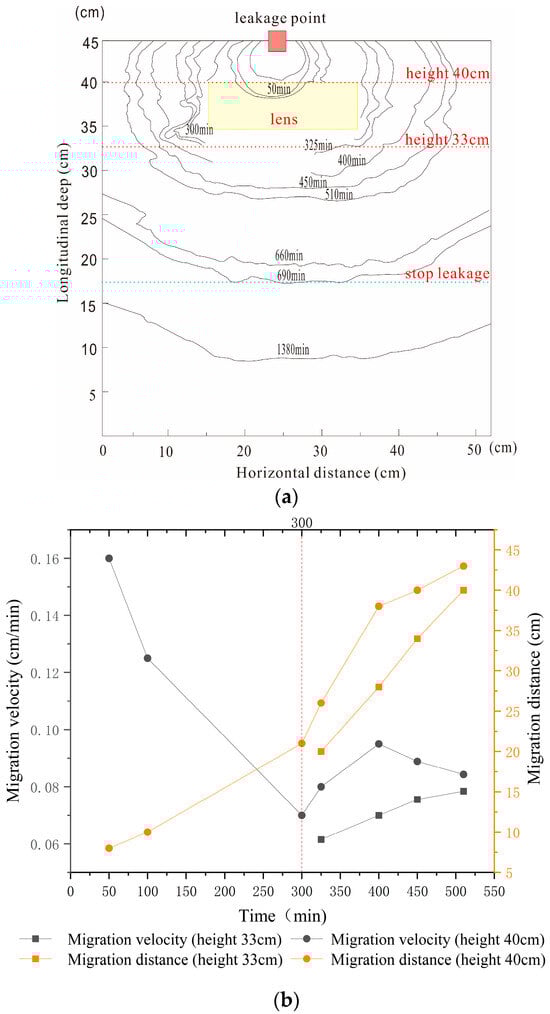
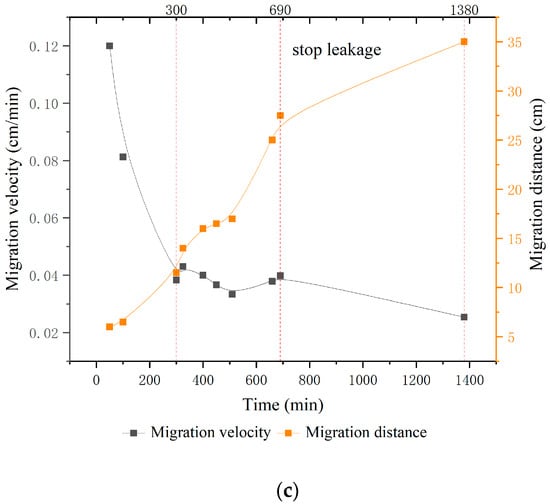
Figure 4.
Variation in the LNAPL migration velocity (low-permeability lens). (a) Migration process. (b) Lateral migration velocity at different heights. (c) Migration process.
In the first stage (0–300 min), initially, the LNAPL migrated like in homogeneous sand, with a horizontal rate of 0.16 cm/min exceeding the vertical rate of 0.12 cm/min. Upon encountering the clay lens, the oil front was disrupted due to reduced permeability, impeding vertical migration. Despite this, some LNAPL infiltrated the lower part of the lens due to higher leakage rates at the center. Most of the LNAPL bypassed the lens, converging at its lower part with a vertical rate surpassing the horizontal rate of 0.16 cm/min. In the second stage (300–690 min), the LNAPL accumulated at the lens’s lower part from 300 to 510 min, with horizontal migration rates rebounding and vertical rates continuing to decline as the distance exceeded 20 cm. From 510 to 690 min, as more LNAPL accumulated, the vertical migration rate slowly increased. Overall, horizontal diffusion was more pronounced than vertical.
3.1.3. The High-Permeability Lens Test Group
When the LNAPL encountered a high-permeability lens, it created an obvious ”preferential flow path” effect in the vertical direction [33]. As the LNAPL traversed the high-permeability lens, irregular finger-like flows were observed. This phenomenon was primarily due to the large particle size of the coarse sand. The accumulation of loose sand leads to significant internal pore size variation and greater microscopic inhomogeneity in pore size compared to pulverized clay. This resulted in the LNAPL advancing at a faster pace in certain areas, surpassing the average front velocity. From an overall perspective, the vertical diffusion appears to be greater, and the shape of the entire front is olive-like.
The LNAPL’s horizontal migration rate peaked at 0.625 cm/min before encountering the high-permeability lens at 40 cm, then declined as it entered this lens (Figure 5). The LNAPL’s spatial redistribution occurred within the lens due to its high porosity, which facilitated rapid lateral migration. However, continuous leakage increased vertical gravity, weakening horizontal migration after reaching 33 cm into the lens. The vertical migration rate decreased because the capillary force of the host medium was stronger than that of the lens medium; thus, when the LNAPL moved from coarse sand to fine sand, it faced greater capillary resistance, slowing vertical diffusion. After the leak stopped, the LNAPL migration in the fine sand continued, but the vertical rate significantly decreased due to reduced infiltration pressure. The LNAPL front generally diffused outward from the center, with similar horizontal migration distances on both sides, reaching 33 cm in 300 min. The process had two phases: the first 300 min with a horizontal rate of 0.16 cm/min, exceeding the vertical rate of 0.12 cm/min, and a noticeable break in the oil front upon encountering the low-permeability clay lens due to reduced permeability. Some LNAPL infiltrated the lower part of this lens, while the majority bypassed it, converging below with a higher vertical rate than the horizontal’s 0.16 cm/min. In the second phase (300–690 min), the LNAPL accumulated at the lens’s lower part, with horizontal rates rebounding and vertical rates slowly decreasing as the distances exceeded 20 cm. Between 510 and 690 min, vertical migration rates slowly increased with more accumulation. Overall, horizontal diffusion exceeded vertical.
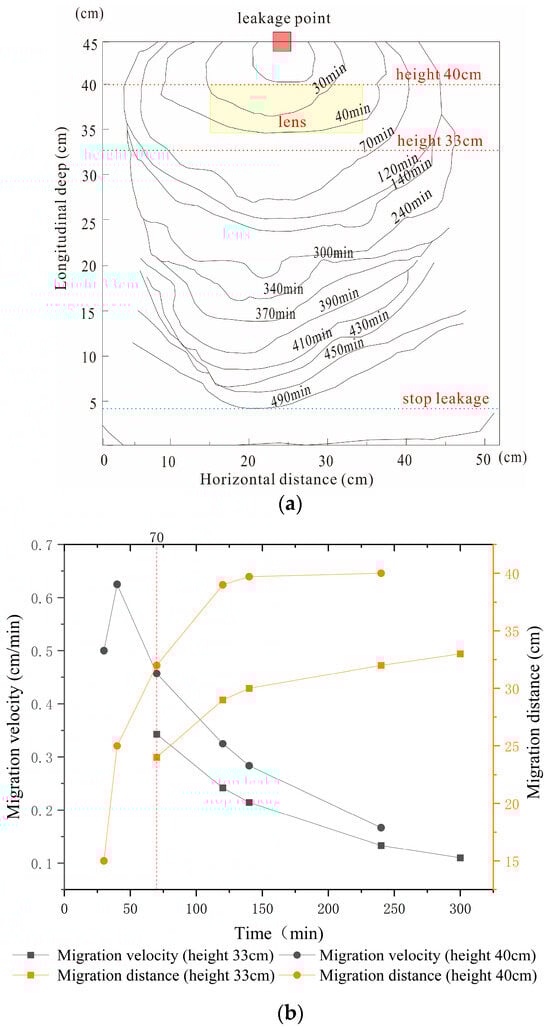
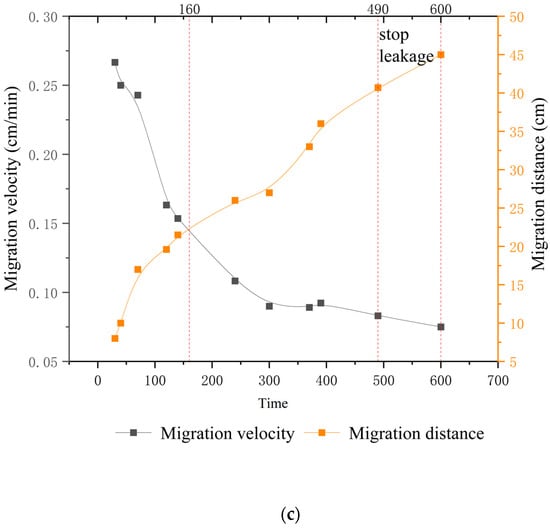
Figure 5.
Variation in the LNAPL migration velocity (high-permeability lens). (a) Migration process. (b) Lateral migration velocity at different heights. (c) Vertical migration velocity.
3.2. Relation Between Migration Distance and Lens
To analyze the effect of the lens on the distribution characteristics of the LNAPL during the leakage process, the maximum migration distances of LNAPL in the horizontal and vertical directions were compared in the absence of a lens and the presence of a weak and a high-permeability lens in the vadose zone. As shown in Figure 6, vertical migration distances were greatest with a high-permeability lens (45 cm), followed by no lens (40 cm), and least with a low-permeability lens (35 cm). Times to reach 33 cm were shortest for the high-permeability lens (70 min), followed by no lens (120 min), and longest for the low-permeability lens (320 min). For high-permeability lenses, vertical migration rates are high, peaking initially and then declining over time. Rates decreased from 0.17 cm/min to 0.142 cm/min for high-permeability lenses and from 0.12 cm/min to 0.043 cm/min for low-permeability lenses. Low-permeability lenses significantly retard the LNAPL’s downward migration, while high-permeability lenses facilitate it.
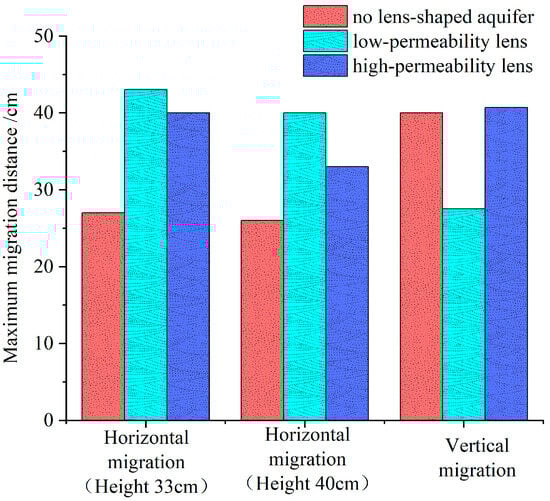
Figure 6.
Maximum migration distance for different test groups.
The LNAPL migrated furthest horizontally in low-permeability lenses (over 52 cm), followed by no lenses (44 cm), and least in high-permeability lenses (40 cm). The presence of low-permeability lenses accelerated horizontal migration but impeded vertical migration. In contrast, high-permeability lenses facilitated vertical migration at the expense of horizontal spread. Migration rates declined over time in non-lens and high-permeability lens media, while in low-permeability lenses, rates initially decreased and then increased after reaching 33 cm below the lens. This phenomenon is primarily due to the LNAPL first “bypassing the flow” in the aggregation below the lens, and then accelerating the diffusion after reaching a certain amount.
3.3. Characteristics of Resistivity Change
From Figure 7a–c, when the LNAPL leaks for 120 min, the resistivity change rate is 10–20% in the vertical direction. With the increase of leakage, the high-resistance region gradually spreads from the center point to both sides. After 2 h of leakage, the resistivity change rate near both sides of the leakage point becomes larger, indicating that the oil continued its slow horizontal migration after rapid vertical migration due to the fact that the migration of the LNAPL is subjected to the effect of the capillary force and the difference of its own density horizontally. In the vertical direction, the migration is affected by gravity, so the rate of change of resistance is mainly downward, supplemented by left–right migration. In general, under homogeneous conditions, the LNAPL migrates mainly in the vertical direction, supplemented by left–right migration, and the resistivity change rate reaches up to about 50% in the vadose zone (Figure 7). In the middle of the sand box (x = 0.5 m, y = 0.13 m), there is an area of reduced resistivity value. This phenomenon reflects the process of oil and water repulsion after the leakage of LNAPL. The water in the pore space has been displaced and migrated, resulting in the formation of an area of reduced resistivity value.
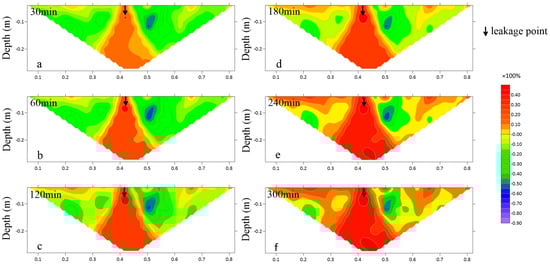
Figure 7.
Rate of change of resistance (no lens-shaped aquifer). (a) 30 min (b) 60 min (c) 120 min (d) 180 min (e) 240 min (f) 300 min.
When there is a low-permeability lens in the medium, when LNAPL reaches this lens body, the vertical migration is blocked, and the resistivity change rate is 50%. When the diesel oil leaks for 100 min, it can be observed that the horizontal diffusion rate of the LNAPL is greater than the vertical diffusion rate. At this time, the resistivity change rate of the leak point is 50%, and the high resistance is mainly concentrated in the diffusion around the leak point as the center (Figure 8). When the leakage is 200–300 min, the LNAPL further accumulates and diffuses at the location of the leakage point, and due to the existence of the low-permeability lens [34], the vertical migration of LNAPL above the low-permeability lens gradually decreases, after which there is an obvious bypass phenomenon [35]. After the LNAPL bypasses the lens, both horizontal and vertical diffusion ranges expand, with resistivity changes between 10–25%. As shown in Figure 8d,e, after 300 min of leakage, diffusion increases further, though horizontal migration remains smaller than vertical. The resistivity change rate inside the low-permeability lens tends to rise due to the slow infiltration of the LNAPL, which does not reach saturation levels because of the lens’s low permeability, maintaining the resistivity change rate at 10–25%. In contrast, the saturated state shows a resistivity change rate of around −40%. Figure 8f indicates that the resistivity change rate below the lens gradually increases, suggesting the LNAPL migrates to the lens’ bottom under capillary action post-bypass. However, the top of the lens shows a resistivity change rate of 30–50%, while the bottom has about 10%, with the top exhibiting higher resistivity than the bottom of the lens.
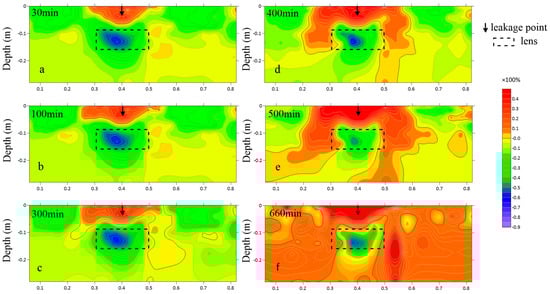
Figure 8.
Resistance rate of change (low-permeability lens). (a) 30 min (b) 100 min (c) 300 min (d) 400 min (e) 500 min (f) 660 min.
When there is a high-permeability lens in the medium, it forms a preferential channel within the lens, causing the LNAPL to migrate mainly vertically, with some horizontal migration. When leaking for 60 min, the LNAPL migrates downward through the inside of the lens to the buried depth of 0.15 m. Currently, the horizontal diffusion range also starts to increase, and the migration distance in the horizontal direction increases from 0.05 m to 0.15 m. When diesel oil leaks for 300 min, the resistivity rate of change reaches the maximum value, and the area of the resistivity growth area is obviously increased from Figure 9d,f. The width of the growth area becomes larger and gradually deepens in the vertical direction but, in general, the resistivity growth area is significantly increased from Figure 9d,f. The width of the growth area becomes larger not only in the horizontal direction, but also deepens gradually in the vertical direction. Generally, the vertical migration is larger than the horizontal migration, and the vertical change rate is 30–50%.
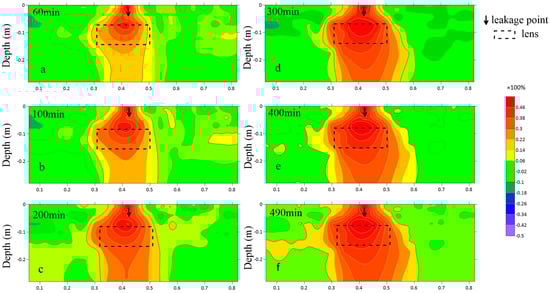
Figure 9.
Rate of change of resistance (high-permeability lens). (a) 60 min (b) 100 min (c) 200 min (d) 300 min (e) 400 min (f) 490 min.
4. Discussions
The use of ERT has been particularly effective in monitoring changes in contaminant plumes over time, as demonstrated in studies by Binley et al. [36] and Ciampi et al. [37]. These methods offer high-resolution images of subsurface structures, enabling the identification of contaminant distribution and migration pathways. In this study, we meticulously examined how lens bodies influence the migration characteristics of light non-aqueous phase liquids (LNAPLs) using two-dimensional indoor sandbox simulations coupled with high-density resistivity imaging. Our findings reveal that lens bodies notably affect LNAPL migration patterns within the vadose zone, with high-permeability lens bodies facilitating vertical LNAPL migration and low-permeability lens bodies impeding this movement, thereby enhancing horizontal spread. These insights are crucial for environmental management, offering a framework for predicting LNAPL behavior in heterogeneous subsurface environments and guiding the development of targeted remediation strategies. Notably, areas with high-permeability lens bodies may require intensified monitoring due to their potential to facilitate rapid LNAPL migration. Furthermore, our results corroborate previous studies by demonstrating that LNAPL significantly alters subsurface resistivity, consistent with its inherently high resistivity. For instance, studies by Endres et al. [38] and Grumman et al. [39] have documented changes in soil resistivity due to petroleum contamination, which is in line with our observations of resistivity changes in response to LNAPL migration.
Our study on the migration of light non-aqueous phase liquids (LNAPLs) in the vadose zone, particularly in the presence of lens-shaped bodies, contributes to the ongoing discourse on subsurface contamination and its remediation. By integrating high-density resistivity imaging with sandbox experiments, we have provided a detailed analysis that supports and expands upon previous research in the field. Ciampi et al. [38] conducted a spatial analysis of a polluted site, emphasizing the importance of joint conceptual modeling in understanding contamination dynamics. Our work aligns with their approach by providing a detailed, site-specific analysis of LNAPL migration, which is crucial for developing effective remediation strategies. The significance of hydrogeophysics in enhancing our understanding of subsurface processes, as highlighted by Binley et al., is evident in our study’s use of resistivity imaging. This non-invasive technique allows for a better characterization of subsurface contamination. Cassiani et al. [40] demonstrated the potential of geophysical signals in characterizing contaminated sites, a concept further developed in our research through the analysis of resistivity changes in response to LNAPL migration. This non-invasive approach provides valuable insights into subsurface contamination without the need for intrusive sampling methods. The review by Ossai et al. [41] on remediation of soil and water contaminated with petroleum hydrocarbons offers a comprehensive overview of available methods. Our study’s focus on the migration characteristics of LNAPLs provides fundamental data that can guide the selection and application of these remediation techniques. In discussing the implications of our findings, we must consider the broader context of environmental remediation. The work by Ciampi et al. [37] on enhanced LNAPL remediation provides a compelling case for integrating hydrogeophysical findings with chemical evidence. Our study’s results support this approach by demonstrating how the presence of lens-shaped bodies affects LNAPL migration, a factor that must be considered in any remediation effort.
Furthermore, our research underscores the importance of understanding the complex interactions between LNAPLs and subsurface structures. This understanding is vital for predicting the behavior of contaminants and designing effective remediation strategies. In conclusion, our study adds to the collective knowledge on LNAPL migration in heterogeneous subsurface environments. By integrating our findings with those from the literature, we can enhance the development of more effective monitoring and remediation strategies for LNAPL contamination.
While this research yields valuable new understandings, it is constrained by the controlled experimental setup, which may not encapsulate all field complexities. Future research should incorporate a variety of factors, such as diverse LNAPL types, varying lens-body geometries, and water table fluctuations, to more accurately simulate real-world migration dynamics. Employing numerical simulations can further validate our experimental findings and elucidate the intricate mechanisms governing LNAPL migration.
5. Conclusions
In this study, No. 0 diesel was selected as a representative pollutant for LNAPL study, and the migration rate and spatial distribution characteristics of the LNAPL in no lens-shaped aquifer, low-permeability lens, and high-permeability lens were investigated through two-dimensional sandbox tests in the laboratory by using the oil frontal curve depiction method and the high-density resistivity time-shift imaging method with the following specific results:
Low-permeability lenses in porous media can block the vertical migration of LNAPL and have a “flow-around” effect on the migration of LNAPL, hindering the downward migration of LNAPL and promoting the horizontal migration of LNAPL; while high-permeability lenses have a weak retention effect on LNAPL and have a “preferential flow paths“ effect on the migration of LNAPL, promoting the downward migration of LNAPL and weakening the horizontal migration of LNAPL.
During the LNAPL leaks, vertically, the migration distances were greatest with a high-permeability lens (45 cm), followed by no lens (40 cm), and least with a low-permeability lens (35 cm). Horizontally, when reaching the upper part of the lens, the migration distances were greatest with a low-permeability lens, then a high-permeability lens, and finally no lens.
Lens-shaped body affects the LNAPL migration rate: with the no lens-shaped aquifer, the LNAPL vertical migration rate first increases, then decreases and then increases gradually tends to be stabilized; when there is a low-permeability lens, the LNAPL vertical migration rate shows an “L”-type decreasing trend with time, with a larger decreasing amplitude; when there is a high-permeability lens, the decreasing amplitude of the LNAPL vertical migration rate is small.
In the absence of a lens-shaped aquifer and under high-permeability conditions, the positive resistivity change is symmetrical around the injection point axis, peaking near the injection point. The vertical transport distance for these contours is greater than the horizontal left–right distances, indicating predominant downward LNAPL transport due to gravity and capillary forces, with slower, symmetrical horizontal transport. The vertical transport rate significantly exceeds the horizontal, and the horizontal transport distance stabilizes after 200 min, suggesting a limit to horizontal migration distance.
Author Contributions
G.Z.: Conceptualization, formulation or evolution of overarching research goals and aims. J.C.: Data curation, Writing—Original draft preparation. M.J.: Investigation, Conducting a research and investigation process. H.Z. (Hongli Zhang): Data Curation, Management activities to annotate. H.L.: Supervision, Oversight and leadership responsibility for the research activity planning and execution. H.Z. (Hepeng Zhang): Validation, Verification. All authors have read and agreed to the published version of the manuscript.
Funding
This work was supported by the National Natural Science Foundation of China (41972261); The 15th Graduate Innovation Ability Improvement Project of North China University of Water Resources and Electric Power (NCWUYC-202315072) and the Belt and Road Special Foundation of the State Key Laboratory of Hydrology-Water Resources and Hydraulic Engineering (2021490511).
Data Availability Statement
The original contributions presented in the study are included in the article, further inquiries can be directed to the corresponding author.
Acknowledgments
Throughout the writing of this dissertation, I have received a great deal of support and assistance. I would particularly like to acknowledge my team members, Menghan Jia, Yu Liu, and Hongli Zhang for their wonderful collaboration and patient support. I would also like to thank my tutor, Guizhang Zhao, for their valuable guidance throughout my studies. You provided me with the tools that I needed to choose the right direction and successfully complete my dissertation.
Conflicts of Interest
The authors declare no conflict of interest.
References
- Cavelan, A.; Faure, P.; Lorgeoux, C.; Colombano, S.; Deparis, J.; Davarzani, D.; Enjelvin, N.; Oltean, C.; Tinet, A.-J.; Domptail, F.; et al. An experimental multi-method approach to better characterize the LNAPL fate in soil under fluctuating groundwater levels. J. Contam. Hydrol. 2024, 262, 104319. [Google Scholar] [CrossRef] [PubMed]
- Nambi, M.I.; Powers, E.S. NAPL dissolution in heterogeneous systems: An experimental investigation in a simple heterogeneous system. J. Contam. Hydrol. 2000, 44, 161–184. [Google Scholar] [CrossRef]
- Zheng, D.F.; Zhao, Y.S.; Wang, B.D. Study on the migration characteristics and simulation prediction of light non-aqueous phase liquids in the subsurface environment. Adv. Water Sci. 2002, 3, 321–325. [Google Scholar]
- Pan, Y.Y. Research on the Control Factors and Monitoring Techniques of NAPLs Underground Migration. Doctoral Dissertation, Ocean University of China, Qingdao, China, 2014. [Google Scholar]
- Ren, X. Study on the Migration Law of LNAPLs in the Vadose Zone Layered Heterogeneous Interface. Master’s Dissertation, Jilin University, Changchun, China, 2019. [Google Scholar]
- Luo, L.Y. Research on the Lens Shape of LNAPL Formed in the Vadose Zone and the Influence of Water Level Fluctuations on It. Master’s Dissertation, Jilin University, Changchun, China, 2017. [Google Scholar]
- Li, Y.T. Study on the Migration Mechanism and Simulation of LNAPLs in the Vadose Zone. Doctoral Dissertation, Chang’an University, Xi’an, China, 2010. [Google Scholar]
- Zhu, Z.H.; Gao, Z.J.; Zhang, X.H.; Chen, Y.; Han, K. Vertical migration of light non-aqueous phase fluid (diesel) in porous media. Chin. J. Environ. Eng. 2015, 9, 1842–1848. [Google Scholar]
- Wu, X.F.; Tang, J.; Fujima, Y. Experimental study on the saturation of oil-water two-phase flow in the groundwater saturated zone. J. Hydraul. Eng. 2000, 10, 12–15. [Google Scholar]
- Zuo, R.; Xue, Z.; Zhai, Y.; Yang, J.; Li, J.; Han, K.; Gao, X.; Wang, J.; Teng, Y. Construction, application and validation of a new algorithm for determining light nonaqueous-phase liquid fluxes in unsaturated zones. J. Environ. Manag. 2022, 321, 115934. [Google Scholar] [CrossRef]
- Liu, H.L.; Zhou, Q.Y.; Xu, S. Experimental study on the migration and distribution characteristics of LNAPL under heterogeneous conditions in the unsaturated zone. Hydrogeol. Eng. Geol. 2006, 5, 52–57. [Google Scholar]
- Abdul, A.S. Migration of petroleum products through sandy hydrogeologic systems. Groundw. Monit. Remediat. 1988, 8, 73. [Google Scholar] [CrossRef]
- Pantazidou, M.; Sitar, N. Emplacement of nonaqueous liquids in the vadose zone. Water Resour. Res. 1993, 29, 705–722. [Google Scholar] [CrossRef]
- Wipfler, E.L.; Ness, M.; Breedveld, G.D.; Marsman, A.; Van Der Zee, S.E. Infiltration and redistribution of LNAPL into unsaturated layered porous media. J. Contam. Hydrol. 2004, 71, 47–66. [Google Scholar] [CrossRef]
- Govindarajan, D.; Banerjee, A.; Chandrakumar, N.; Raghunathan, R. Magnetic resonance imaging of enhanced mobility of light non-aqueous phase liquid (LNAPL) during drying of water-wet porous media. J. Contam. Hydrol. 2020, 234, 103683. [Google Scholar] [CrossRef] [PubMed]
- Teramoto, H.E.; Isler, E.; Polese, L.; Baessa, M.P.; Chang, H.K. LNAPL saturation derived from laser-induced fluorescence method. Sci. Total Environ. 2019, 683, 762–772. [Google Scholar] [CrossRef] [PubMed]
- Liu, T.F.; Nie, Y.X.; Hu, L.M.; Zhou, Q.Y.; Wen, Q.B. Experimental study on water migration model based on high-density electrical resistivity method. Chin. J. Geotech. Eng. 2016, 38, 761–768. [Google Scholar]
- Iravani, M.A.; Deparis, J.; Davarzani, H.; Colombano, S.; Guérin, R.; Maineult, A. Complex electrical resistivity and dielectric permittivity responses to dense non-aqueous phase liquids’ imbibition and drainage in porous media: A laboratory study. J. Environ. Eng. Geophys. 2020, 25, 557–567. [Google Scholar] [CrossRef]
- Cardiff, M.; Zhou, Y.Q.; Barrash, W.; Kitanidis, P.K. Aquifer imaging with oscillatory hydraulic tomography: Application at the field scale. Groundwater 2020, 58, 710–722. [Google Scholar] [CrossRef]
- Xia, T.; Dong, Y.; Mao, D.; Meng, J. Delineation of LNAPL contaminant plumes at a former perfumery plant using electrical resistivity tomography. Hydrogeol. J. 2021, 29, 1189–1201. [Google Scholar] [CrossRef]
- Delaney, J.A.; Peapples, R.P.; Arcone, A.S. Electrical resistivity of frozen and petroleum-contaminated fine-grained soil. Cold Reg. Sci. Technol. 2001, 32, 107–119. [Google Scholar] [CrossRef]
- Philippe, S.; Antonio, M.; Bernd, K. Diesel transport monitoring in simulated unconfined aquifers using miniature resistivity arrays. Environ. Earth Sci. 2010, 61, 107–114. [Google Scholar]
- Pan, Y.; Jia, Y.; Wang, Y.; Xia, X.; Guo, L. Study on diesel vertical migration characteristics and mechanism in water-bearing sand stratum using an automated resistivity monitoring system. Environ. Sci. Pollut. Res. Int. 2018, 25, 3802–3812. [Google Scholar] [CrossRef]
- Liu, H.L.; Zhang, S. Monitoring of LNAPL contamination process in heterogeneous porous media using high-density electrical resistivity imaging method. Prog. Geophys. 2014, 29, 2401–2406. [Google Scholar]
- Halihan, T.; Sefa, V.; Sale, T.; Lyverse, M. Mechanism for detecting NAPL using electrical resistivity imaging. J. Contam. Hydrol. 2017, 205, 57–69. [Google Scholar] [CrossRef] [PubMed]
- Meng, J.; Dong, Y.; Xia, T.; Ma, X.; Gao, C.; Mao, D. Detailed LNAPL plume mapping using electrical resistivity tomography inside an industrial building. Acta Geophys. 2022, 70, 1651–1663. [Google Scholar] [CrossRef]
- Orlando, L.; Renzi, B. Electrical permittivity and resistivity time lapses of multiphase DNAPLs in a lab test. Water Resour. Res. 2015, 51, 377–389. [Google Scholar] [CrossRef]
- Ciampi, P.; Esposito, C.; Cassiani, G.; Deidda, G.P.; Flores-Orozco, A.; Rizzetto, P.; Chiappa, A.; Bernabei, M.; Gardon, A.; Papini, M.P. Contamination presence and dynamics at a polluted site: Spatial analysis of integrated data and joint conceptual modeling approach. J. Contam. Hydrol. 2022, 248, 104026. [Google Scholar] [CrossRef]
- Mineo, S. Groundwater and soil contamination by LNAPL: State of the art and future challenges. Sci. Total Environ. 2023, 874, 162394. [Google Scholar] [CrossRef]
- Power, C.; Gerhard, J.I.; Tsourlos, P.; Soupios, P.; Simyrdanis, K.; Karaoulis, M. Improved time-lapse electrical resistivity tomography monitoring of dense non-aqueous phase liquids with surface-to-horizontal borehole arrays. J. Appl. Geophys. 2015, 112, 1–13. [Google Scholar] [CrossRef]
- Boyd, J.; Blanchy, G.; Saneiyan, S.; McLachlan, P.; Binley, A. 3D geoelectrical problems with ResiPy, an open-source graphical user interface for geoelectrical data processing. Fast Times 2019, 24, 85–92. [Google Scholar]
- Ha, J.; Seagren, A.E.; Song, X. Oxygen transport across the capillary fringe in LNAPL pool-source zones. J. Environ. Eng. 2014, 140, 040140. [Google Scholar] [CrossRef]
- Praseeja, A.V.; Sajikumar, N. Numerical simulation on LNAPL migration in vadose zone and its prevention using natural fibre. Exp. Comput. Multiph. Flow 2023, 5, 53–66. [Google Scholar] [CrossRef]
- Kechavarzi, C.; Soga, K.; Wiart, P. Multispectral image analysis method to determine dynamic fluid saturation distribution in two-dimensional three-fluid phase flow laboratory experiments. J. Contam. Hydrol. 2000, 46, 265–293. [Google Scholar] [CrossRef]
- Pan, Y.; Zhang, Q.; Yu, Y.; Tong, Y.; Yang, J. Three-dimensional migration and resistivity characteristics of crude oil in heterogeneous soil layers. Environ. Pollut. 2020, 268, 115309. [Google Scholar] [CrossRef] [PubMed]
- Binley, A.; Hubbard, S.S.; Huisman, J.A.; Revil, A.; Robinson, D.A.; Singha, K.; Slater, L.D. The emergence of hydrogeophysics for improved understanding of subsurface processes over multiple scales. Water Resour. Res. 2015, 6, 3837–3866. [Google Scholar] [CrossRef] [PubMed]
- Ciampi, P.; Cassiani, G.; Deidda, G.P.; Esposito, C.; Rizzetto, P.; Pizzi, A.; Petrangeli Papini, M. Understanding the dynamics of enhanced light non-aqueous phase liquids (LNAPL) remediation at a polluted site: Insights from hydrogeophysical findings and chemical evidence. Sci. Total Environ. 2024, 932, 172934. [Google Scholar] [CrossRef] [PubMed]
- Endres, A.L.; Greenhouse, J.P. Detection and Monitoring of Chlorinated Solvent Contamination by Thermal Neutron Logging. Ground Water 2010, 34, 283–292. [Google Scholar] [CrossRef]
- Grumman, D.L.; Daniels, J.J. Experiments on the Detection of Organic Contaminants in the Vadose Zone. J. Environ. Eng. Geophys. 2008, 1, 31–38. [Google Scholar] [CrossRef]
- Cassiani, G.; Binley, A.; Kemna, A.; Wehrer, M.; Orozco, A.F.; Deiana, R.; Boaga, J.; Rossi, M.; Dietrich, P.; Werban, U.; et al. Noninvasive characterization of the Trecate (Italy) crude-oil contaminated site: Links between contamination and geophysical signals. Environ. Sci. Pollut. Res. Int. 2014, 15, 8914–8931. [Google Scholar] [CrossRef]
- Ossai, I.C.; Ahmed, A.; Hassan, A.; Shahul Hamid, F. Remediation of soil and water contaminated with petroleum hydrocarbon: A review. Environ. Technol. Innov. 2020, 17, 100526. [Google Scholar] [CrossRef]
Disclaimer/Publisher’s Note: The statements, opinions and data contained in all publications are solely those of the individual author(s) and contributor(s) and not of MDPI and/or the editor(s). MDPI and/or the editor(s) disclaim responsibility for any injury to people or property resulting from any ideas, methods, instructions or products referred to in the content. |
© 2024 by the authors. Licensee MDPI, Basel, Switzerland. This article is an open access article distributed under the terms and conditions of the Creative Commons Attribution (CC BY) license (https://creativecommons.org/licenses/by/4.0/).