Article

External Validation of Accelerometry-Based Mechanical Loading Prediction Equations

by
Lucas Veras
1,2,
Daniela Oliveira
1,2,
Florêncio Diniz-Sousa
1,2,
Giorjines Boppre
1,2,
Ana Resende-Coelho
1,2,
José Oliveira
1,2 and
Hélder Fonseca
1,2,*
1
Research Center in Physical Activity, Health and Leisure (CIAFEL), Faculty of Sport, University of Porto, 4200-450 Porto, Portugal
2
Laboratory for Integrative and Translational Research in Population Health (ITR), University of Porto, 4200-450 Porto, Portugal
*
Author to whom correspondence should be addressed.
Appl. Sci. 2024, 14(22), 10292; https://doi.org/10.3390/app142210292
Submission received: 26 September 2024 / Revised: 19 October 2024 / Accepted: 7 November 2024 / Published: 8 November 2024
(This article belongs to the Section Mechanical Engineering)

Abstract

:
Accurately predicting physical activity-associated mechanical loading is crucial for developing and monitoring exercise interventions that improve bone health. While accelerometer-based prediction equations offer a promising solution, their external validity across different populations and activity contexts remains unclear. This study aimed to validate existing mechanical loading prediction equations by applying them to a sample and testing conditions distinct from the original validation studies. A convenience sample of 49 adults performed walking, running, and jumping activities on a force plate while wearing accelerometers at their hip, lower back, and ankle. Peak ground reaction force (pGRF) and peak loading rate (pLR) predictions were assessed for accuracy. Substantial variability in prediction accuracy was found, with pLR showing the highest errors. These findings highlight the need to improve prediction models to account for individual biomechanical differences, sensor placement, and high-impact activities. Such refinements are essential for ensuring the models’ reliability in real-world applications, particularly in clinical and biomechanical research contexts, where accurate assessments of mechanical loading are critical for designing rehabilitation programs, injury prevention strategies, and optimizing bone health interventions.

1. Introduction

Physical activity and exercise are among the main factors that induce mechanical loading on bones, which is essential for maintaining and enhancing bone health [1,2]. Engaging in regular weight-bearing activities, such as vigorous walking, running, and jumping [2,3], stimulates bone formation, increases bone mass, and improves bone geometry and microarchitecture [4,5], thereby reducing the risk of osteoporosis and bone fractures [1,6]. These beneficial adaptations occur due mostly to the mechanical forces exerted on bone tissue during physical activity, which are detected by osteocytes and osteoblasts [7] that trigger adaptive signaling responses [8], stimulating bone remodeling and, ultimately, contributing to strengthening bone structure. Accurately measuring these forces is essential for developing effective and safe exercise interventions to enhance bone health and prevent bone loss-related disorders such as osteopenia and osteoporosis [1,2,3,9], but has been a major challenge to address [10].
Traditionally, mechanical loading has been measured using laboratory-based methods such as force plates, which are considered the gold standard [11]. While these methods provide precise and accurate measurements of ground reaction forces, they are limited by their high cost, the need for specialized equipment and expertise, and their restriction to controlled laboratory environments. More recently, questionnaires have been introduced to estimate mechanical loading [12], but they are subject to recall bias and cannot provide objective data on the intensity and frequency of physical activities [13,14,15]. Accelerometer-based prediction equations have emerged as a promising alternative to address these limitations [16,17,18,19,20,21], offering the advantages of portability, lower cost, and the ability to collect data in free-living conditions [22,23].
Accelerometer-based equations have been developed to predict mechanical loading variables such as peak ground reaction forces (pGRF) and peak loading rate (pLR) from acceleration data [16,17,18,19,20,21]. These equations have shown potential in various populations and activities, but they are often validated only within the specific contexts of their original studies. Importantly, factors such as sample characteristics, activity type, and testing conditions can exert a major influence on the performance of these models [24]. Individual variability in characteristics such as age [25], gender [25], and BMI [26] can significantly impact the accuracy of these predictions, as these factors influence biomechanical aspects (e.g., gait patterns, center of mass, balance) that can change how the load is borne by the body. Therefore, it is crucial to evaluate the external validation of accelerometer-based equations by testing them on different populations and in diverse activity contexts. Doing so not only uncovers their limitations but also assesses their reliability in real-world scenarios, guiding their refinement and ensuring their effective application in clinical settings to improve bone health interventions. This study aims to validate mechanical loading prediction equations by testing their prediction accuracy against a different sample and testing conditions than those used in the original validation studies, in order to assess their external validation. We tested all previously published equations that could be applied to our data, specifically those using raw accelerometer data from the right hip, lower back, or right ankle, and designed to predict mechanical loading during walking, running, and/or jumping.

2. Materials and Methods

2.1. Participants

A sample of 49 adults, recruited by convenience, participated in this study (26 males; 29.6 ± 9.6 years; 169.1 ± 8.7 cm; 69.6 ± 11.3 kg; 24.3 ± 3.0 kg·m−2; X ¯ ± SD). Participant recruitment was carried out by means of a University of Porto academic community mailing list with information about the study’s objectives, testing protocol, and inclusion and exclusion criteria. Height and body mass were assessed using a stadiometer (model 213; Seca, Hamburg, Germany) and a digital scale (model 899; Seca, Hamburg, Germany), respectively. Inclusion criteria included age between 18 and 65 years and being capable of performing the activities involved in the trials, which included walking, running, and several types of jumping. Exclusion criterion included the presence of any injury or condition that could preclude participation in the experimental exercises, such as musculoskeletal disorders and cardiovascular diseases. All participants were informed about the purpose of the study and activities protocol before giving written informed consent. The study protocol was approved by the local Ethics Committee (CEFADE 15-21).

2.2. Protocol

Data collection was conducted at the Porto Laboratory of Biomechanics (LABIOMEP-UP). Ground reaction force data were collected using five force plates embedded in the floor: three FP4060 (Bertec, Columbus, OH, USA) and two FP6090 (Bertec, Columbus, OH, USA).
During data collection, participants wore three activity monitors (GT9X Link: 100 Hz, ±16 g range; ActiGraph, Pensacola, FL, USA): one placed at the right hip (along the anterior axillary line at the level of the iliac crest), one at the lower back (at the midpoint between the two posterior superior iliac spines), and one at the right ankle (immediately superior to the lateral malleolus). Accelerometer placements at the waist line (right hip and lower back) were selected for their proximity to the body’s center of mass, providing a representative measure of overall movement. Right hip placement was chosen due to its widespread use in research involving physical activity measurement with accelerometers. The placement at the right ankle was selected due to its closeness to the ground contact point, allowing it to capture impact forces during the activities. Hip and lower back accelerometers were securely fastened with clips on an elastic belt, while the ankle accelerometer was held in place with adhesive tape and an elastic belt. The researchers positioned the accelerometers in order to ensure their correct positioning and orientation.
The protocol included data collection during walking, running, and jumping activities. For walking and running, a 10 m path was marked on the laboratory floor, including the force plates in its center. Participants performed normal, slow, and fast walking, followed by slow and fast running, always with a self-selected speed. Three valid attempts were collected for each condition, with a 30 s rest between the walking trials and 1 min between the running trials. Attempts were considered valid if the participant’s foot landed entirely on at least one force plate, without stepping on its borders. Participants were not informed about the force plate placement, nor of the necessity to completely step on them during each trial, to avoid altering their natural movement patterns during walking and running.
Participants also completed a series of jumping trials, starting with two types of jumps using a 30 cm high box: (i) drop jumps (from the box to the floor) and (ii) box jumps (from the floor to the box). Then, they performed countermovement jumps with and without arm movements (hands on hips for the latter), horizontal forward jumps (from the floor to the platform and vice versa), side hops (multiple lateral jumps between two force plates, with either both legs together or landing with one foot on each platform), and continuous jumps (starting from a standing position with feet hip-width apart, at two heights: approximately 5 cm for 10–15 repetitions and approximately 15 cm for 5 repetitions). Three valid trials were recorded for drop, box, countermovement, and horizontal forward jumps, while multiple jumps were tested for side hops and continuous jumps. A 1 min rest interval was applied between the jumping trials.
Activity monitors incorporated built-in primary and secondary triaxial accelerometers, with the primary having a dynamic range of ±8 g and a proprietary filter and the secondary having a dynamic range of ±16 g with unfiltered data. To avoid filtering bias and increase accuracy and replicability, only data from the secondary accelerometer were used. Data from force plates (Qualysis Track Manager, version QTM 2021.1; Qualysis AB, Gothenburg, Sweden) and accelerometers (ActiLife, version 6.13.3; Actigraph, Pensacola, USA) were processed with the manufacturer’s software and exported as raw x, y, and z vector data. Ground reaction forces were reported in Newtons (N), and acceleration in units of gravitational acceleration (1 g = 9.807 m·s−2).

2.3. Data Processing

Force plate and accelerometer data were processed using MATLAB (version 2022a; MathWorks, Natick, MA, USA). Due to differing sampling frequencies (1000 Hz for the force plates and 100 Hz for the activity monitor), resampling was necessary. To attenuate noise, data were filtered using a Butterworth fourth-order low-pass filter with a 20 Hz cut-off frequency, determined through Fast Fourier Transform (FFT) and visual examination of the signal’s frequency spectrum. The resultant vectors for ground reaction force and acceleration ( r i = x i 2 + y i 2 + z i 2 ) were calculated. Afterwards, both ground reaction force and acceleration signals were adjusted by their timestamp and synchronized through the maximum cross-correlation coefficient. Then, the signals were visually inspected for confirmation, and the synchronization was manually adjusted, if necessary.
Walking and running peak acceleration were identified based on two criteria: They had to exceed the average acceleration measured in the trial by at least 1 standard deviation (SD), with a minimum gap of 0.2 s between peaks. For drop, box, countermovement, and horizontal forward jumps, peak acceleration was determined as a minimum height of 2 SD above the mean acceleration and a separation of at least 0.4 s. Finally, for the side hops and continuous jumps, peak acceleration was identified by a minimum height of 2 SD above the mean acceleration and by a separation of at least 0.3 s. The peak ground reaction force was defined as the highest ground reaction force value within 0.1 s before and after each peak acceleration.
Rates of change were computed using a centered derivative, and peak loading rate and peak acceleration rate were defined as the maximum values in the array. For each movement type and accelerometer placement, mean values of peak ground reaction force, peak acceleration, peak loading rate, and peak acceleration rate for the resultant vector and its vertical component were obtained and used in all following analyses.

2.4. Statistical Analyses

The statistical analyses were performed using the R software (version 4.3.2; R Foundation for Statistical Computing, Vienna, Austria). The models selected to be tested in this study were as follows: Veras et al., 2022 [20] and Neugebauer et al., 2014 [17] for walking and running, and Veras et al., 2023 [21] for jumping. We predicted all mechanical loading variables from these studies, using the reported model coefficients, on our data. For the studies from Veras et al., 2022 [20] and Veras et al., 2023 [20], pGRF and pLR were predicted using the resultant vector and the vertical component on hip, lower back, and ankle accelerometers. For the study from Neugebauer et al., 2014 [17], only vertical pGRF using the hip accelerometer was predicted, as it was the only equation from their study that could be used with our data. The study from Veras et al., 2022 [20] included walking and running on a force plate-instrumented treadmill, at 13 speeds, ranging from 2 to 14 km·h−1 (with 1 km·h−1 increments). Neugebauer et al., 2014 [17] tested walking and running on a 15 m straight path that included a force plate, with between 8 and 10 walking and 8 and 10 running self-selected speeds. Veras et al., 2023 [21] tested several heights of drop jumps, box jumps, and continuous jumps.
Accuracy indices, including mean absolute error (MAE), mean absolute percent error (MAPE), and root mean square error (RMSE), were computed. Bland–Altman plots were used to visually analyze agreement between predicted and measured values, with bias and limits of agreement calculated and plotted.

3. Results

Table 1 shows the characteristics of the participants from the studies by Veras et al., 2022 [20], Neugebauer et al., 2014 [17], and Veras et al., 2023 [21]. The studies by Veras et al., 2022 [20] and Veras et al., 2023 [21] involved a larger and older population compared to the study by Neugebauer et al., 2014 [17], which had a younger sample with a lower average body mass index. The diversity in sample characteristics across these studies shows the variability in the populations used to validate mechanical loading prediction equations.

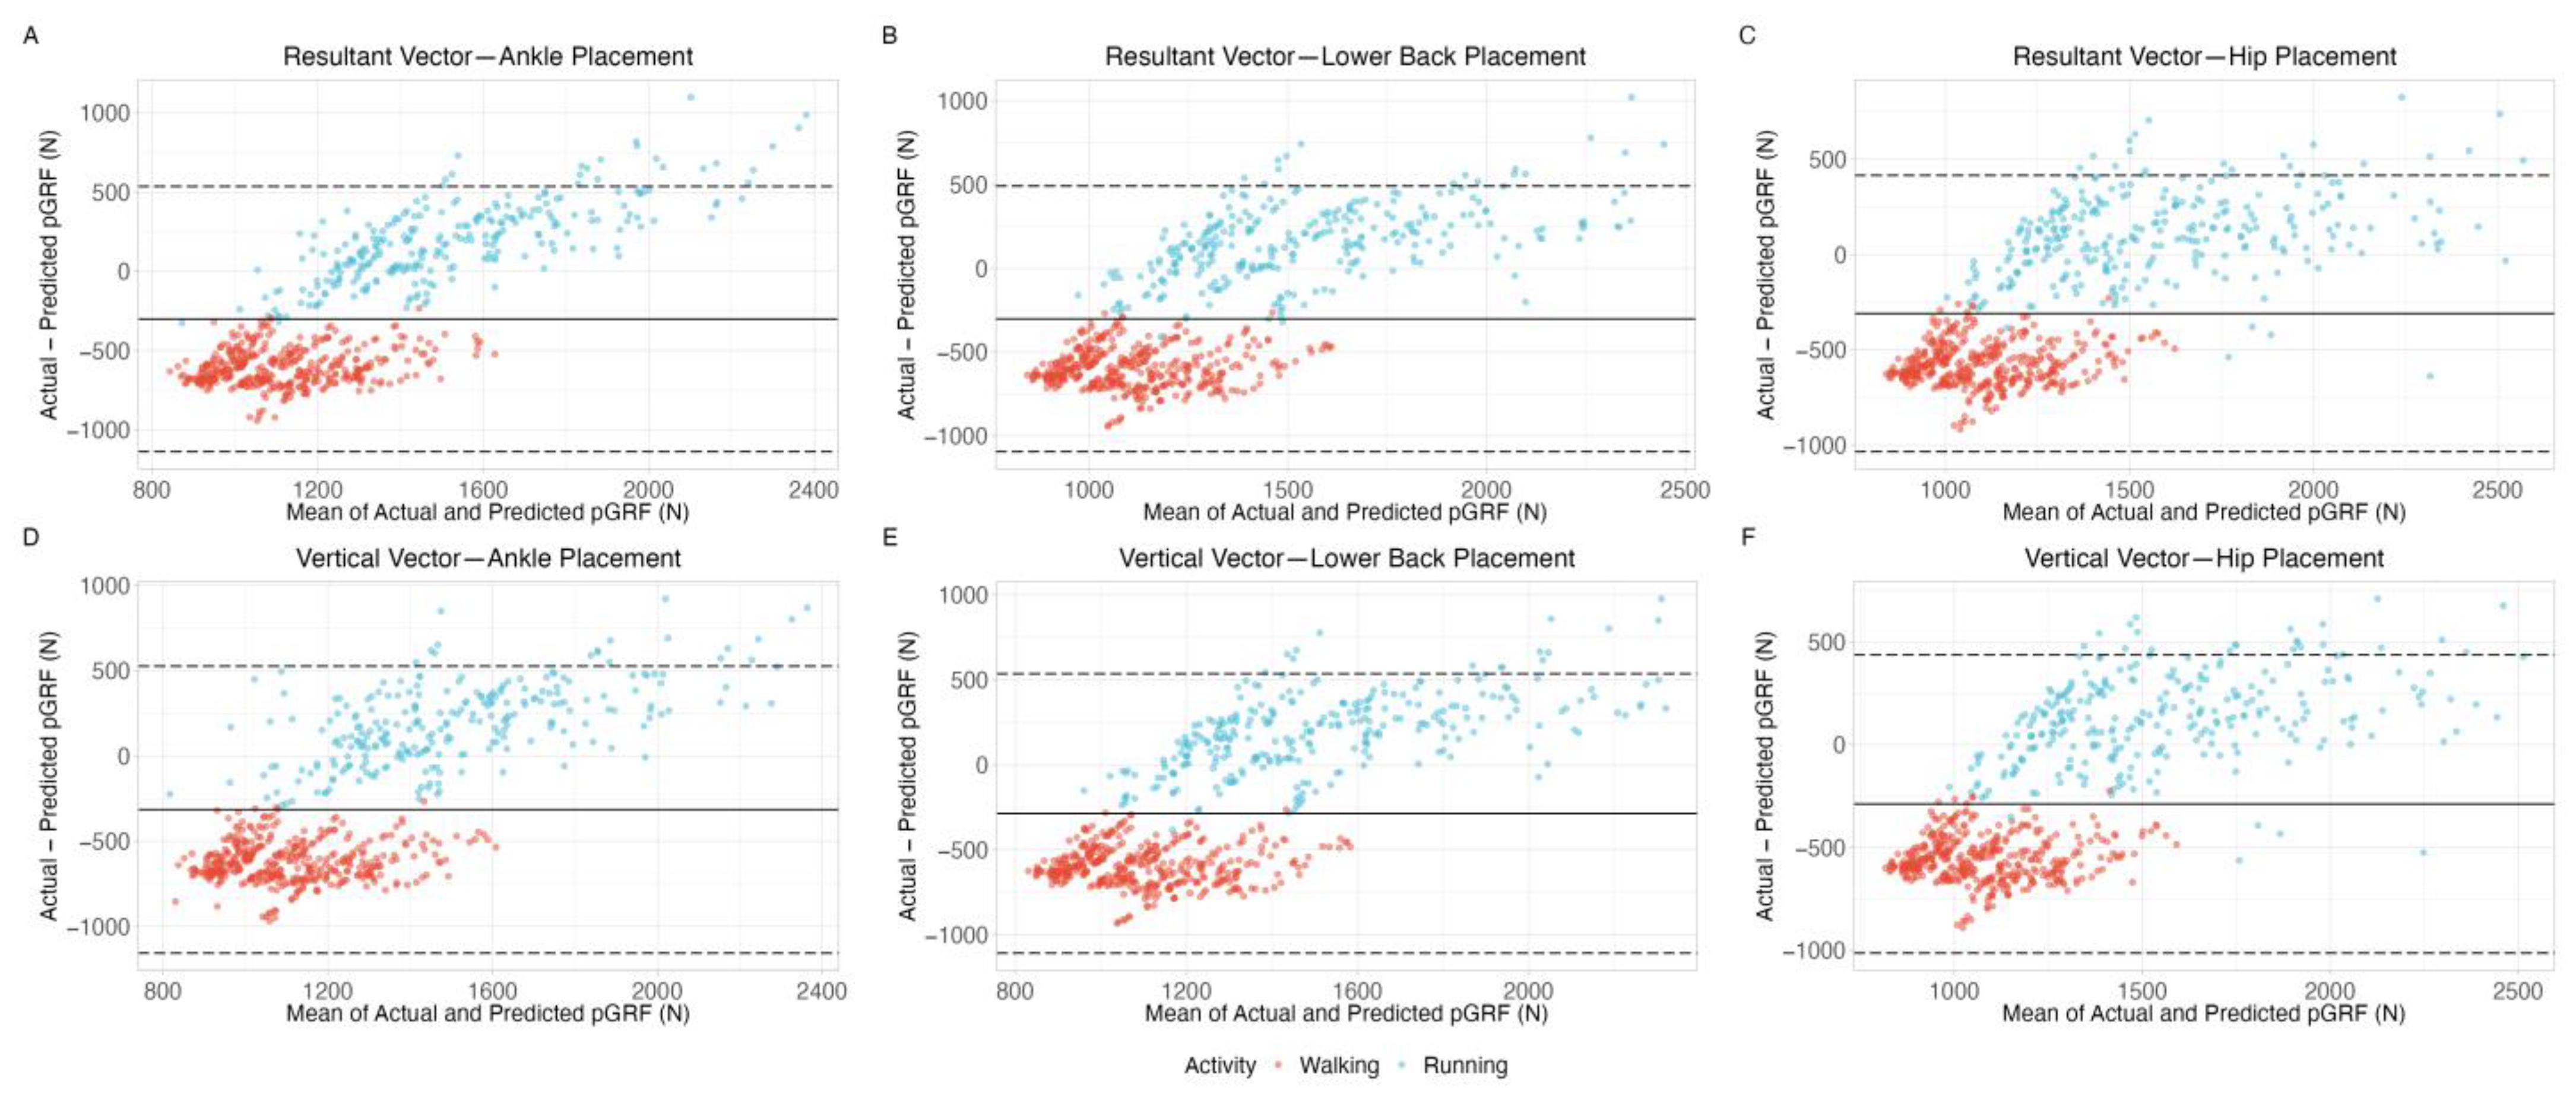
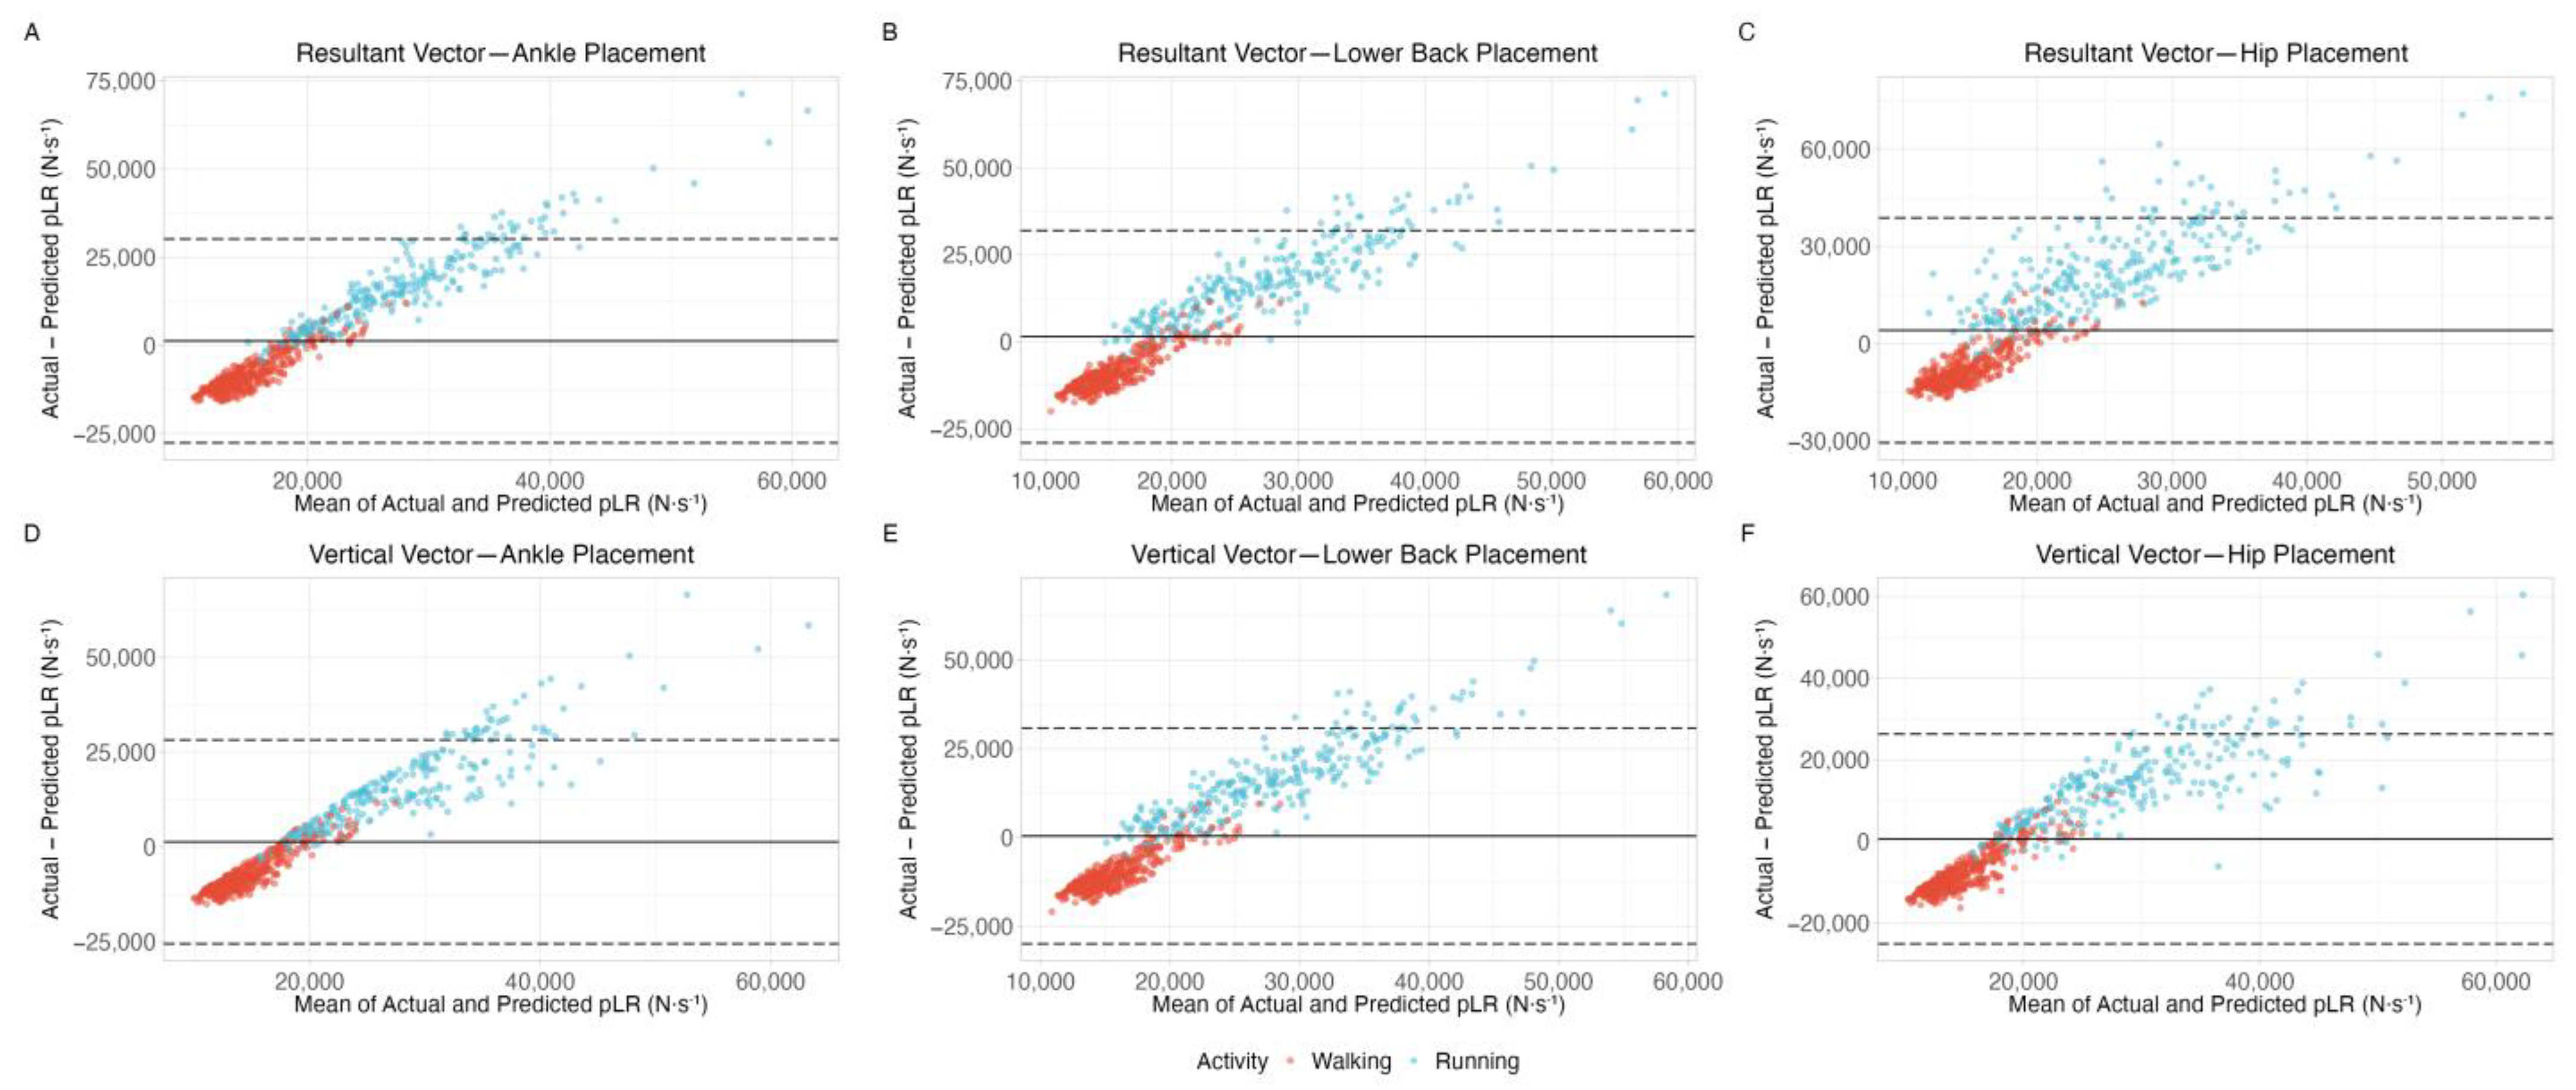
3.1. Accuracy of pGRF and pLR Predictions for Walking and Running Using the Veras et al., 2022 [20] Equations

The accuracy of mechanical loading predictions for walking and running using the Veras et al., 2022 [20] equations is summarized in Table 2. The pGRF prediction for walking showed MAE ranging from 557.0 N to 621.7 N across different accelerometer placements, with MAPE values between 74.1% and 83.3%, which can be considered as very large prediction errors. The RMSE values ranged from 567.2 N to 632.5 N, indicating substantial discrepancies between predicted and actual values. For running, the pGRF prediction demonstrated improved accuracy, with MAE values ranging from 189.9 N to 247.5 N, MAPE between 11.6% and 14.4%, and RMSE from 240.9 N to 314.8 N. The pLR predictions for walking had high MAE values, ranging from 8042.0 N·s−1 to 10,328.2 N·s−1 and MAPE between 106.5% and 147.6%. In contrast, running pLR predictions showed MAE values from 14,198.7 N·s−1 to 22,334.3 N·s−1, MAPE between 35.2% and 56.6%, and RMSE from 17 408.8 N·s−1 to 26,363.9 N·s−1. With these results, particularly MAPE values over 100%, the pLR prediction can be regarded as unacceptable. Supplemental Table S1 describes the pGRF and pLR prediction errors for each separate walking and running speed using the Veras et al., 2022 [20] equation.

3.2. Accuracy of pGRF Predictions for Walking and Running Using the Neugebauer et al., 2014 [17] Equation

The results for walking and running pGRF predictions using the Neugebauer et al., 2014 [17] equation are presented in Table 3. For walking, the pGRF prediction using hip accelerometers had an MAE of 75.0 N, MAPE of 9.7%, and RMSE of 104.9 N. Running predictions showed higher errors, with an MAE of 168.7 N, MAPE of 11.1%, and RMSE of 213.5 N. Compared to Veras et al., 2022 [20], the Neugebauer et al., 2014 [17] equation generally showed a much better accuracy for walking but comparable errors for running. The pGRF prediction errors for each walking and running speed using the Neugebauer 2014 [17] equation are shown in Supplemental Table S2.

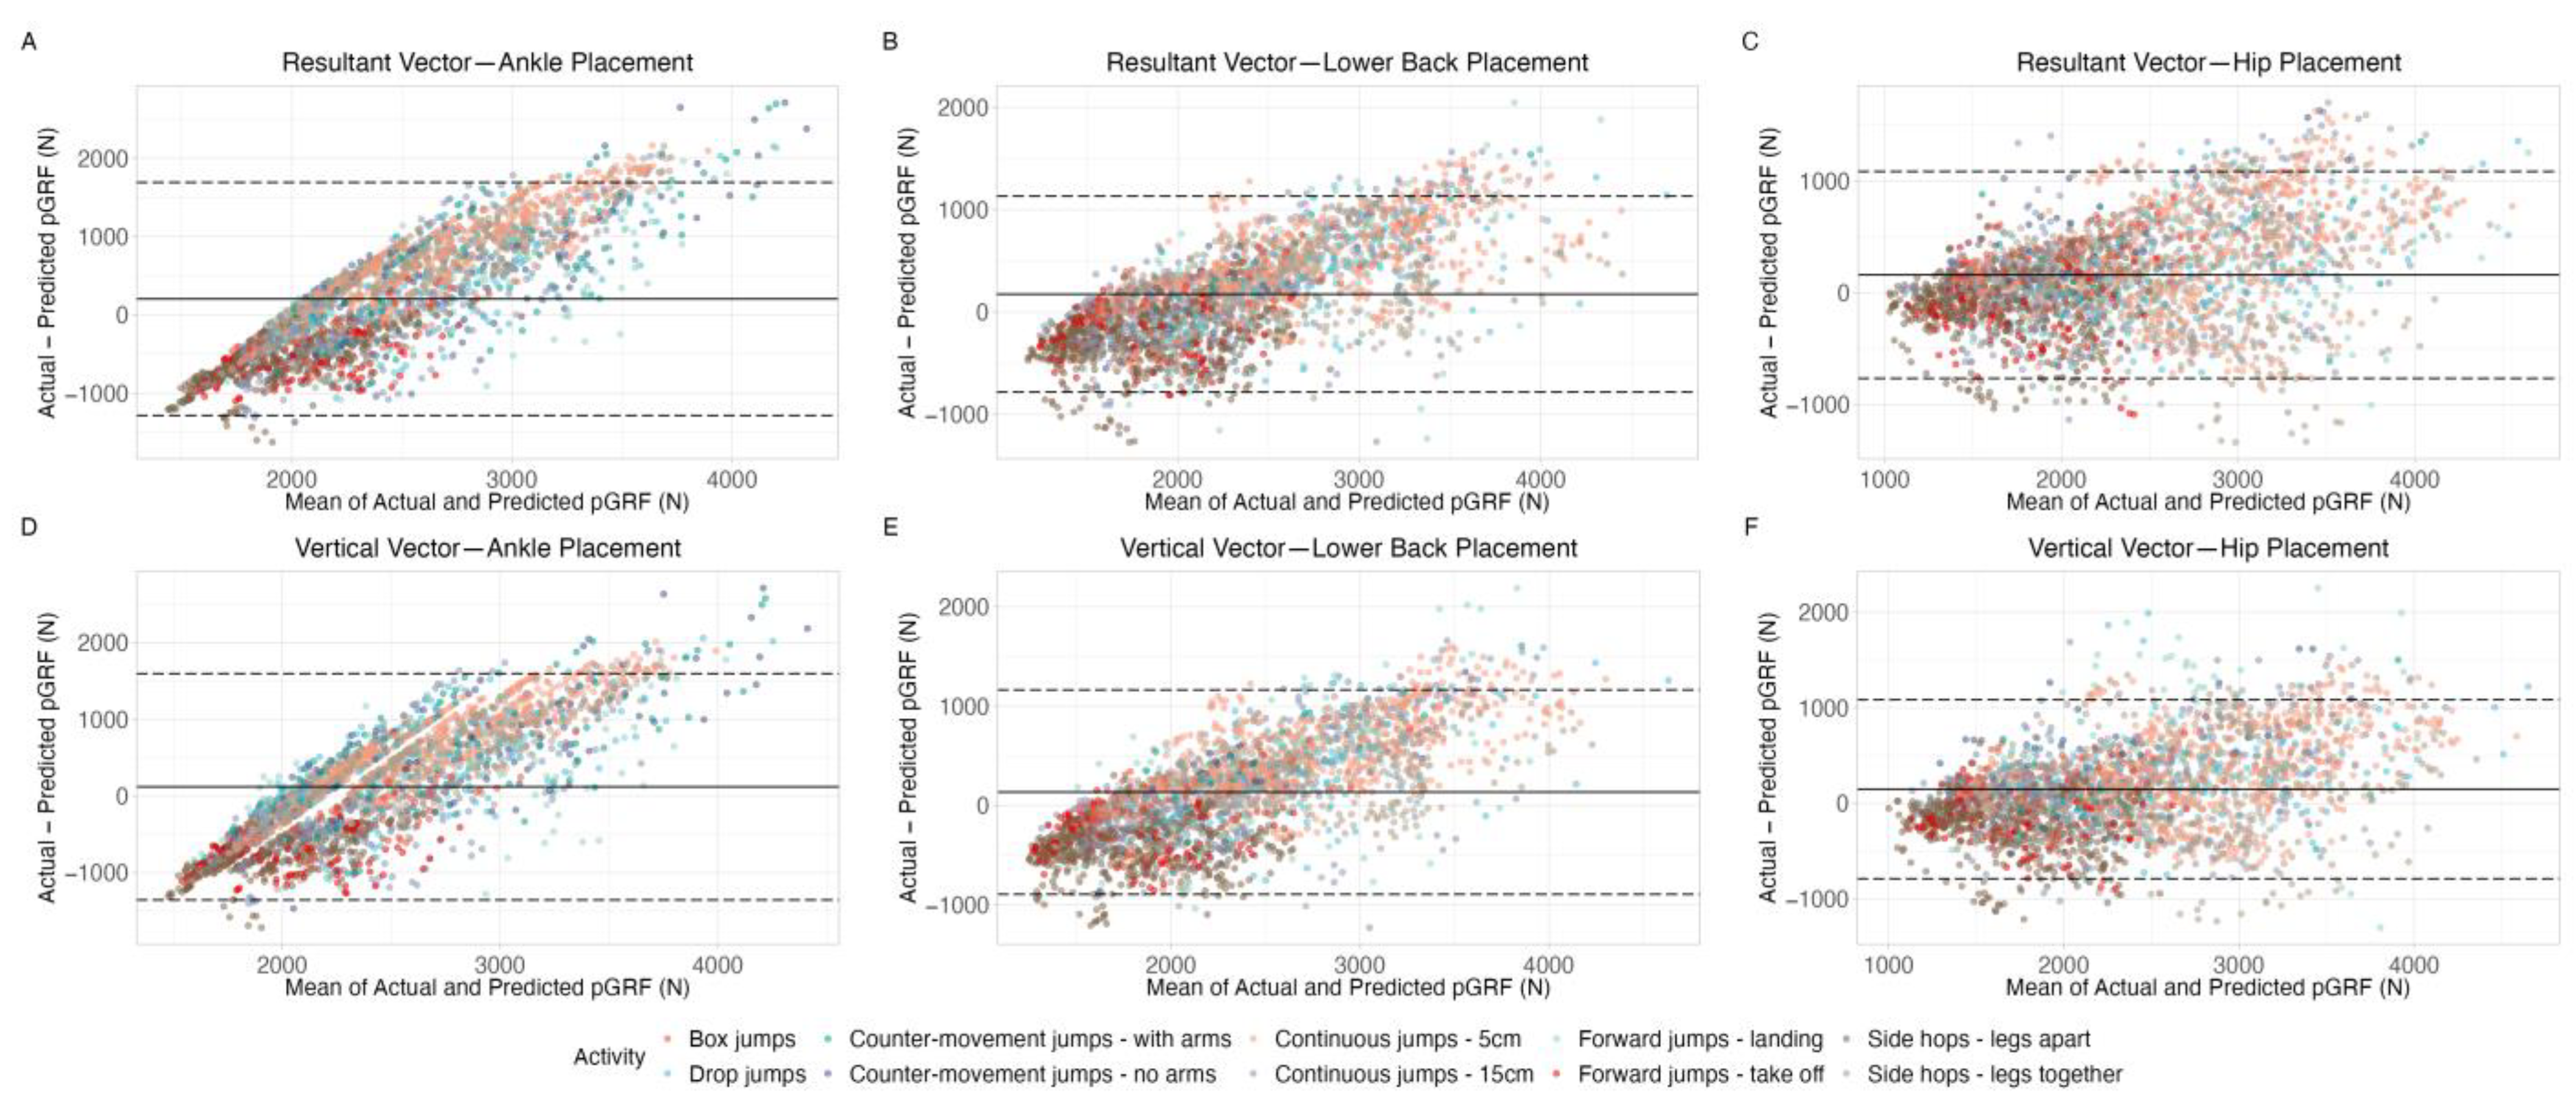
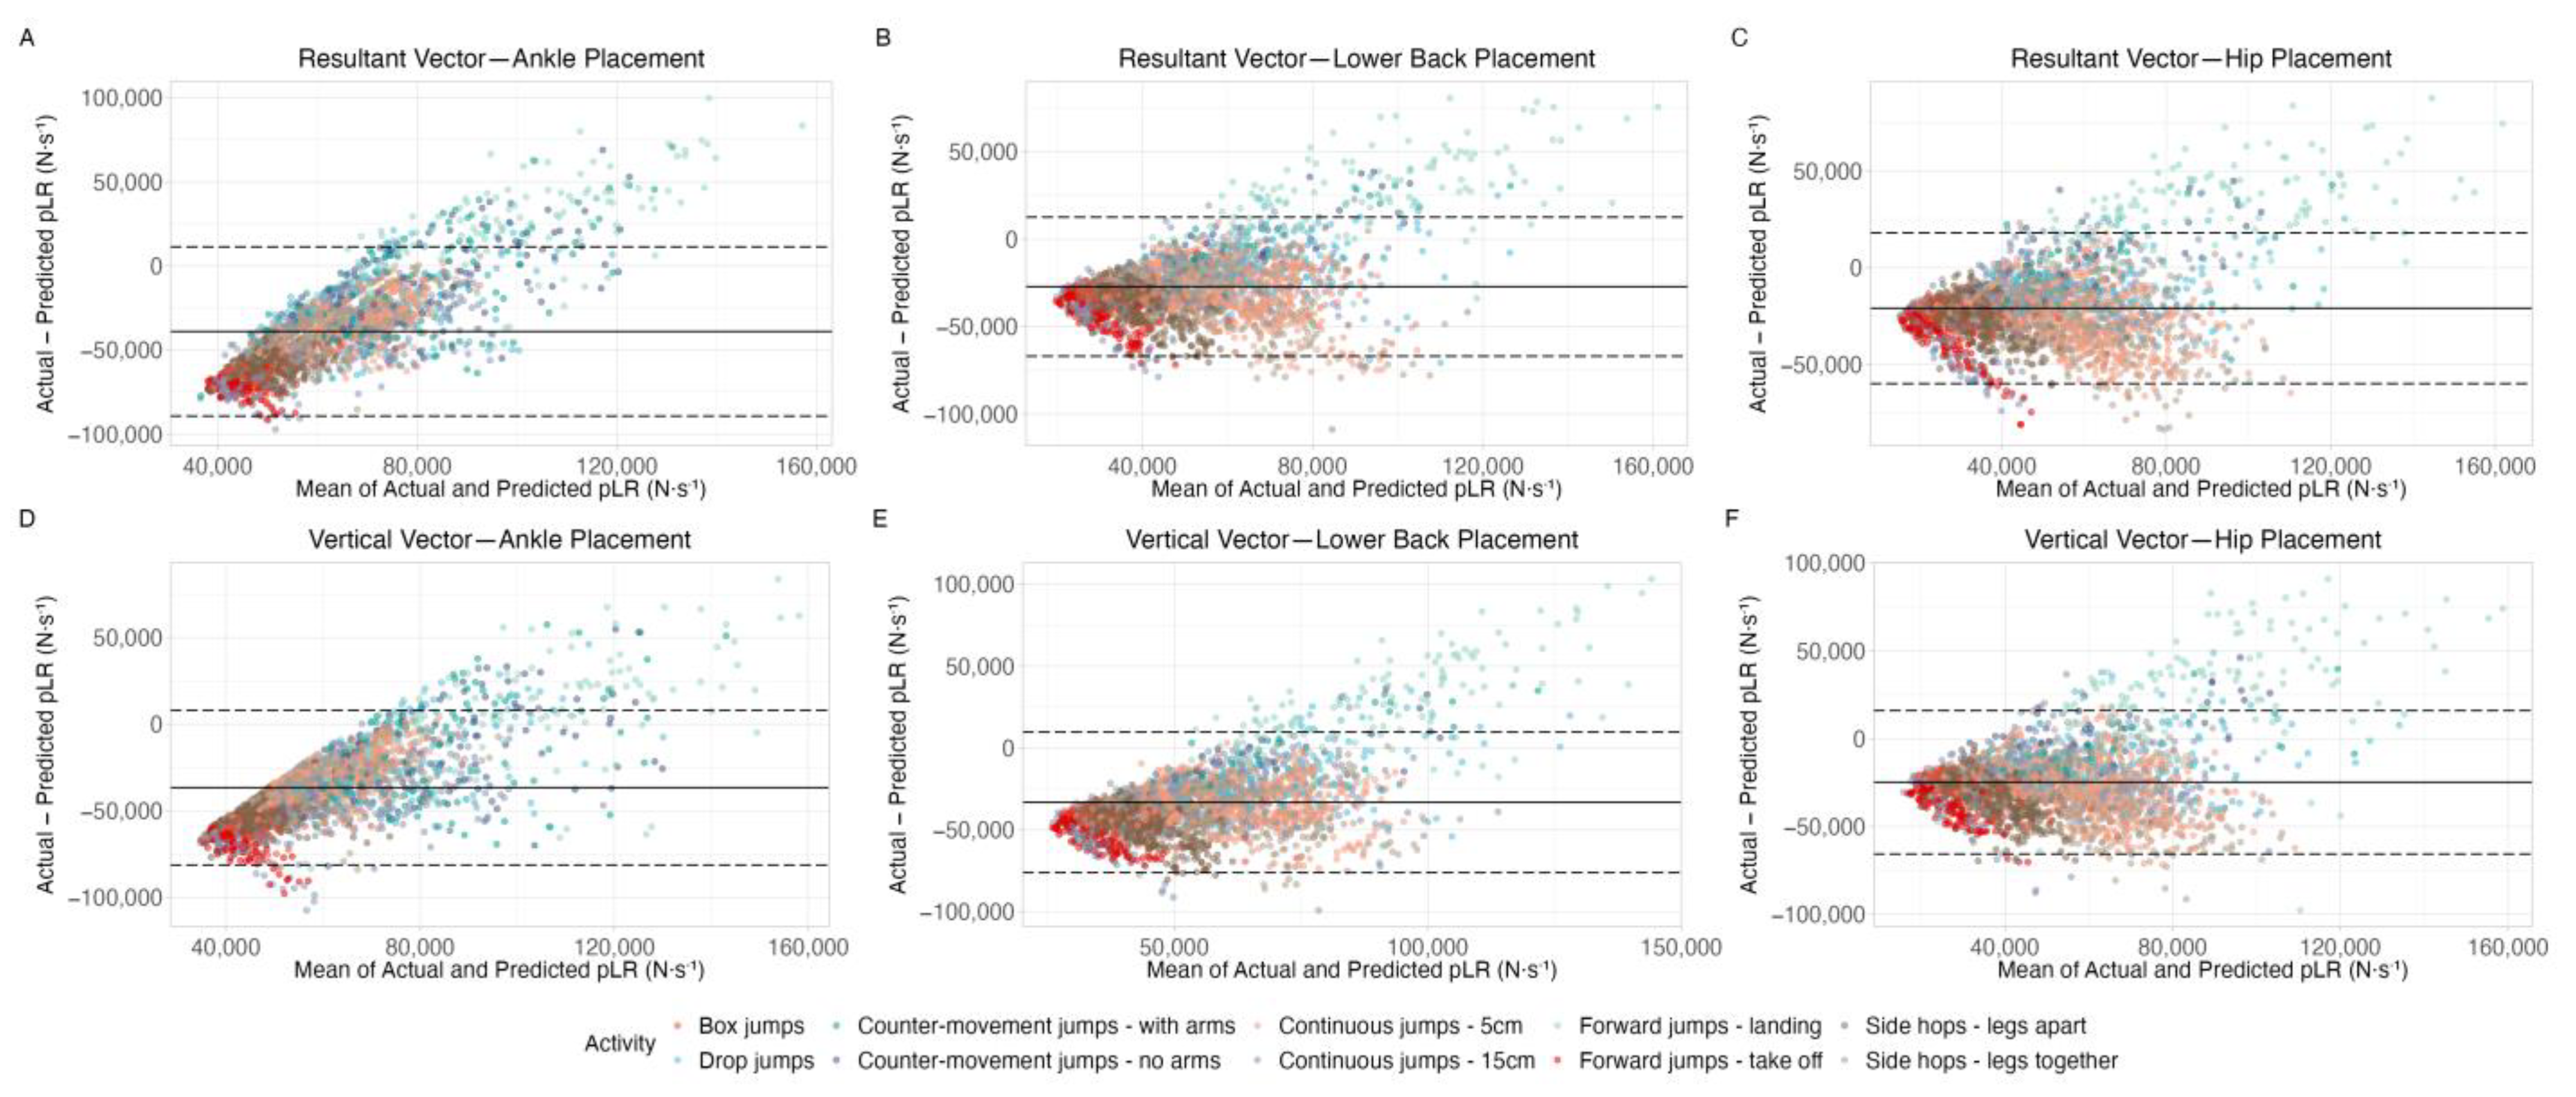
3.3. Accuracy of pGRF and pLR Predictions for Jumping Using the Veras et al., 2023 [21] Equations

The accuracy indices for predicting pGRF and pLR during jumping activities using the Veras et al., 2023 [21] equations are displayed in Table 4. MAE values ranged from 378.6 N to 646.2 N and MAPE between 15.2% and 28.1%, which are comparable to the pGRF prediction equations error for running. RMSE values for pGRF predictions during jumping ranged from 499.2 N to 786.2 N. The pLR predictions for jumping were notably less accurate, with MAE values between 25,233.5 N·s−1 and 42,578.0 N·s−1, and MAPE ranging from 149.0% to 260.3%. Corresponding RMSE values ranged from 28,840.3 N·s−1 to 46,675.9 N·s−1, indicating unacceptably large prediction errors for loading rate during these high-impact activities. Supplemental Table S3 presents the pGRF and pLR prediction errors for all jumping activities separately, using the Veras et al., 2023 [21] equations.

3.4. Bland–Altman Plot Analysis

A Bland–Altman plot of measurements that show high agreement would depict data points scattered randomly around the bias line, with most points falling within the limits of agreement, indicating no systematic bias between the actual and predicted values. In this study, Bland–Altman plots for pGRF prediction using Veras et al., 2022 [20] showed systematic biases for both walking and running activities (Figure 1). The points for walking clustered more tightly around the mean difference line, while running data displayed a larger spread, particularly for higher values of ground reaction force. Similar trends were observed in pLR prediction equations using Veras et al., 2022 [20] (Figure 2), where larger deviations were noted for running compared to walking. Regarding the Bland–Altman plot for walking and running pGRF prediction using the Neugebauer et al., 2014 [17] equation (Figure 3), the data points are much more evenly distributed around the bias, which is very close to zero, showing no signs of systematic bias. For jumping activities (Figure 4 and Figure 5), Bland–Altman plots indicated substantial biases and wide limits of agreement, especially for pLR prediction (Figure 5).

4. Discussion

The objective of this study was to validate mechanical loading prediction equations previously developed using different sample and testing conditions than the ones used in their original validation studies in order to determine their external validity. This was accomplished by testing the mechanical loading prediction equations developed by Veras et al., 2022 [20], Neugebauer et al., 2014 [17], and Veras et al., 2023 [21] on a new sample performing walking, running, and several jumping activities. The main results indicated varying degrees of prediction accuracy, with discrepancies observed in the prediction errors for different activities and accelerometer placements.
As far as we know, this is the first study to investigate the external validity of mechanical loading prediction equations. External validation is crucial for several reasons [27,28,29]. Firstly, it ensures that the prediction models are not overfitted to the specific sample and conditions of the original study, thus confirming their robustness and generalizability to other populations and settings. Secondly, this type of validation helps to identify the potential limitations and biases inherent in the original models. For example, models developed with a homogeneous sample may not perform well with a more diverse population, including variations in age, gender, body composition, and physical activity levels, which are all factors that can influence the prediction accuracy [24]. Thirdly, by testing these models in a variety of activity contexts we can better understand their practical applicability in real-world scenarios. This is particularly important for public health and clinical applications [30,31], where accurate and reliable assessments of mechanical loading are needed to prescribe appropriate physical activities, monitor rehabilitation progress, and prevent injury.
When comparing the results of this external validation study with the results of the original studies, some differences emerge. For walking and running, pGRF and pLR predictions using the Veras et al., 2022 [20] equations, the original study reported lower prediction errors, with MAPE ranging from 6.8% to 7.3% for pGRF and 17.7% to 19.1% for pLR. In contrast, our current study found higher MAPE values, especially for walking, with MAPE exceeding 100% for pLR, indicating less accurate predictions in our external validation sample. Similarly, Neugebauer et al., 2014 [17] reported a MAPE of 8.3% for walking and running pGRF predictions, which is slightly better than the 9.7% and 11.1% MAPE observed in our study. For jumping activities, Veras et al., 2023 [21] reported MAPE values between 12.3% and 14.5% for pGRF and 20.7% to 24.7% for pLR. Our current external validation study found significantly higher errors, particularly for pLR predictions during jumping, with MAPE values reaching up to 260.3%. These greater errors were, to some degree, expected because external validation involves testing the models on different populations and conditions than those used in the original studies, for which the models were optimized. When applied to new, more variable datasets, the models are likely to encounter variations that they were not initially exposed to, which usually leads to higher prediction errors [24,27,28].
The high errors observed in pLR predictions stem from several factors. First, pLR is an inherently volatile variable, reflecting rapid changes in force over very short time intervals, particularly during high-impact activities like jumping. This volatility makes accurate prediction extremely sensitive to the exact timing of ground contact and peak force, a challenge noted in several validation studies [19,20,21,32]. Wearable accelerometers, typically sampling at 100 Hz, may not capture the precise moment of force application, leading to a smoothing of the data that significantly distorts pLR estimates. This challenge is compounded by inter-individual variability in biomechanics; different subjects exhibit varied landing mechanics, joint stiffness, and movement strategies, all of which can drastically affect loading rates but are not easily captured by accelerometers alone.
Moreover, even slight differences in accelerometer positioning can lead to substantial differences in the data collected. During high-impact activities like jumping, imperceptible shifts in sensor position can result in markedly different acceleration profiles, leading to large discrepancies in pLR predictions [33,34]. While researchers can ensure correct device positioning in laboratory conditions, this is not guaranteed in real-life settings. Subjects may be unaware of errors in accelerometer positioning, and the device’s position could shift during extended data collection protocols, significantly contributing to greater prediction errors, thereby compromising the interpretation of study results. Additionally, the variability in human movement patterns, influenced by factors such as gait, speed, and individual biomechanics [35,36], introduces additional noise into the data, challenging the models’ ability to generalize across different populations and conditions. These factors collectively highlight the need for more sophisticated modeling approaches that can compensate for limitations in accelerometer sampling rates, account for inter-individual variability in biomechanics, mitigate the effects of sensor placement inconsistencies, and adapt to the complexity and variability of human movement in real-world settings.
These results have important practical implications for researchers studying physical activity-related mechanical loading and using accelerometer-based prediction equations. Our findings suggest that while these models can provide useful estimates, their accuracy can vary significantly depending on the activity type, sample characteristics, and testing conditions, and that this varying accuracy needs to be considered when interpreting the results of studies that apply these equations. In real-world applications, such as sports training or rehabilitation, accurate predictions of mechanical loading are critical for tailoring exercise programs to prevent osteoarticular injury or to optimize bone health. However, the current prediction inaccuracies may limit the practicality of the models in these settings. If not addressed, these limitations could result in suboptimal recommendations, potentially compromising bone health outcomes. Thus, further refinement is essential to ensure these models can be reliably applied in real-world clinical and sports contexts.
This study has some limitations that should be acknowledged in order to adequately interpret its results. Firstly, the testing conditions, while diverse, may not capture all possible real-world scenarios. Future research should aim to test different activities and environments compared to the previous studies, such as examining the mechanical loading of locomotion on different surfaces, climbing stairs, or including sport-specific movements and other specialized activities. Secondly, the study was conducted in a controlled laboratory environment, which may not fully replicate the complexities and variations encountered in free-living conditions. The controlled setting might have reduced external factors like terrain variability, environmental conditions, and daily life movements, potentially influencing the prediction models’ performance when compared to their application in real life settings. Furthermore, as the researchers positioned the accelerometers and ensured that their position remained correct for the duration of the trials, the results cannot account for the effect of increased error due to accelerometer misplacement and shifting that can occur in free-living conditions [37]. Finally, this study’s sample is relatively small and homogenous in characteristics such as age and body mass index. Therefore, we may not know if these results hold true for people with diverse characteristics, such as the elderly and people with obesity. Despite these limitations, the study’s strengths lie in its rigorous methodological approach and the comprehensive evaluation of multiple prediction models across various activities, providing valuable insights into their external validity.
Future studies aiming to improve the accuracy of mechanical loading prediction equations could explore the use of advanced machine learning techniques, which are better equipped to capture the complexity and variability inherent to biomechanical data. Additionally, employing accelerometers with higher sampling frequencies would provide more detailed data, which is essential for accurately detecting critical events like peak loading rates. Techniques that enable the reconstruction of ground reaction force signals from accelerometer data could further enhance accuracy, particularly in pLR predictions, making these models more reliable for diverse real-world applications. Moreover, prediction accuracy could be potentially improved by using data from sensors in two or more placements simultaneously. Although this strategy would not be feasible when collecting daily living data due to a probable decrease in the participant’s adherence to the protocol, in more controlled scenarios, such as gathering mechanical loading data from athletes during their sports practice, this could be a valid strategy. Together, these approaches could not only enhance the accuracy of the models but also improve their consistency by mitigating the systematic biases observed in our analysis, reducing the tendency to either consistently overestimate or underestimate the predicted values, and making the bias values closer to zero. In conclusion, this study demonstrates the necessity and value of external validation for mechanical loading prediction equations. Our findings indicate that while existing models can be useful, their accuracy is context-dependent, and further refinement and validation are needed. This research highlights the importance of continuous evaluation and adaptation of prediction models to enhance their applicability and reliability in diverse real-world settings.

Supplementary Materials

The following supporting information can be downloaded at: https://www.mdpi.com/article/10.3390/app142210292/s1. Table S1: Accuracy indices for pGRF and pLR prediction for different walking and running speeds based on the Veras et al. (2022) [20] equations; Table S2: Accuracy indices for pGRF and pLR prediction for different walking and running speeds based on the Neugebauer et al. (2014) [17] equation; Table S3: Accuracy indices for pGRF and pLR prediction for different types of jumping based on the Veras et al. (2023) [21] equations; Video S1: Example of the activities included in the protocol.

Author Contributions

Conceptualization, L.V., F.D.-S., G.B., J.O. and H.F.; formal analysis, L.V. and D.O.; investigation, L.V., D.O., F.D.-S., G.B., A.R.-C., J.O. and H.F.; methodology, L.V., F.D.-S., G.B., J.O. and H.F.; software, L.V. and D.O.; writing—original draft, L.V., D.O. and H.F.; writing—review and editing, L.V., D.O., F.D.-S., G.B., A.R.-C., J.O. and H.F. All authors have read and agreed to the published version of the manuscript.

Funding

This work was performed at the Research Center in Physical Activity, Health, and Leisure (CIAFEL), Faculty of Sport, University of Porto (FADEUP), funded by Fundação Para a Ciência e Tecnologia (FCT grants UIDB/00617/2020, doi: 10.54499/UIDB/00617/2020 and UIDP/00617/2020, doi: 10.54499/UIDP/00617/2020) and the Laboratory for Integrative and Translational Research in Population Health (ITR; FCT grant LA/P/0064/2020). L.V., D.O., F.D.-S., and G.B. were supported by the FCT (grant numbers UI/BD/150673/2020, 2024.04905.BD, SFRH/BD/117622/2016, and SFRH/BD/146976/2019).

Institutional Review Board Statement

The study was conducted in accordance with the Declaration of Helsinki, and approved by the Ethics Committee of the Faculty of Sport, University of Porto (protocol code CEFADE 15-21, approved on 11 May 2021).

Informed Consent Statement

Informed consent was obtained from all subjects involved in the study.

Data Availability Statement

The data presented in this study are available on request from the corresponding author.

Acknowledgments

The authors thank the participants who took part in this research and all who have collaborated in the research project.

Conflicts of Interest

The authors declare no conflicts of interest.

References

  1. Brooke-Wavell, K.; A Skelton, D.; Barker, K.L.; Clark, E.M.; De Biase, S.; Arnold, S.; Paskins, Z.; Robinson, K.R.; Lewis, R.M.; Tobias, J.H.; et al. Strong, steady and straight: UK consensus statement on physical activity and exercise for osteoporosis. Br. J. Sports Med. 2022, 56, 837–846. [Google Scholar] [CrossRef] [PubMed]
  2. Santos, L.; Elliott-Sale, K.J.; Sale, C. Exercise and bone health across the lifespan. Biogerontology 2017, 18, 931–946. [Google Scholar] [CrossRef] [PubMed]
  3. Beck, B.R.; Daly, R.M.; Singh, M.A.F.; Taaffe, D.R. Exercise and Sports Science Australia (ESSA) position statement on exercise prescription for the prevention and management of osteoporosis. J. Sci. Med. Sport. 2017, 20, 438–445. [Google Scholar] [CrossRef] [PubMed]
  4. Fonseca, H.; Moreira-Gonçalves, D.; Coriolano, H.-J.A.; Duarte, J.A. Bone quality: The determinants of bone strength and fragility. Sports Med. 2014, 44, 37–53. [Google Scholar] [CrossRef] [PubMed]
  5. Harding, A.T.; Beck, B.R. Exercise, Osteoporosis, and Bone Geometry. Sports 2017, 5, 29. [Google Scholar] [CrossRef]
  6. NIH Consensus Development Panel on Osteoporosis Prevention, Diagnosis and T. Osteoporosis Prevention, Diagnosis, and Therapy. J. Am. Med. Assoc. 2001, 285, 785–795. [CrossRef]
  7. Turner, C.H.; Robling, A.G. Mechanisms by which exercise improves bone strength. J. Bone Miner. Metab. 2005, 23, 16–22. [Google Scholar] [CrossRef]
  8. Robling, A.G.; Turner, C.H. Mechanical signaling for bone modeling and remodeling. Crit. Rev. Eukaryot. Gene Expr. 2009, 19, 319–338. [Google Scholar] [CrossRef]
  9. Yuan, Y.; Chen, X.; Zhang, L.; Wu, J.; Guo, J.; Zou, D.; Chen, B.; Sun, Z.; Shen, C.; Zou, J. The roles of exercise in bone remodeling and in prevention and treatment of osteoporosis. Prog. Biophys. Mol. Biol. 2016, 122, 122–130. [Google Scholar] [CrossRef]
  10. Ren, S.; Chen, Z.; Qin, X.; Zhao, X.; Yang, T.D.; Zhu, W. Measurement and Evaluation of Bone Loading in Physical Activity: A Systematic Review. Meas. Phys. Educ. Exerc. Sci. 2020, 25, 149–162. [Google Scholar] [CrossRef]
  11. Medved, V. Measurement of Human Locomotion; CRC Press: London, UK, 2000. [Google Scholar]
  12. Weeks, B.K.; Beck, B.R. The BPAQ: A bone-specific physical activity assessment instrument. Osteoporos. Int. 2008, 19, 1567–1577. [Google Scholar] [CrossRef] [PubMed]
  13. Farr, J.N.; Lee, V.R.; Blew, R.M.; Lohman, T.G.; Going, S.B. Quantifying bone-relevant activity and its relation to bone strength in girls. Med. Sci. Sports Exerc. 2011, 43, 476–483. [Google Scholar] [CrossRef] [PubMed]
  14. Kim, S.; So, W.-Y.; Kim, J.; Sung, D.J. Relationship between bone-specific physical activity scores and measures for body composition and bone mineral density in healthy young college women. PLoS ONE 2016, 11, e0162127. [Google Scholar] [CrossRef] [PubMed]
  15. Kim, S.; Baker, B.S.; Sharma-Ghimire, P.; Bemben, D.A.; Bemben, M.G. Association between bone-specific physical activity scores and pQCT-derived measures of bone strength and geometry in healthy young and middle-aged premenopausal women. Arch. Osteoporos. 2018, 13, 83. [Google Scholar] [CrossRef]
  16. Neugebauer, J.M.; Hawkins, D.A.; Beckett, L. Estimating youth locomotion ground reaction forces using an accelerometer-based activity monitor. PLoS ONE 2012, 7, e48182. [Google Scholar] [CrossRef]
  17. Neugebauer, J.M.; Collins, K.H.; Hawkins, D.A. Ground reaction force estimates from ActiGraph GT3X+ hip accelerations. PLoS ONE 2014, 9, e99023. [Google Scholar] [CrossRef]
  18. Neugebauer, J.M.; Lafiandra, M. Predicting ground reaction force from a hip-borne accelerometer during load carriage. Med. Sci. Sports Exerc. 2018, 50, 2369–2374. [Google Scholar] [CrossRef]
  19. Veras, L.; Diniz-Sousa, F.; Boppre, G.; Devezas, V.; Santos-Sousa, H.; Preto, J.; Vilas-Boas, J.P.; Machado, L.; Oliveira, J.; Fonseca, H. Accelerometer-based prediction of skeletal mechanical loading during walking in normal weight to severely obese subjects. Osteoporos. Int. 2020, 31, 1239–1250. [Google Scholar] [CrossRef]
  20. Veras, L.; Diniz-Sousa, F.; Boppre, G.; Resende-Coelho, A.; Moutinho-Ribeiro, E.; Devezas, V.; Santos-Sousa, H.; Preto, J.; Vilas-Boas, J.P.; Machado, L.; et al. Mechanical loading prediction through accelerometry data during walking and running. Eur. J. Sport Sci. 2022, 23, 1518–1527. [Google Scholar] [CrossRef]
  21. Veras, L.; Diniz-Sousa, F.; Boppre, G.; Devezas, V.; Santos-Sousa, H.; Preto, J.; Vilas-Boas, J.P.; Machado, L.; Oliveira, J.; Fonseca, H. Using Raw Accelerometer Data to Predict High-Impact Mechanical Loading. Sensors 2023, 23, 2246. [Google Scholar] [CrossRef]
  22. Migueles, J.H.; Cadenas-Sanchez, C.; Ekelund, U.; Delisle Nyström, C.; Mora-Gonzalez, J.; Löf, M.; Labayen, I.; Ruiz, J.R.; Ortega, F.B. Accelerometer data collection and processing criteria to assess physical activity and other outcomes: A systematic review and practical considerations. Sports Med. 2017, 47, 1821–1845. [Google Scholar] [CrossRef] [PubMed]
  23. Troiano, R.P.; McClain, J.J.; Brychta, R.J.; Chen, K.Y. Evolution of accelerometer methods for physical activity research. Br. J. Sports Med. 2014, 48, 1019–1023. [Google Scholar] [CrossRef] [PubMed]
  24. Welk, G.J. Principles of design and analyses for the calibration of accelerometry-based activity monitors. Med. Sci. Sports Exerc. 2005, 37 (Suppl. S11), S501–S511. [Google Scholar] [CrossRef] [PubMed]
  25. Toda, H.; Nagano, A.; Luo, Z. Age and gender differences in the control of vertical ground reaction force by the hip, knee and ankle joints. J. Phys. Ther. Sci. 2015, 27, 1833–1838. [Google Scholar] [CrossRef]
  26. Patoz, A.; Menéndez, A.F.; Malatesta, D. The effect of severe obesity on three-dimensional ground reaction force signals during walking. Clin. Biomech. 2023, 107, 106042. [Google Scholar] [CrossRef]
  27. Staudenmayer, J.; Zhu, W.; Catellier, D.J. Statistical considerations in the analysis of accelerometry-based activity monitor data. Med. Sci. Sports Exerc. 2012, 44 (Suppl. S1), S61–S67. [Google Scholar] [CrossRef]
  28. Zhang, Y.; Weijer, R.H.; van Schooten, K.S.; Bruijn, S.M.; Pijnappels, M. External Validation and Further Exploration of Fall Prediction Models Based on Questionnaires and Daily-Life Trunk Accelerometry. J. Am. Med. Dir. Assoc. 2024, 25, 105107. [Google Scholar] [CrossRef]
  29. Lyden, K.; Kozey, S.L.; Staudenmeyer, J.W.; Freedson, P.S. A comprehensive evaluation of commonly used accelerometer energy expenditure and MET prediction equations. Eur. J. Appl. Physiol. 2011, 111, 187. [Google Scholar] [CrossRef]
  30. Chastin, S.; Mandrichenko, O.; Helbostadt, J.; Skelton, D. Associations between objectively-measured sedentary behaviour and physical activity with bone mineral density in adults and older adults, the NHANES study. Bone 2014, 64, 254–262. [Google Scholar] [CrossRef]
  31. Stiles, V.H.; Metcalf, B.S.; Knapp, K.M.; Rowlands, A. A small amount of precisely measured high-intensity habitual physical activity predicts bone heath in pre- and post-menopausal women in UK Biobank. Int. J. Epidemiol. 2017, 46, 1847–1856. [Google Scholar] [CrossRef]
  32. Fortune, E.; Morrow, M.M.B.; Kaufman, K.R. Assessment of gait kinetics using tri-axial accelerometers. J. Appl. Biomech. 2014, 30, 668–674. [Google Scholar] [CrossRef] [PubMed]
  33. Tan, T.; Chiasson, D.P.; Hu, H.; Shull, P.B. Influence of IMU position and orientation placement errors on ground reaction force estimation. J. Biomech. 2019, 97, 109416. [Google Scholar] [CrossRef] [PubMed]
  34. Chen, S.; Brantley, J.S.; Kim, T.; Ridenour, S.A.; Lach, J. Characterising and minimising sources of error in inertial body sensor networks. Int. J. Auton. Adapt. Commun. Syst. 2013, 6, 253–271. [Google Scholar] [CrossRef]
  35. Jiang, X.; Bíró, I.; Sárosi, J.; Fang, Y.; Gu, Y. Comparison of ground reaction forces as running speed increases between male and female runners. Front. Bioeng. Biotechnol. 2024, 12, 1378284. [Google Scholar] [CrossRef]
  36. Park, J.; Kim, C. Ground-reaction-force-based gait analysis and its application to gait disorder assessment: New indices for quantifying walking behavior. Sensors 2022, 22, 7558. [Google Scholar] [CrossRef]
  37. Sara, L.K.; Outerleys, J.; Johnson, C.D. The effect of sensor placement on measured distal tibial accelerations during running. J. Appl. Biomech. 2023, 39, 199–203. [Google Scholar] [CrossRef]
Figure 1. Bland–Altman plots displaying the level of agreement between actual and predicted pGRF for accelerometers worn at the ankle (panels A,D), lower back (panels B,E), and hip (panels C,F). These plots cover both the resultant vector (panels AC) and its vertical component (panels DF). Predictions of pGRF during walking and running were calculated using the equations from Veras et al. (2022) [20]. The solid lines represent the bias (the mean difference between actual and predicted values), while the dashed lines mark the limits of agreement (bias ±1.96 standard deviations). Abbreviations: pGRF, peak ground reaction force.
Applsci 14 10292 g001
Figure 2. Bland–Altman plots displaying the level of agreement between actual and predicted pL for accelerometers worn at the ankle (panels A,D), lower back (panels B,E), and hip (panels C,F). These plots cover both the resultant vector (panels AC) and its vertical component (panels DF). Predictions of pLR during walking and running were calculated using the equations from Veras et al. (2022) [20]. The solid lines represent the bias (the mean difference between actual and predicted values), while the dashed lines mark the limits of agreement (bias ±1.96 standard deviations). Abbreviations: pLR, peak loading rate.
Applsci 14 10292 g002
Figure 3. Bland–Altman plot displaying the level agreement between actual and predicted pGRF for accelerometers worn at the hip for the vertical vector. Predictions of pGRF during walking and running were calculated using the equation from Neugebauer et al. (2014) [17]. The solid line represents the bias (the mean difference between actual and predicted values), while the dashed lines mark the limits of agreement (bias ±1.96 standard deviations). Abbreviations: pGRF, peak ground reaction force.
Applsci 14 10292 g003
Figure 4. Bland–Altman plots displaying the level of agreement between actual and predicted pGRF for accelerometers worn at the ankle (panels A,D), lower back (panels B,E), and hip (panels C,F). These plots cover both the resultant vector (panels AC) and its vertical component (panels DF). Predictions of pGRF during jumping were calculated using the equations from Veras et al. (2023) [21]. The solid lines represent the bias (the mean difference between actual and predicted values), while the dashed lines mark the limits of agreement (bias ±1.96 standard deviations). Abbreviations: pGRF, peak ground reaction force.
Applsci 14 10292 g004
Figure 5. Bland–Altman plots displaying the level of agreement between actual and predicted pL for accelerometers worn at the ankle (panels A,D), lower back (panels B,E), and hip (panels C,F). These plots cover both the resultant vector (panels AC) and its vertical component (panels DF). Predictions of pLR during jumping were calculated using the equations from Veras et al. (2023) [21]. The solid lines represent the bias (the mean difference between actual and predicted values), while the dashed lines mark the limits of agreement (bias ±1.96 standard deviations). Abbreviations: pLR, peak loading rate.
Applsci 14 10292 g005
Table 1. Sample characteristics of the Veras et al. (2022) [20], Neugebauer et al. (2014) [17], and Veras et al. (2023) [21] studies.
Veras et al. (2022) [20]Neugebauer et al. (2014) [17]Veras et al. (2023) [21]
(52 females, 79 males) (20 females, 19 males) (51 females, 27 males)
Age (years)32.0 ± 11.221.2 ± 1.335.6 ± 11.6
Height (m)1.65 ± 0.091.73 ± 0.121.63 ± 0.09
Mass (kg)76.9 ± 19.667.6 ± 11.582.4 ± 20.6
BMI (kg·m−2)28.5 ± 8122.5 ± 2.331.3 ± 8.7
Data presented as mean ± standard deviation. Abbreviations: BMI, body mass index.
Table 2. Accuracy indices for pGRF and pLR predictions for walking and running based on the Veras et al. (2022) [20] equations. The high prediction errors for pLR reflect challenges in accurately predicting this variable using accelerometers. Factors such as low accelerometer sampling frequency and individual variation in biomechanics likely contribute to the larger discrepancies in pLR compared to pGRF.
Vector Activity Accelerometer Placement MAE MAPE RMSE
pGRF prediction
ResultantWalkingAnkle606.780.0%617.3
Lower back598.778.9%609.9
Hip577.475.9%587.7
RunningAnkle247.514.3%314.8
Lower back218.012.9%271.0
Hip189.911.6%240.9
VerticalWalkingAnkle621.783.3%632.5
Lower back596.879.6%607.3
Hip557.074.1%567.2
RunningAnkle243.514.4%302.0
Lower back239.814.1%295.8
Hip199.712.1%248.5
pLR prediction
ResultantWalkingAnkle8847.6116.0%9706.2
Lower back9460.4134.0%10,372.9
Hip8713.0114.8%9653.9
RunningAnkle16,638.640.6%20,459.1
Lower back17,539.743.1%21,288.0
Hip22,334.356.6%26,363.9
VerticalWalkingAnkle8042.0106.5%8826.3
Lower back10,328.2147.6%11,247.3
Hip8512.6113.6%9334.4
RunningAnkle15,729.838.9%19,313.6
Lower back16,609.640.7%20,319.9
Hip14,198.735.2%17,408.8
Abbreviations: MAE, mean absolute error; MAPE, mean absolute percent error; pGRF, peak ground reaction force; pLR, peak loading rate; RMSE, root mean square error.
Table 3. Accuracy indices for pGRF for walking and running based on the Neugebauer et al. (2014) [17] equation.
Vector Activity Accelerometer Placement MAE MAPE RMSE
pGRF Prediction
VerticalWalkingHip75.09.7%104.9
RunningHip168.711.1%213.5
Abbreviations: MAE, mean absolute error; MAPE, mean absolute percent error; pGRF, peak ground reaction force; RMSE, root mean square error.
Table 4. Accuracy indices for pGRF and pLR prediction for jumping based on the Veras et al., (2023) [21] equations. The pLR predictions for jumping activities show particularly high error rates, with MAPE values exceeding 200%. These errors highlight the difficulty in capturing the rapid, high-magnitude forces involved in jumping, and the difficulty in reflecting measurement sensitivity in pLR predictions.
VectorAccelerometer PlacementMAEMAPERMSE
pGRF prediction
ResultantAnkle646.227.2%786.2
Lower back405.316.7%518.9
Hip380.615.2%499.2
VerticalAnkle633.628.1%762.9
Lower back433.118.8%542.0
Hip378.615.5%500.8
pLR prediction
ResultantAnkle42,578.0260.3%46,675.9
Lower back30,446.0171.4%33,924.7
Hip25,233.5149.0%28,840.3
VerticalAnkle39,082.2257.2%43,130.8
Lower back36,628.7213.6%39,823.7
Hip28,880.9161.5%32,443.4
Abbreviations: MAE, mean absolute error; MAPE, mean absolute percent error; pGRF, peak ground reaction force; pLR, peak loading rate; RMSE, root mean square error.
Disclaimer/Publisher’s Note: The statements, opinions and data contained in all publications are solely those of the individual author(s) and contributor(s) and not of MDPI and/or the editor(s). MDPI and/or the editor(s) disclaim responsibility for any injury to people or property resulting from any ideas, methods, instructions or products referred to in the content.

