1. Introduction
Carbon fiber-reinforced plastic (CFRP) composites are widely utilized in various fields due to their exceptional mechanical properties and chemical resistance [
1,
2]. Their structural components have gained increasing acceptance for use in aerospace [
3,
4,
5], marine applications, wind energy [
6], and sports equipment [
7]. A high proportion of composite materials being used in an aircraft often indicates the advanced nature of their manufacturing processes. For instance, the Airbus A380, a milestone in aviation, employed a significant amount of carbon fiber composite materials in its fuselage, wing surfaces, vertical tail, and doors. This application of composites led to a total weight reduction of 10% to 40% and a reduction in design costs by 15% to 30%. Consequently, the A380 was recognized not only as the most spacious civil aircraft ever built but also as the most advanced, efficient, and cost-effective, setting a benchmark for 21st-century aviation [
8].
Despite these advantages, CFRP composites were found to be prone to various degrees of damage and defect formation during both manufacturing and service, which posed serious threats to safety [
9,
10]. To address the critical issue of CFRP defect detection, numerous nondestructive testing (NDT) methods were developed. Common NDT techniques used for detecting CFRP defects included ultrasonic testing [
11], infrared thermography, eddy current thermography, X-ray inspection, computed tomography (CT), and eddy current NDT [
12]. Among these methods, eddy current nondestructive testing (ENDT) garnered significant attention due to its advantages, such as the absence of a need for coupling agents and the simplicity of the equipment. ENDT proved capable of detecting various forms of damage in CFRPs, including cracks, impact damage [
13], delamination, and in-plane fiber ripples [
14,
15,
16]. The accurate identification and classification of these defects were crucial for ensuring product safety, reliability, and economic efficiency.
Research on CFRP defect classification algorithms has attracted considerable scholarly interest. For example, Li et al. [
17] proposed a defect classification method using Support Vector Machines (SVMs) based on the energy characteristics of CFRP ultrasonic inspection results, demonstrating its effectiveness through experimental validation. Anish et al. [
18] conducted the ultrasonic detection of three types of CFRP defects—impact damage, foreign body inclusions, and porosity—and employed an artificial neural network (ANN) to classify these defects based on time domain ultrasonic echo signals, achieving a high classification accuracy that met project requirements. Similarly, Sebastian et al. [
19] introduced various intelligent classification methods into the CFRP automated fiber layup process, enhancing detection and production efficiency. The authors noted that increasing the depth of the network could improve the applicability of visual classification methods.
Recent advances in hardware, particularly the iterative development of GPUs, have driven the rapid evolution of deep neural network algorithms, which require substantial computational power. Deep convolutional neural networks (DCNNs), Inception (GoogLeNet), Vision Transformer (ViT), and Swin Transformer models display outstanding performance in machine learning tasks such as natural language processing, image classification, object detection, and image segmentation [
20,
21]. The use of deep network models in image classification tasks is becoming increasingly prevalent. For instance, Liu et al. [
22] utilized a dense convolutional neural network (DCNN) to classify infrared thermography detection results, identifying debonding, delamination, and cracks in CFRPs. Their experiments showed that DenseNet-121 outperformed other CNN architectures, such as AlexNet, VGG-16, and ResNet-50, achieving a classification accuracy of 98.48%, thus highlighting the potential of deep neural networks for use in CFRP defect classification. Lu et al. [
23] employed a Swin Transformer-based U-Net structure for crack detection and classification tasks, demonstrating a superior performance compared to other algorithms when used on a customized dataset.
Additionally, the Transformer model has exhibited outstanding performance in terms of identifying and classifying defects in various contexts, including rail surfaces [
24], insulators in transmission lines [
25], and metal surfaces [
26]. Alif et al. [
27] compared the classification performance of CNNs and ViT, concluding that ViT methods hold great promise in terms of predictive maintenance and the safety of railroads. ViT image classification methods have also been successfully applied in medical disease detection [
28], chemical pipeline inspections [
29], crop disease detection [
30], product manufacturing damage detection [
31], and industrial printed circuit board (PCB) classification [
32].
To the best of the authors’ knowledge, existing CFRP eddy current NDT defect classification methods predominantly rely on manual analysis and basic machine learning techniques. These approaches suffer from limitations such as subjectivity, high labor costs, and low resolution. Advanced computer vision algorithms, including Vision Transformers (ViTs) and Swin Transformer models, present promising solutions to these challenges. Compared to traditional image classification methods like Support Vector Machines (SVMs) and convolutional neural networks (CNNs), the ViT model offers superior accuracy and generalization for CFRP defect classification. This is attributed to its enhanced global sensing capabilities.
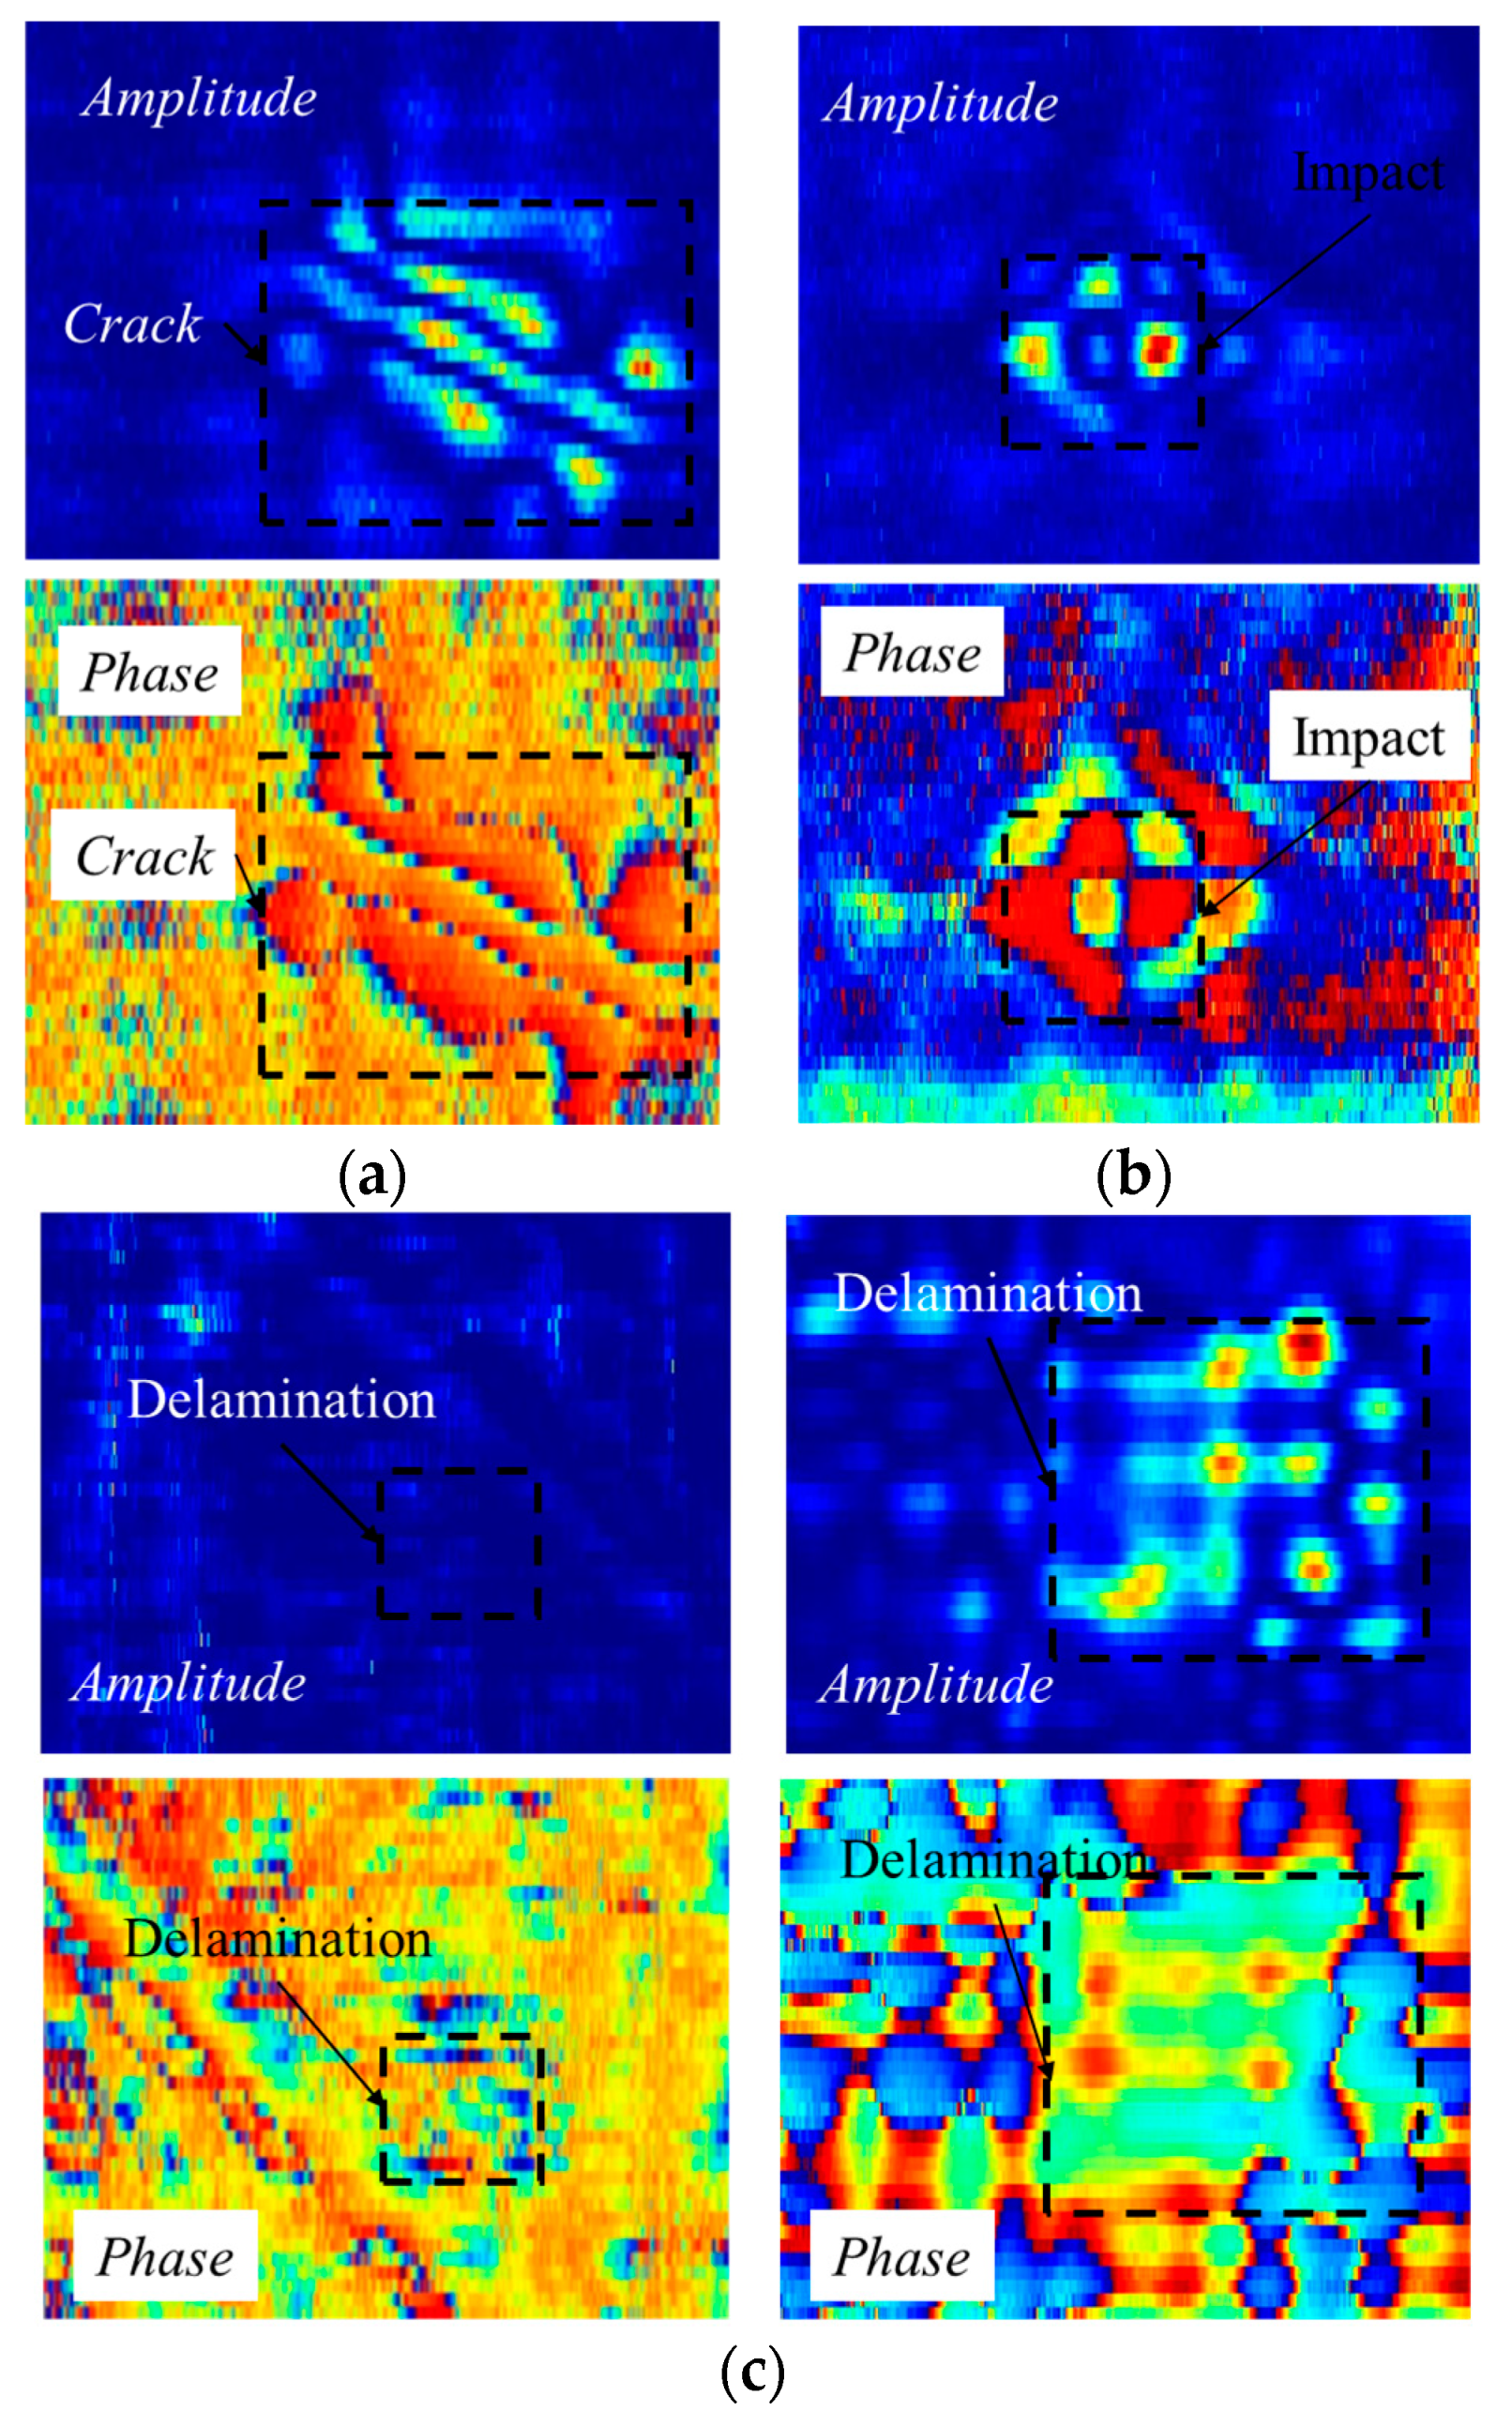
However, purely vision-based methods typically extract features from single images, focusing on aspects such as the magnitude and phase components of the CFRP eddy current system’s output voltage signals, as shown in
Figure 1.
These methods often overlook the interdependence between the complex signal components. In CFRP defect eddy current testing, the output sinusoidal voltage signal from the detection coil is passed through a lock-in amplifier to the data acquisition card, where it is assessed. The data are then processed to generate magnitude and phase detection results of the complex voltage signal. These signals are distinct yet deeply interrelated; they both reflect the same defect type but contain different semantic information with different meanings. Extracting their complementary information is a pressing challenge that needs to be addressed in the field of CFRP defect detection.
Additionally, the dual-modal fusion strategy is widely employed in fields such as medicine, scientific research, and industrial applications. For instance, in healthcare, dual-modal fusion is utilized to combine imaging data, such as MRI or CT scans, with electronic health records (EHRs). This integration enhances diagnostic accuracy by correlating visual anomalies with patient history and clinical data, which facilitates more informed decision-making. Similarly, in robotics and human–computer interactions, dual-modal fusion combines visual and auditory information to improve object recognition and navigation. Robots can analyze camera feeds to identify objects while processing audio cues, enabling them to interact more effectively with their environment and with humans.
In the realm of sentiment analysis, dual-modal approaches that integrate text and audio have demonstrated improved accuracy in terms of understanding emotions. By considering both the content of spoken language and the vocal tone, these systems capture nuances in sentiment that single-modal analyses might miss. Additionally, dual-modal fusion plays a critical role in security and surveillance, where video data are often combined with biometric information, such as facial recognition, to enhance identification accuracy and improve real-time threat detection.
Therefore, this paper proposes a dual-modal fusion Parallel Real–Imaginary/Swin Transformer (PRI-SWT) network for use detecting CFRP defects from complex signal images using eddy current testing. The proposed model employs two parallel Swin Transformers (SWTs) to independently compute self-attention and generate feature maps for the real and imaginary components of the signal. A fusion layer—either a convolutional layer or a linear projection layer—is incorporated into the model to capture the relationships between the real and imaginary parts of the complex signal. By dividing the input image into several shiftable windows and calculating key metrics such as self-attention scores and relative positional encodings within each window, the PRI-SWT model significantly enhances both computational efficiency and classification accuracy. The model outperforms traditional algorithms, such as Support Vector Machine (SVM) and Vision Transformer (ViT), in CFRP defect classification, underscoring the substantial research effort invested in improving detection accuracy.
This study quantitatively evaluates the effects of different factors—including the type of fusion layer, the number of layers, and the window shift size—on the performance of the PRI-SWT model using multiple classification metrics. Notably, the real and imaginary components typically represent different types of modal information; thus, effectively fusing both modalities enables the model to more accurately distinguish CFRP defect features, resulting in a substantial improvement in detection performance. The results reveal that a single-layer linear fusion provides optimal performance, with all evaluation metrics achieving their highest values.
The structure of the paper is as follows:
Section 2 outlines the concept and classifications of multi-modal fusion.
Section 3 introduces the Support Vector Machine (SVM) model, the Vision Transformer (ViT) model, and the Parallel Real–Imaginary/Swin Transformer (PRI-SWT) model for classifying CFRP defect detection images.
Section 4 evaluates the performance of these models in terms of classifying CFRP defects and analyzes the impact of various factors on the classification performance of the PRI-SWT model.
3. PRI-SWT Dual-Modal Fusion Model for CFRP Defect Detection
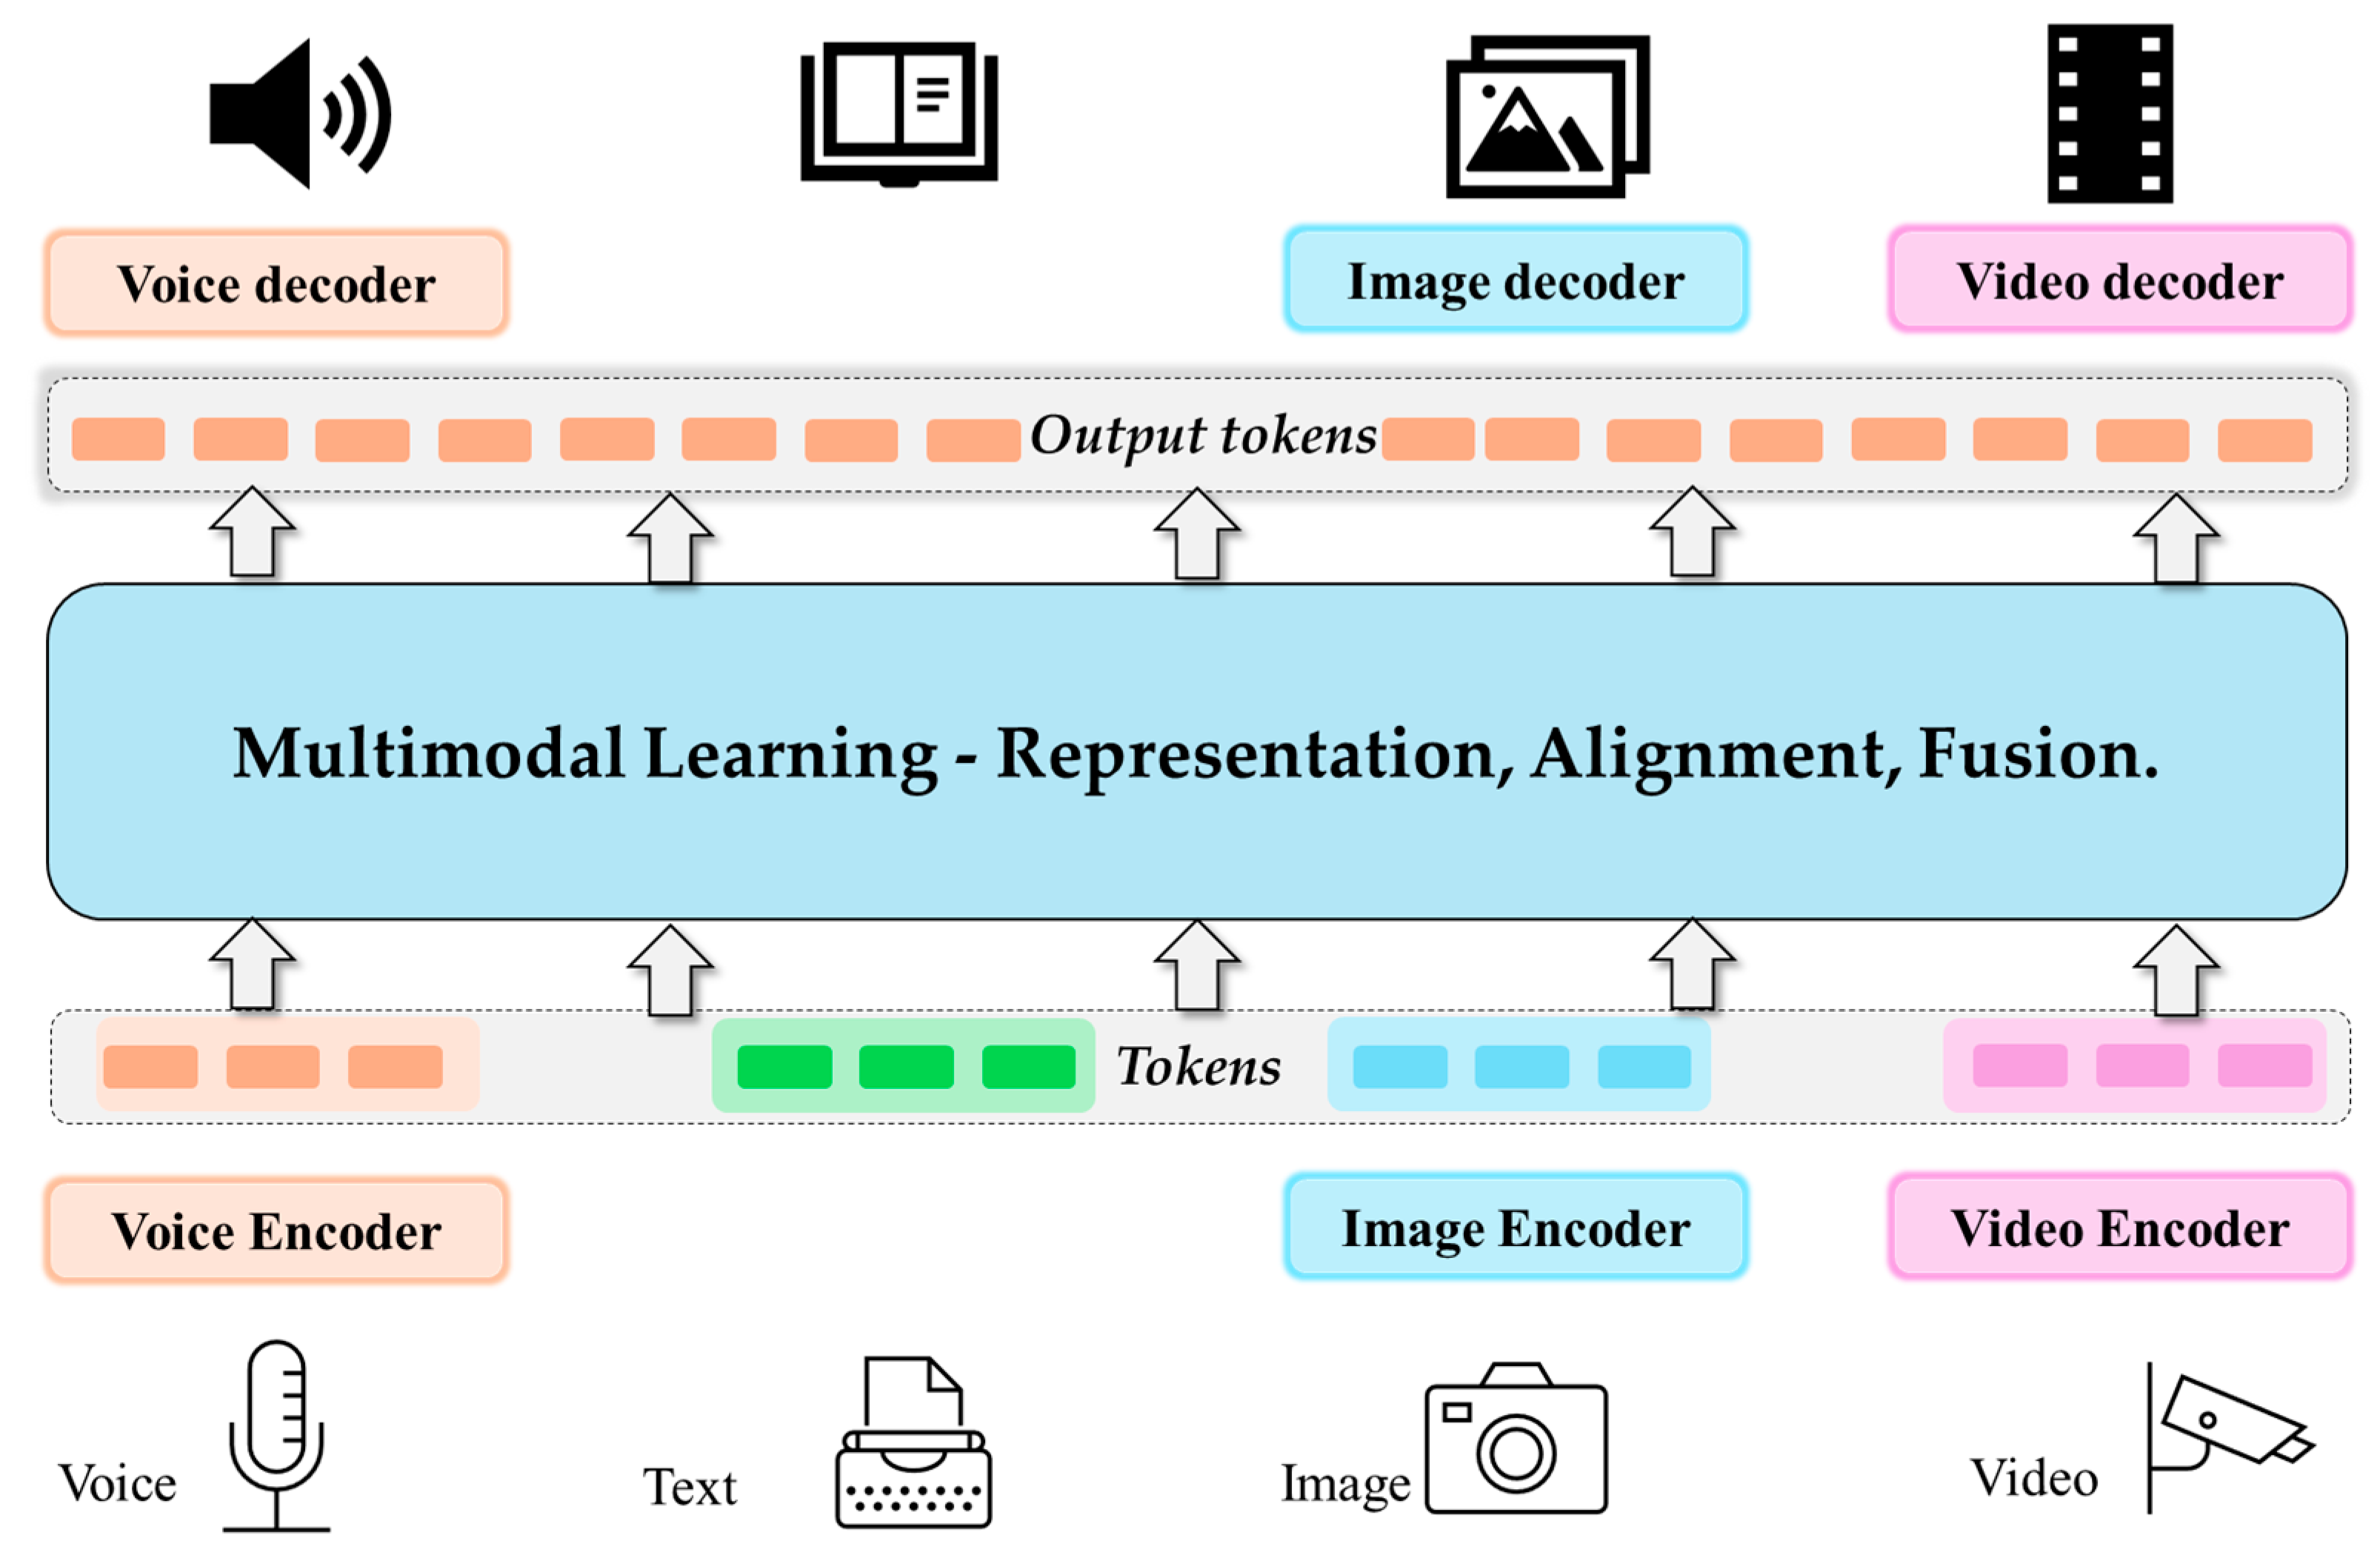
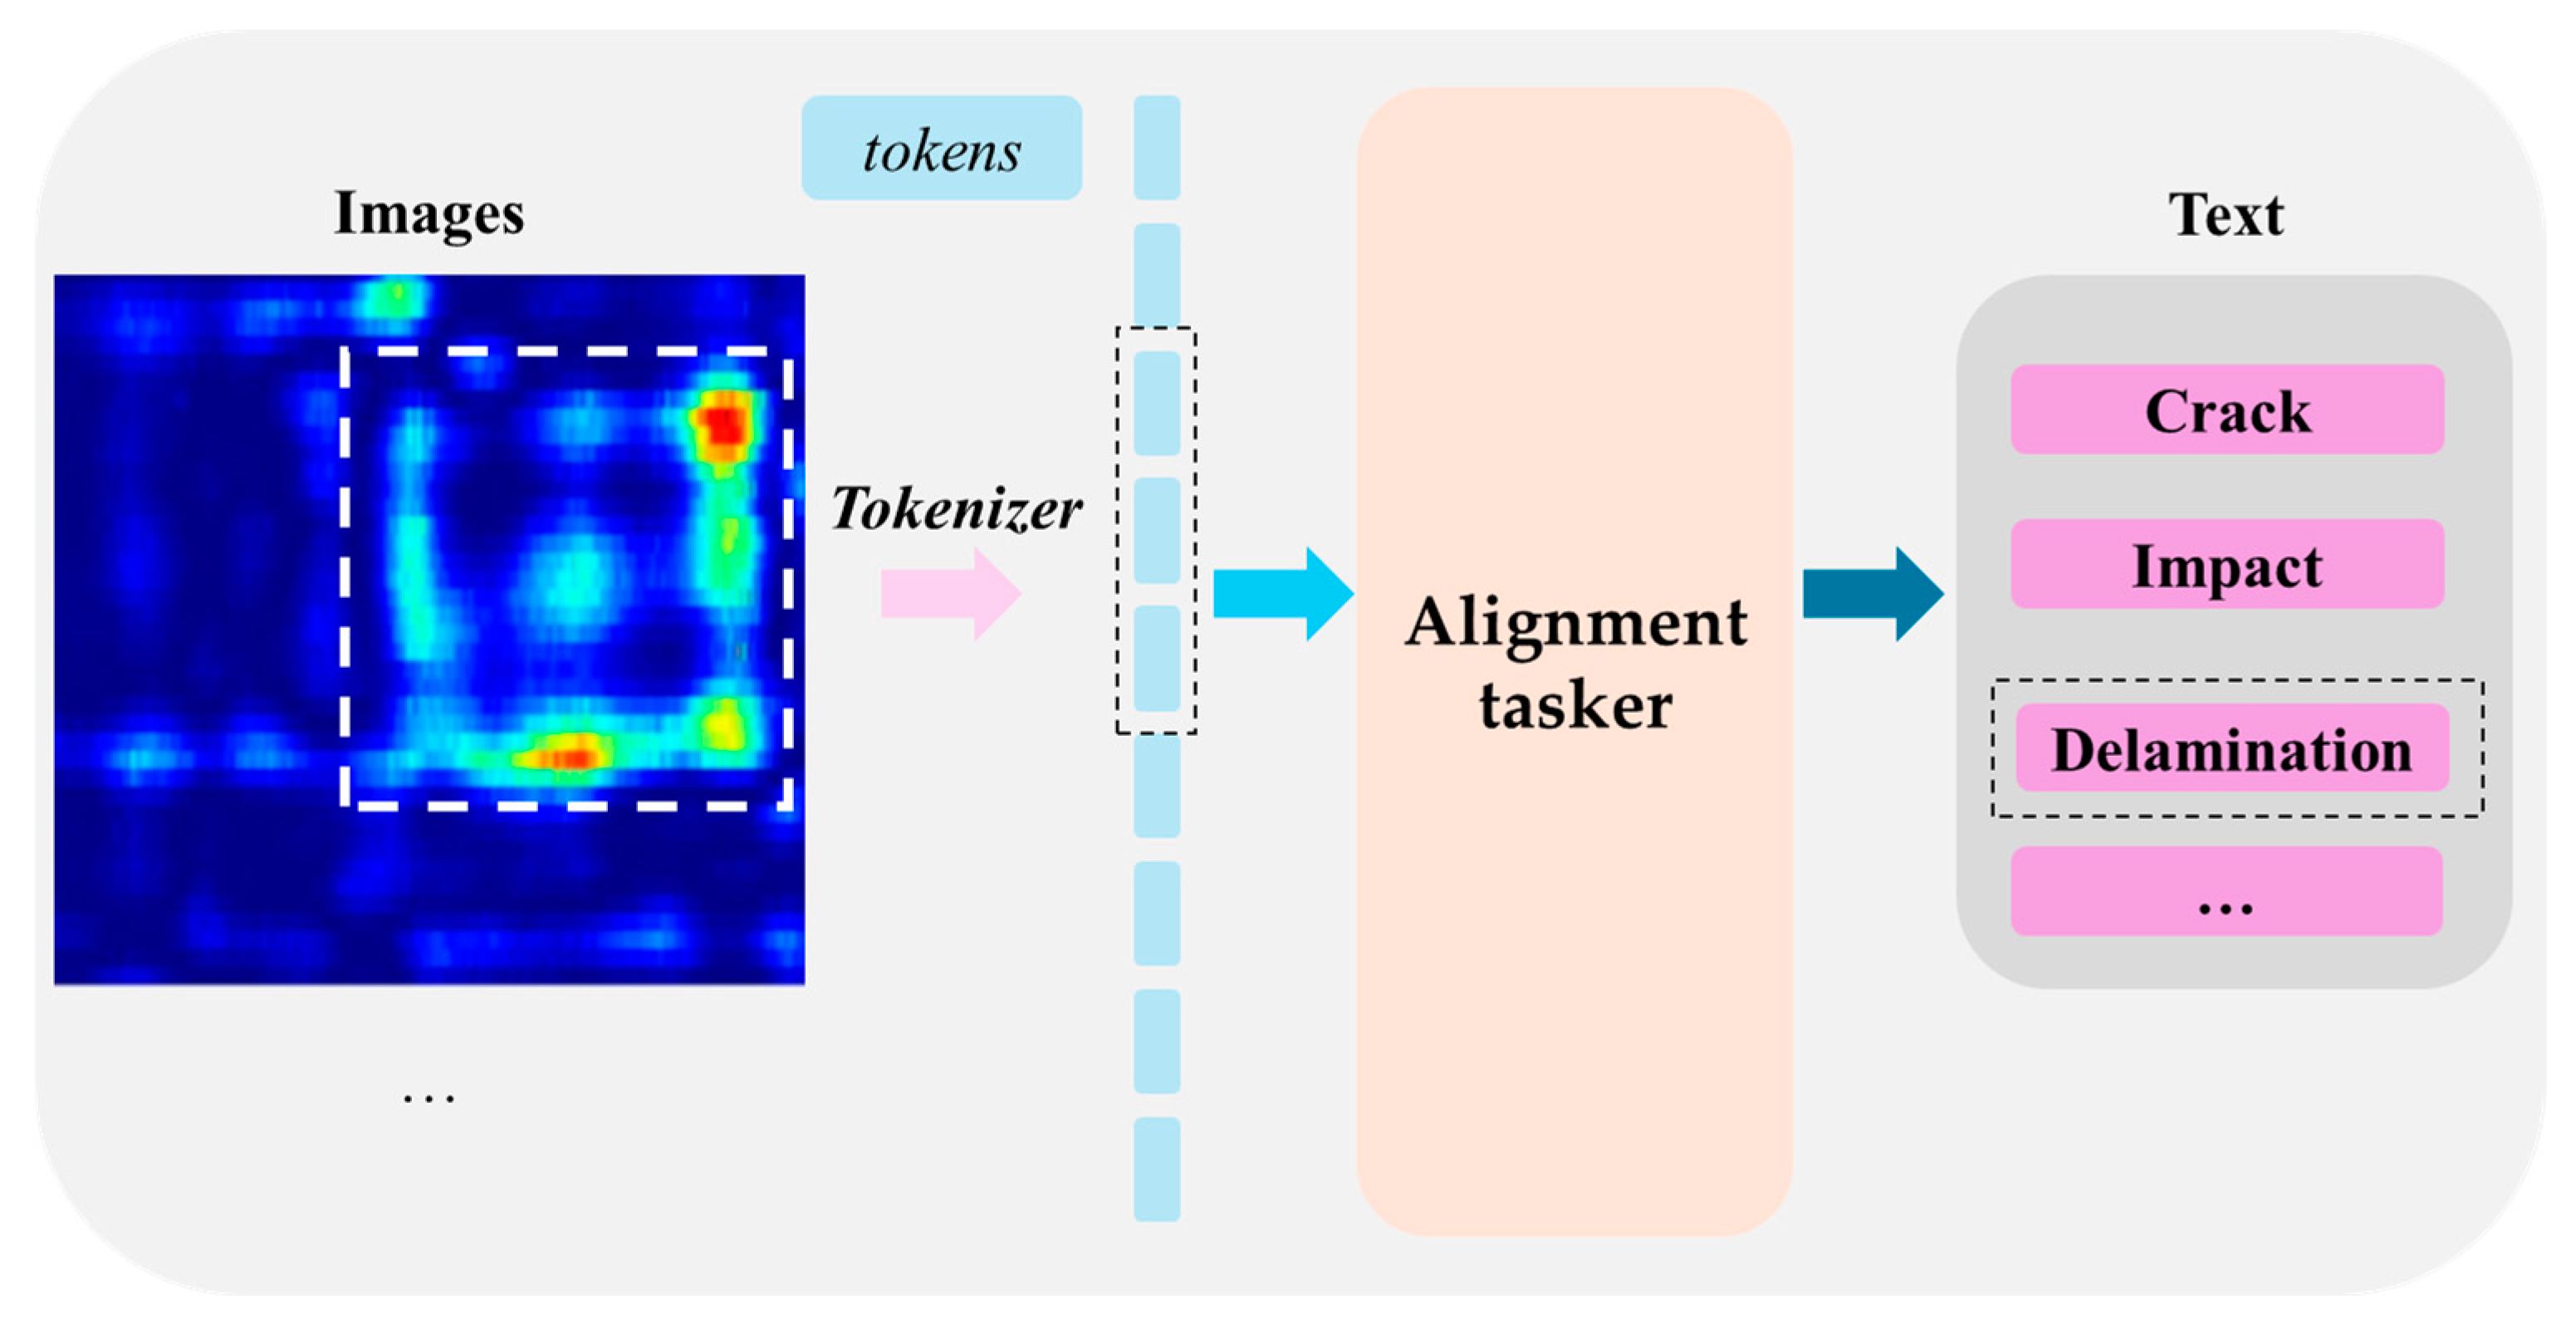
In this study, eddy current testing (ECT) was performed on CFRP defects, including cracks, delamination, and low-velocity impact damage, using a high-precision nine-grid eddy current probe system. The resulting ECT images were augmented using data augmentation techniques, generating training and testing sets for the dual-modal fusion PRI-SWT model. After obtaining these images, machine learning and deep neural network methods were applied to classify the defects. The core aim of this study is the development of the Dual-Modal Parallel Real–Imaginary/Swin Transformer (PRI-SWT) model, which integrates both the real and imaginary components of the eddy current signals. Dual-modal fusion is the process of integrating and leveraging information from two distinct modalities—such as text and images, audio and video, and different types of sensor data—to enhance the understanding and performance of a system. This approach capitalizes on the complementary strengths of each modality, enabling more comprehensive data representations and improved outcomes in tasks such as classification, recognition, and prediction. This dual-modal fusion approach is pivotal as it allows the model to leverage the complementary information from both signal components, enhancing detection accuracy and robustness in classifying CFRP defects.
The integration of real and imaginary data is crucial for capturing the complex characteristics of defects. Traditional methods, which often rely on single-modality inputs, may miss critical information, potentially leading to misclassification. By incorporating dual modalities, the PRI-SWT model offers a more comprehensive understanding of defect features, presenting improved generalization across various defect types and conditions. The following sections present the CFRP defect detection and classification algorithm used in this study, highlighting its innovative aspects and the critical role the PRI-SWT model will play in advancing detection capabilities.
3.1. Conventional Methods
3.1.1. Support Vector Machines
Support Vector Machines (SVM) are powerful tools used for linear classification, and they are especially effective in scenarios where the separation of classes is crucial. In this context, we assume that labeled sample data
, where
represents the set of samples. Here,
is the coefficient vector corresponding to the hyperplane. The hyperplane that can separate the linear sample set is expressed as follows:
This leads to an equivalent optimization problem, which can be formulated as follows:
To enhance the model’s robustness and avoid overfitting, a penalty term is introduced. This allows for the development of a more flexible model that can better generalize to unseen data, leading to the following expression:
In this context, is defined as , where is the penalty term, and is the size of the data sample set.
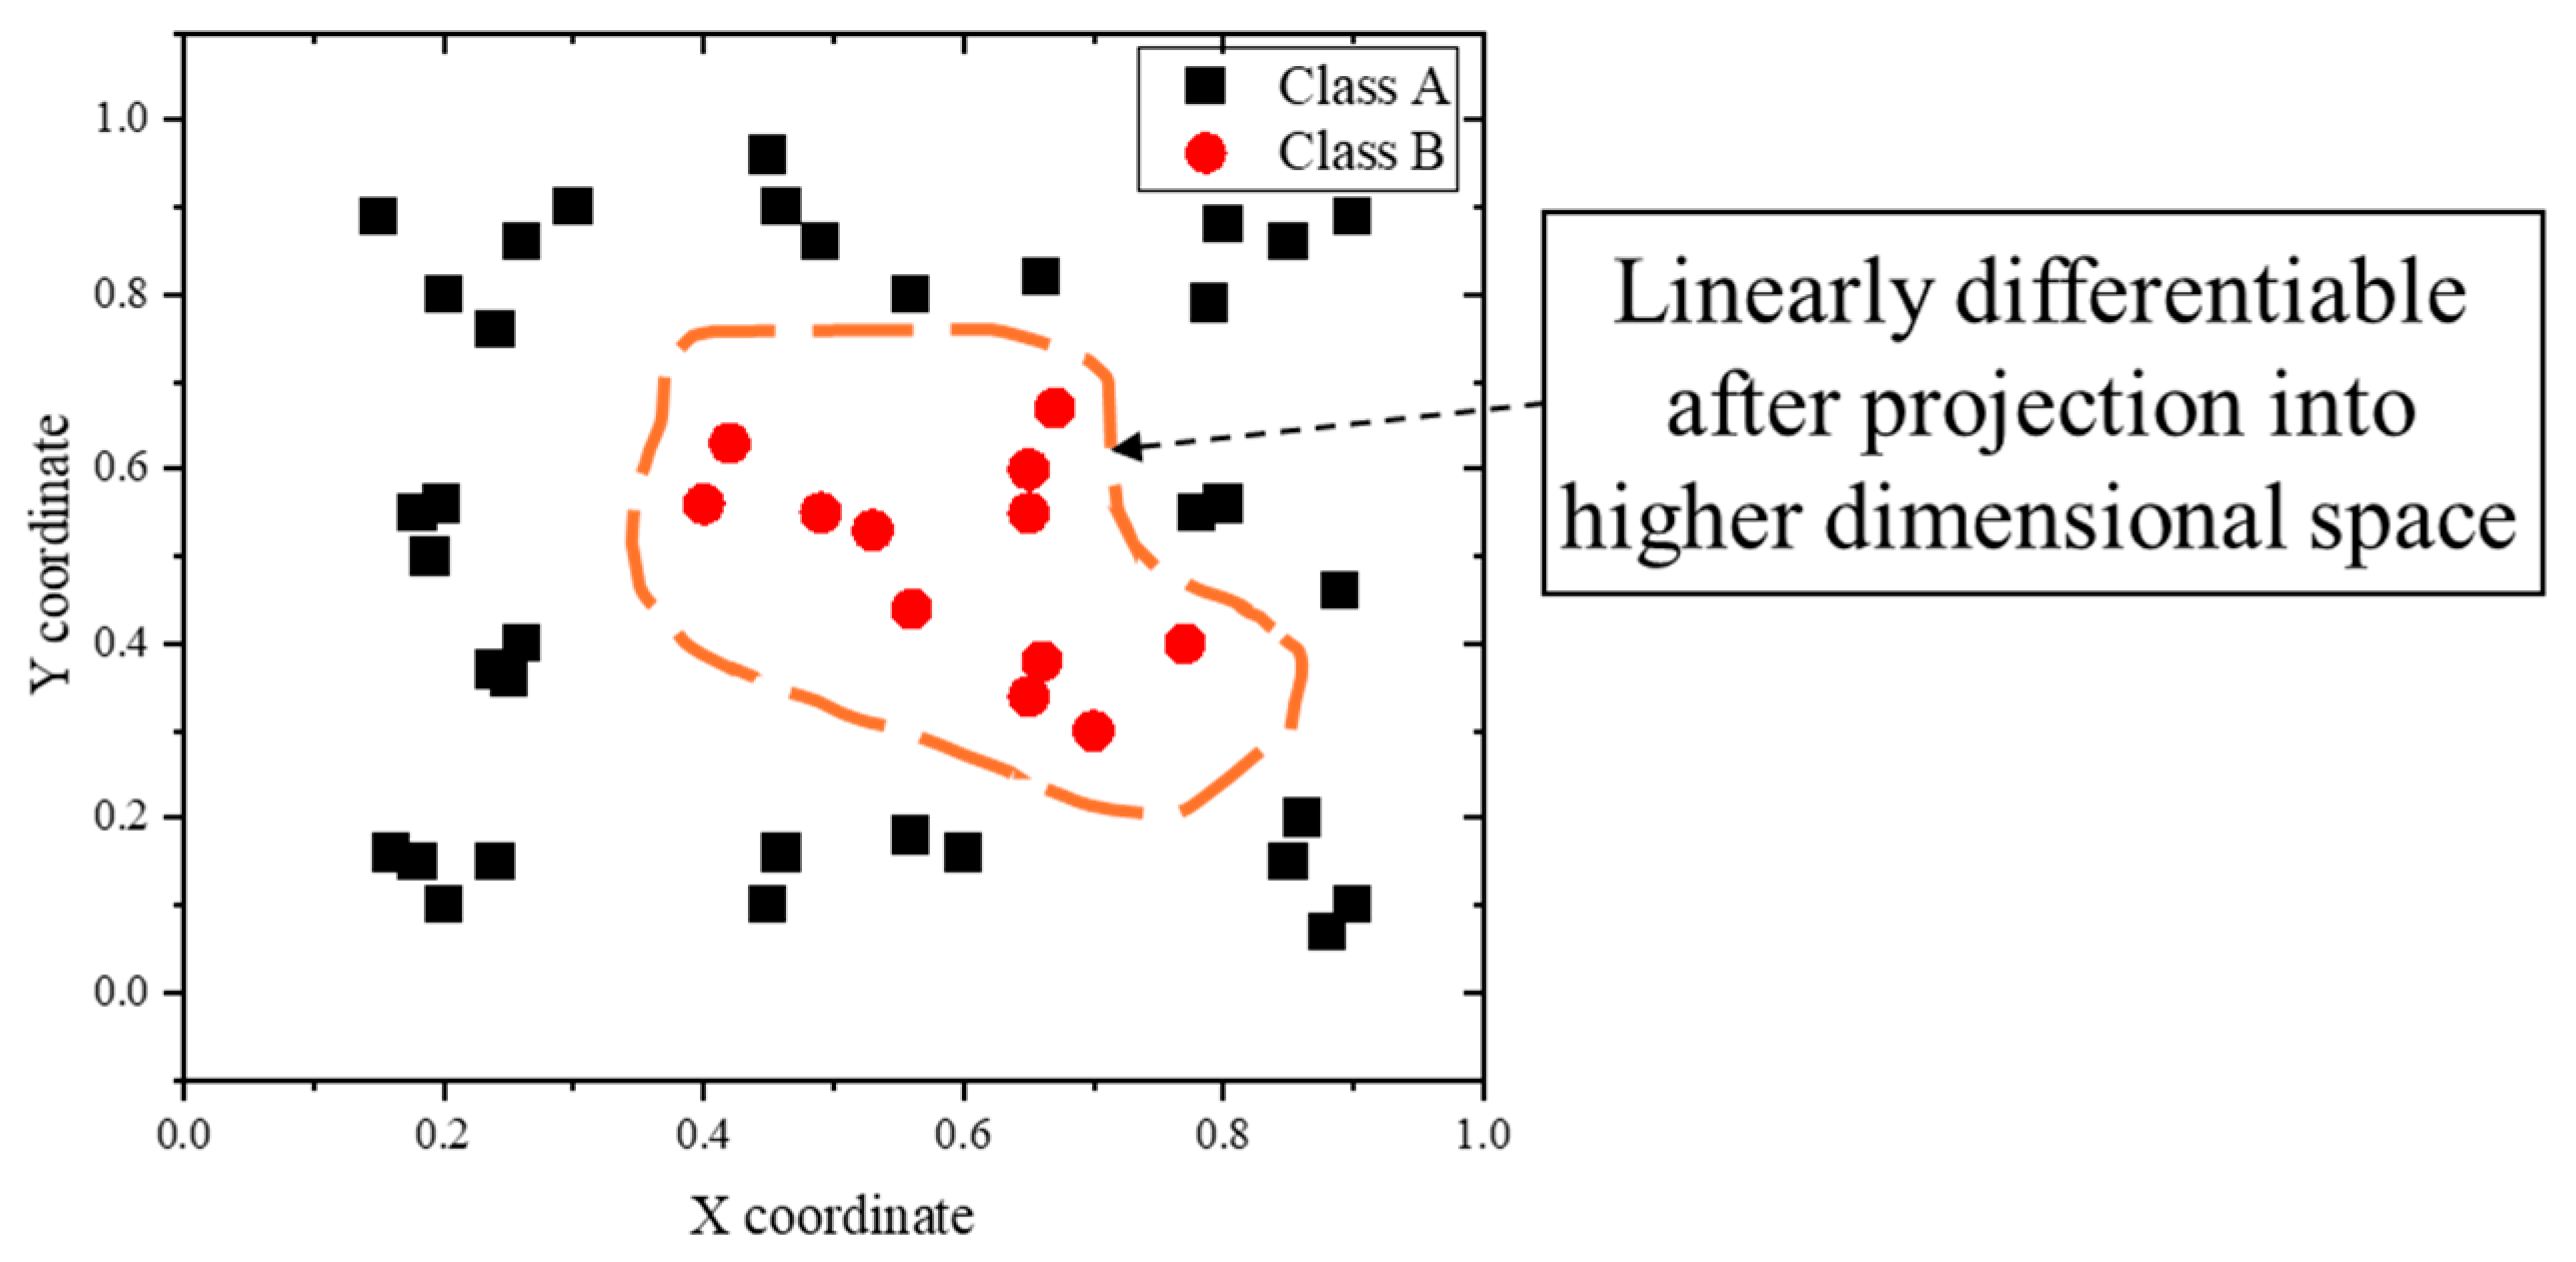
In cases where a dataset is linearly inseparable, it becomes necessary to project the data into a higher-dimensional space using a kernel function. This transformation enables the originally inseparable dataset to become separable in this higher-dimensional space.
Once the data are embedded in this new space, the hyperplane defined by (3) can effectively separate the transformed data, as depicted in
Figure 5.
3.1.2. Vision Transformer Model
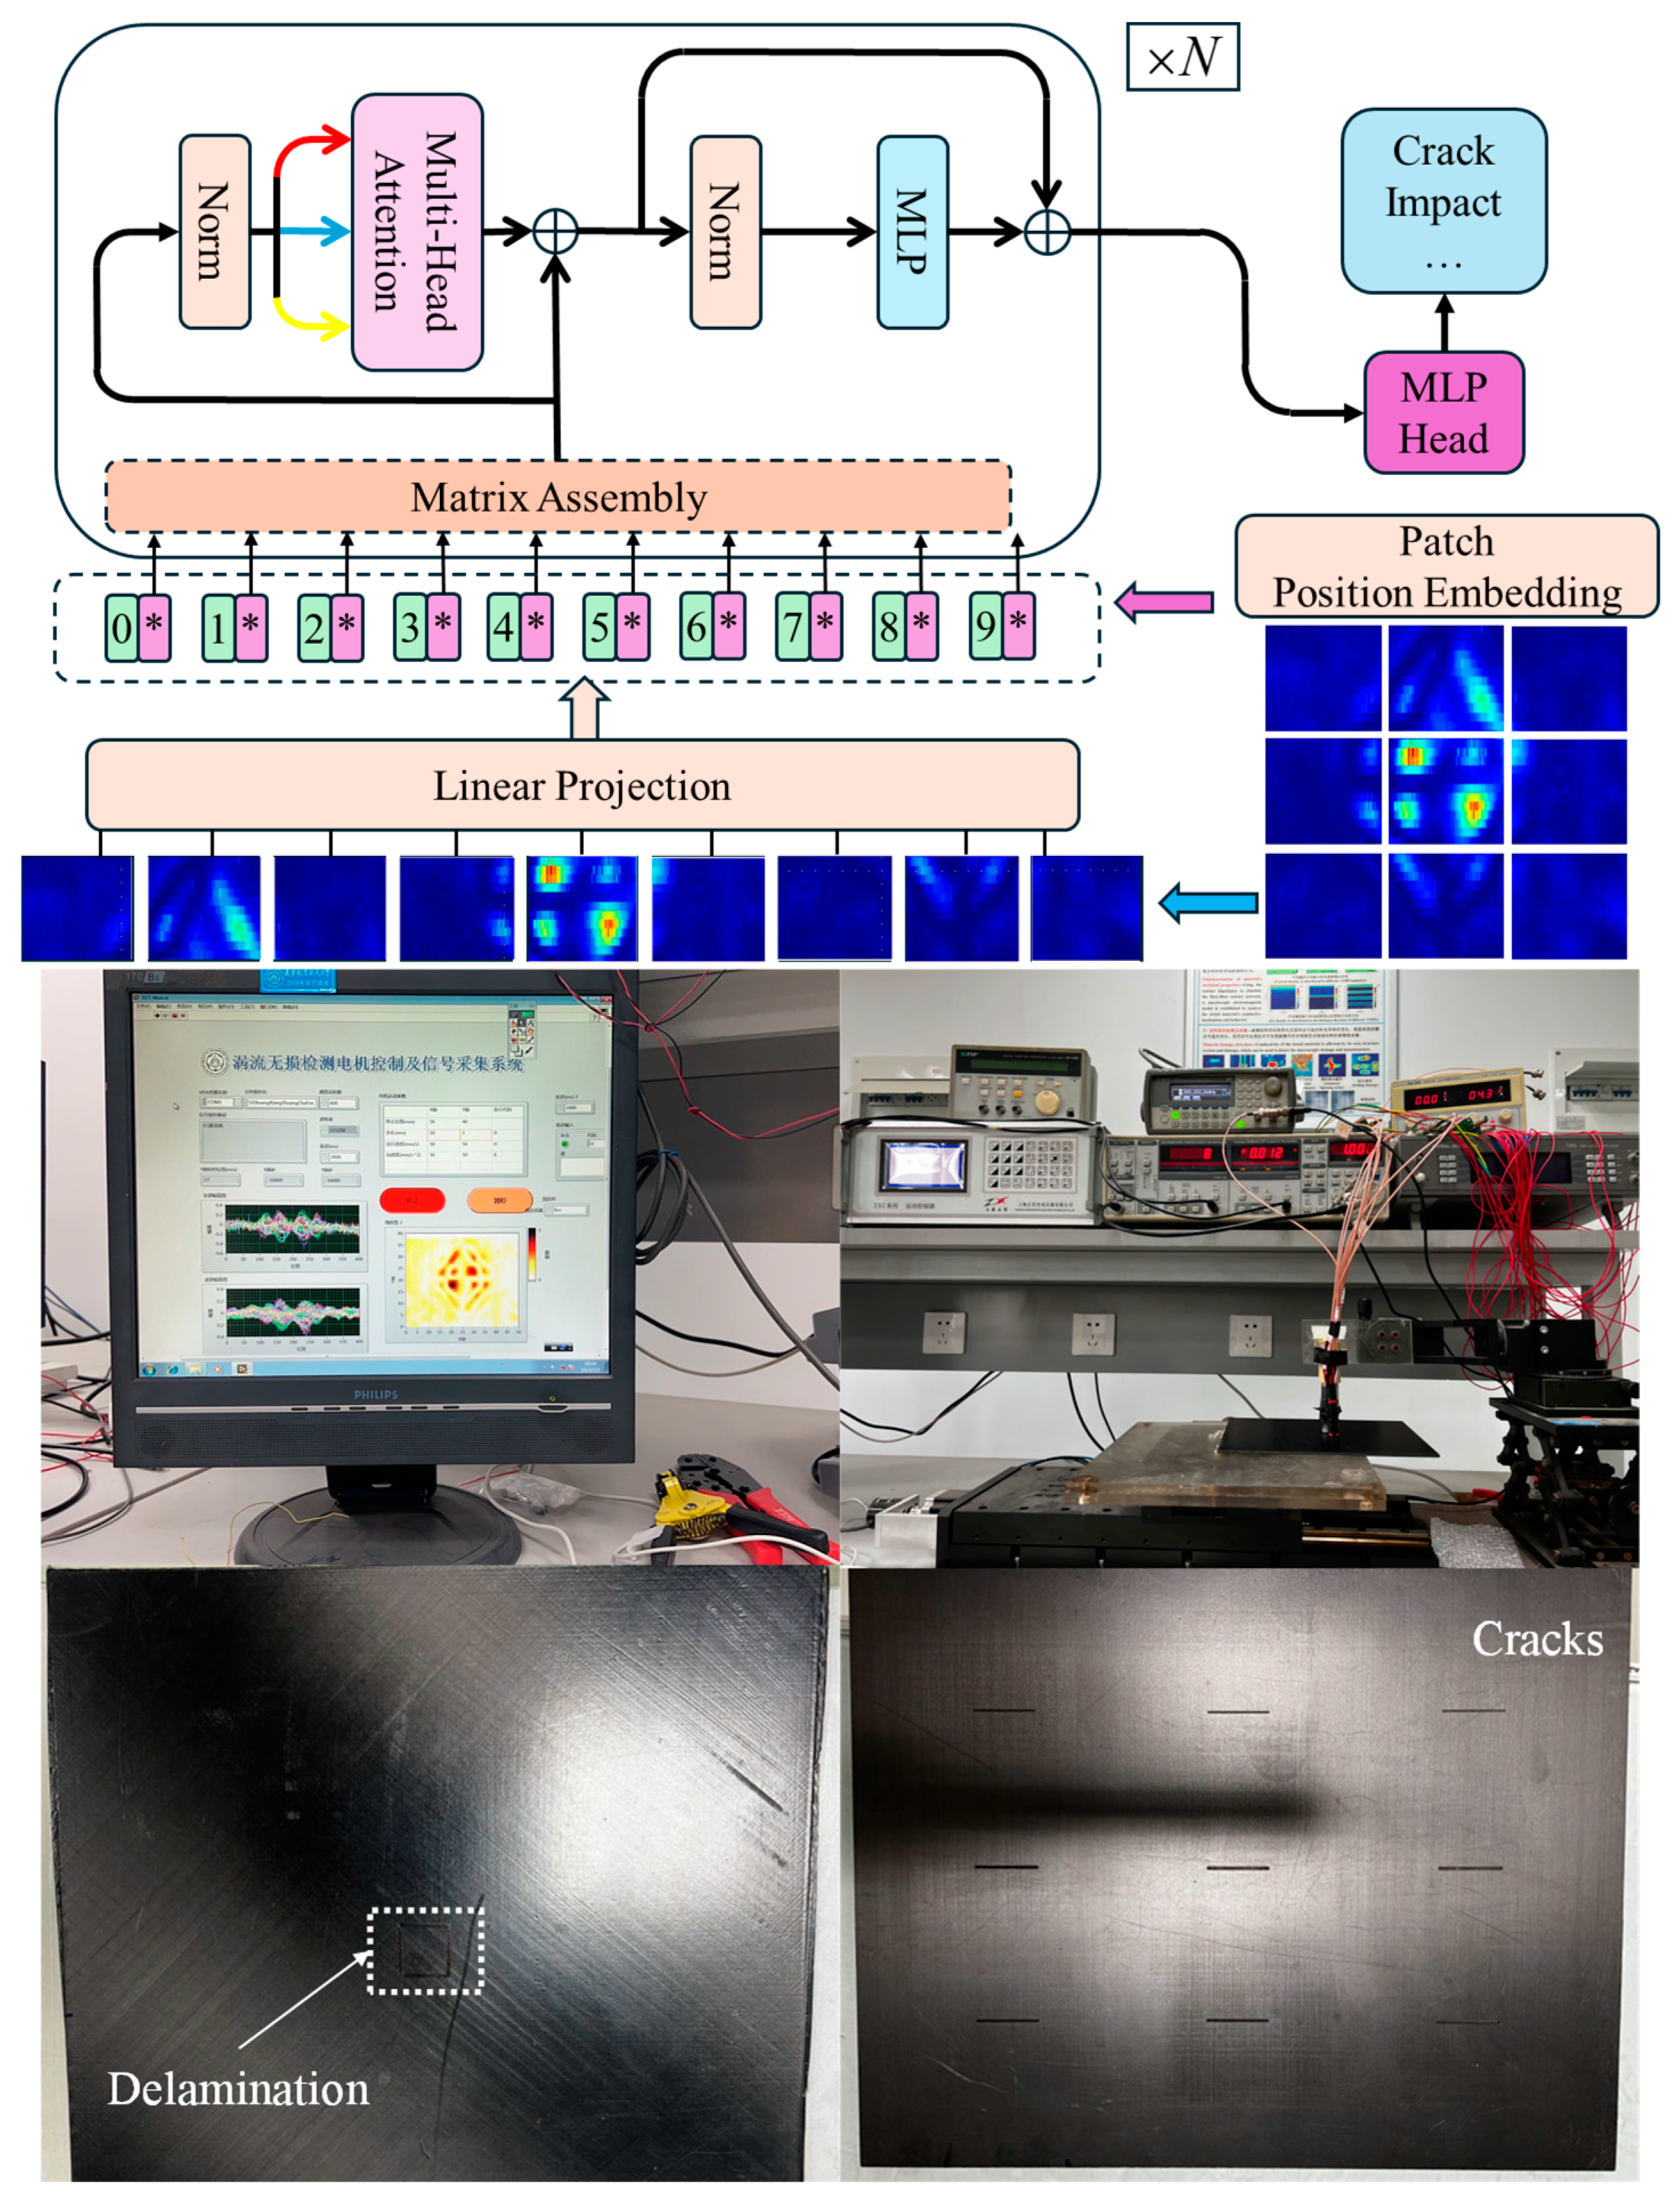
In recent years, advancements in deep learning have led to significant improvements in computer vision tasks, particularly through the development of innovative architectures. One such architecture is the Vision Transformer (ViT), which leverages a self-attention mechanism to effectively analyze visual data. This mechanism enables the model to focus on the correlations between input vector tokens, allowing it to capture global interdependencies in the data. This is an advantage over the limited receptive field of convolutional neural networks (CNNs). The typical structure of a Vision Transformer model is illustrated in
Figure 6. The input images in the model are obtained through the eddy current testing of CFRP specimens with cracks, delamination, and impact damage. This is conducted using the constructed CFRP eddy current nondestructive testing system. The specific experimental setup and CFRP test specimens with defects are shown in
Figure 6.
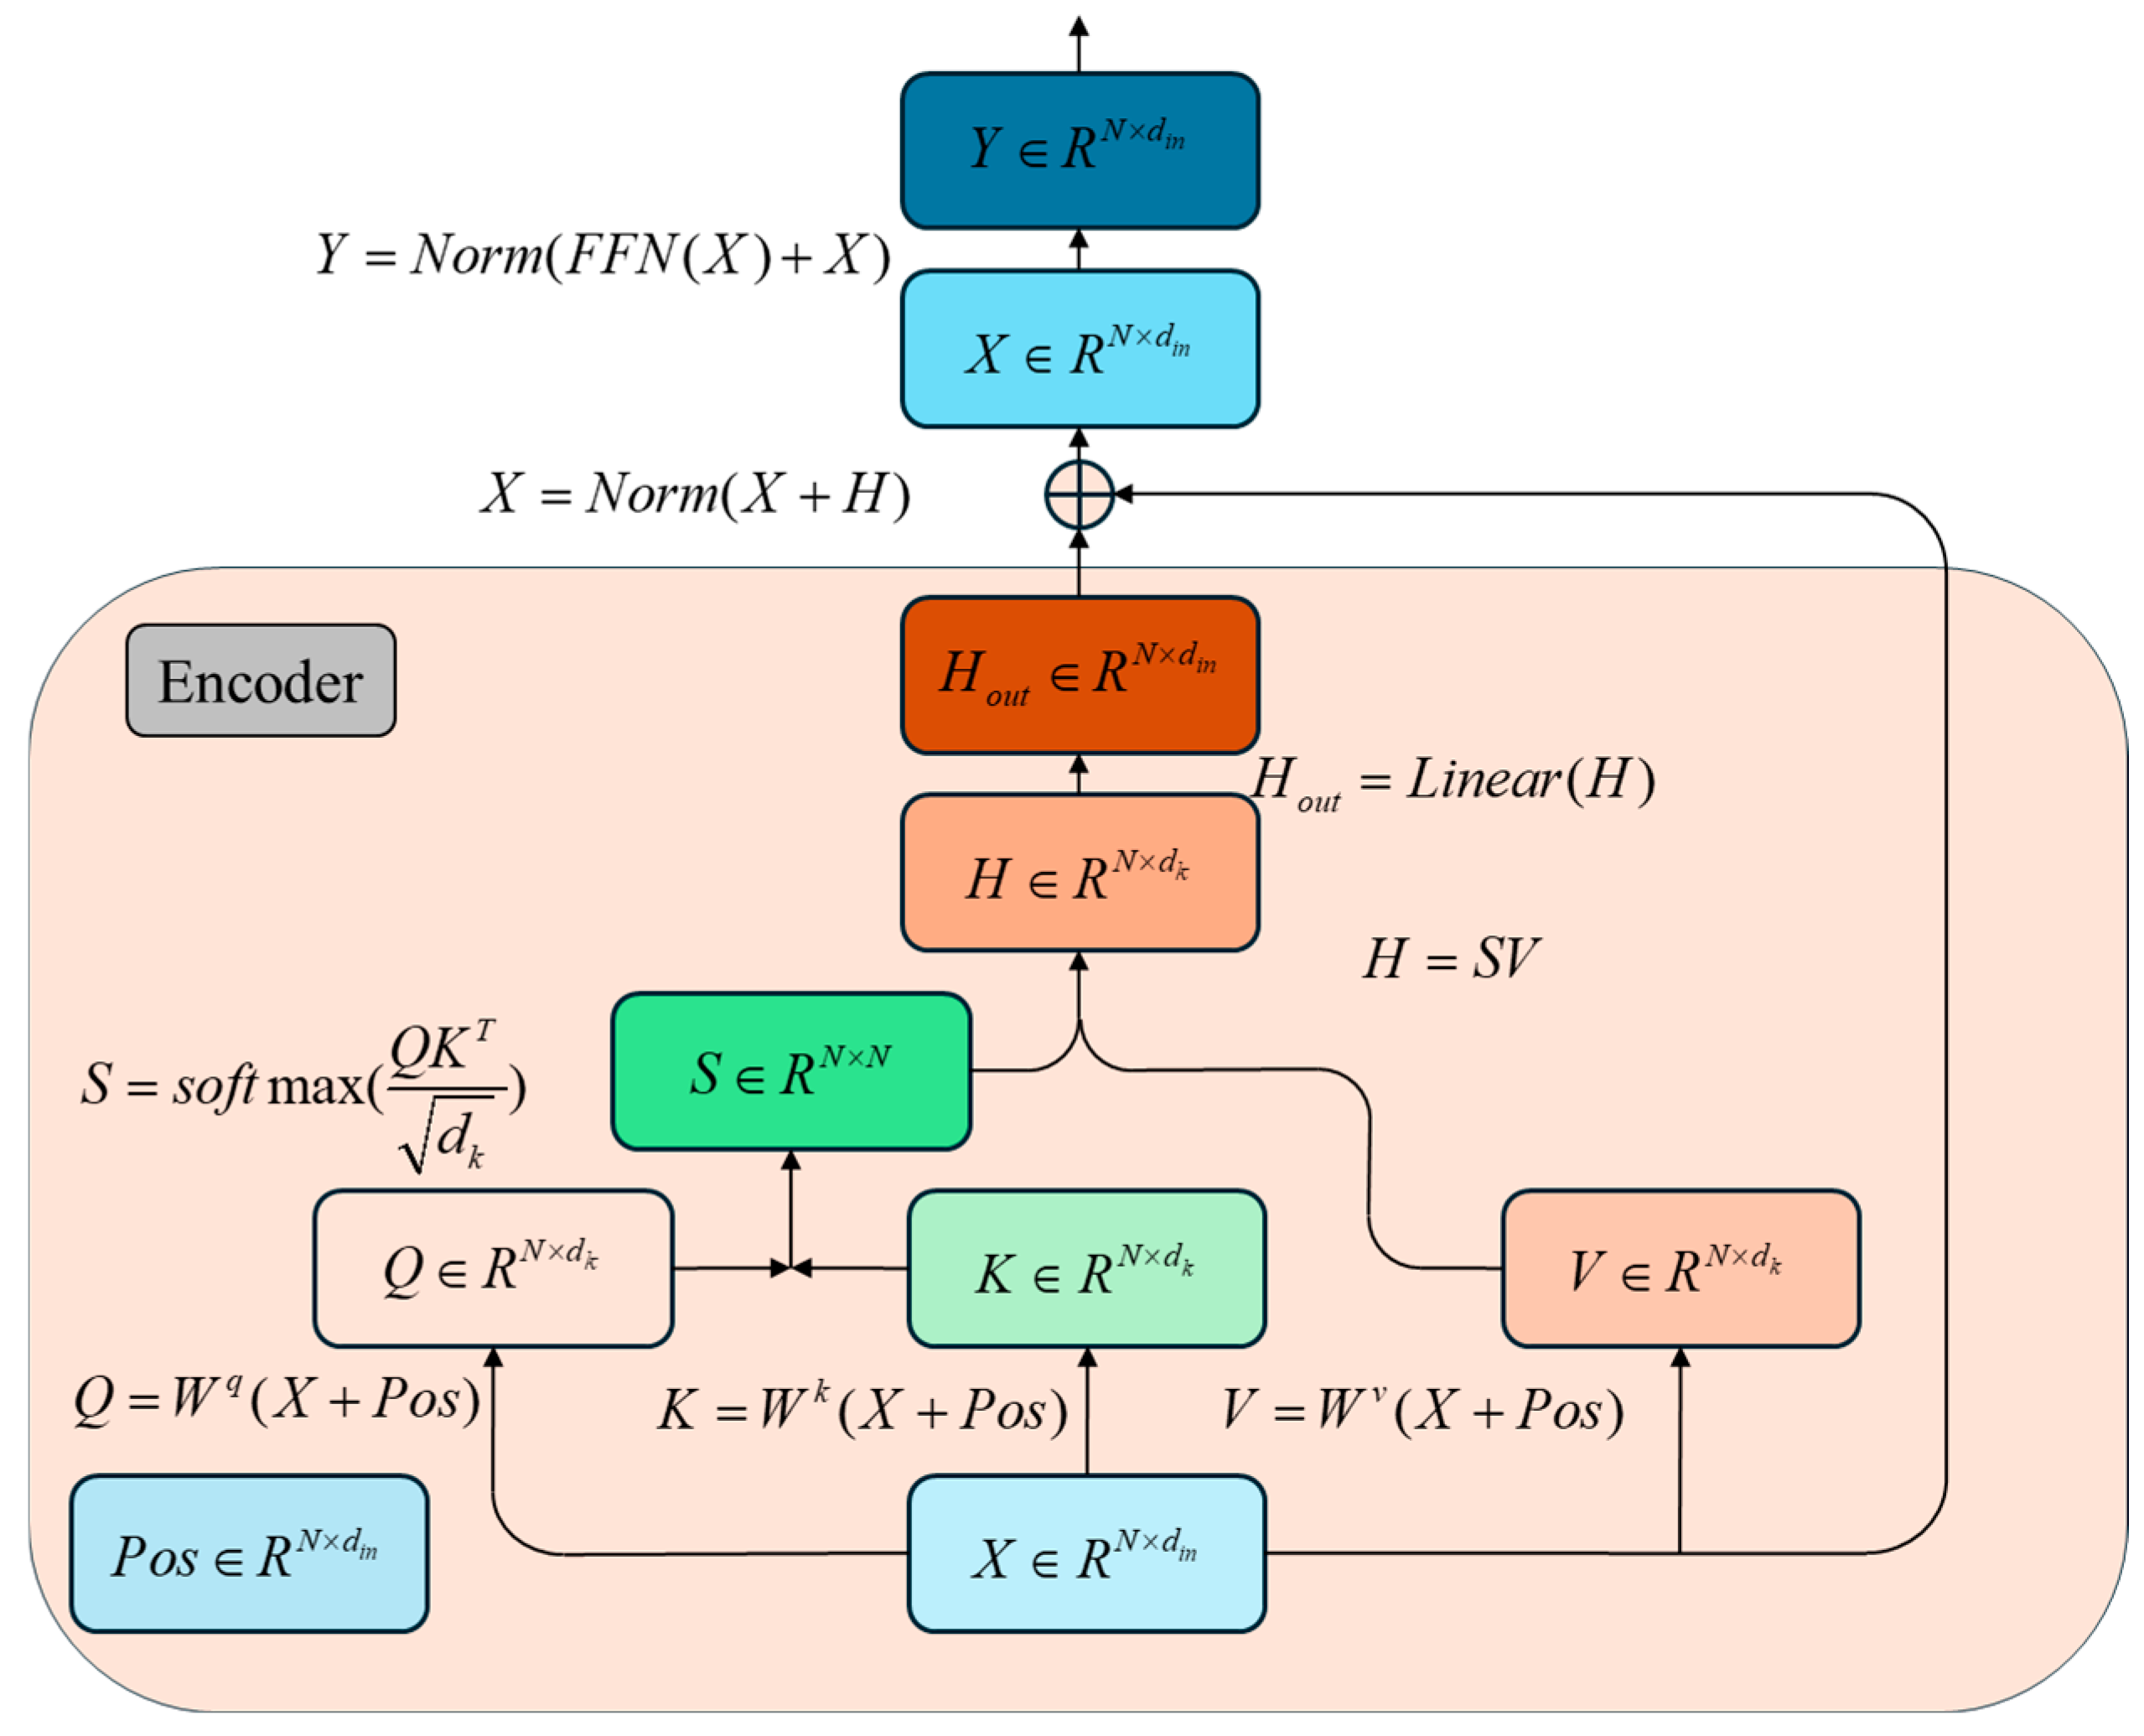
In the Vision Transformer (ViT) model, a “patch embedding” linear mapping layer segments input image data into a sequence of “patches.” A classification token is then added, and these token vectors are passed into the encoder module. The vectors are processed through multiple encoder layers before reaching the classification layer, which outputs the predicted defect categories. The self-attention process, which highlights the relationships between tokens, is illustrated in
Figure 7.
In this process,
denotes query vectors,
indicates key vectors,
represents value vectors,
refers to the self-attention score matrix,
signifies the linear mapping layer,
refers to the normalization layer, and
indicates the feed-forward network layer. Typically, a multi-head self-attention mechanism is employed, where the
and
matrices undergo parallel computation across multiple heads, followed by matrix combination:
where
denotes the weight matrix of the linear projection,
is the input, and
are the corresponding weight matrices. Here,
represents the dimension size of the input vector. In multi-head attention, the linear mapping matrix is partitioned into submatrices with dimensions
, where the number of heads is denoted as
and each head has a dimension
. The resulting single-head matrices
and
each have dimensions of
. When these are concatenated, the output feature map retains the dimensions of
. After passing through a final linear mapping layer
with dimensions of
, the output feature map has the same dimensions as the input feature map. This multi-head self-attention mechanism enables the model to capture more detailed information from the token vectors, thereby enhancing the expressiveness and generalization of the Vision Transformer model.
3.2. Parallel Real–Imaginary/Swin Transformer Multi-Modal Fusion Model
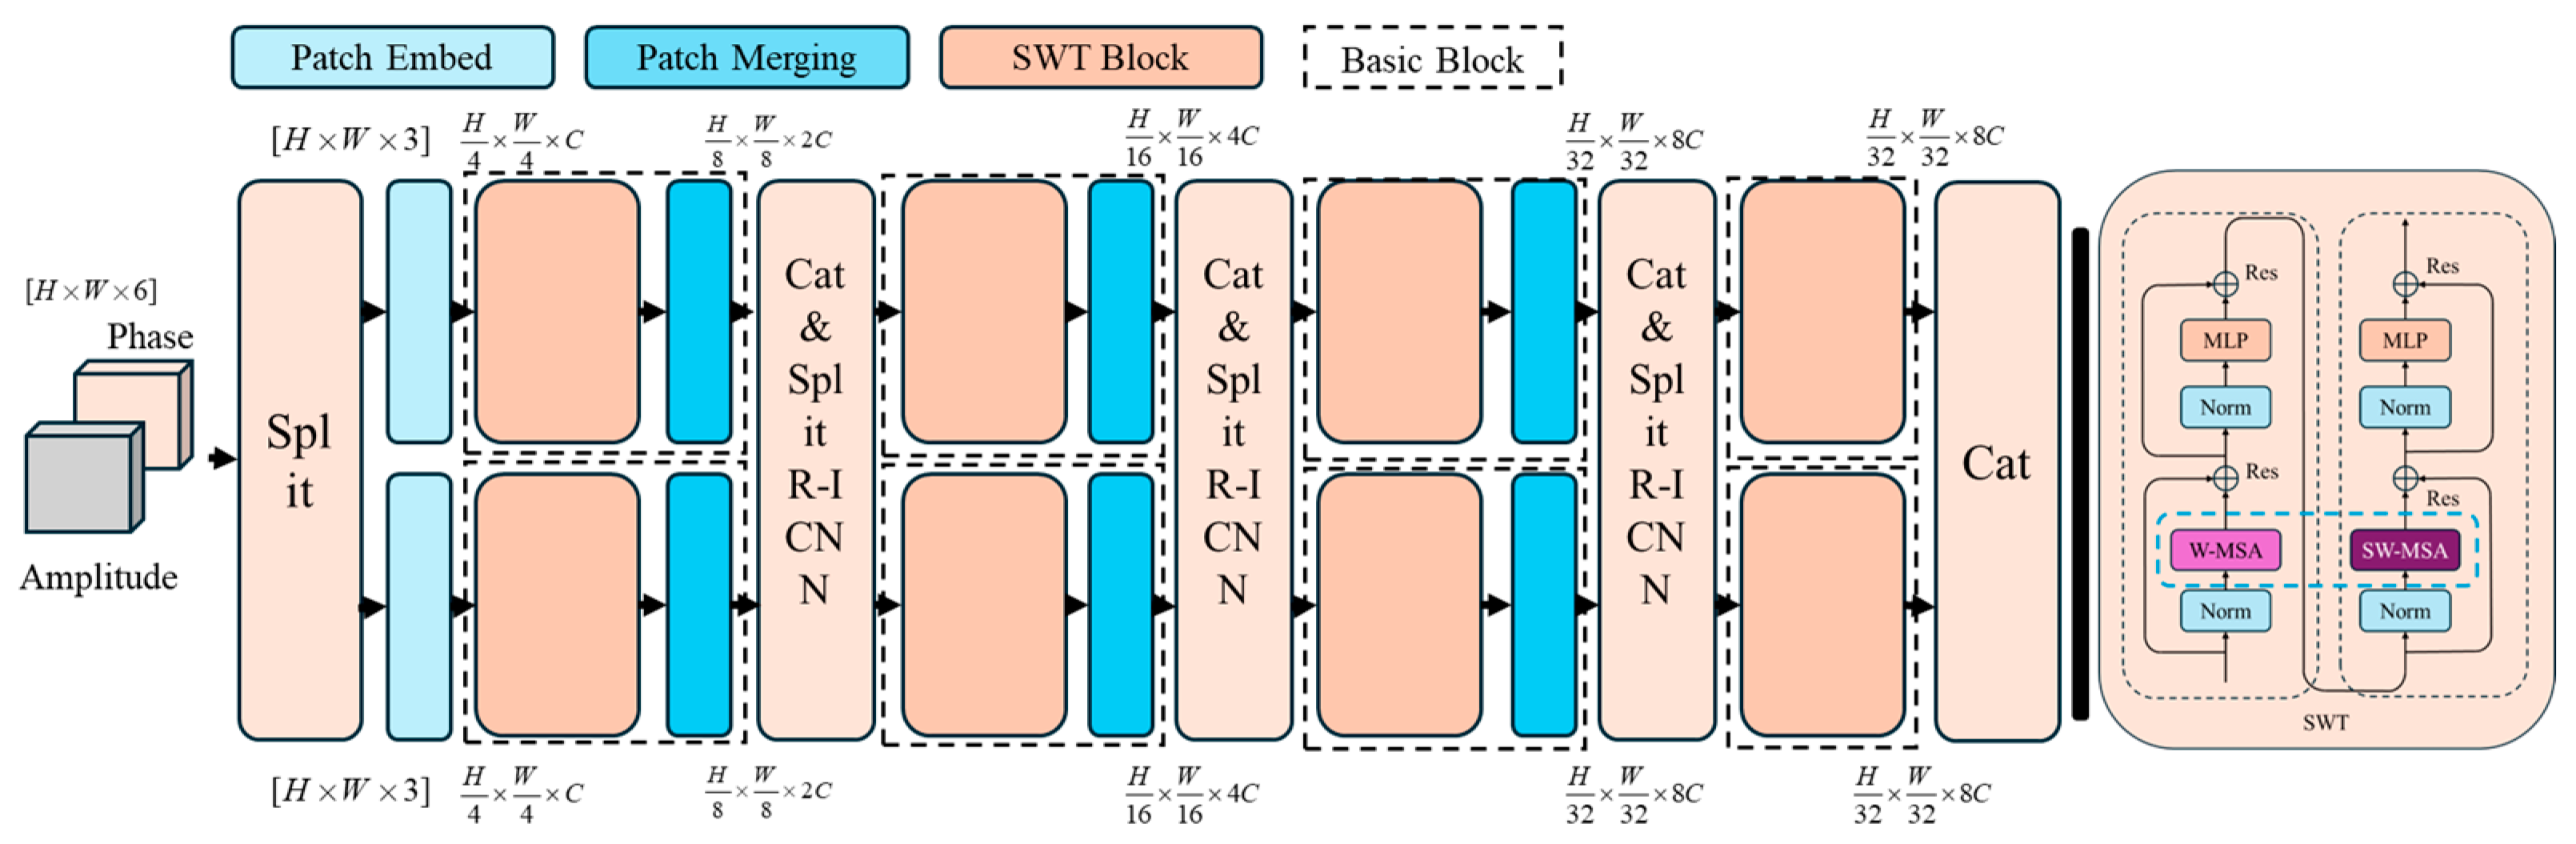
In CFRP eddy current detection, the data consist of two images representing the amplitude and phase information of the sinusoidal signal. To effectively extract defective features, it is crucial to merge these two intrinsically linked images. However, the high resolution and large volume of images pose significant challenges, as the self-attention mechanism in traditional Vision Transformer (ViT) models requires substantial memory and processing power, making it less efficient for such tasks.
To address these issues, the innovative PRI-SWT model was designed, as illustrated in
Figure 8. This model introduces an innovative approach by first concatenating the magnitude phase (or real–imaginary) images along the channel dimension, enabling parallel processing within the PRI-SWT framework. The complex input tensor, which combines the real and imaginary components of the CFRP detection signal, is processed through the first split layer and decoupled into two separate signals. These signals are then directed into two parallel SWT feature extractors—one above the other—to extract feature maps that are rich in low-level semantic information. Subsequently, various fusion layers, such as linear mapping layers or convolutional layers, are utilized to perform feature fusion and the concatenation of the two feature maps, which have different characteristics. This process enables complementary information exchange. The resulting fused feature map is then remapped and decoupled into two distinct feature maps, allowing for further high-level semantic information fusion. The complex input tensor, which integrates both the real and imaginary components of the CFRP detection signal, is processed through the first split layer, effectively decoupling it into two signals. These signals are subsequently routed into two parallel SWT feature extractors—one positioned above the other—to extract feature maps rich in low-level semantic information. Following this, different types of fusion layers, such as linear mapping layers or convolutional layers, are employed to perform feature fusion between the two distinct feature maps. This process facilitates complementary information exchange. The resulting fused feature map is then mapped and decoupled again into two separate feature maps, allowing for the continuation of high-level semantic information fusion. The PRI-SWT model not only addresses the computational challenges posed by high-resolution image data but also maximizes the utilization of complementary information from the amplitude and phase signals, thereby improving the accuracy and robustness of CFRP defect detection. Its ability to efficiently process large-scale data while preserving critical defect features demonstrates its superiority in tackling complex defect detection tasks.
To enhance the exchange of information between different windows, the windows are artificially shifted, allowing for new self-attention feature maps to be calculated within these shifted windows, as depicted in
Figure 9. This method not only optimizes the attention mechanism but also ensures that crucial defect features are effectively captured. Finally, the relevant features are extracted through real–imaginary (R-I) convolutional layer fusion, producing classification results after several stages of processing.
The design of the dual-modal fusion approach used in the PRI-SWT model is both innovative and essential in addressing the limitations of existing methods. It significantly improves classification performance, as will be demonstrated in subsequent validation experiments, where the PRI-SWT model is shown to outperform traditional classifiers such as SVM and ViT.
4. Results Analysis
4.1. Evaluation Indicators
To rigorously validate the effectiveness of the proposed PRI-SWT model and to clearly demonstrate its advantages over traditional methods such as SVM and ViT, a thorough performance evaluation is required. Establishing a set of comprehensive evaluation metrics is critical for ensuring a robust comparison. These indicators will not only quantify classification accuracy but also provide valuable insights into each model’s specific strengths and limitations. The following key metrics have been identified to assess model performance:
Confusion matrix: This matrix provides a detailed analysis of the model’s classification performance across multiple categories. It reveals the level of confusion between categories and highlights the probability of misclassification, offering valuable insights into areas where the model may struggle.
Top-1 accuracy and top-2 accuracy: These metrics evaluate accuracy by determining whether the correct classification result appears within the first- or second-ranked categories in the probability list produced by each classification node. These metrics are crucial for understanding the model’s ability to deliver correct classifications.
We used the following macro indicators:
Precision: defined as the ratio of the diagonal element in the confusion matrix to the sum of the elements in the corresponding row, precision indicates how many of the selected instances are relevant.
Recall: calculated as the sum of the elements in the corresponding column, recall measures the model’s ability to identify all relevant instances.
Macro-R:
where
and
are the precision and recall values for each category, respectively, and
is the number of categories.
This metric provides the harmonic mean value of precision and recall, offering a single score that captures both aspects of performance. It balances the trade-off between precision and recall, making it a valuable measure of overall classification effectiveness.
Kappa coefficient: This metric assesses the consistency of classification outcomes. Higher Kappa values typically indicate greater accuracy and reliability regarding the model’s predictions. The Kappa coefficient is calculated as follows:
where
represents the observed agreement, and
represents the expected agreement by chance.
4.2. Model Configuration
To effectively address the triple classification problem of CFRP defects, experiments were conducted using the PRI-SWT, ViT, and SVM models within a carefully structured experimental setup. The implementation was performed using Python 3.9 and Torch 2.0, with computations accelerated by an NVIDIA GeForce RTX 3080 graphics card to ensure optimal performance. To maintain consistency across the dataset, all images in the sample set were uniformly resized to 224 × 224 pixels. The specific parameters used for model configuration are detailed in
Table 1 below.
4.3. Model Comparisons
Following the model’s configuration, the consistent and fair comparison of classification performance was ensured by maintaining uniform dataset segmentation and parameters across the PRI-SWT, SVM, and ViT models. Both SVM and ViT were trained using either magnitude or phase images. The confusion matrices are shown in
Figure 10, where 1 corresponds to crack defects, 2 to delamination, and 3 to impact damage. The detailed performance metrics for each model are presented in
Table 2.
Building on the previous performance comparison, the PRI-SWT model demonstrates significant improvements over traditional methods. The ViT model, when using phase images, achieved macro-P, macro-R, macro-F1, and Kappa scores of 88.1%, 85.8%, 86.9%, and 80.9%. In comparison, the PRI-SWT model improved these metrics by 7.1%, 8%, 7.6%, and 11.5%, respectively, due to its ability to fuse magnitude and phase information from CFRP eddy current detection. This fusion ensures the comprehensive extraction of defect characteristics and reduces the risk of missing key information when relying on a single image.
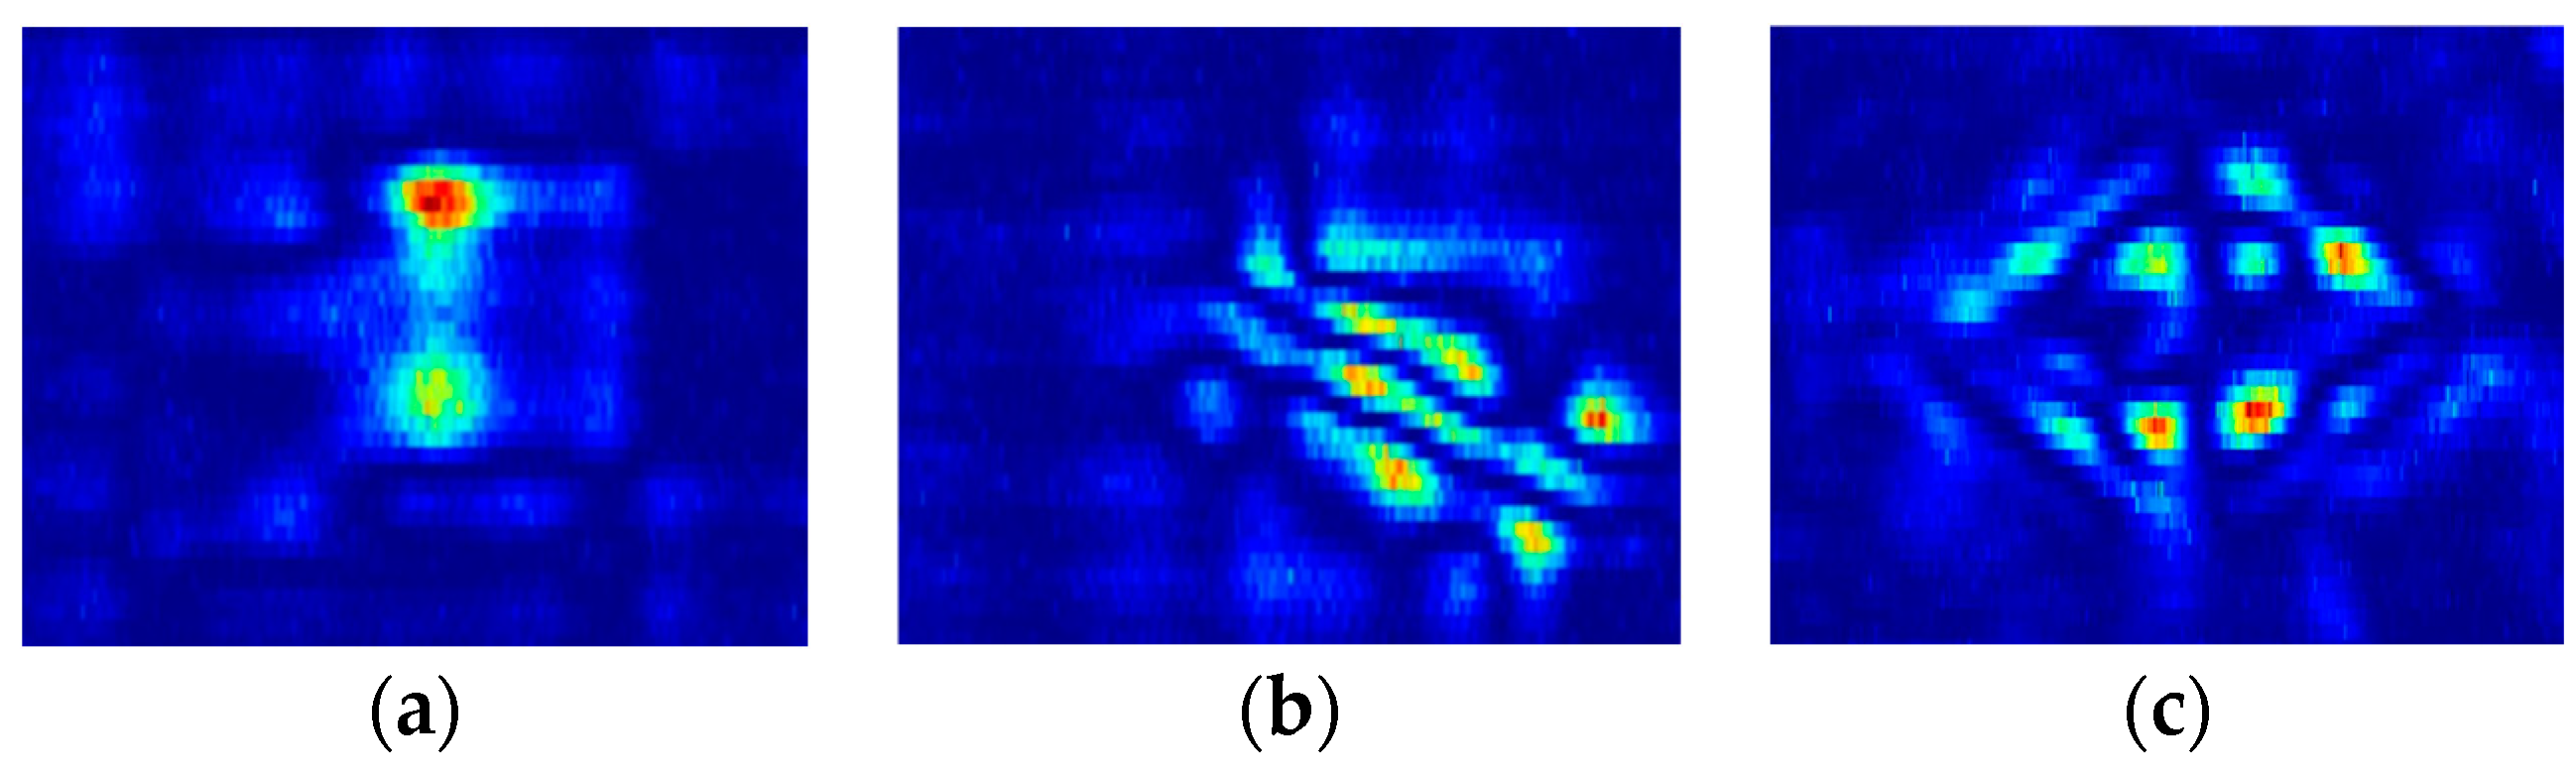
CFRP defects vary widely in terms of size, with cracks ranging from small to medium scales, and impact damage covering larger areas, as shown in
Figure 11.
CNN models, while generally more sensitive to smaller features, tend to struggle with larger defects. In contrast, the PRI-SWT model, utilizing Transformer capabilities, captures both small- and large-scale features, resulting in significantly improved classification performance.
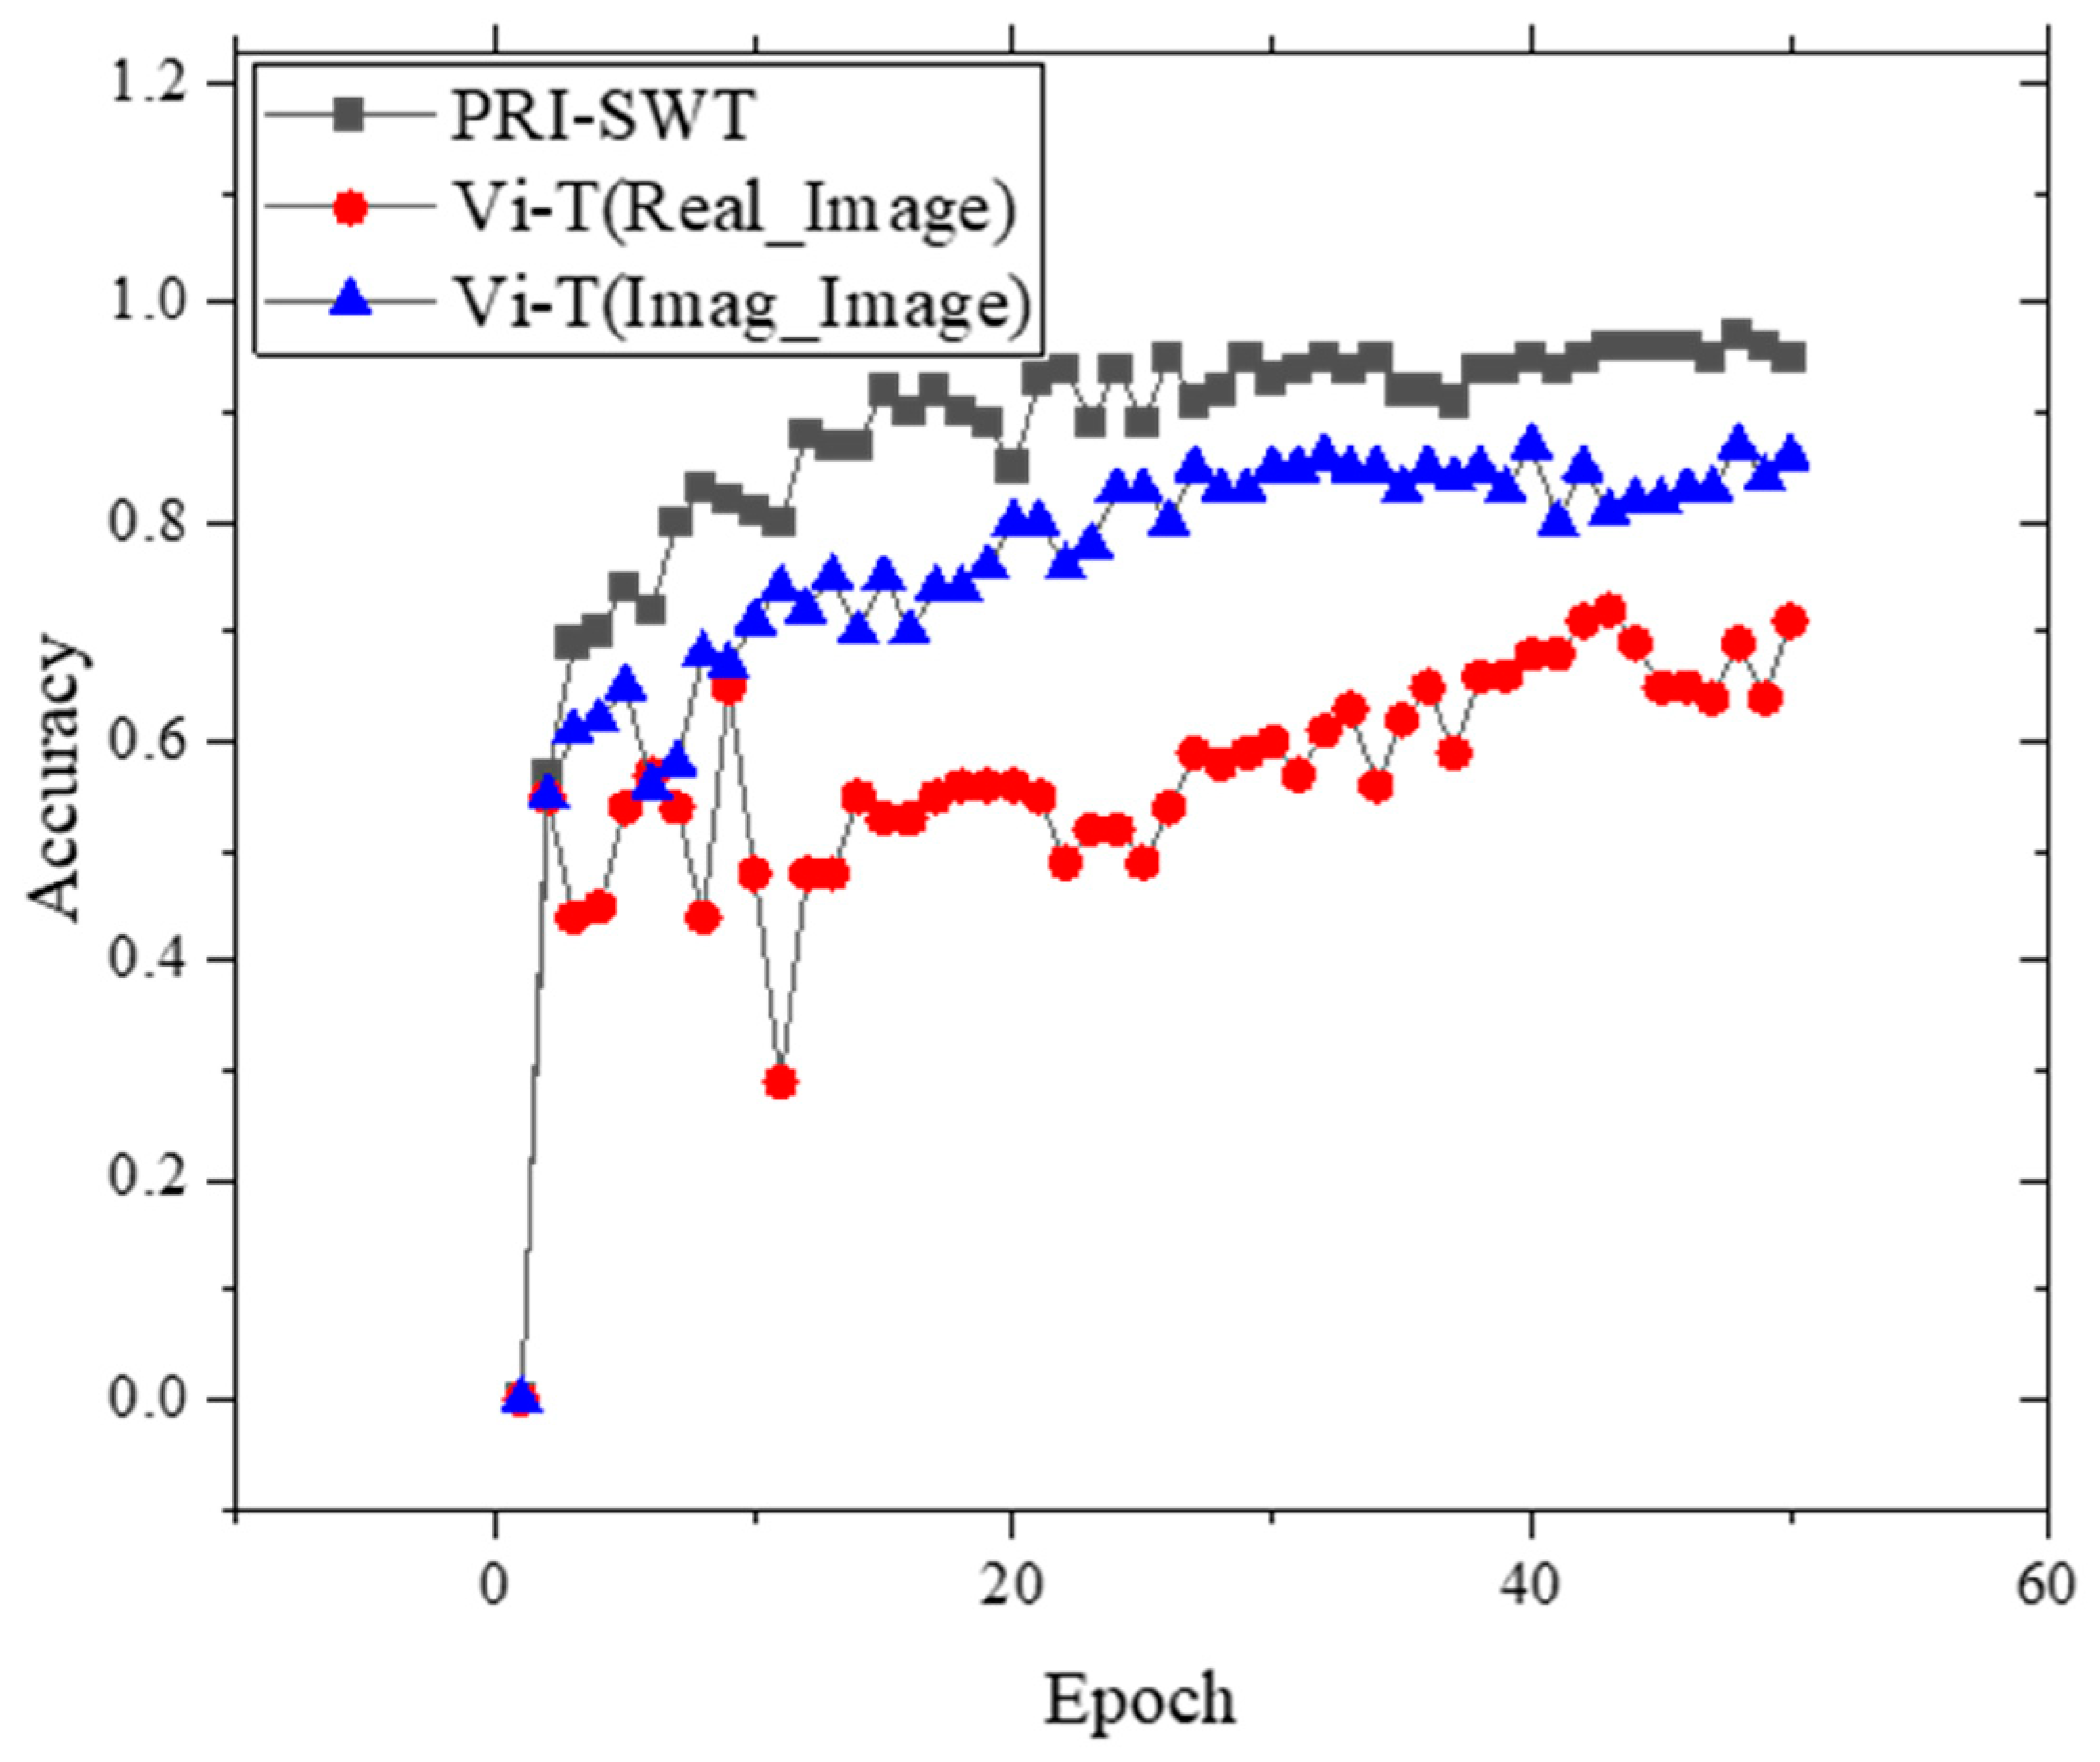
The validation set accuracy versus epoch training curves for both the ViT and PRI-SWT models are illustrated in
Figure 12. The PRI-SWT model not only demonstrates superior convergence during training, achieving up to 97% accuracy on the validation set, but also outperforms the ViT model in terms of both speed and stability. As shown in
Figure 12, the training curves indicate that PRI-SWT converges more rapidly and maintains higher accuracy throughout the process. This enhanced performance is attributed to its innovative architecture, which effectively merges magnitude and phase information for the more comprehensive extraction of defect characteristics. The PRI-SWT model stabilizes around epoch 20, showcasing its robustness in handling the complexities of CFRP defect classification.
4.4. Ablation Experiment
Building on the strong performance of the PRI-SWT model, ablation experiments were conducted to further investigate which design choices most significantly contribute to its classification accuracy. These experiments are crucial for optimizing model architecture and understanding the impact of various components. The focus was on evaluating different fusion network architectures—comparing convolutional versus linear mapping layers to integrate real and imaginary information—as well as assessing the influence of moving window size, network depth, and embedding vector dimensionality within the PRI-SWT model.
4.4.1. R-I Fusion Layer
The selection of real–imaginary fusion layers is critical for optimizing classification performance within the PRI-SWT model. This study compared two fusion approaches—2D convolutional layers and linear projection layers—while also analyzing the effect of varying the number of layers.
Figure 13 presents the confusion matrices, where categories 1, 2, and 3 represent cracking, delamination, and low-velocity impact damage, respectively.
In the early stages of training, the linear projection fusion layer showed a clear advantage, with a steeper increase in accuracy compared to other methods. As training progressed, the accuracy across all models stabilized at around 95%, with the PRI-SWT model achieving the highest accuracy of 97% using a single linear mapping layer. The detailed multi-classification metrics for each model are summarized in
Table 3.
Notably, the data indicate that increasing the number of fusion layers did not enhance performance, which was likely due to overfitting. The PRI-SWT model, utilizing a single linear mapping layer, demonstrated superior metrics, with a macro-F1 score 1.7% higher and a Kappa coefficient 2.6% higher than the corresponding scores of a model with a single convolutional fusion layer. These results highlight the effectiveness of the linear projection approach in capturing relevant features while maintaining model robustness, establishing the PRI-SWT model as a superior choice for CFRP defect classification. The superior performance of the linear mapping layer over the convolutional layer in the PRI-SWT model can be attributed to several key factors. First, the linear layer enables a simpler, more direct transformation of the real and imaginary components, preserving crucial cross-modal relationships. Second, it reduces the risk of overfitting because it has fewer parameters, as evidenced by the drop in performance with additional convolutional layers. Finally, the linear projection efficiently merges magnitude and phase information, resulting in faster convergence and improved feature extraction, leading to higher classification accuracy.
4.4.2. Shift Window
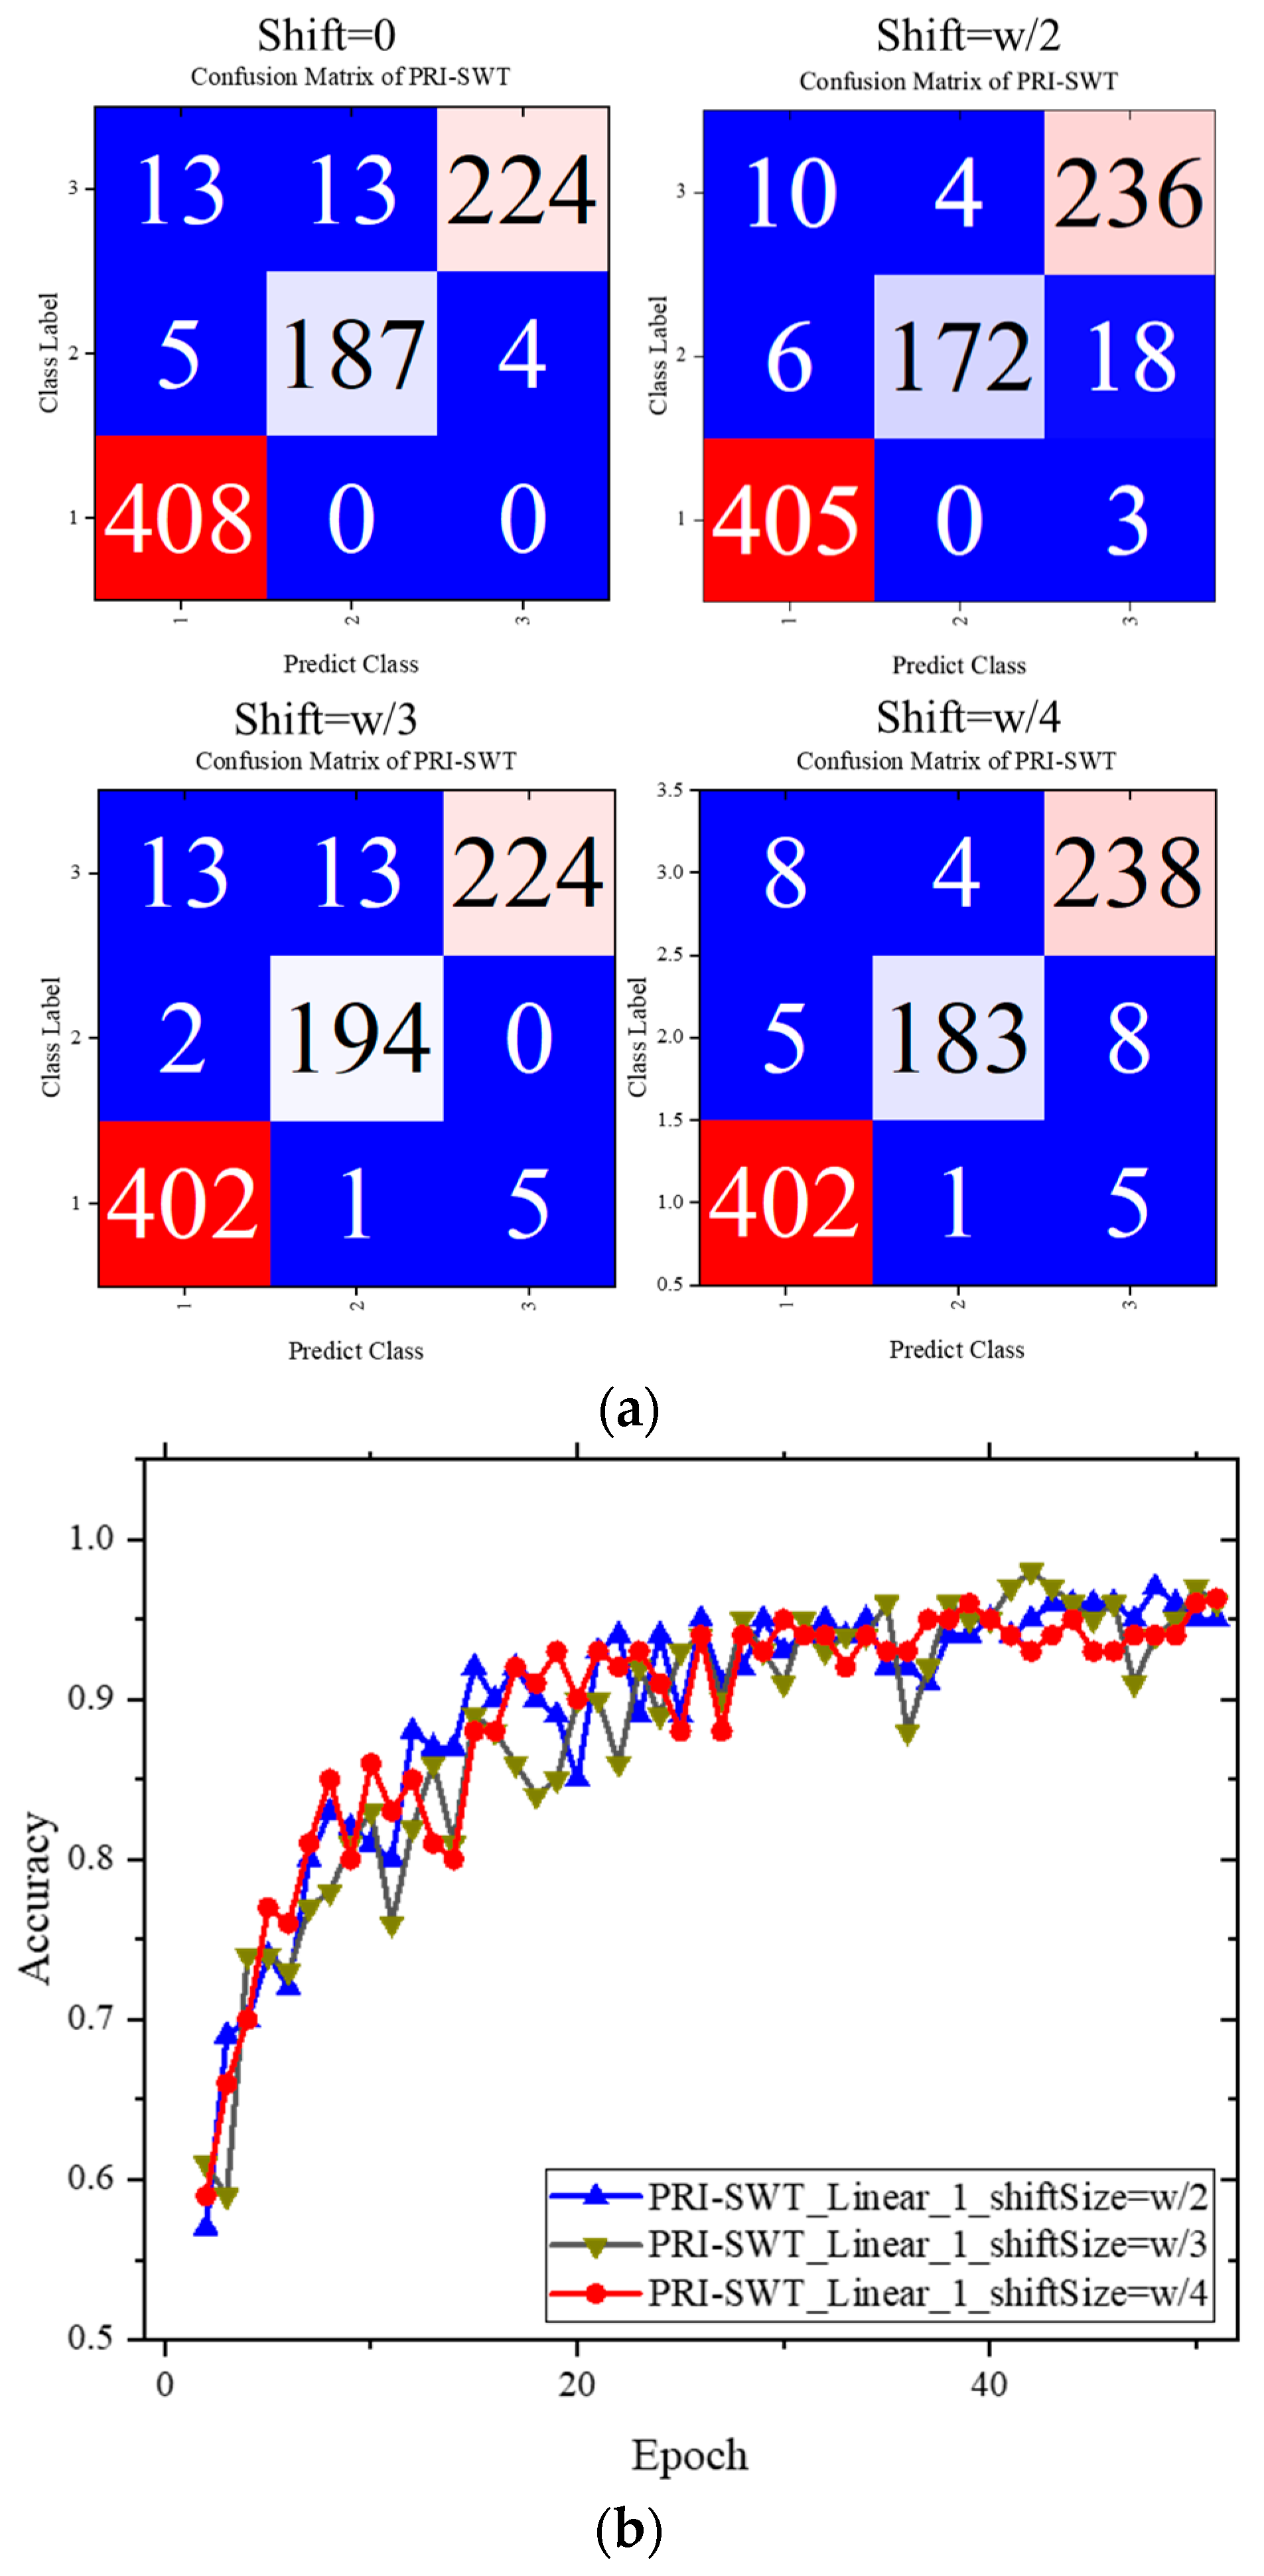
The PRI-SWT model employs a different approach compared to the Vision Transformer (ViT) model, which calculates attention scores across patches spanning the entire image. Instead, PRI-SWT uses a shifted window technique, computing attention scores within each window, significantly reducing computational costs. This method enhances information exchange and improves the model’s global perception. This section explores two key aspects: the effects of varying window shift values on classification performance and the impact of the window size itself.
The effects of varying the window shift size on model performance are summarized in
Table 4, with accuracy curves for three scenarios involving the linear projection fusion layer depicted in
Figure 14.
As shown in
Table 4,
refers to the window size. It was found that reducing the window shift size led to significant improvements in classification performance. This enhancement was likely due to the model’s ability to capture more localized information regarding CFRP defects, thereby aiding in the accurate identification of cracks, delamination, and impact damage.
Figure 14 further supports this observation, showing that accuracy trends remained consistent across all cases. Smaller window shifts consistently yielded continued accuracy improvements throughout the training process, ultimately culminating in the optimal model configuration.
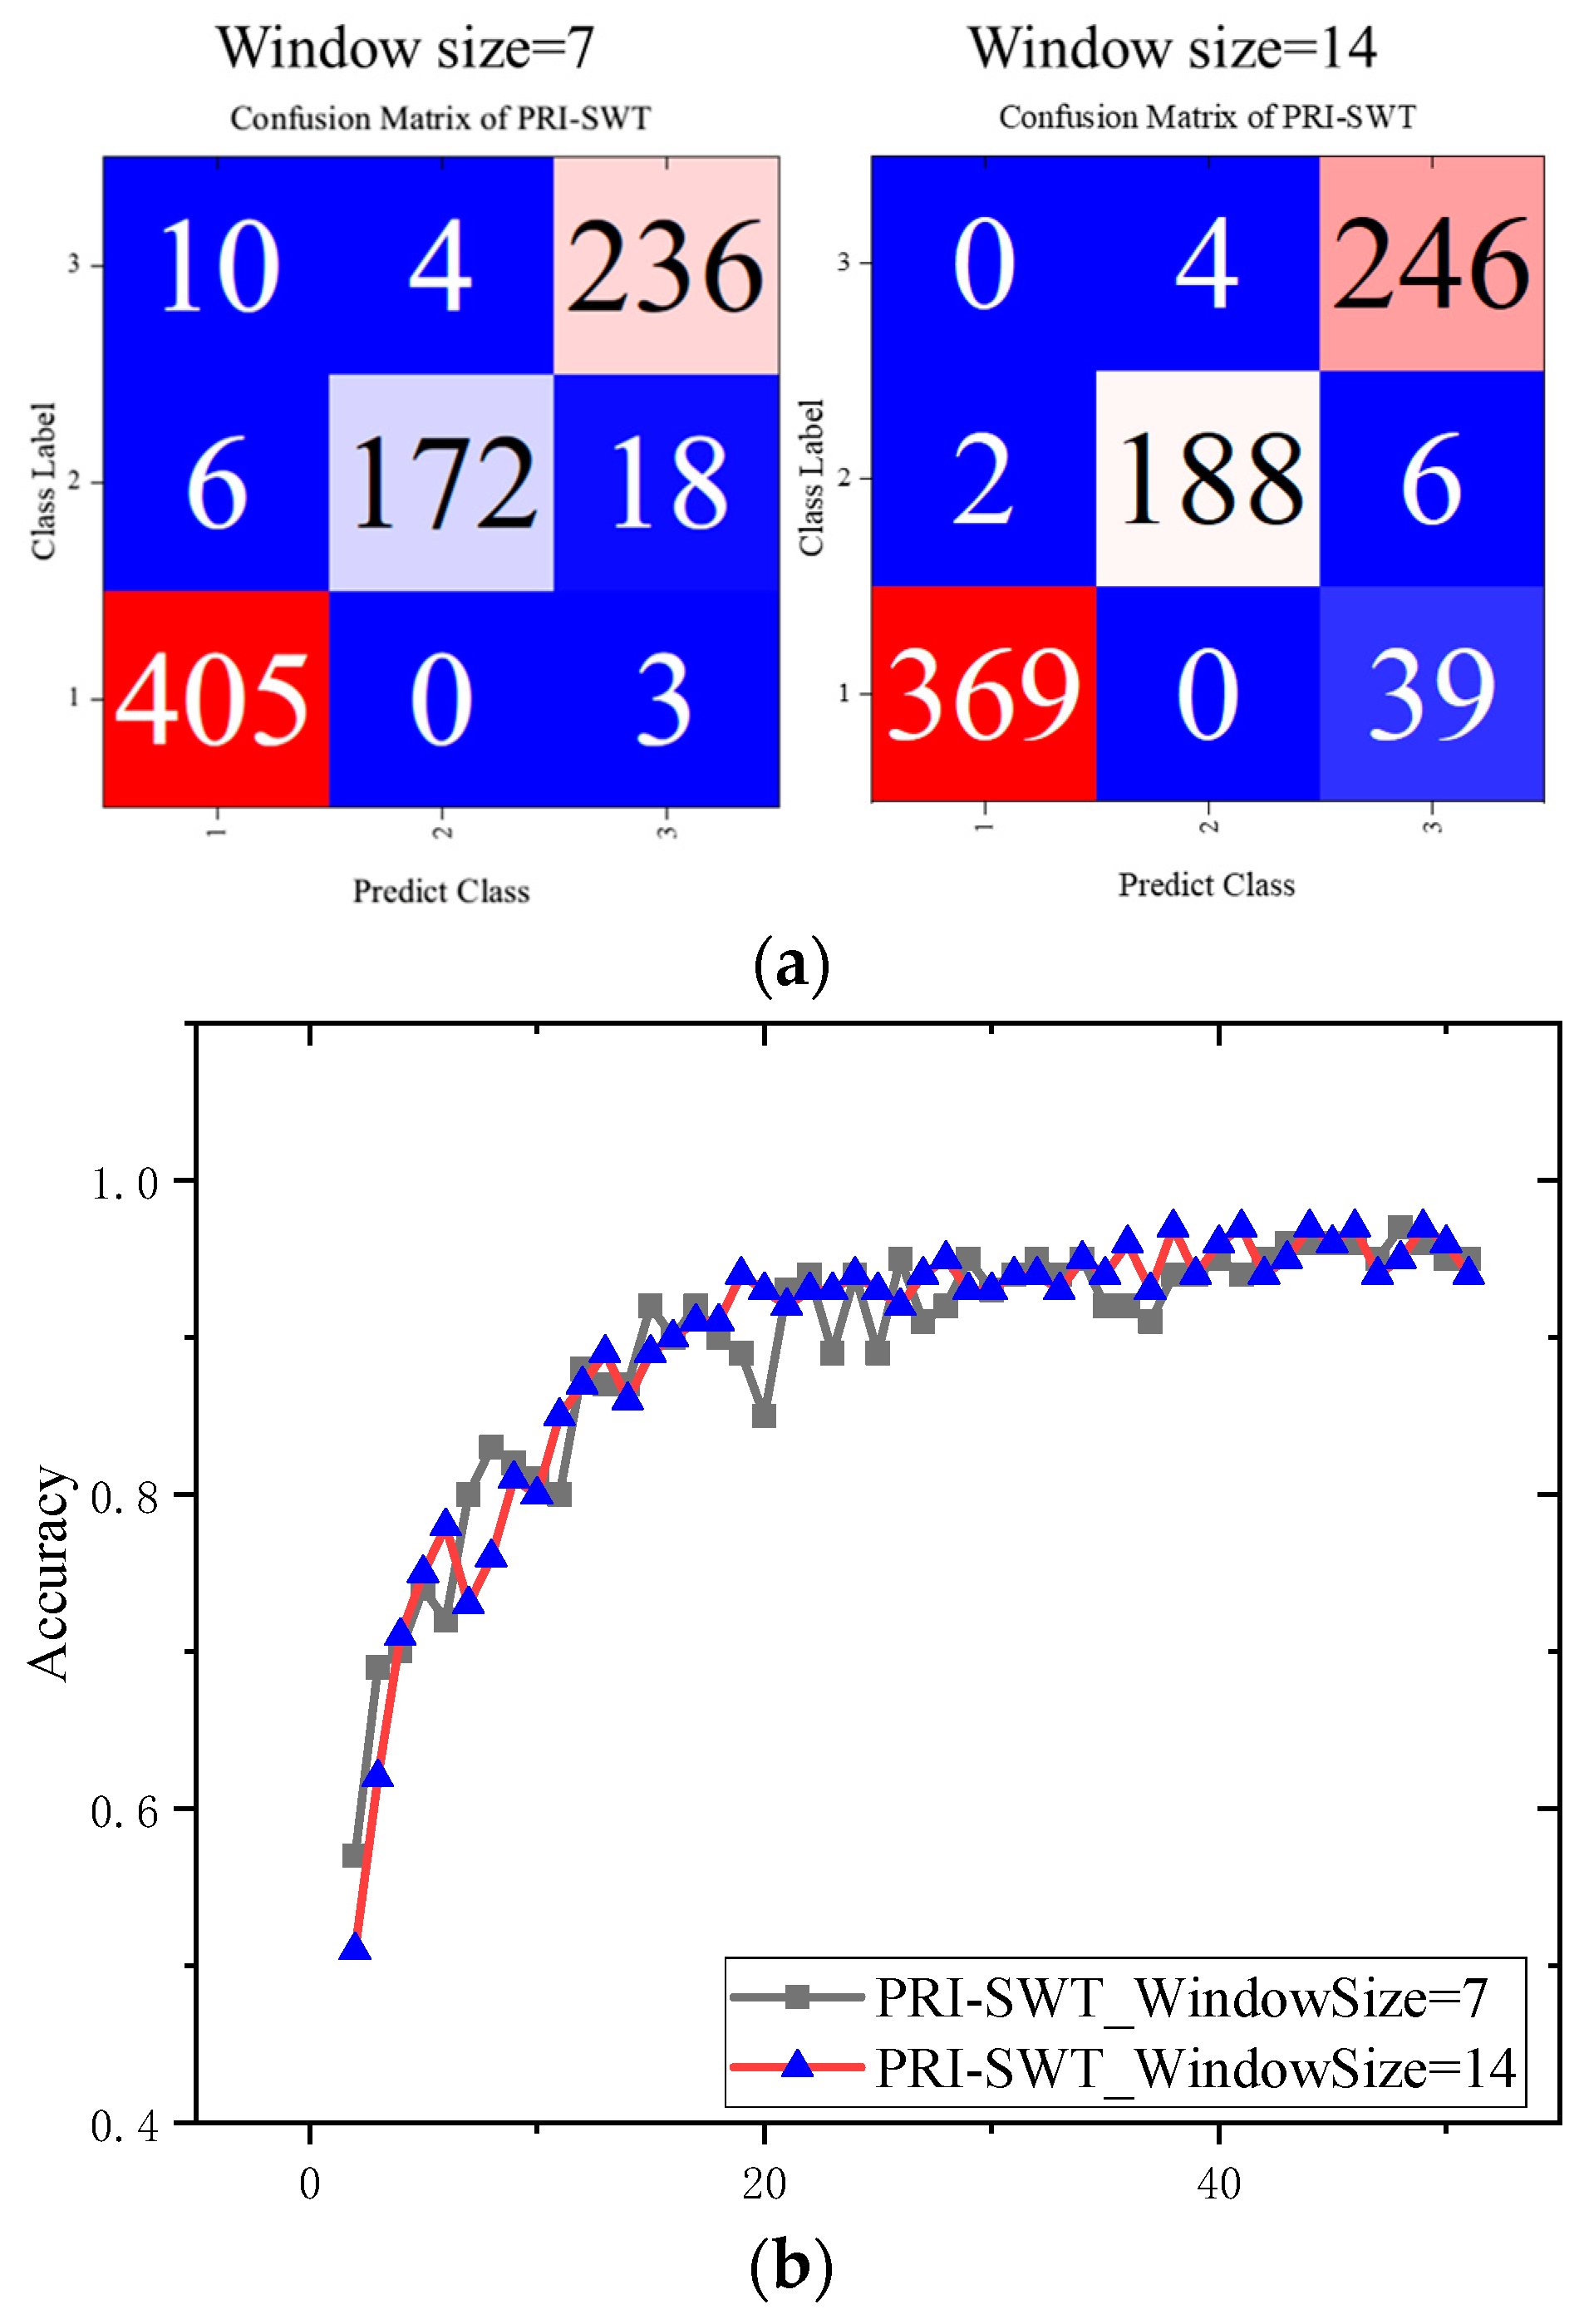
In addition to the window shift size, the actual window size itself significantly influences the performance of the PRI-SWT model. Smaller windows enhance computational efficiency and improve the perception of local information, but they may limit the model’s ability to capture global features. Therefore, it is essential to adjust window sizes carefully to optimize classification performance for different tasks.
The results regarding varying window sizes are presented in
Figure 15. PRI-SWT classification metrics are shown in
Table 5. Notably, increasing the window size reduced the macro-P to 94% and lowered the Kappa coefficient by 1.8%. The model with a larger window size encountered difficulties in differentiating between crack and impact damage, likely because it struggled to focus on localized CFRP defect regions, allowing nondefective information to interfere with classification decisions. Nevertheless, larger windows did facilitate a smoother convergence process for accuracy.
4.4.3. Depth of PRI-SWT
Understanding the impact of network depth is crucial for optimizing the PRI-SWT model’s performance, as it directly influences the model’s ability to capture complex features while maintaining computational efficiency. An analysis was conducted to assess the impact of network depth on classification performance. While deeper architectures can capture complex semantic details more effectively, they also introduce challenges such as increased computational requirements, a higher risk of overfitting, and more difficult training.
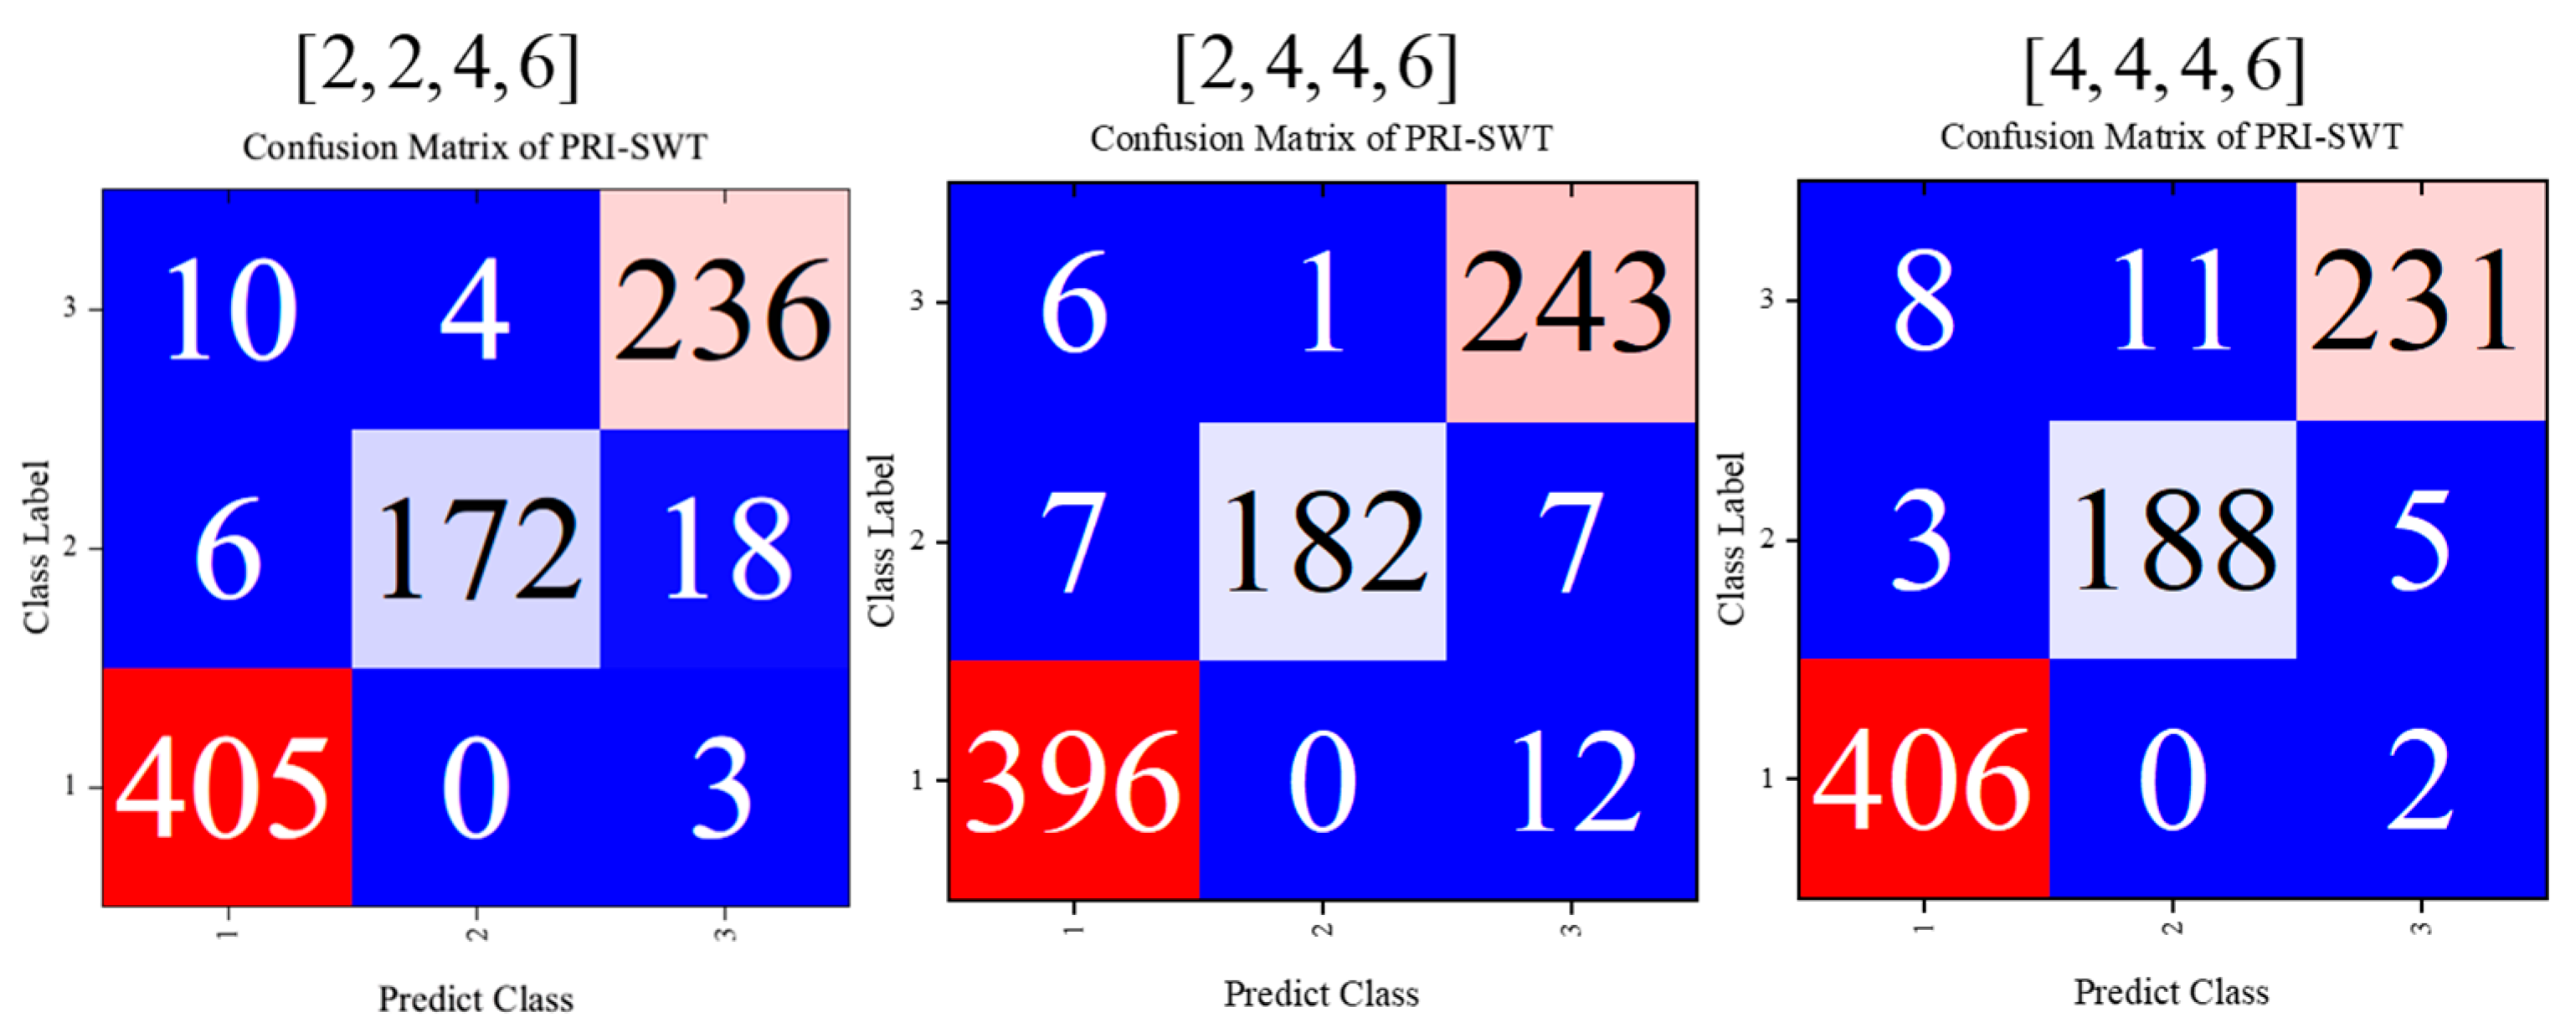
The original model’s architecture comprised four basic blocks with depths of
. By doubling the depth of the first two blocks, we created configurations of
and [4,4,4,6]. The corresponding confusion matrices and multi-classification metrics for these configurations are shown in
Figure 16 and
Table 6.
Transitioning from the configuration of to resulted in notable improvements, with macro-P reaching 0.963, macro-R reaching 0.957, and macro-F1 reaching 0.960. This enhancement underscores the model’s ability to extract intricate patterns and details from the data.
However, further increasing the network depth to demonstrated diminishing returns as performance gains were negligible. This suggests that the model may have reached a performance plateau, indicating a limit to the benefits of adding additional layers. Furthermore, while deeper networks can initially improve accuracy, they also introduce a higher risk of overfitting. As depth increases, the model’s propensity to memorize training data may hinder its ability to generalize effectively to unseen data.
Additionally, the trade-off between computational efficiency and model depth becomes evident. Deeper architectures require more computational resources, leading to increased training and inference times. As a result, the marginal performance improvements gained from additional depth may not justify the added complexity and resource demands. Thus, the careful consideration of network depth is essential for optimizing classification performance in the PRI-SWT model.
5. Conclusions
The PRI-SWT model was developed to address the challenges of multi-defect classification in CFRP materials using complex voltage signals. In the experiment, eddy current testing was performed on CFRP specimens with cracks, delamination, and impact damage using a nine-element probe. Amplitude and phase images, reflecting the characteristics of these defects, were collected. Through a series of data acquisition and processing steps, a total of 2612 crack defect images, 1750 impact damage images, and 1372 delamination defect images were generated, providing comprehensive data on the electromagnetic response characteristics of various defect types.
To ensure the diversity of the model’s training data, the dataset was carefully split into training and validation sets. Specifically, for crack defect images, there were 1828 training images and 784 validation images; for impact damage, there were 1225 training images and 525 validation images; and for delamination defects, there were 960 training images and 412 validation images. The dataset was divided along a 7:3 ratio, allowing the model to be trained on a large dataset while its performance on unseen data was evaluated using the validation set. This approach enhances the model’s generalization ability and mitigates issues such as overfitting and underfitting. The results demonstrate that the macro-F1 score improved by 29.4%, reaching 0.945, while the Kappa coefficient improved by 46.8%, achieving 0.924, compared to the SVM and Vision Transformer (ViT) algorithms.
Ablation experiments confirmed that the linear projection fusion layer outperforms the 2D convolutional fusion layer, with a macro-F1 score of 0.945 versus one of 0.928 for the convolutional layer, highlighting its superior effectiveness in information integration.
Additionally, reducing window displacement improved classification performance, achieving a macro-P score of 0.963, while increasing the window size led to a macro-F1 score of 0.961. Deepening the network further enhanced the model’s performance, as reflected in a Kappa coefficient of 0.946. Smaller window shifts allowed for improved capture of localized defect features, whereas larger windows provided valuable contextual information.
These advancements demonstrate the significant potential of the PRI-SWT model regarding accurate CFRP defect classification, promoting more reliable nondestructive testing in engineering applications.
Although the PRI-SWT model has made significant improvements in recognition and classification performance for CFRP defect eddy current testing, it is important to note the increased training and inference time costs associated with the complexity of the network. The introduction of strategies, such as dual parallel information flow and fusion reasoning layers, further contributes to the increased time overhead. For the ViT model, the typical inference time is 11.2 s, while the Swin Transformer model offers some improvement, reducing the inference time to 10.56 s. However, the PRI-SWT model requires approximately 30.59 s. When classification accuracy is prioritized over the time cost, PRI-SWT is an excellent choice. However, this comes with challenges in terms of industrial real-time detection applications due to its increased computational demands.
In future research, the scalability of the PRI-SWT model will be tested on more complex defect types, such as delamination defects and fiber wrinkles. Additionally, to further enhance the model’s classification performance, future directions will include integrating a wider range of CFRP defect detection results, such as ultrasonic testing and pulse eddy current thermography imaging, thereby leveraging the benefits of multi-modal fusion technology. Furthermore, a pressing issue remains the high computational cost. Future efforts will focus on strategies such as using caching techniques and optimizing the model’s architecture to mitigate this challenge.


