Article

Traffic Congestion Scheduling for Underground Mine Ramps Based on an Improved Genetic Scheduling Algorithm

1
Key Laboratory of Ground Control Management Plan in Deep Metal Mines, National Mine Safety Administration, Northeastern University, Shenyang 110819, China
2
School of Resources and Civil Engineering, Northeastern University, Shenyang 110819, China
*
Author to whom correspondence should be addressed.
Appl. Sci. 2024, 14(21), 9862; https://doi.org/10.3390/app14219862
Submission received: 13 August 2024 / Revised: 25 September 2024 / Accepted: 27 September 2024 / Published: 28 October 2024

Abstract

:
The dispatching of trackless transportation on the ramp of underground metal mines is closely related to the transportation efficiency of daily production equipment, personnel, and construction materials in the mine. The current dispatching of trackless transportation on the ramp of underground metal mines is discontinuous and imprecise, with unscientific vehicle arrangement leading to low efficiency and transportation congestion. This paper presents this study, which puts forward a kind of trackless transportation optimization method that can fully make use of the ramp in the roadway, and the slow slope fork point can be used for the trackless transportation vehicle passing section to improve the efficiency of trackless transportation on the ramp. This study adopts the principles of fuzzy logic and uses interval-based positioning instead of real-time positioning to effectively reduce the spatial complexity inherent in the algorithm. At the same time, this research presents a modified genetic algorithm that incorporates a time-loss fitness calculation. This innovation makes it possible to differentiate traffic priorities between different types of vehicles, thus bringing the scheduling scheme more in line with the economic objectives of the mining operations. Various parameters were determined and several sets of simulation experiments were carried out on the response speed and scheduling effect of the scheduling system, resulting in a 10 to 20 percent improvement for different vehicles in the efficiency of underground mining transport operations.

1. Introduction

The execution of daily production plans in underground metal mines is facilitated by a coordinated approach that includes mining, equipment installation, transportation, and strategic deployment of crushing machinery. The rational allocation of equipment and vehicles within the mine has a significant impact on overall production capacity and efficiency, which in turn has a significant impact on the economic profitability of mining operations. According to the research, taking the statistics of iron ore mines as an example, the production time of haul trucks accounts for only 70% of the total time [1]. This is due to the complex driving route, the complex types of running vehicles, and the narrow driving channel, which makes it difficult to optimize the transportation system. In addition, due to the blindness of traditional scheduling, the driving routes of trackless equipment are often conflicting and blocked, resulting in the stagnation of the transportation system. With the popularization of 5G mobile signal transmission technology in underground mines, the trackless transportation dispatching system of underground mines will usher in a new reform. Through real-time signal transmission, the dispatching center can determine the position and operation situation of the trackless equipment in real-time, so intelligent scheduling can be realized.
Worldwide, some scholars have studied the intelligent scheduling algorithm of trackless equipment in underground mine transportation systems. A heuristic approach based on linear programming is used to minimize the waiting time at loading points for multiple trucks with different capacities [2]. This method, used to determine mass flow along the path, has been run in real-time applications in more than 10 mines and improves productivity by 10 to 20%. Beaulieu and Gamache proposed an enumeration algorithm based on dynamic programming for optimizing fleet management in underground mines [3]. The method arranges vehicles to move in a transport network consisting of single-lane bidirectional roads, aiming to find the route and schedule of each vehicle to minimize the movement time without conflict. Jie Hou et al. use transport network modeling and optimize the network model, providing information about transport distance and driving time. The transport distance is calculated from the length of the route center line based on the tunnel layout [4]. The model has a significant effect on reducing the operation cost of mines. Yu et al. investigated how fast local search and parallel computation with the genetic algorithm can be used to solve the trackless transport vehicle path problem to minimize the number of vehicles and total transport distance or time [5]. This method not only improves the optimization capability in the global scope, but also ensures operational efficiency. Some people have also proposed an enumeration algorithm based on dynamic planning [6,7]. The algorithm applies a multi-objective heuristic based on a two-stage Pareto local search and VNS (2 PPLS-VNS), multi-objective variable neighborhood search (MOVNS), and non-(NSGA-II) to job planning problems with dynamic truck assignments [8,9]. The experiment demonstrates good convergence [10]. The aforementioned studies offer insights into potential avenues for intelligent scheduling algorithms in underground trackless transport equipment in mines. However, the majority of these studies focus on a single objective, with the primary aim being the reduction in route conflicts. The issue of bidirectional transport on the ramps of underground metal mines is distinct from that of scheduling mine trucks in open-pit mines. Inevitably, there will be instances of route conflicts involving trackless equipment. Furthermore, in the context of underground mine transport scheduling, focusing exclusively on route conflict issues while neglecting the necessity to adhere to passage priority in vehicle production will inevitably result in logistical inconsistencies. It is therefore imperative to investigate the optimal design of transport routes in order to maximize production transport efficiency, while allowing for potential route conflicts and ensuring compliance with the relevant engineering transport laws.
This paper discusses the problems of an intelligent scheduling system for trackless transport on slope roads, with a view to addressing the issues of the low utilization of trackless transport passes in underground mines, the conflict and blockage of transport routes due to the unscientific planning of transport routes, low transport efficiency, and so on. The principal findings of the research are as follows: 1. An improved genetic algorithm is proposed, which introduces the constraints of the law of vehicle transport in underground mines in the calculation of adaptability in a novel manner. 2. In the proposed improved genetic algorithm, a coding method is proposed which is more applicable to trackless transport in underground mines. 3. The principle of fuzzy logic is applied, and the interval positioning method is used to divide the road sections and locate the vehicles. This approach reduces the spatial complexity of the algorithm and improves its response speed. 4. The proposed improved genetic algorithm is used to carry out simulation experiments on the trackless transport of underground mines. The results of the experiments demonstrate that the algorithm is effective in improving the efficiency of the trackless transport of underground mines and in enhancing economic benefits.
Section 2 provides a comprehensive description of the initial scheduling model for underground metal mine trackless transport. This includes an in-depth analysis of the technical characteristics of the model, interval fuzzy positioning, the generation of transport task sequences, the construction of mathematical models, cost calculation, and the constraints of the scheduling model. Section 3 proposes an optimization method based on an improved genetic algorithm, which enhances the coding method and innovates the adaptation calculation to align with the transport scheduling requirements of underground mines. Section 4 validates the efficacy of the proposed algorithm in enhancing transport efficiency, reducing costs and congestion through computer simulation experiments, demonstrating a notable improvement before and after the optimization.

2. Research and Development Background

2.1. Engineering Background

At present, the dispatching method is a combination of traffic lights and driver vision [11]. As it is difficult for the driver of the trackless transport vehicle to determine the driving conditions in front and behind, the transport vehicle cannot complete the trackless transport vehicle passing on the ramp, and the required party reverses to the nearest passing bay in the roadway to complete the trackless transport vehicle passing [12]. Due to the noise of the underground, different vehicles use torches to communicate by hand. The communication efficiency is low and misunderstandings easily occur, leading to serious congestion on the ramp, which greatly reduces the mine’s production efficiency [13]. In addition, frequent reversing also leads to the actual mileage of the transport vehicle being far greater than the required transport mileage, and whether the tire wear speed of the transport vehicle is also the fuel consumption speed is far higher than the normal travel, even reducing the service life of the transport vehicle and greatly increasing the production cost of the mine [14]. Therefore, the research on intelligent planning of the ramp road is of great significance.
We only need to arrange the corresponding 5G signal base station; realize information transmission between devices and ramp real-time traffic condition visualization; integrate into the central intelligent scheduling system; greatly improve the scheduling efficiency; avoid major conflicts; cause underground road traffic jams; and achieve a continuous, efficient, intelligent, and safe visualization of intelligent scheduling [15]. The schematic diagram of the scheduling system is shown in Figure 1.

2.2. Advantages of Using Genetic Algorithms for Solving

Figure 2 shows the process of the genetic algorithm (GA). The principle of this algorithm is to simulate the replication, crossover, and variation in DNA. Starting from any initial population (Population), the next-generation chromosome is produced by random selection, crossover, and changing the chromosome, that is, the feasible encoding product of the problem [16]. And the fitness function is calculated according to the environment, screening a batch of individual fitness that is more suitable for the environment, making the group an optimal solution in the space, and generation after generation, constantly evolving reproduction and iterating until finally obtaining a group of the most adapted individual (Individual), which is what we require as the optimal solution of the problem [17]. The method is highly effective in solving optimization and search problems, particularly those that are complex, non-linear, and multi-peaked. NFL theorems establish that for any algorithm, any elevated performance over one class of problems is offset by the performance over another class [18]. But genetic algorithms are well suited to the optimization of multiple objectives, as they can convert the multi-objective optimization problem to a single-objective optimization problem by emphasizing one particular Pareto-optimal solution at a time and assess the solution during the evolutionary process [19].
There have also been some success stories of genetic algorithms being used to solve different problems, such as those used for COVID-19 case prediction or the optimized control of IoT-monitored microgrid systems. In addition to this, there are also examples of use in open pit transport [20,21].

3. Scheduling Model of Underground Trackless Transportation

3.1. Technical Characteristics of the Initial Scheduling Model

3.1.1. Division of Slope Road Sections

In addition to the passing bay on single-lane ramps, which can be used for the passing of trackless transport vehicles, the entrance of each central section can also be used for the passing of trackless transport vehicles. The working plane of the ramp leads to the start and end of the trackless equipment route. Before building the initial planning model, you need to select the passing bays to meet the avoidance requirements of the trackless equipment, including all the center entrances and passing bays. The passing bays need to be arranged by depth and labels need to be added. Each center crossing must be identified by number. Video surveillance and signal lights are installed at each passing bay to ensure stable signal transmission to the ground dispatch center, which is the basic hardware configuration of the dispatch system.
After the ramp is divided into sections by the passing bays, the transport route of the trackless transport equipment can be converted into digital signals. A transport route is a set of data including the start point, end point, and time limit of the transport of the trackless transport equipment.

3.1.2. Fuzzy Positioning of Trackless Transportation Equipment Interval

An independent queue array is created with a data space of 2 for each trackless vehicle. After each passing bay, the equipment is recorded by video surveillance at the passing bays and the signal is fed back. The signal contains the number and time of the passing bay, which is entered into an independent array. According to the queue principle, if the amount of data in the array is greater than the data space, an overflow phenomenon will occur. According to the first-in, first-out principle, the first data entered into the array will be deleted, and the subsequent data entered will move one place forward in the sequence. As shown in Figure 3, assuming that the trackless vehicle travels from the (1, 2) section to the (2, 3) section, the original array of the trackless vehicle is (1, 2), and when it enters the (2, 3) section, number 3 will enter from the array and number 1 will be pushed out of the array; in this case, the array of the trackless vehicle becomes (2, 3).
The number in the queue array represents the section where the trackless transportation equipment is located. This interval fuzzy positioning method is different from the general accurate spatial coordinate positioning. The spatial accuracy and temporal accuracy are greatly compressed, which reduces the spatial complexity of the algorithm and can significantly improve the response speed of the algorithm. At the same time, thanks to the queue array structure as the line segment, the number arrangement in the array represents the direction of the trackless transportation equipment.

3.1.3. Form the Transportation Task Sequence

According to the daily production tasks, the tasks are divided into three categories: (1) ore transport; (2) material and equipment transport; and (3) personnel transport [22,23]. The overall transport task is then divided into several transport sub-task sequences according to the transport capacity of the service equipment, and the trackless transport equipment is assigned to each sub-task sequence. The route is generated for each task sequence and arranged in the pending task window in the initial generation order, and then all task sequences are processed for the first time according to the time requirements in the task or the logical order between the task sequences. The principle of the scrolling task window must be used here. After the first ranking is completed, the task timeline is generated according to the task sequence and the tasks with time requirements are compared with the total time axis. Based on the comparison results, the running time of each task sequence is generated, which is the time window of the transport task.
This method has two advantages: first, the daily transport sequence is distributed in time order, which is clear and easy to operate; second, when you add temporary transport tasks or adjust the transport order, there is no need to sort and optimize the existing tasks, which greatly reduces the time complexity of the algorithm.

3.2. Initial Scheduling Model Planning

3.2.1. The Ramp Map Model

According to the CAD drawing of the ramp or the 3D model provided by the site, the algorithm will number the driving road model according to the fork point, the middle section entrance, and the passing bays, and the starting point of the ramp is taken as the origin to establish the correct spatial coordinate system. The section between each numbered point is recorded and stored as a set of driving road lines. For the starting point, the middle point, and the end point of each line section, the XYZ axis coordinates are recorded, the digital number is marked, and the trackless transport vehicle information is recorded, such as two-way lanes, four two-way lanes, and one-way lanes. The list format is {x coordinate, y coordinate, z coordinate, number n, lane type}. The final summary is formed, and the full-section interval map and all endpoint information are stored as an excel file and saved to the project folder. Figure 4 shows the sample CAD drawing model.

3.2.2. Transportation and Flow Model

The road section interval of the transport vehicle is determined by the feedback information of the camera at each passing bay [An, Bn]. Then, the information of all vehicles is stored, such as {“Vehicle number”: n; “Road section”: [An, Bn]}. All the transport vehicles are arranged on the whole section map. The mathematical logic to determine whether there is an A conflict section is as follows: the transport vehicle An and the queue array of data are in the direction of the adjacent section of the base point, and the base point and adjacent sections for transport vehicles are searched. If so, assessment of the suspected conflict vehicle Ai in the direction of the collision is continued. Now, using two queue arrays, the advantage of the reflected vehicle position is recorded, the line segment is directional, and the (1, 2) array and (2, 1) array represent the opposite direction, so we can easily determine that two vehicles enter the same section in opposite directions, subsequently returning to allow or refuse to pass the signal.
The section information file is retrieved. If there are two lanes in both directions, two vehicles traveling to each other are allowed to enter. In a one-way lane, only one car is allowed to enter at the same time. In the case of conflict, it is optimized according to traffic priority and transportation efficiency.

3.2.3. Calculation of the Waiting Time of the Trackless Transport Vehicles

(1)
Waiting time calculation of the passing bays
When it is determined that there will be a route conflict ahead, the system will send out a no-peer signal, and the transport vehicle will wait at the meeting point until the meeting vehicle is completed. Waiting time is recorded as tb, and B represents the inflection point number of the current parking location. If you do not stop waiting at the meeting point, tb = 0. A total waiting time ta is set up, meaning the total waiting time of the trackless transport vehicle with serial number A at the passing bay. When the meeting is completed, it is determined whether there is a conflict section in front. If not, we jump out and wait for the cycle to continue. The wait cycle adopts the while cycle and detects that the cycle takes time.
(2)
Task interval scheduling time calculation
After completing a transport mission, the trackless transport vehicle will wait in place for the next mission assignment or go to the next transport starting point to prepare for the mission. The time t a spent during this period will be recorded and used as a time costing of the model. The end of the last task to the beginning of the next task is remembered.

3.2.4. Judge the Same Point and the Same Order of the Trackless Transport Vehicles

The departure point and departure order of trackless transport vehicles will also affect the trackless transport vehicle scheduling scheme, so it is necessary to judge whether there is a conflict between the departure point and the departure order in advance [24,25,26]. The system needs to manually input the departure point, end point, and departure time. The departure order of the trackless transport vehicle can be determined through timeline sorting. At this time, the initial data of the queue array of all vehicles can be traversed to review the timeline of the trackless transport vehicle at the same departure point. If there is any conflict, the scheduling simulation is terminated and the prompt is sent. If not, the departure number will be assigned in order. The departure interval between each order shall be determined according to the production target of the day, and the set interval shall be 2~5 min.

3.3. Description of Mathematical Model of Ramp Transportation

3.3.1. Mathematical Model of Underground Full-Load Scheduling

The transportation problem of trackless transport vehicles on the ramp can be described as N trackless transport vehicles running on the ramp. The ramp contains m nodes, including n middle section entrances (m > n) and m-n passing bays, which are both passing bays where the transport vehicles can pass. Each middle entrance (including the start and end of the ramp) may serve as the start or end of the intended route of the trackless vehicle. There are I transportation tasks to be implemented. If each vehicle completes the transportation task and is not assigned to the next transportation task, it will wait at the end. Otherwise, it will wait at the starting point of the next transportation task. An appropriate scheduling scheme needs to meet the needs of users while minimizing the total transportation cost of the trackless transport vehicle.
The required variables in the model are described as follows:
  • A: number of vehicles running on the ramp;
  • m: number of passing bays;
  • n: number of middle section entrances;
  • m-n: number of passing bays;
  • I: number of transport tasks to be performed;
  • cx: running state of the trackless transport vehicle at the node;
  • ta: total stop time of the trackless transport vehicle with serial number a in a transport mission;
  • t a : total interval scheduling time of the trackless transport vehicle with serial number A performing all transport tasks on the same day;
  • t a i : interval scheduling time of the trackless transport vehicle with serial number a after executing the transportation task with serial number i (i [1, I]);
  • tab: waiting time of the trackless transport vehicle with serial number a at the passing bay of b (a [0, N], b [0, m]);
  • S a : operating distance of transport vehicle number a in the transport mission;
  • S a : dispatch distance of the transport vehicle with the serial number A in the transport task interval.

3.3.2. Cost Calculation of the Scheduling Model

The model operation cost is calculated in three aspects: traffic priority cost calculation, waiting time cost calculation, and travel distance cost calculation.
(1) Priority cost calculation: According to the existing scheduling priority principle of the Sanshan Island mining area, the trackless transport vehicle traffic on the slope is the first mover, and only vehicles running in one direction are allowed between the two passing bays. Vehicles on the ramp road pass first and then go down, and they first enter the contact road and then exit the contact road. Only vehicles running in one direction are allowed between the two links. The mine vehicle has highest priority; the forklift has second highest priority; and the other, lowest-priority vehicles are the different transport vehicles, giving different traffic priority coefficients. The priority coefficient δ is introduced as follows:
min   C   ( x ) = t i δ
δ = 0.2 ,   V e h i c l e s   t r a n s p o r t i n g   e q u i p m e n t   o r   m a t e r i a l s 0.5 , U t i l i t y   v e h i c l e s   o r   c a r g o   c a r r i e r s   d e s i g n e d   f o r   h u m a n   t r a n s p o r t a t i o n 1 , O r e   h a u l a g e   t r u c k s .
At this time, when the trackless transport vehicle is given the priority coefficient δ , the system compares the loss of the two vehicles according to the principle of the peer priority principle when the two cars meet C1(x), C2(x). Because the waiting time of the trackless transport vehicles is generally roughly the same, the loss of the two cars is positively correlated with the peer priority coefficient of the two cars. If and only if the trackless transport vehicles in a certain direction are greater than a certain number,
C overall ( x ) = C n ( x )
(2) Waiting time cost calculation: the waiting time of trackless transport vehicles at the passing bay and the scheduling time of the transportation task interval are included in the total waiting time, which belongs to the time cost of scheduling.
The waiting time at the passing bays is
T 1 ( x ) = a = 1 N t a
The scheduling time of the transportation task interval is
T 2 ( x ) = a = 1 N t a
So, the total time cost is
min   T ( x ) = a = 1 N t a + a = 1 N t a
(3) The shortest travel distance principle: suppose that the transportation task running distance of the transport vehicle with serial number A is Sa, the task interval scheduling distance is
min   S   ( x ) = a = 1 A ( S a + S a )

3.3.3. Constraints

After the initial solution is given by the stochastic algorithm, a new basic solution is generated after cross-variation through the genetic algorithm. The following constraints are available for the newly generated basic solutions.
(1)
Avoid collision principles
There is less than or equal to one vehicle in the same road section at the same time period. Assuming that the trackless transport vehicle running speed is v, suppose there is a serial number a1. The trackless transport vehicle starts from A a 1 , the end point is A a 1 , the overall parking time is t a 1 , and a vehicle has serial number a2. The start point is A a 2 , the end point is A a 2 , and the overall parking time is t a 2 .
Then, we have ε [1, m] ( ε N*), and the collision avoidance function is
| A ε A a 1 | + vt a 1 | A ε A a 2 | + vt a 2
In the actual operation of the intelligent dispatching system, due to the inconsistent speed of the transport vehicles, it is necessary to monitor the real-time speed and position of the trackless transport vehicles. Supposing each docking time of ti in the current period, the operating distance of the remaining vehicles is Si, so v is corrected to
V ¯ = S i t i
(2)
The principle of not crossing the middle section
After each transport vehicle finishes the previous transport task, go to the nearest starting point of the next transport task to avoid long-distance span interval scheduling.
The distance to calculate the task interval scheduling of each vehicle can be extracted by comparing the last point number of each line of the driving coding genome with the first point number of the next line. Through the query, the 2D map can be used to obtain the actual distance.
For the transport vehicle with serial number Ai, there is a non-zero coding genome Ci = {c(i,1), c(i,2), c(i,3),⋯, c(i,j) } and non-zero genome Ci+1 = {c(i+1,1), c(i+1,2), c(i+1,3),⋯, c(i+1,j)} (i = 1,2,3,⋯). Then, the distance of the task interval scheduling of each vehicle is
S a = i m = j | c ( i , m ) c ( i + 1 , 1 ) |
Assuming that the height of each middle section is h and the slope angle is θ, then,
| c ( i , j ) c ( i + 1 , 1 ) | < h tan θ

4. Use the Genetic Algorithm to Optimize and Solve the Initial Scheduling Model

4.1. Improved Genetic Algorithm

There are two main ways of traditional vehicle path problem coding: sequential coding based on the vehicle driving path and customer-based coding. For the dispatching of the ramp trackless transport vehicles, it is more appropriate to use the sequential coding based on the driving path of the trackless transport vehicle. The structure of chromosomes based on the trackless transport vehicle driving path sequence is as follows:
( 0 , i 11 , i 12 , , i 1 s , 0 , , i j k , , i m w , , 0 )
where i indicates the first ik client. Such a chromosome can be represented as the trackless transport vehicle starting from yard 0 and passing past the customer i11, i12, …, i1s; back to yard 0 and forming a sub-path; and so on until all customers are visited.
In order to address the issue of vehicle path planning for trackless transport in underground mines, we have implemented enhancements to the conventional genetic algorithm (GA) coding approach.
However, for the ramp, the starting point is uncertain, and any middle entrance may be used as the starting point and end point. The ramp model contains m nodes, numbered M1, M2, …, Mm. For each trackless transport vehicle, its starting point is set as Mx0 and its end point is Mx1 (1 ≤ x0 < x1 ≤ m, x0, x1 ∈ Z). An array C of length mn is created as a scheduling command, with c0 to cx0 and cx1 to cm all assigned a value of 0. Cn = [c0, c1, …, cm−1]. There are x [0, m1] and three forms of datasets in the array:
c x = 0 , V e h i c l e s   b y p a s s i n g   t h e   c o r r e s p o n d i n g   n u m b e r e d   v e h i c l e   i n t e r s e c t i o n   p o i n t c x = 1 , V e h i c l e s   w a i t i n g   a t   t h e   c o r r e s p o n d i n g   n u m b e r e d   v e h i c l e   i n t e r s e c t i o n   p o i n t c x = 2 ,   V e h i c l e s   n o t   w a i t i n g   a t   t h e   c o r r e s p o n d i n g   n u m b e r e d   v e h i c l e   i n t e r s e c t i o n   p o i n t
Assuming that the number of cars running in the model is a, the group scheduling arrays are merged into an A-order matrix:
{C1C2……Ca} T
The proposed coding approach incorporates information regarding the driving mode, including whether the vehicle is waiting at the node or passing through it rapidly, in addition to the path information. This approach may prove advantageous in addressing the issue of vehicles traversing conflicting routes, by integrating the route conflict into the optimization calculation of the algorithm and thereby arriving at a solution.

4.2. The Scheduling Model Is Optimized and Solved by Using the Improved Genetic Algorithm

4.2.1. The Population Initializing

First, the current transport tasks are arranged in the input order and assigned to transport vehicles. The gene of the chromosome is the passing bay traffic status code of each vehicle. The passage list is fully arranged, each chromosome is verified, and the feasible solution is added to the population and recycled until all feasible solutions are selected.

4.2.2. Adaptive Value Calculation

The objective function is
m i n z = C ( x n ) + T ( x n ) + S ( x n )
The optimal solution of this objective function is the minimum cost of mine production scheduling, but in the actual production process, the priority principle is met first according to the mine production scheduling rules, so the calculation formula of total fitness is adjusted when calculating fitness. The priority calculation results are weighted to ensure that the chromosomes that meet the prevailing priority are at the forefront of the screening in the total fitness calculation.
These three principles calculate the resulting fitness, making the following:
C ( x n ) = a = 1 A t a δ T ( x n ) = a = 1 A t a + a = 1 A t a S ( x n ) = a = 1 A ( S a + S a )
Then, the adaptive value is
γ 1 = b 1 C ( x n ) γ 2 = b 2 T ( x n ) γ 3 = b 3 S ( x n )
The total γ n fitness was calculated for γ 1 , γ 2 , and γ 3 :
γ n = γ 1 + γ 2 + γ 3
According to the actual operation situation of the mine, the pair of b will be used in the simulation operation b1, b2, and b3, being equal to 100, 86, and 53, respectively. In the actual production, the constant will be adjusted according to the operation situation. For the fitness of this chromosome γ n , when the objective function value is smaller, the larger the fitness is, the closer to the optimal solution.
Finally, the basic tolerance with the highest fitness is taken to continue the cross-variation and enter the next cycle. The cycle end condition is the basic allowable total fitness γ n of one cycle being greater than the total fitness of the basic solution γ n + 1 obtained in the next cycle, giving
γ n γ n + 1
In order to avoid falling into the local optimal solution, when the fitness of the modern difference in optimal fitness is less than or equal to zero, the multiplication of power scale transformation is used:
γ = γ k
Three genetic cycles are repeated. If the best generation difference fitness is less than the threshold of 0.1, the best fitness solution is output. The solution is also considered the optimal solution. Otherwise, the cycle continues.
The mathematical model flow chart is shown in Figure 5.

5. A Genetic Algorithm-Based Approach to Scheduling Effect Analysis

5.1. Transportation Conditions on Site

The main development conditions of a mining area are as follows: −60 ~ −240 m adopts the lower-plate central shaft, auxiliary slope road joint development, and underground ore transportation by rail transportation. Waste rock is transported by truck to the −280 m level and by 35 t electric truck transportation. A ramp is set from the surface to −250 m for auxiliary transportation of personnel and air intake, as well as materials. The section size of the ramp is 4.8 m × 3.5 m (width × high).
Next, −240 ~ −420 m is jointly developed by the ramp and the two-wing air shaft, and transported by a 35 t electric truck. The section of the ramp is 5.1 m × 4.1 m, with an average slope of 10%. The ore is transported to the main shaft of the −243 m level. The waste rock is transported by truck from the 12 t diesel pit to the −280 m level waste rock shaft.
Then, −420 ~ –600 m adopts the ramp of −600 m, and the ramp extends from −435 m to −600 m. The ramp section is 5.1 m × 4.1 m, and the electric truck service reaches the −600 m level. The ore of the phase III project is transported by electric truck to the −243 m level and discharged into the main shaft of the phase I project.
The ore (waste) rock developed in the Xishan mining area is transported by truck to −243 m for unloading, with an average transportation distance of 3500 m and transportation cost of 45.50 yuan/t. The deep development project of the Xishan mining area was originally transported to the surface by truck, with an average transportation distance of 7150 m and a transportation cost of 30.60 yuan/t.

5.2. Experimental Design of Computer Simulation

Each test cycle is 24 h, and seven cycles are conducted to simulate the traffic of the ramp for one week. The test simulation production task comes from the actual production task of Sanshan Island mining area in a certain week in March 2023. There were four indicators: (1) the number of vehicles passing the ramp per 24 h; (2) the average distance of vehicles; (3) the transportation cost of vehicles; and (4) the length of the ramp.
According to the above field transportation conditions, the ramp from the surface to −1200 m is selected as the simulated experimental environment. The average slope of this section of the road is 10%, the total length is 12 km, and the whole two-way single lane is passed. Vehicle passing is only possible at the passing bays, which is in line with the actual situation of the project. There is a middle section entrance every 60 m from the downward vertical direction of the surface, and a passing bay is set every 100 m from the downward vertical direction of the surface, with a total of 32 passing bays. When two cars have been parked at the passing bay, the passing bay will be regarded as the passing bay. According to the daily production situation of Sanshan Island mining area, there are 20 electric trucks carrying 35 t of heavy loads, 40 diesel trucks carrying 12 t, 20 manned pickup trucks, and 20 operating vehicles, totaling 100 test vehicles. The design running speed of the trackless transport vehicle shall not exceed 35 km/h, and the maximum acceleration shall not be more than 1.26 m/s2 according to the national standard of “Chinese Automobile Driving Conditions”. Figure 6 shows the main underground operating vehicles applied at the project site. 
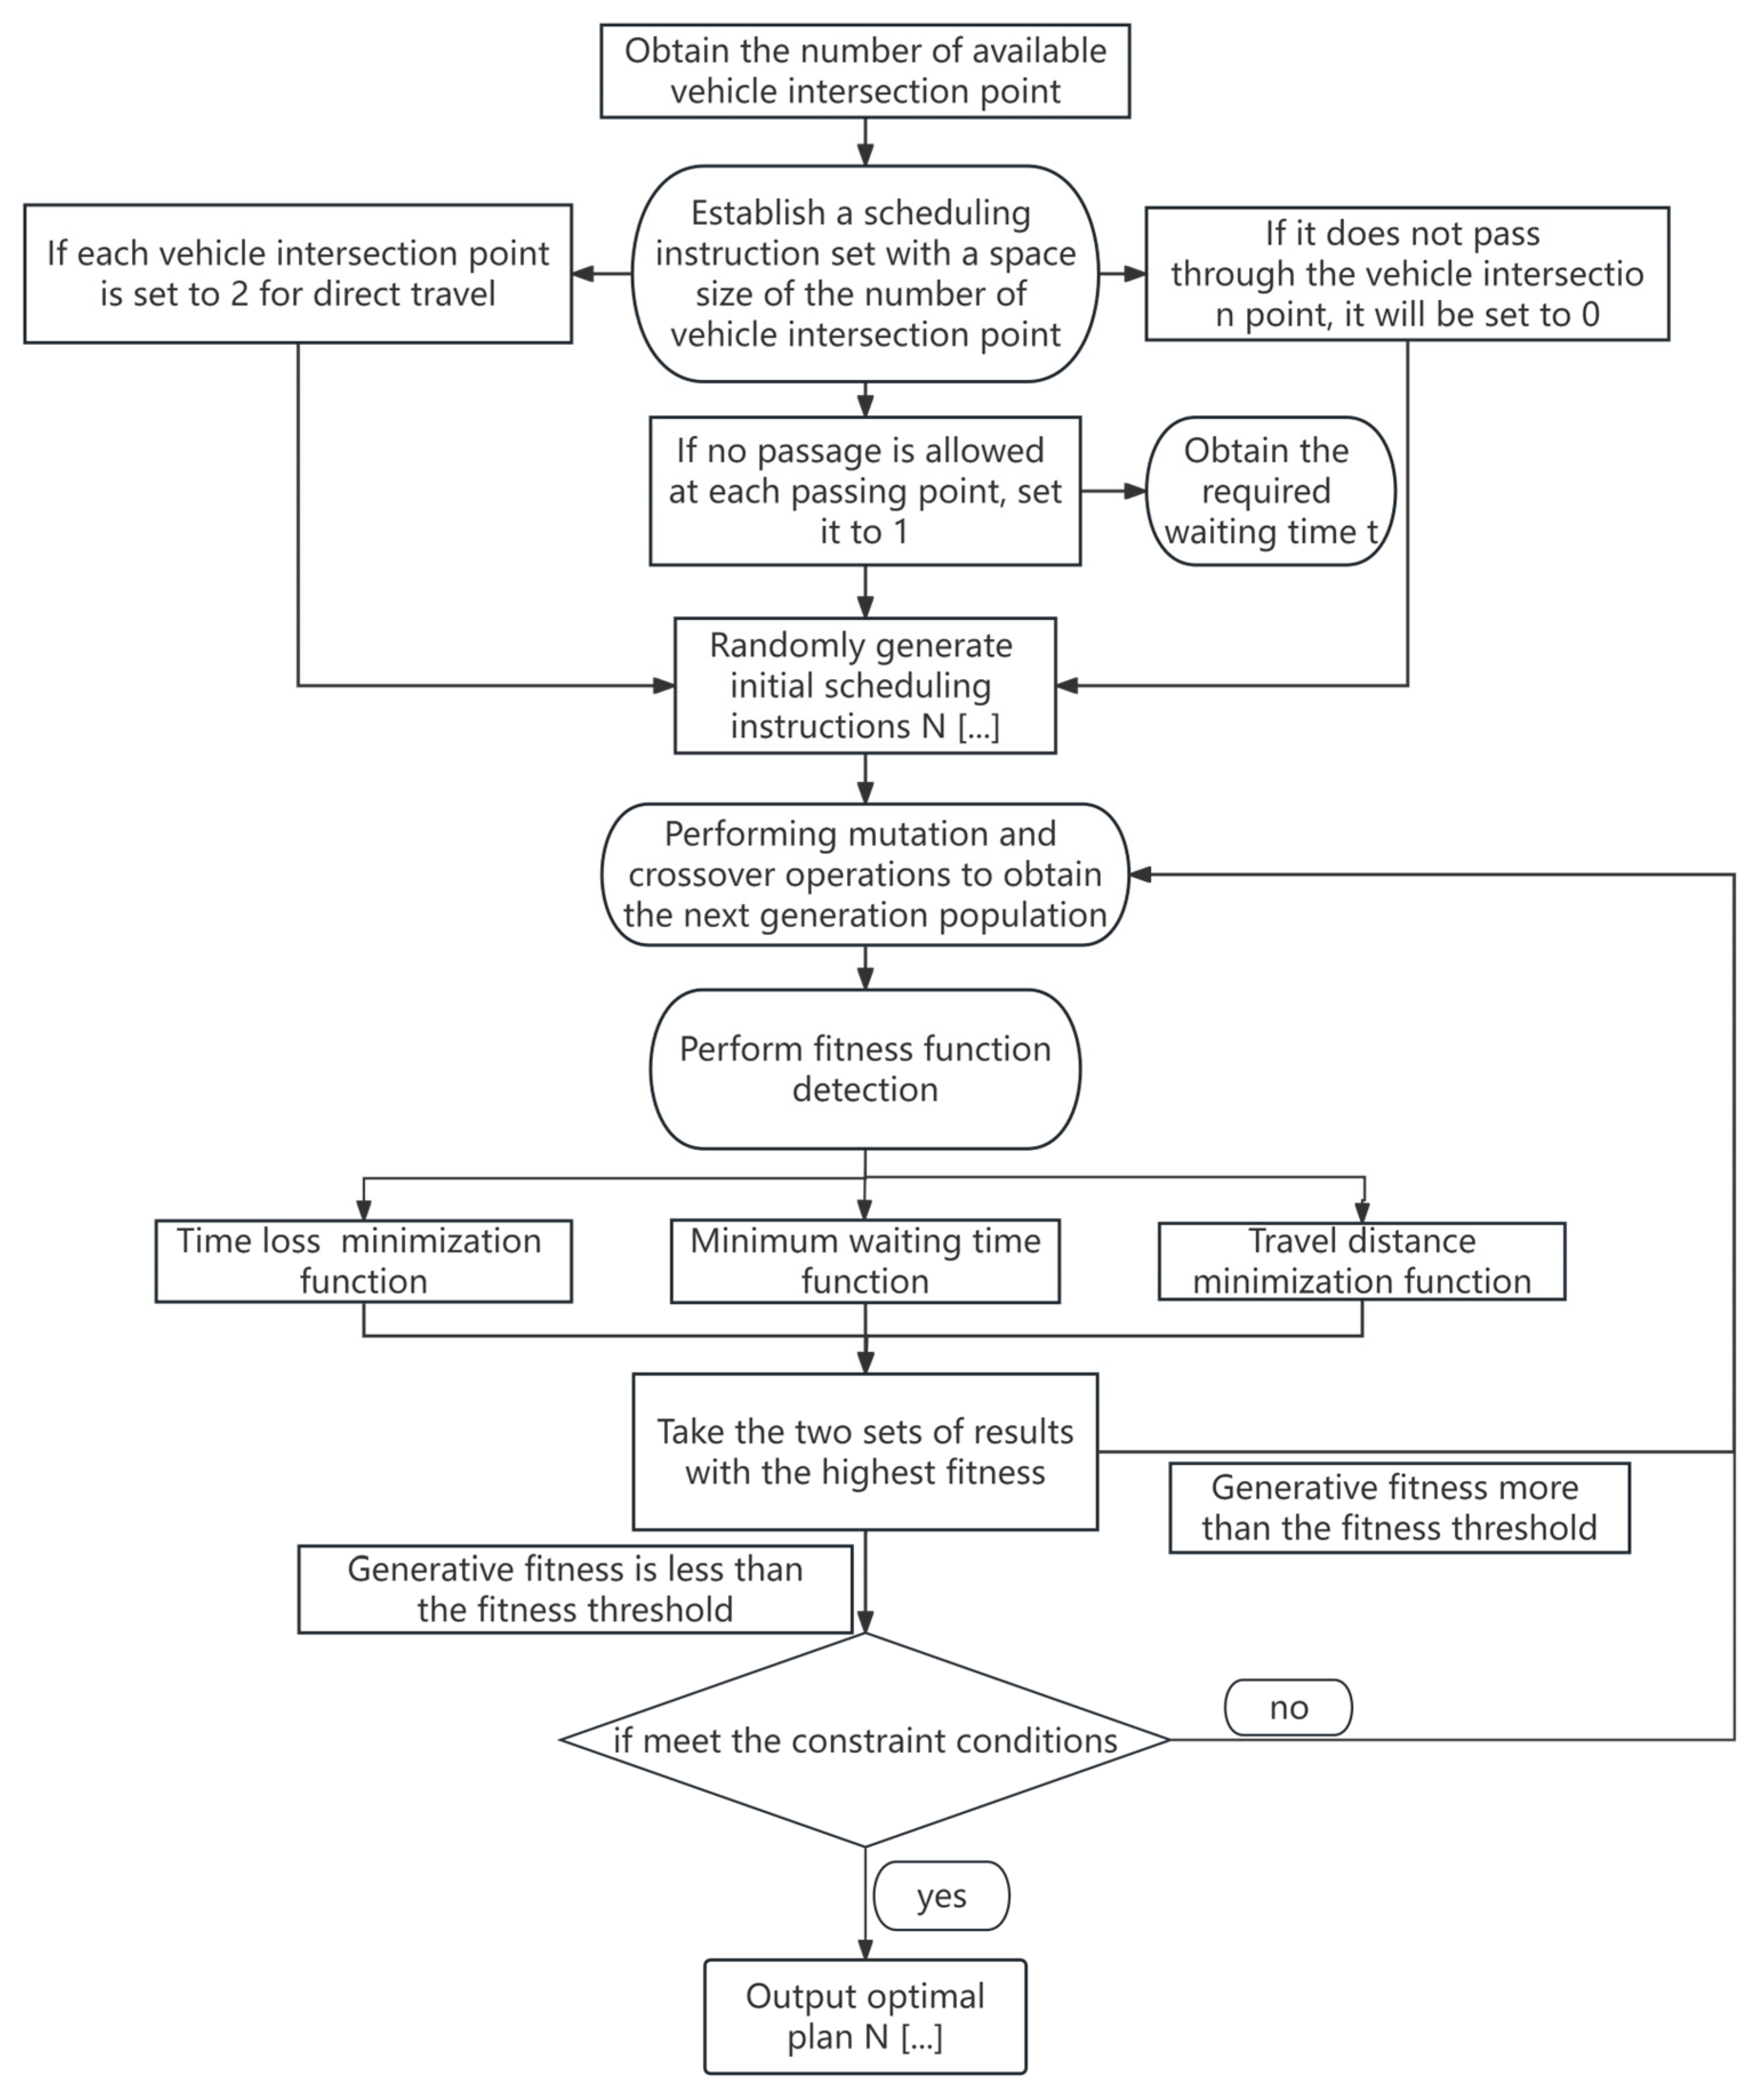
Figure 7 shows the algorithm logic of this system.
The dataset employed in this study was gathered from an underground gold mine and pertains to the navigation of vehicles through a mine devoid of tracks. The dataset comprises 100 test vehicles and three data items: vehicle trajectories, time spent on vehicle transport, and a list of vehicle transport tasks. The GA and a modified version of the GA were employed for 100 iterations each, with a population size of 31, and were executed independently 50 times to obtain the population fitness average.

5.2.1. Convergence and Stability of Improved GA

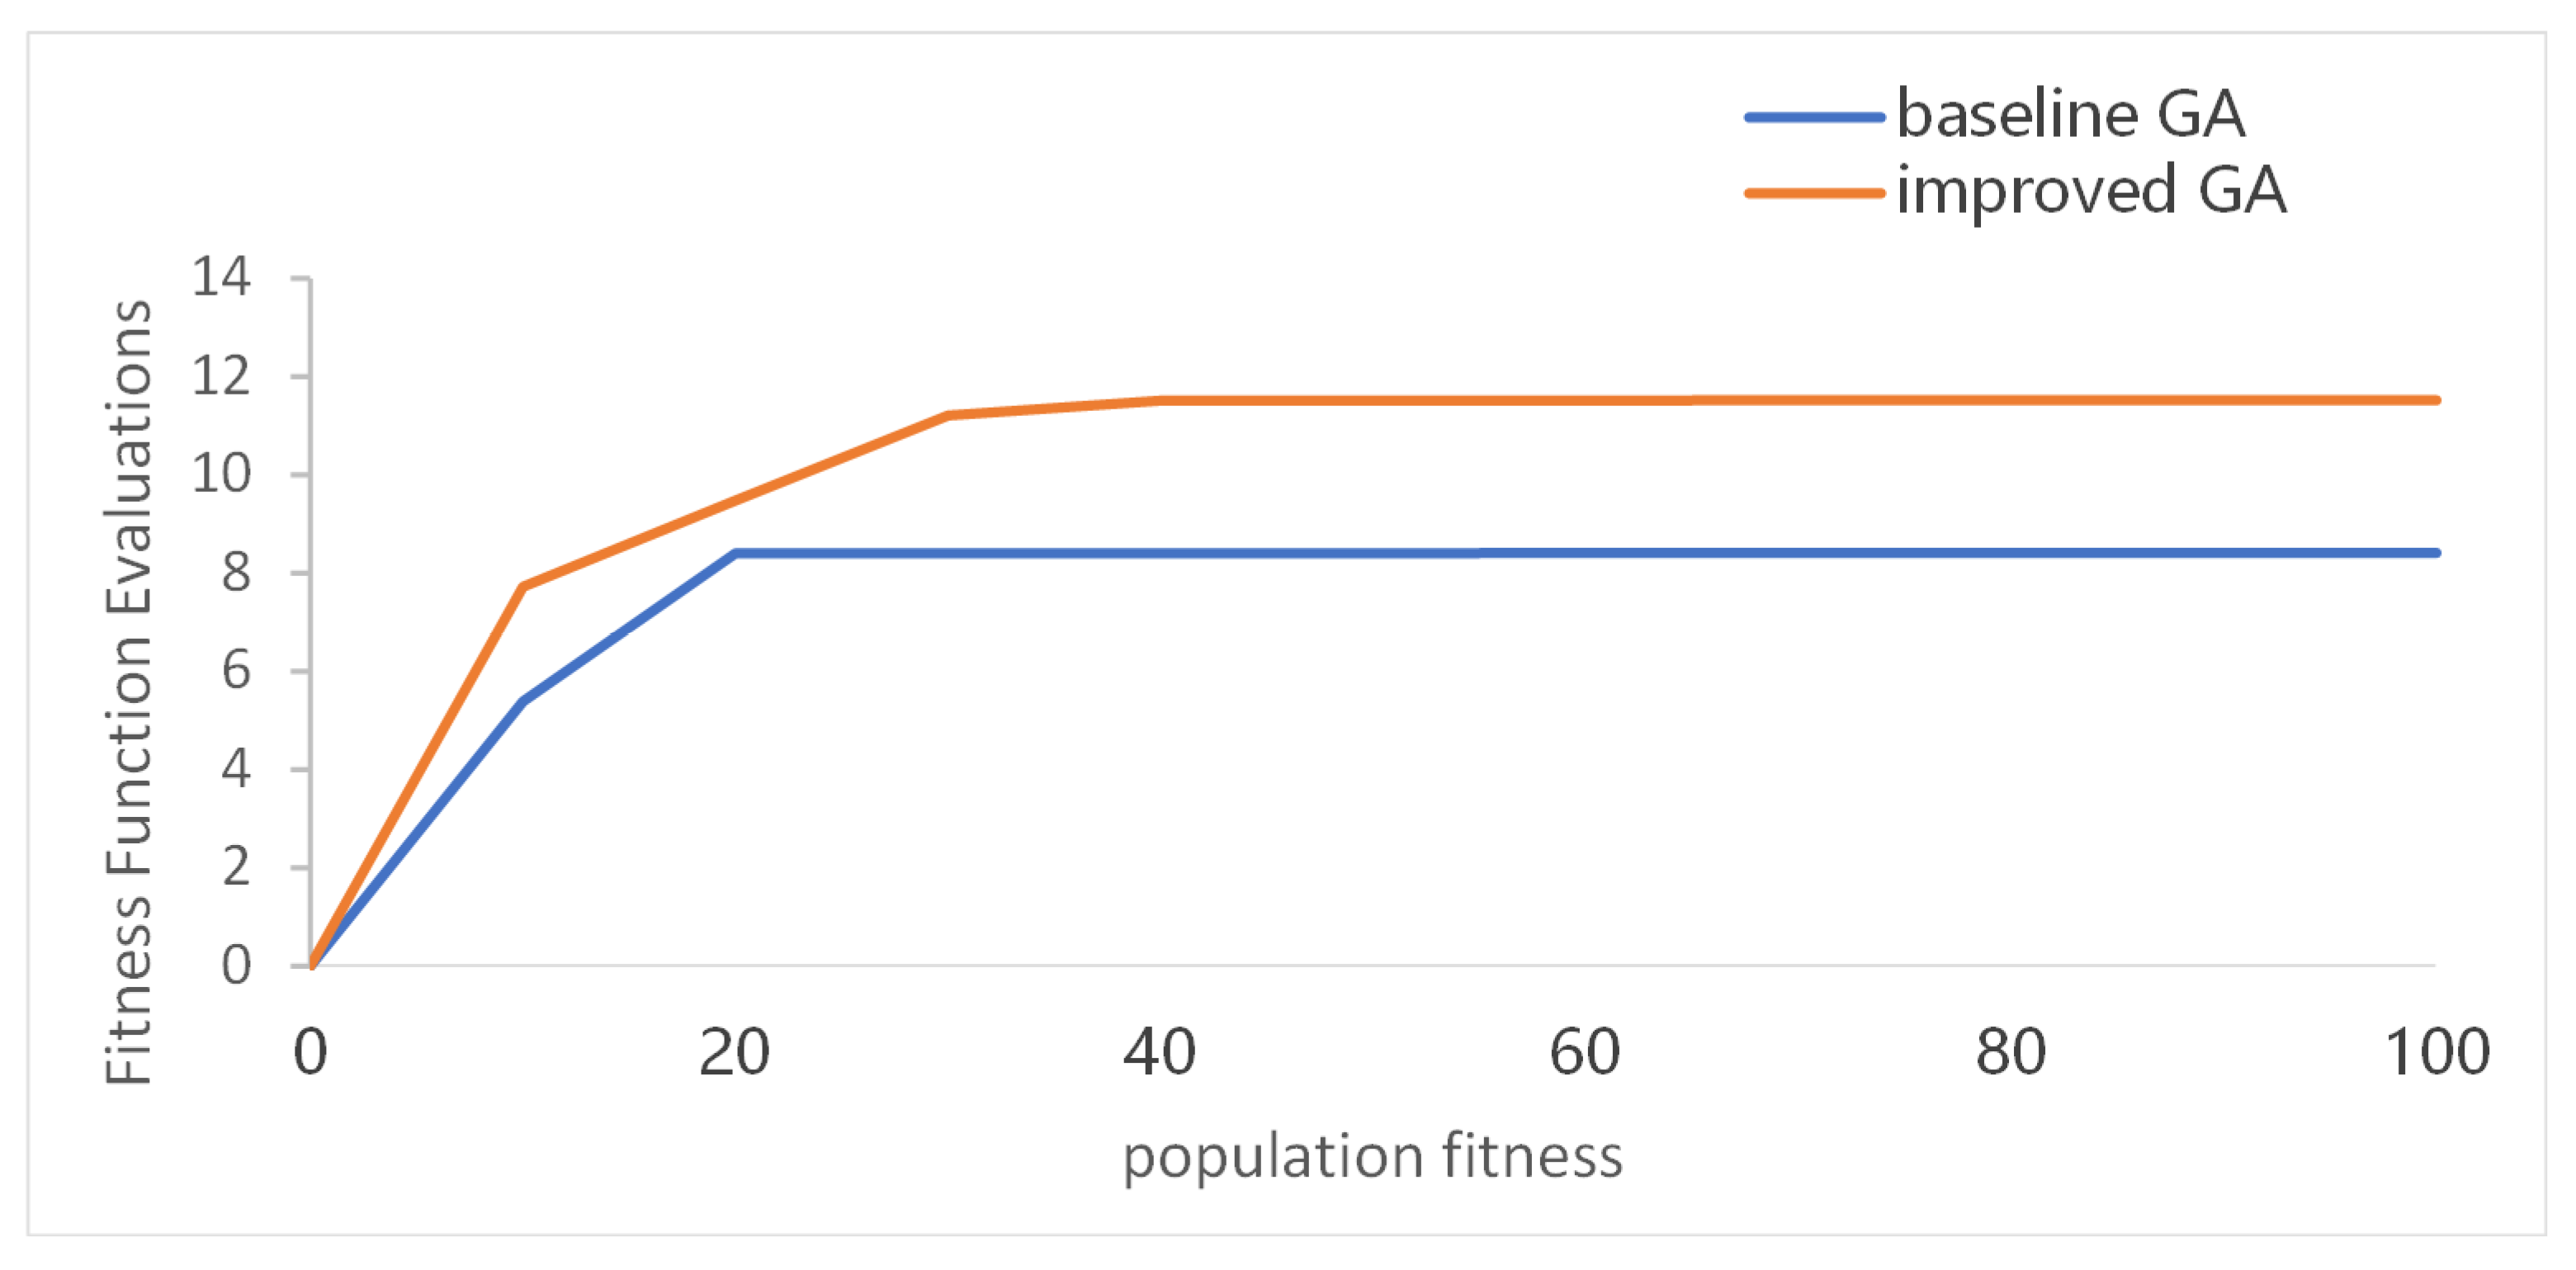
We tested how complex our algorithm is in terms of FFEs (Fitness Function Evaluations). The improved algorithm is a little more complex than the baseline GA, which does not include the vehicle traveling state in the DNA encoding. This means the vehicle has only two states: passing and not passing the node. You can see how the two algorithms compare in Figure 8 below.
The consequence of a baseline GA, driven by the imperative to circumvent route conflicts, is that vehicles will queue to depart and await the next vehicle to depart until the previous one has completed its task. Consequently, the average time between tasks is increased by 28.7 min, while the average waiting time in passing bays is reduced from 8.3 min to zero. This results in a significant increase in the overall time cost, which in turn leads to a reduction in the total adaptation. However, the speed of convergence of the algorithm is greatly increased due to the decrease in the conditionality of the optimized data.
Figure 9 illustrates that the data stability of the enhanced GA across 50 independent trials exhibits minimal variation in comparison to the baseline GA. Nevertheless, the overall adaptation data exhibit a marked improvement in comparison to the baseline GA. The mean value of the baseline GA statistics is as follows: The mean value is 8.18, while the median value is. The mean value is 8.15, with a minimum value of. The maximum value is 13.41, the standard deviation is 2.12, and the variance is 4.50. Improved GA statistics: The mean value is 11.93, while the median is. The minimum value is 12.26. The mean value is 8.44, with a maximum value of 14.89 and a standard deviation of 1.71. The variance is 2.92.

5.2.2. Reducing the Number of Iterations of the Improved GA

The scheduling of trackless transport on the ramp is a dynamic process, and the response speed of the intelligent dispatching system is greater than the actual running speed of trackless transport vehicles. And because of the time required by the signal and the driver, the response speed needs to be much greater than the running speed of the trackless transport vehicle. The underground ramp road of Sanshan Island Gold Mine is divided into 46 sections according to the meeting points in Section 3.1.1 of this paper, and traffic lights are installed at each meeting point. Excluding the personal factors of the driver of the trackless transport vehicle, it is assumed that the driver needs 2 s from seeing the traffic signal to the execution, and the greatest short-circuit section distance is 228 m. If the speed limit of the trackless transport vehicle on the ramp is 25 km/h, 32.8 s is required from the beginning to the end of the shortest circuit section in the limit case, so the response time of the system shall not be greater than the difference between the two. Since the total number of operating vehicles in the underground ramp of Sanshan Island Gold Mine is about 100, the response time should be less than 0.308 s.
The termination condition of the end cycle of the genetic optimization algorithm is the total fitness for one round of cycles greater than the total fitness of the basic solution obtained in the next cycle:
γ n γ n + 1
In this case, because the data accuracy of the floating-point float format data is six decimal places, the response time of the simulation operation is more than 0.308 s, so the accuracy threshold of the algorithm’s fitness needs to be set. In this case, six sets of comparison experiments are carried out: the fitness accuracy threshold of the algorithm is set to maintain the float accuracy—that is, 6 decimal places—and the decimal places of 5 bits, 4 bits, 3 bits, 2 bits, 1 bit, and an integer that reduce the accuracy. The response time data are obtained as shown in Figure 10: (output accuracy of time function in bits for 0.001 ms).
According to the data, the response time when the fitness accuracy threshold of the algorithm is set to maintain the response time of the system is less than the running time of the trackless transport vehicle, so it can be considered that the algorithm has good convergence and the response sensitivity meets the actual needs of the project.

5.3. Data Analysis of the Experimental Results

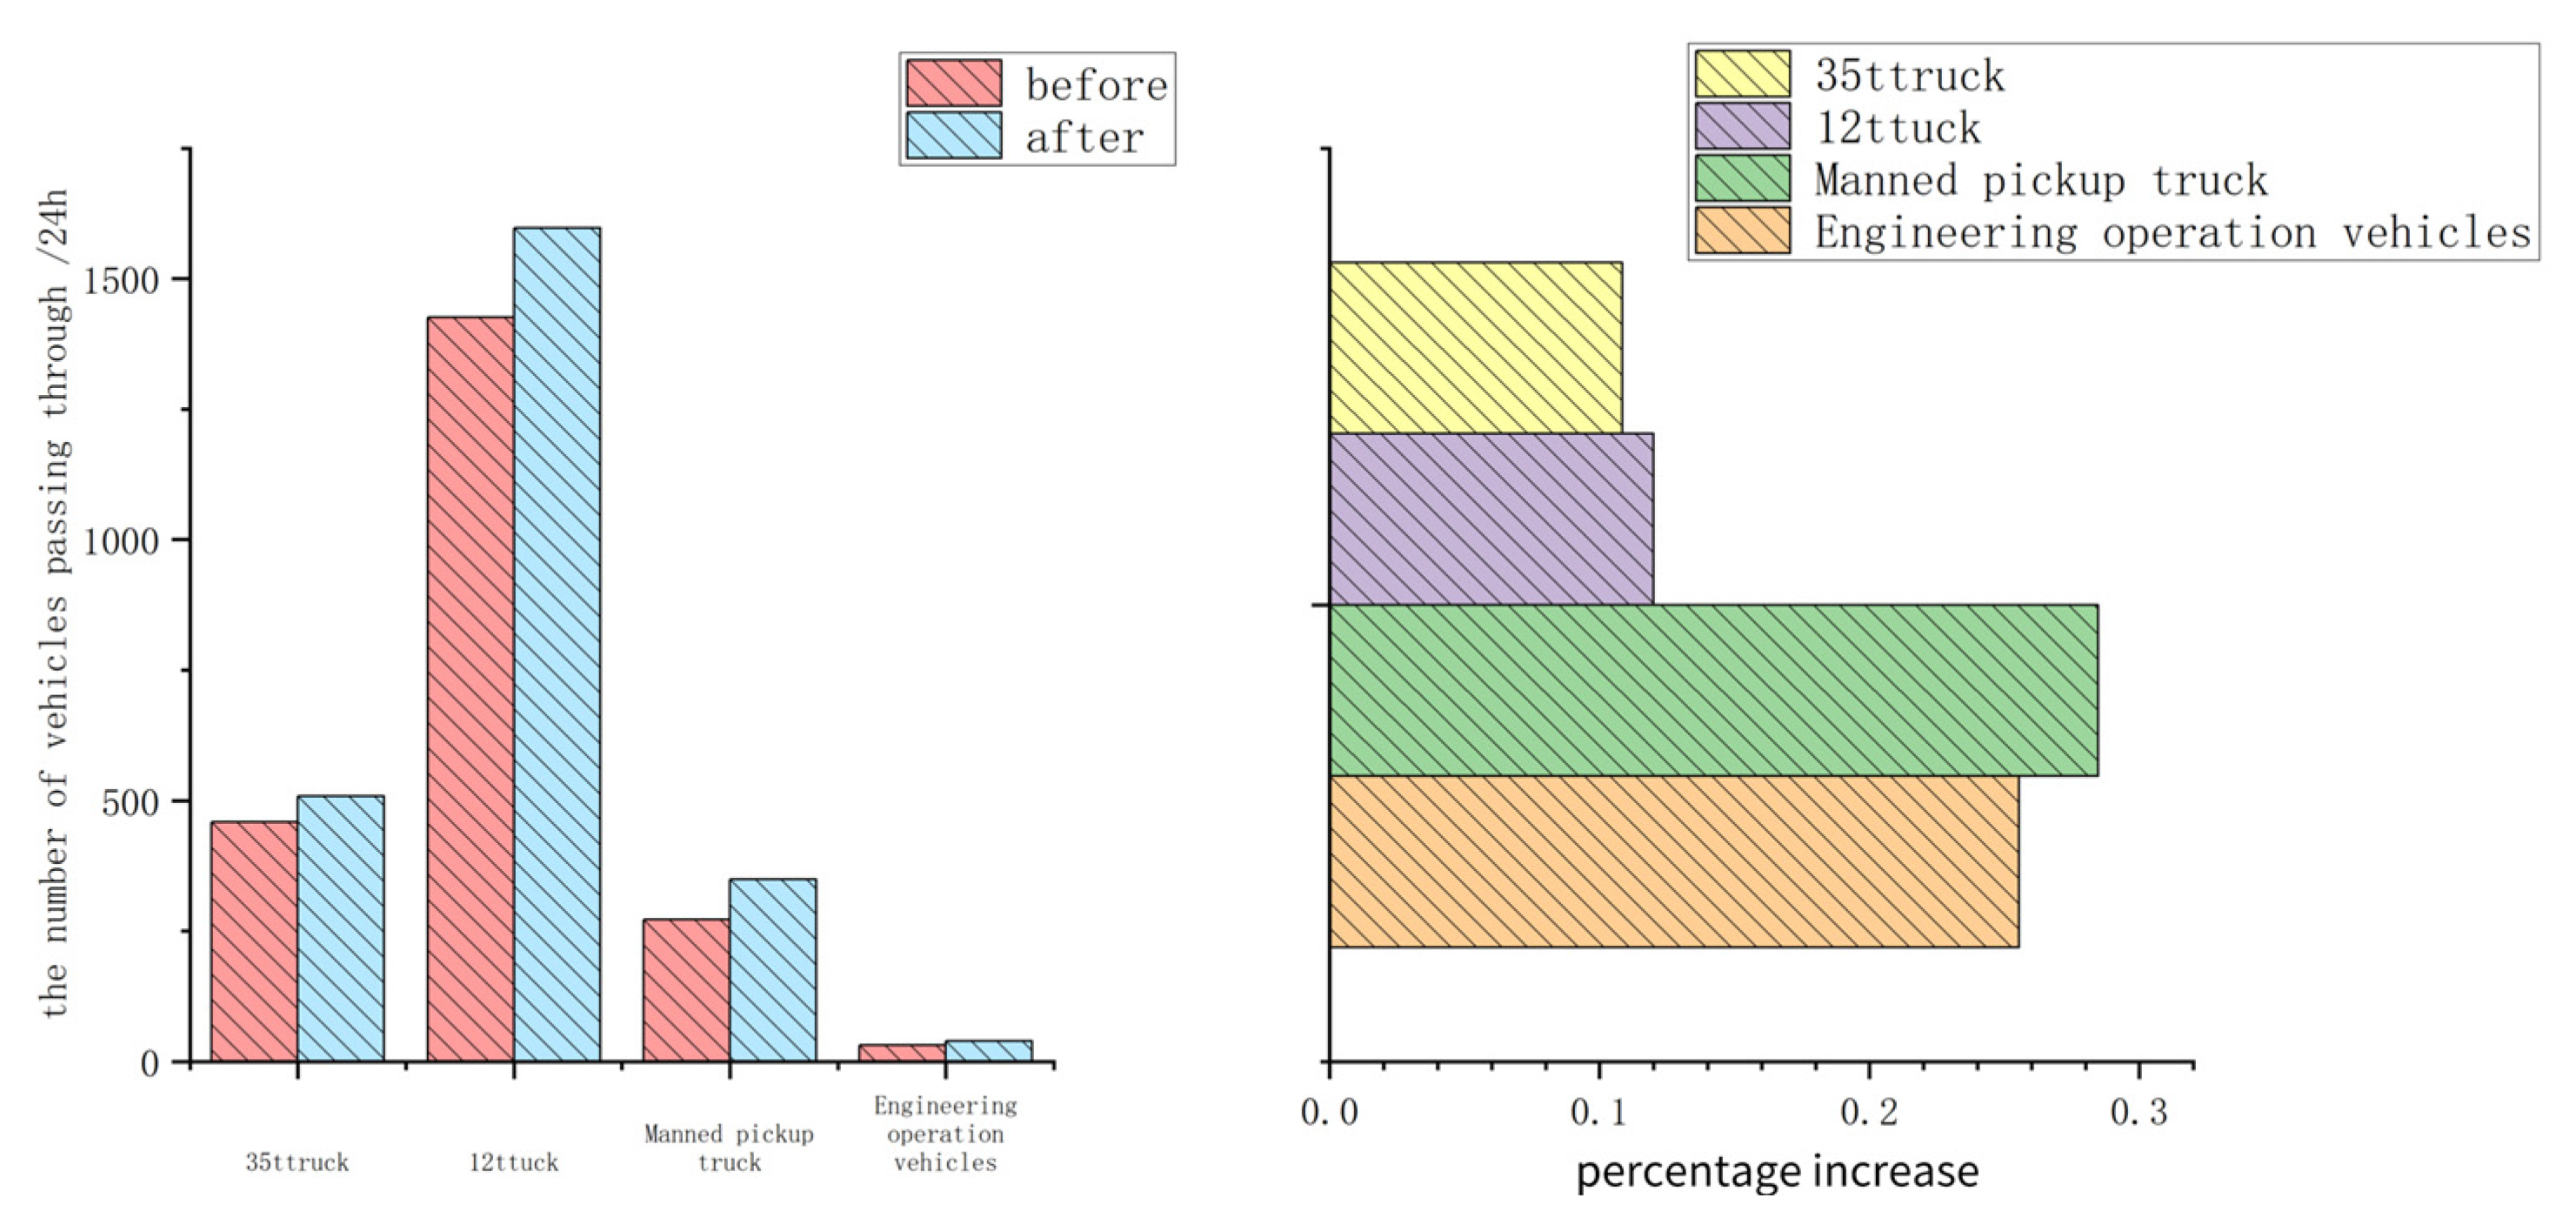
5.3.1. Number of Vehicles Passing through the Ramp Per 24 H

The number of vehicles passing through the ramp every 24 h can simply and directly reflect the road traffic efficiency of the ramp. The trackless transport vehicle passes the ramp per unit time, which refers to the process of entering the ramp from the fork at the surface or the middle to leaving the ramp from the surface or the middle. For each completion into the ramp and leaving the ramp, the count will be added on the statistical table. The more different types of vehicles pass every 24 h, the higher the traffic efficiency of the ramp, and the more efficient the trackless transport vehicles are in completing the transportation task.
According to the simulation experiment data as shown in Figure 11, the number of electric trucks carrying 35 t and diesel trucks carrying 12 t increased by 10.84% and 12.01% per 24 h, respectively, while the number of manned pickup trucks and engineering vehicles such as shovel machines increased by 28.47% and 25.54%, respectively. Among them, the increase in the number of transport trucks is significantly reduced compared with the increase in the latter two vehicles, which is because the priority of transport trucks is higher than the latter two in actual production. In the process of the trackless transport vehicle passing, the trackless transport vehicle with lower priority reverses to the nearest passing bays, so the optimization algorithm improves the traffic efficiency of the trackless transport vehicle with lower priority.

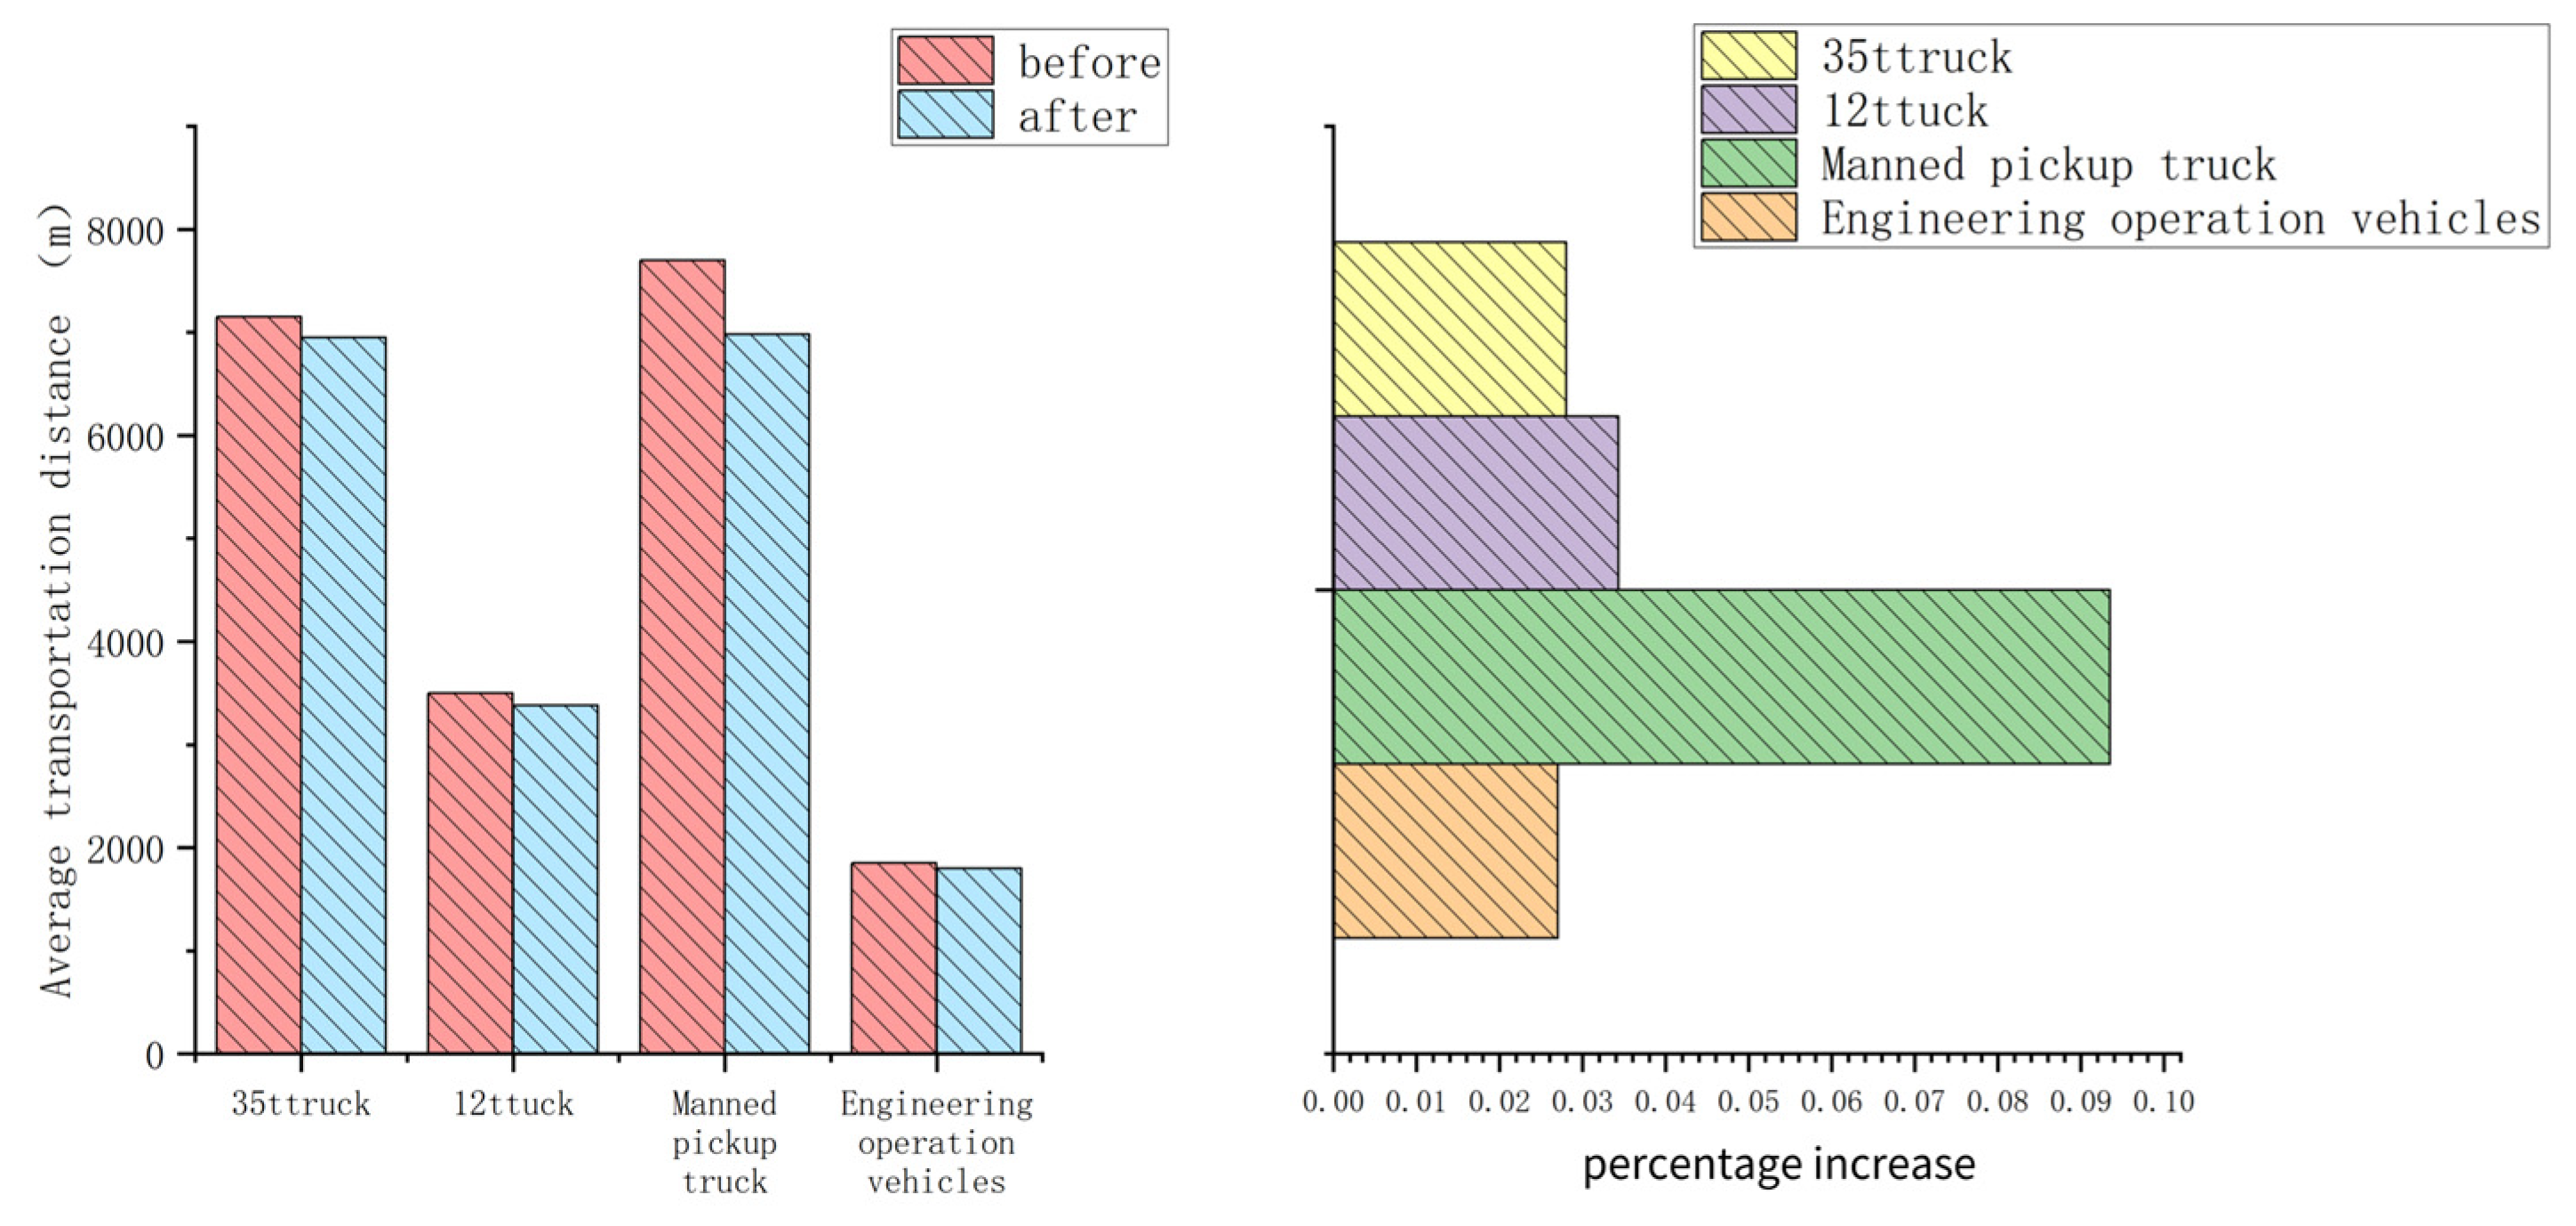
5.3.2. Average Travel Distance of the Trackless Transport Vehicles

This means each time the trackless transport vehicle completes the transport mission and arrives at the beginning of the next mission. The improvement in the average transport distance by the optimization algorithm is mainly reflected in the fact that when the optimized scheduling is not used, the two vehicles need to reverse to the nearest passing bays. After the completion of the trackless transport vehicle passing, the reversing section and the repassing section of the trackless transport vehicle passing are completely wasted. Therefore, when performing optimized scheduling, it can avoid invalid trips being caused, thus reducing the average transport distance of vehicles.
The simulated experimental data show that the average travel of the four different models is reduced after the optimization algorithm. As shown in Figure 12, while the average travel of the 35 t electric truck decreased from 7150 m to 6950 m, down by 2.8%, the average travel of the 12 t diesel truck decreased from 3500 m to 3380 m by 3.43%. The average travel of the manned pickup truck was significantly reduced from 7700 m to 6980 m, or 9.35%, and the average travel decreased from 1850 m to 1800 m, a decrease of 2.70%. It can be seen from the change in the average trip data before and after optimization that the optimization algorithm improves the most for the average stroke of cars with low priority and long average stroke.

5.3.3. Transportation Costs of Vehicles

The transportation cost of the trackless transport vehicle is mainly reflected in the fuel consumption and the loss of the tires. It is known that the fuel consumption cost of the diesel mine dump truck is 0.4 ~ 0.5 yuan/t × km, and the average annual consumption of mine truck tires is 79 pieces. Using the optimization algorithm can effectively reduce the reverse operation of trackless transport vehicles because of vehicle passing, greatly reducing the number of vehicle braking and acceleration, and, at the same time, also reducing the invalid travel of trackless transport vehicles, thus greatly extending the service life of the tire and engine, reducing the trackless transport vehicle fuel consumption, and reducing the use of the trackless transport vehicle loss rate, significantly reducing the transportation cost of mine production. The experimental data are shown in Figure 13.
The results of the simulated experimental data indicate that the optimization algorithm has the greatest impact on reducing the transportation cost of the manned pickup truck. The transportation cost was reduced from 11.2 yuan/t to 8.1 yuan/t, representing a 27.68% saving. Similarly, the transportation cost of the 12 t diesel truck was reduced from 14.3 yuan/t to 12.4 yuan/t, resulting in a 13.29% saving. Finally, the transportation cost of the 35 t electric truck was reduced from 45.5 yuan/t to 42.7 yuan/t, representing a 6.15% saving. The transportation cost is shown in Figure 14.

5.3.4. Passage Duration of the Ramp

The passage time of the ramp is defined as the time required for the simulated vehicle to traverse the ramp from the surface to the underground end. This measurement can be used to assess the patency degree of the ramp. Following the implementation of the optimization algorithm, the trackless transport vehicle is required to reverse for an extended period due to the trackless transport vehicle passing, resulting in a significant loss of time and the formation of traffic jams on the ramp. The experimental data from the simulation indicate that the walk from the surface to the slope underground takes 4.7 h before the implementation of the optimization algorithm. In contrast, the passage time of the optimization algorithm is reduced to 3.3 h, representing a significant reduction of 29.79%.

6. Conclusions

This paper examines the blockage of underground two-way one-way ramps. Given that the ramp is unable to reverse at the non-passing bay and that the interval fuzzy positioning method is employed, the ramp is divided and the real-time position section number of each vehicle is stored in the queue array. This method avoids the real-time reading of the position of trackless transport vehicles, reduces the spatial complexity of the algorithm, and can significantly improve the response speed of the algorithm and the requirements of the chip.
At the same time, the daily production and transportation tasks are optimized by an improved genetic algorithm. The fitness function is established from three aspects: traffic priority, transportation time cost, and distance cost. This is in accordance with the actual production requirements of the mine. The algorithm is more suitable for ramp path planning by improving the coding method. Finally, this study designs a simulation experiment according to the actual production and transportation situation of the project site. This experiment evaluates the comprehensive optimization effect of the proposed algorithm for different kinds of vehicles running on the ramp. The data indicate that the optimization algorithm is more effective when the priority is lower and the travel time is longer. In particular, for manned pickup trucks and other low-priority vehicles, the comprehensive indicators can be optimized and improved by more than 28%. However, for trackless transport vehicles such as mining trucks with the highest traffic priority and a close relationship to production efficiency, the optimization effect of the average travel and transportation cost is less than 10%, and the improvement is not significant. Nevertheless, the substantial reduction in blockage on the slope road has led to a notable enhancement in the driving speed and transportation efficiency of all vehicle types.
The research presented in this thesis is not without limitations and offers scope for further exploration in the future. 1. The simulation experiments are based on specific mine conditions. It remains to be seen whether they are applicable to other underground metal mines of the same type or even non-metal underground mines in the trackless transport. In the future, it would be beneficial to conduct experiments in a greater variety of mining conditions in order to assess the adaptability of the algorithm to differing mining conditions. 2. The transport scheduling only considers the route planning on the ramp. For underground mines, the route planning of vehicles in roadways has yet to be incorporated into the algorithmic optimization calculation. This is a crucial area for future research.

Author Contributions

Conceptualization, X.Z.; Methodology, W.M.; Software, W.M.; Validation, W.M.; Data curation, W.M.; Writing—original draft, W.M.; Supervision, X.Z.; Funding acquisition, X.Z. All authors have read and agreed to the published version of the manuscript.

Funding

This research work was supported by the Key Project of the National Natural Science Foundation of China (52130403).

Data Availability Statement

The datasets presented in this article are not readily available because the data are part of a commercial secret. Requests to access the datasets should be directed to author.

Conflicts of Interest

The authors declare no conflict of interest.

References

  1. Runcai, B. Study on Real-Time Scheduling Optimisation Decision-Making System for Trucks in Open-Pit Mines and Forecasting of Application Effect. Ph.D. Thesis, Liaoning Technical University, Fuxin, China, 2005. Available online: https://kns.cnki.net/kcms2/article/abstract?v=Fc1KeZPKhRH8MtHRuSViH-AH1r_M49tp_TM7VBdkCDabVi8PR46IrRC6-MlkAuV1Ygc9L9-sR3Dn-5lw1U8qRc9fDIgJOJNu5W0O_DbwtZZQH7baW1rMw_7sMx4UjIU-1vj-oCREglovN4XfQ9DCYGQnFQ9S82mdDutFerLYAmnGDw40xjicU7QxgWZ35hoOTm840h_I3-8=&uniplatform=NZKPT&language=CHS (accessed on 26 September 2024).
  2. Weintraub, A.; Aboud, J.; Fernandez, C.; Laporte, G.; Ramirez, E. An emergency vehicle dispatching system for an electric utility in Chile. J. Oper. Res. Soc. 1999, 50, 690–696. [Google Scholar] [CrossRef]
  3. Beaulieu, M.; Gamache, M. An enumeration algorithm for solving the fleet management problem in underground mines. Comput. Oper. Res. 2006, 33, 1606–1624. [Google Scholar] [CrossRef]
  4. Hou, J.; Li, G.; Chen, L.; Wang, H.; Hu, N. Optimization of Truck-Loader Matching Based on a Simulation Method for Underground Mines. Sustainability 2023, 15, 216. [Google Scholar] [CrossRef]
  5. Yu, S.W.; Ding, C.; Zhu, K.J. A hybrid GA-TS algorithm for open vehicle routing optimization of coal mines material. Expert Syst. Appl. 2011, 38, 10568–10573. [Google Scholar] [CrossRef]
  6. Wang, H.; Li, G.Q.; Hou, J.; Chen, L.Y.; Hu, N.L. A Path Planning Method for Underground Intelligent Vehicles Based on an Improved RRT* Algorithm. Electronics 2022, 11, 294. [Google Scholar] [CrossRef]
  7. Wang, H.; Zhang, X.X.; Yuan, H.; Wu, Z.G.; Zhou, M. A Lean Scheduling Framework for Underground Mines Based on Short Interval Control. Sustainability 2023, 15, 9195. [Google Scholar] [CrossRef]
  8. Omar, M.T.; Gope, M.; Khandaker, A.I.; Shill, P.C. Multi Objective Non-dominated Sorting Genetic Algorithm (NSGA-II) for Optimizing Fuzzy Rule Base System. In Proceedings of the 2nd International Conference on Electrical Information and Communication Technology (EICT 2015), Khulna, Bangladesh, 10–12 December 2015; pp. 83–88. [Google Scholar]
  9. Pei, Y.Q.; Zhao, S.W.; Yang, X.Y.; Cao, J.H.; Gong, Y. Design optimization of a SRM motor by a nature-inspired algorithm: Multi-Verse Optimizer. In Proceedings of the 13th IEEE Conference on Industrial Electronics and Applications (ICIEA), Wuhan, China, 31 May–2 June 2018; pp. 1870–1875. [Google Scholar]
  10. Deb, K.; Pratap, A.; Agarwal, S.; Meyarivan, T. A fast and elitist multiobjective genetic algorithm: NSGA-II. IEEE Trans. Evol. Comput. 2002, 6, 182–197. [Google Scholar] [CrossRef]
  11. Li, J.G.; Zhan, K. Intelligent Mining Technology for an Underground Metal Mine Based on Unmanned Equipment. Engineering 2018, 4, 381–391. [Google Scholar] [CrossRef]
  12. Chen, X.; Wang, Z. A Review of Research on Decision Support Systems Theory and Methodology. Control Decis. Mak. 2006, 961–968. [Google Scholar] [CrossRef]
  13. Wang, X. Design of automated management system for underground auxiliary transport in coal mine. Low Carbon World 2021, 11, 76–77. [Google Scholar] [CrossRef]
  14. Saayman, P.; Craig, I.K.; Camisani-Calzolari, E. Optimization of an autonomous vehicle dispatch system in an underground mine. J. S. Afr. Inst. Min. Metall. 2006, 106, 77–86. [Google Scholar]
  15. Li, S. Design of a new auxiliary transport system based on AI vision for underground in shaft coal mines. Autom. Appl. 2024, 65, 56–58+64. [Google Scholar] [CrossRef]
  16. Holland, J.H. Adaptation in Natural and Artificial Systems; University of Michigan Press: Ann Arbor, MI, USA, 1975. [Google Scholar]
  17. Yi, T. Research on Scheduling Strategy of Underground Trackless Transport Equipment Based on Genetic Algorithm. Bachelor’s Thesis, University of Science and Technology of China, Hefei, China, 2009. [Google Scholar]
  18. Wolpert, D.H.; Macready, W.G. Coevolutionary free lunches. IEEE Trans. Evol. Comput. 2005, 9, 721–735. [Google Scholar] [CrossRef]
  19. Mirjalili, S.; Lewis, A. The Whale Optimization Algorithm. Adv. Eng. Softw. 2016, 95, 51–67. [Google Scholar] [CrossRef]
  20. Vijayalakshmi, N.; Yuvaraj, S.; Baskar, V.V.; Krishnaswamy, R.; Sasikala, K.; Srinivasan, C. Optimized Control of IoT-Monitored Microgrid Systems Using Genetic Algorithm. In Proceedings of the 2023 International Conference on Power Energy, Environment & Intelligent Control (PEEIC), Greater Noida, India, 19–23 December 2023; pp. 1014–1018. [Google Scholar]
  21. Zivkovic, M.; K, V.; Bacanin, N.; Djordjevic, A.; Antonijevic, M.; Strumberger, I.; Rashid, T.A. Hybrid Genetic Algorithm and Machine Learning Method for COVID-19 Cases Prediction. In Proceedings of International Conference on Sustainable Expert Systems; Springer: Singapore, 2021; pp. 169–184. [Google Scholar]
  22. Feng, G. Research on Design Method and Intelligent Scheduling of Underground Auxiliary Transport System in Coal Mine. Ph.D. Thesis, Shandong University of Science and Technology, Qingdao, China, 2011. Available online: https://kns.cnki.net/kcms2/article/abstract?v=Fc1KeZPKhRFGrZda4bbqqXRRSc1abN0kS2tzLH6Skvpbtl7dL0T771tLm1Ngtgz8QHNRK-SInY7spRKFeNkZ5MKPRcYHNuRUSIxbLBGPCsNE1VzDu1PNL9sbRRCYqX4BvEJUe0NPosjO9aJujUIOtFPRWxpKsoB68hSwCWN81TyYkNa1LAZ00qRbZEkpC8Ajl9I6ET0GtCA=&uniplatform=NZKPT&language=CHS (accessed on 26 September 2024).
  23. Zhao, H.; Zeng, C.; Wang, L.; Li, F.; Zhang, B. Development and Application of Intelligent Avoidance System for Trackless Transport in Long-distance Single-lane Tunnels. Tunn. Constr. 2021, 41, 956–963. [Google Scholar]
  24. Astrand, M.; Johansson, M.; Feyzmahdavian, H.R. Short-Term Scheduling of Production Fleets in Underground Mines Using CP-Based LNS. In Proceedings of the 18th International Conference on the Integration of Constraint Programming, Artificial Intelligence, and Operations Research (CPAIOR), Vienna, Austria, 5–8 July 2021; pp. 365–382. [Google Scholar]
  25. Astrand, M.; Johansson, M.; Zanarini, A. Underground mine scheduling of mobile machines using Constraint Programming and Large Neighborhood Search. Comput. Oper. Res. 2020, 123, 105036. [Google Scholar] [CrossRef]
  26. Guo, D.M.; Li, G.Q.; Hu, N.L.; Hou, J. System Dynamics Analysis of Man-Machine Efficacy in Plateau Mines. IEEE Access 2021, 9, 18072–18084. [Google Scholar] [CrossRef]
Figure 1. The schematic diagram of the scheduling system.
Applsci 14 09862 g001
Figure 2. GA process.
Applsci 14 09862 g002
Figure 3. Flow chart of vehicle array transformation.
Applsci 14 09862 g003
Figure 4. Original road model.
Applsci 14 09862 g004
Figure 5. Flow chart of the mathematical model.
Applsci 14 09862 g005
Figure 6. Underground operating vehicles.
Applsci 14 09862 g006
Figure 7. Algorithm logic of the scheduling system.
Applsci 14 09862 g007
Figure 8. Relationship between the number of algorithm iterations and population fitness.
Applsci 14 09862 g008
Figure 9. Box plot diagrams of the objective function across independent runs.
Applsci 14 09862 g009
Figure 10. Response time data line chart.
Applsci 14 09862 g010
Figure 11. The number of vehicles passing through.
Applsci 14 09862 g011
Figure 12. Average transportation distance.
Applsci 14 09862 g012
Figure 13. Changes in average number of reversals.
Applsci 14 09862 g013
Figure 14. Transportation cost.
Applsci 14 09862 g014
Disclaimer/Publisher’s Note: The statements, opinions and data contained in all publications are solely those of the individual author(s) and contributor(s) and not of MDPI and/or the editor(s). MDPI and/or the editor(s) disclaim responsibility for any injury to people or property resulting from any ideas, methods, instructions or products referred to in the content.

