Article

On the Use of Image Analysis for Hematocrit Evaluation in Dried Blood Spots

1
Laboratory of Pharmaceutical Analysis, Department of Pharmacy, National and Kapodistrian University of Athens, Panepistimiopolis, 157 84 Athens, Greece
2
Department of Drug Analysis, Faculty of Pharmacy, University of Belgrade, Vojvode Stepe 450, 11000 Belgrade, Serbia
*
Author to whom correspondence should be addressed.
Appl. Sci. 2024, 14(21), 9860; https://doi.org/10.3390/app14219860
Submission received: 12 September 2024 / Revised: 24 October 2024 / Accepted: 26 October 2024 / Published: 28 October 2024
(This article belongs to the Section Applied Biosciences and Bioengineering)

Abstract

:
Dried blood spots (DBSs) are formed by collecting a small sample of blood on specialized filter paper and allowing it to dry naturally. Various domains of life sciences and drug research extensively use DBSs as a sampling technique. The “Hematocrit (Ht) effect” affects assay bias, and several strategies have been put forth to deal with it, including the correction of quantified concentrations using an appropriate correction factor. The approach was previously applied, following the utilization of an image processing algorithm developed in Matlab® to derive a reliable equation correlating DBS areas to Ht% values. The present work looks more closely at the application of image analysis to the evaluation of Ht in DBS samples. Utilizing image analysis software, DBS samples with known Ht values were processed. Preparation of cards has followed a previously developed protocol for the appropriate formation of uniform area DBSs, irrespective of Ht. The resulting areas showed close resemblance to the respective theoretical areas calculated by applying the correlation equation. Following that, the equation was utilized to determine the Ht values for each sample, and a comprehensive comparison of measured versus calculated Ht was carried out using various statistical approaches for method comparison. The results demonstrated a strong correlation, suggesting the method’s viability in estimating Ht for unknown DBS samples.

1. Introduction

Dried blood spots (DBSs) consist of a methodology employed for the collection and storing of blood specimens on specialized filter paper. The first application of DBSs for medical diagnostic purposes took place during the early 1960s and included a simple test for the metabolic disorder phenylketonuria [1]. This approach laid the groundwork for the application of DBSs in neonatal screening programs globally, encompassing a wide array of biochemical and genetic analyses in this vulnerable population [2]. The utilization of capillary blood in neonates and adults renders this technique minimally invasive, thereby permitting the collection of DBS samples without the need for healthcare personnel involvement, as is typically required for venipuncture procedures.
Sample collection and storage are both efficient and affordable, and sample transportation can be carried out without requiring special conditions. The stability of dried samples is typically high, allowing for easy mailing to the laboratory using regular post. The utilization of DBS specimens has become increasingly viable due to advancements in highly sensitive mass spectrometry technologies. This method is now widely utilized across various disciplines within life sciences and pharmaceutical research. Due to the definite advantages of DBSs, applications nowadays include, as already mentioned, neonatal screening, as well as therapeutic drug monitoring [3], toxicological [4] and pharmacokinetic studies [5,6].
However, many difficulties still remain [7], such as issues related to the homogeneity of the sample, the impact of the punching site, the reliability of the filter paper’s performance and chromatographic effects, as well as the relationship between the concentrations of a particular analyte in the venous and capillary blood. One of the most contested challenges with DBSs is the so-called “hematocrit (Ht) effect”, which refers to the effect of Ht values on the concentration measurements [8,9,10]. Numerous factors, including age, gender, ethnicity, diet and medical conditions, can affect the measured Ht values, which can significantly vary between individuals and with different disease states [11]. Blood viscosity is known to be impacted by Ht, which in turn affects how easily blood can spread onto DBS filter paper. As there is an increase in blood cells at high Ht levels, the blood becomes more viscous. Blood flux and diffusion characteristics on the filter paper collection device are affected due to viscosity variations, which can therefore have an impact on the size of the blood spots that are formed. There is an inverse relationship between the Ht of blood spots and the area of the blood spots for cellulose-based substrates at a fixed volume of blood (Figure 1).
The previously mentioned Ht effect contributes to the measurement bias of the analytical method, partly due to the fact that many DBS techniques use a fixed-diameter puncher (a partial punch of the spot); more blood is present in a fixed-size disc punched from a high-Ht (smaller) spot compared to the same originating from a low-Ht (larger) spot. The literature has thoroughly defined and reviewed the potential effects of Ht on the parameters of the DBS assay (accuracy and precision, matrix effects, analyte recovery) [8,9,10,12]. As a result, for validated assays in regulated bioanalysis, the elevated variability in assay performance could occasionally surpass the existing relevant acceptance criteria for the overall level of bias. It is important to note that ICH (International Council for Harmonisation of Technical Requirements for Pharmaceuticals for Human Use) accepts as accuracy criteria for chromatographic assays a ±15% (% bias) and ±20% as the lower limit of quantitation (LLOQ) [13]. Evidently, when a punch of fixed diameter from a DBS is used, assay bias is undoubtedly affected if the Ht values of the unknown blood samples significantly deviate from the Ht values of the calibration standards; positive error for higher Ht values and negative error for lower Ht values is observed [14]. Therefore, assessment of the Ht effect should be included in the validation process to ensure the quality of DBS bioanalytical methods [13,15].
Various approaches have been put forth and investigated in the literature to address the Ht-dependent blood spreading on paper substrates [10,16,17]. Such strategies include, among others, the application of techniques such as volumetric absorptive microsampling (VAMS) [18], perforated DBSs (PDBSs) [19], the employment of microfluidic-based sampling [20,21], an internal standard addition on the paper [22], as well as the application of dried plasma spots (DPSs) rather than DBSs [23,24]. Two newer methodologies for DBS sampling via “Ht-insensitive device” have been introduced more recently, namely volumetric absorptive paper disc (VAPD) and mini-disc (VAPDmini) [25].
Another approach to addressing the Ht effect is to measure or estimate the Ht of the blood used to prepare DBSs. In the scientific literature, various methods have been suggested in this regard. The most obvious course of action would be to measure Ht directly, but indirect Ht “prediction” approaches have also been applied. Such methodologies are based on endogenous substances like potassium [26,27], sphingomyelins [28], hemoglobin content quantification [29] or Ht calculation, using methods like near-infrared spectroscopy [30] and non-contact diffuse reflectance spectroscopy [31]. Nevertheless, the majority of these methods necessitate specific equipment, rendering them unfeasible for laboratories with limited resources. Additionally, they may jeopardize the affordability and ease of use of DBS sampling.
A simpler method for mitigating the Ht effect involves the application of appropriate correction factors (i.e., formulae incorporating bias corrections by relating Ht to a physical parameter expressing the blood dispersion measurement on the paper, such as reflectance, spot diameter or DBS area). In our laboratory’s earlier research work, this strategy was thoroughly explored [32], where sample Ht values and DBSs areas were correlated via a reliable equation generated with the aid of image analysis. The premise of image analysis through spot scanning and processing using suitable software was the observation that DBSs (created by a fixed volume of blood on a particular type of filter paper) with different Ht have varying sizes.
Our present research now examines the use of image analysis for estimating Ht in DBS samples in greater detail. With the use of a battery of acknowledged statistical approaches for method comparison, a thorough comparability exercise of measured versus calculated sample Ht values was conducted, aiming to verify the suitability and applicability of the developed model for correlation of Ht and DBS area. Due to the well-established advantages of this methodology for Ht estimation, this technique consists of a useful and reliable tool that can be applicable to DBS analysis. Indeed, such a mathematical formula can afterwards be used for both calibration standards and unknown samples, and a correction factor generated by their ratio can be obtained [14]. A computational analysis focused on the application of partial DBSs for quantitative bioanalysis was further suggested for adult [14] and newborn studies [33] by using such a correction factor, offering a clear framework for the correction of Ht effects, and finally proposing a maximum, allowable level for %relative error able to satisfy general regulatory requirements for bioanalysis. A wider application of DBSs in human pharmacokinetic and clinical studies may, therefore, be achieved by the utilization of simple and easy-to-use methodologies, which can successfully address the Ht effect.

2. Materials and Methods

2.1. Materials

Whatman 903 filter papers were acquired from GE Healthcare (Buckinghamshire, UK). A 0.9% sodium chloride solution, along with blood and plasma samples, were obtained from the Clinic of Neurology and Psychiatry for Children and Youth in Belgrade, Serbia.

2.2. DBS Preparation

Two types of DBS samples were prepared: (a) those with ‘normal’ Ht values, with blood originating from patients, and (b) those with ‘rarer’ Ht values. In both cases, DBSs were prepared by carefully spiking 50 μL of blood sample onto a filter paper at the predefined positions. Each sample was added in the center of the preprinted circle by using a calibrated 20–200 μL pipette applying reverse pipetting technique. The cards were allowed to dry at room temperature for 2–3 h, shielded from light and humidity, before being placed in a plastic bag with desiccant and stored in the refrigerator.
As for blood samples with extremely low and high Ht values, they were prepared with the following procedure: Blood collected in tubes with EDTA-K3 was centrifuged at 5000 rpm for 5 min. The plasma was then separated, and the remaining erythrocytes were washed three times with 0.9% NaCl, followed by additional centrifugation cycles. Plasma was subsequently added in the appropriate amounts to achieve blood samples with the specified hematocrit levels (both low and high).

2.3. Ht Measurement

Ht was measured in all blood samples by using the Mythic 18 hematology analyzer (Orphée Medical, Geneva, Switzerland), and the obtained values were used as theoretical values (standard methodology). Prior to sample Ht measurements, the samples were let in room temperature for 1 h.

2.4. Ht Estimation via Image Analysis

DBS samples (n = 131) of known (measured) Ht were scanned at the laboratory, and the obtained DBS areas (cm2) were calculated through image processing and the use of the suitable algorithm developed in MATLAB® R2018b (The MathWorks, Inc., Natick, MA, USA). More specifically, scanning of prepared DBS samples was paired with an image processing technique to provide precise data on spot areas. All cards were scanned, and the scans were saved in tif format. With the aid of the MATLAB® program, an appropriate algorithm was developed to determine the area of DBSs. This computer code made it possible to convert the DBS attributes gathered as image data into areas that were expressed in cm2, which were then utilized to calculate DBSs quantitatively. There are two separate phases to the conversion described above. The algorithm translates the dried blood spots’ surface into pixels in the first step. The color scan of the dried blood spots is changed to black and white to facilitate the specified procedure. In this manner, the input data are converted into a binary collection of black and white pixels, where the former represent the spot’s surface and the latter the scan’s background. The algorithm uses the scanning of a template square that maintains a side of 1 cm and, thus, an area of 1 cm2 as input in addition to the dried blood spots. This ‘reference object’ is scanned with each card to ensure accurate area calculation regardless of scanner resolution. Overall, a specific number of pixels are rendered in the reference square and the DBS as a result of the previously indicated procedure. The last step involved calculating the spot area by dividing the number of pixels in the spot by the number of pixels in the reference square (Appendix A). An already developed equation was used to calculate the Ht values for each sample. This mathematical formula correlating Ht values and spot areas used in the current research in order to calculate the Ht of DBS samples of known area was derived in our laboratory’s previous work [32]. Finally, a linear-type equation was generated, correlating the dependent variable (y: spot area) with the Ht value (x) of the sample (Table 1).

2.5. Statistical Comparison

To assess the relationship between the two Ht-estimation methodologies, namely, to correlate the measured Ht values versus the calculated ones, several method-comparison statistical approaches (paired sample t-test, Bland and Altman analysis, Deming regression model, Passing and Bablock regression analysis, as well as the creation of a mountain plot) were applied. The entire statistical comparability through these approaches has been implemented in MedCalc Statistical Software, trial version 23.0.1 (MedCalc Software Ltd., Ostend, Belgium) [34].

3. Results

A total of 131 samples’ Ht were measured using the Mythic 18 hematology analyzer and, in parallel, used to prepare DBSs. Measured Ht values ranged from 29.6% to 50.4%, with an average of 39.7%. Following image analysis processing, the average area (cm2) for each sample was measured. The resulting areas were estimated as four spots per Ht level, and these values were ultimately used to calculate the average areas of blood spots and the corresponding percentage of relative standard deviation (%RSD) values for each sample with the same Ht. From experimental observations, the area of the blood spot formed is quite repeatable at the different Ht levels, with 113 out of 131 samples (86%) having an %RSD < 5.0. The average measured area values showed remarkably close similarity to the respective theoretical areas calculated as a next step by applying the correlation equation (Table 1) for each sample. The % difference between measured and theoretical area values was also calculated, this being within ±3% (low: −2.19, high: +2.84) for all 131 samples. Furthermore, Ht values were back-calculated by applying the mathematical formula for each sample considering its known (measured) area. Again, also for the Ht variable, the theoretically estimated values were very close to the known/measured ones, with an average of 39.9%. The % relative error calculation showed that 40 out of 131 samples exhibited a % relative error overpassing ±5%, and none of the samples exceeded ±10%.
For the method comparison, different well-acknowledged statistical methodologies were applied. As a first step, a paired samples t-test was used to compare the two Ht estimation methods, i.e., the mean values for measured (hematology analyzer) and calculated Ht. Results are presented in Table 2, showing statistical insignificance.
A Bland–Altman plot is depicted in Figure 2, revealing also very little bias between the two methods.
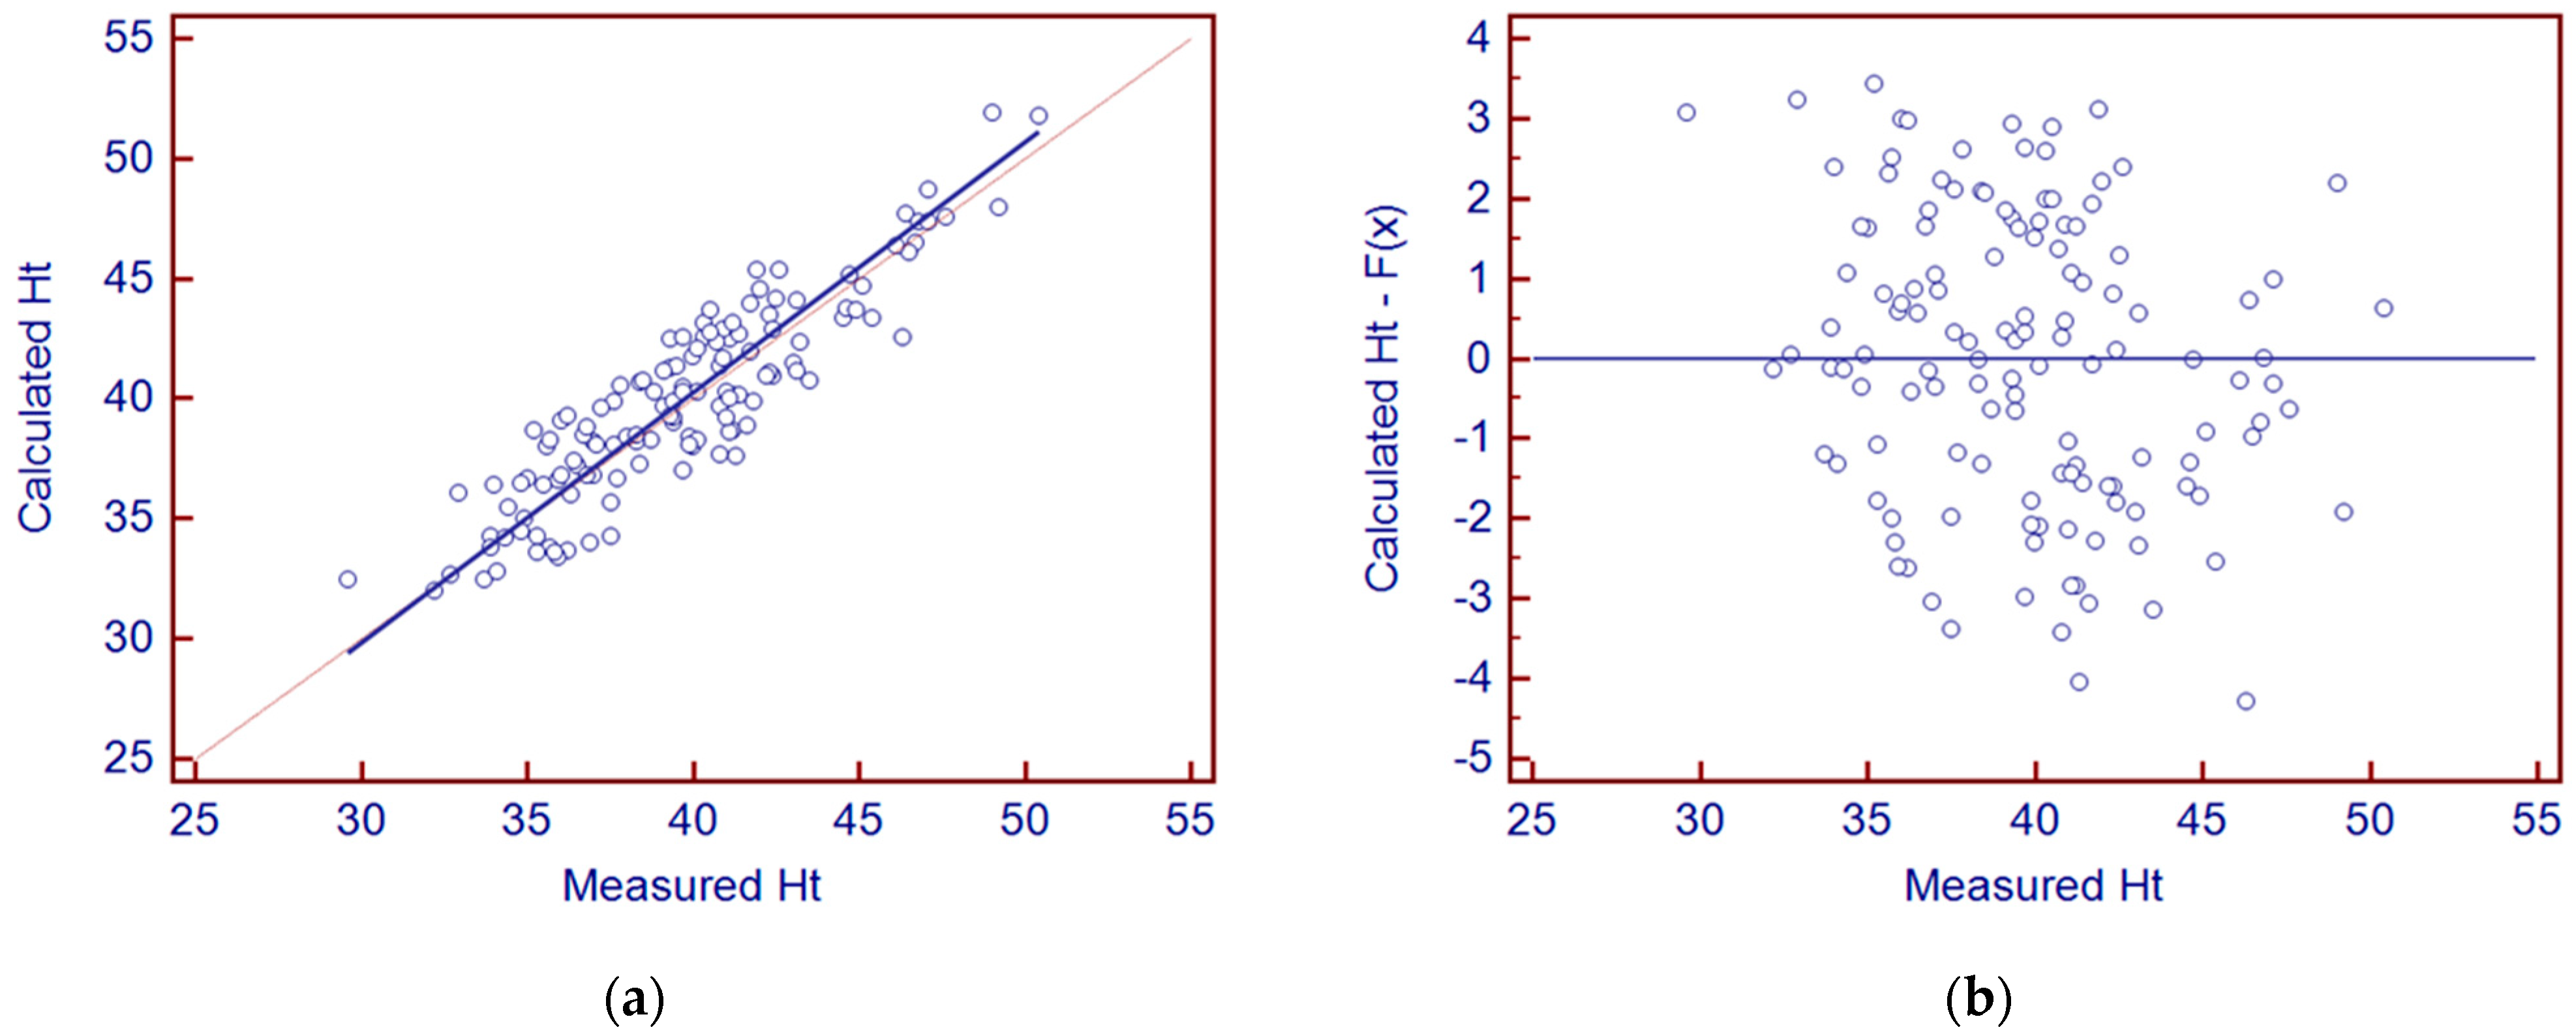
Further comparison was attempted through the application of a Deming regression model (Figure 3), presenting the close similarity of the two methodologies. Deming regression showed a slope of 1.0454 (95% confidence interval 0.9641 to 1.1267) and an intercept of −1.5301 (95% confidence interval −4.7913 to 1.7311).
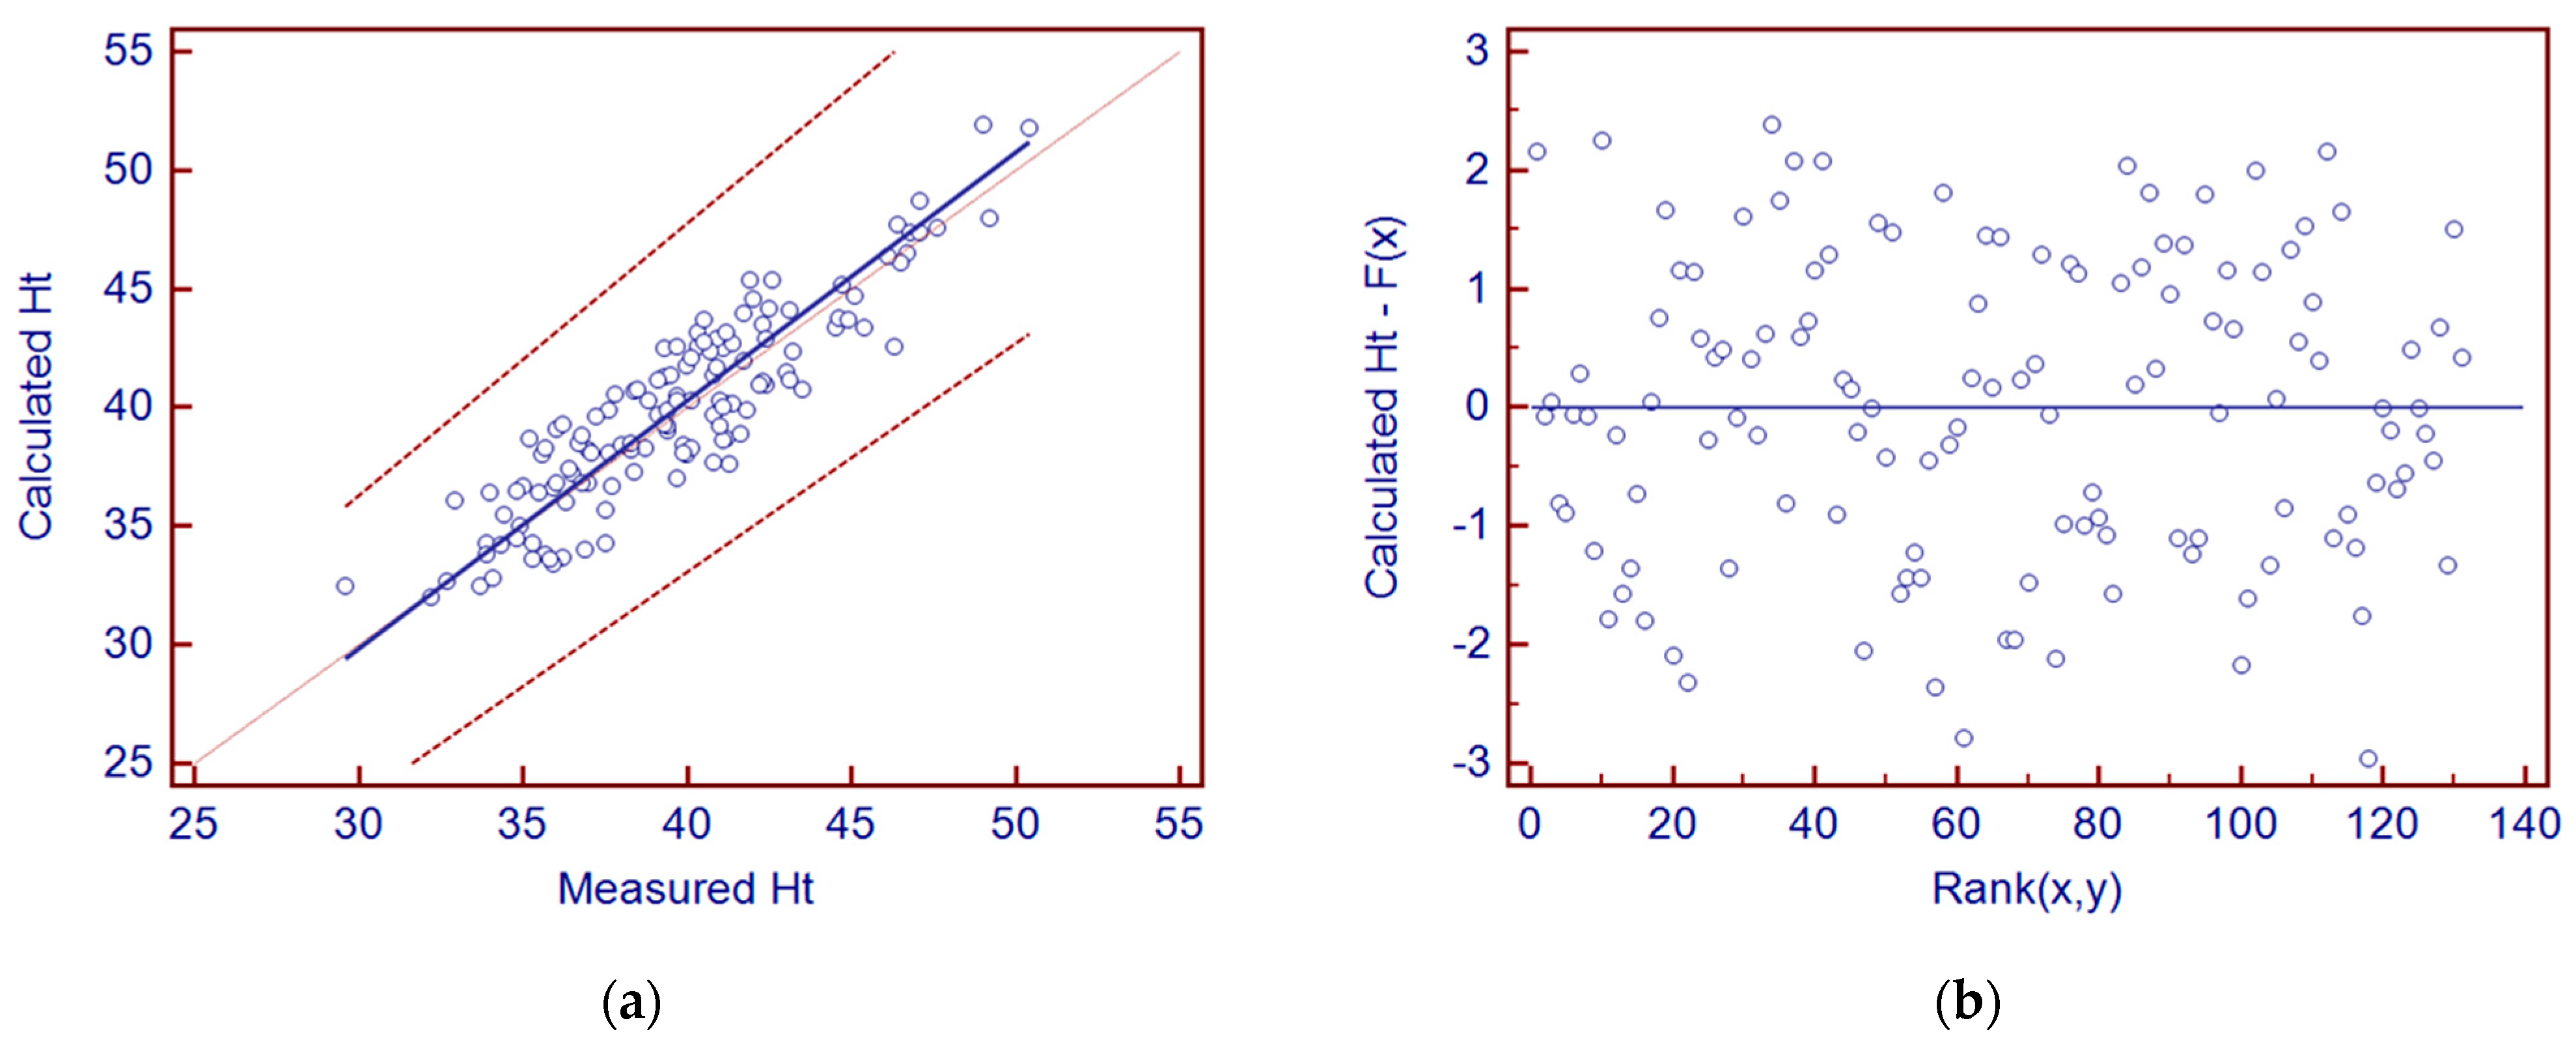
Additionally, Passing and Bablock regression analysis (Table 3 and Figure 4) showed again a good agreement between Ht (DBS-calculated) and Ht (measured) and that there is no systematic difference between the two methods. Furthermore, as shown in Table 3, the slope contains the value of 1 (95% CI), and therefore no proportional difference between the two methods was observed, while the 95% CI of the intercept contains the zero value.
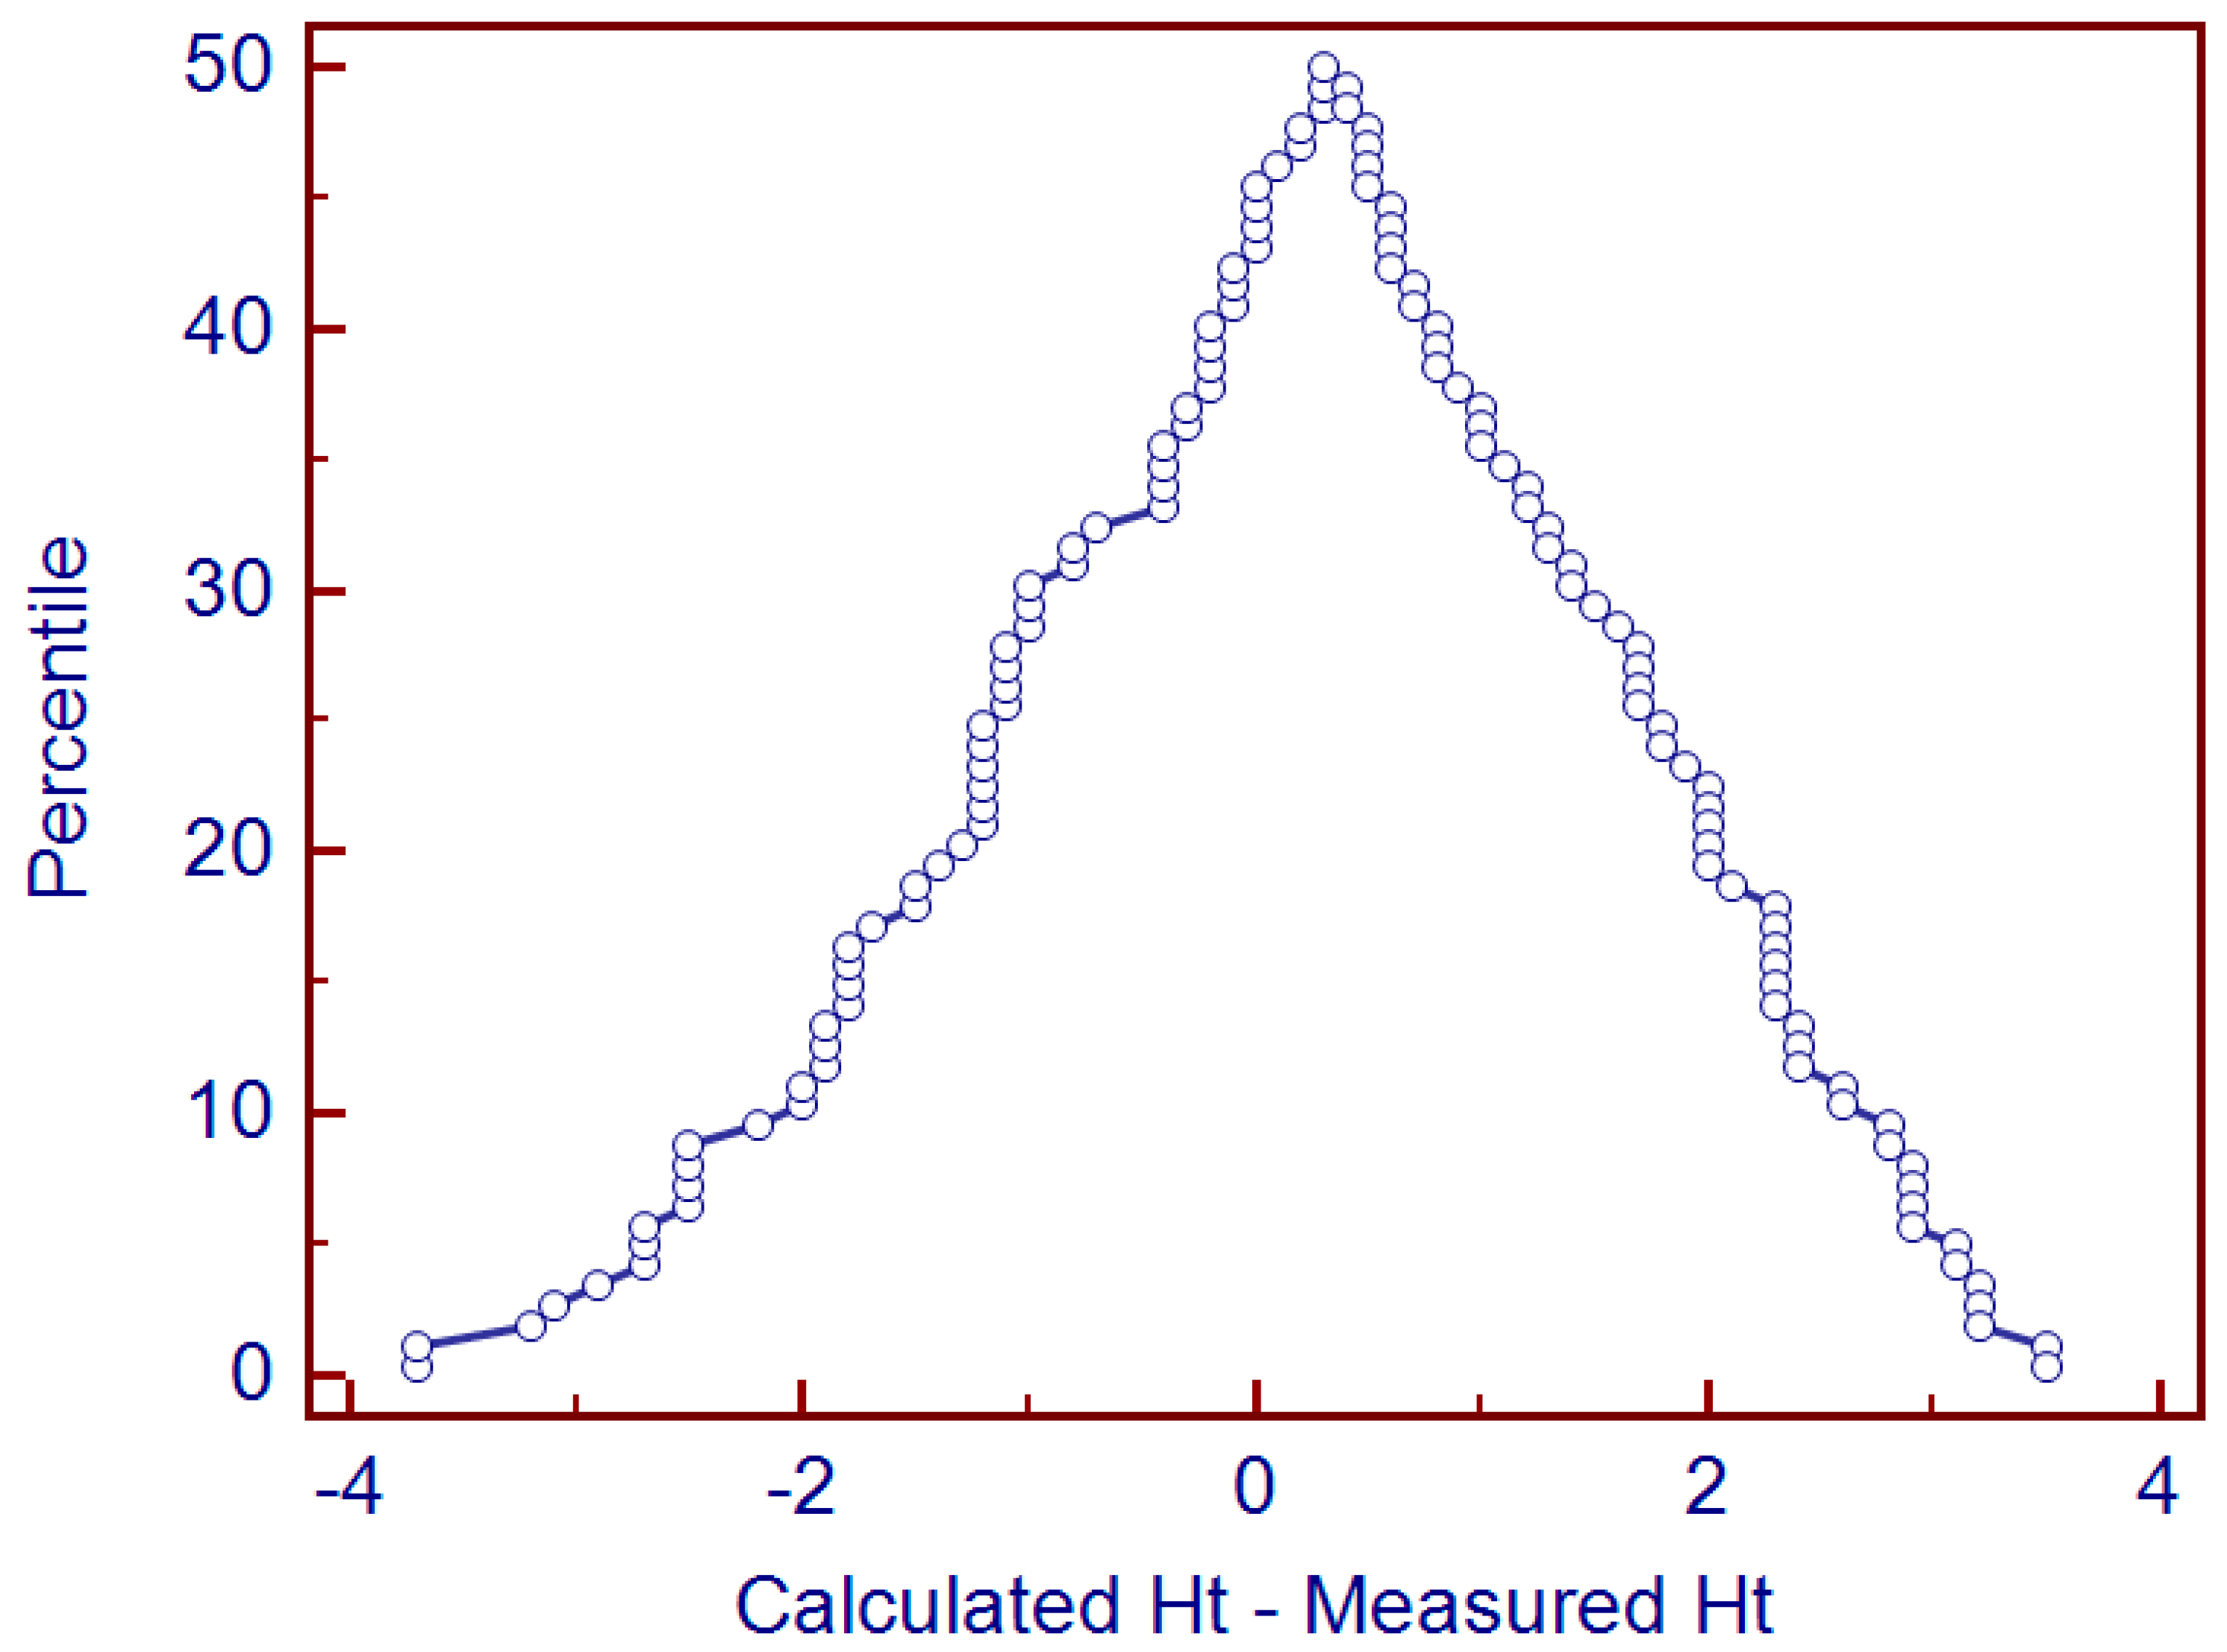
As a last comparability technique between calculated Ht and measured Ht, a mountain plot was generated by calculating a percentile for each ranked difference between the two methods. Figure 5 illustrates a uniform distribution of the differences (centered around zero), further demonstrating that the two methods for estimating Ht are unbiased in relation to one another.

4. Discussion

Using a particular paper card, a blood sample is applied as part of an alternate collection method called DBS sampling. The field of life sciences consists of the most common application of this methodology, specifically in the area of newborn screening but also in other areas requesting substance concentration measurements. A crucial factor affecting DBSs is the blood Ht value, which influences the blood distribution on the filter paper and, consequently, the reliability and robustness of the DBS results. During the spotting process, a blood drop comes into contact with filter paper and diffuses radially to form a spot while moving through the paper. Blood spreads on the filter paper to a certain extent depending on its viscosity. Thus, the percent volume ratio of red blood cells in the blood, in other words, the sample’s Ht value, determines the viscosity. As a result, different amounts of blood will be contained in fixed-size punches that are taken from DBSs with different Ht values. In addition to its analytical impact, Ht may also affect the analyte’s blood-to-plasma (B:P) concentration ratio, representing the blood–plasma partitioning of drugs. Such an impact on the B:P ratio has given rise to concerns about the comparability and correlation of analytical results obtained through DBS sampling with those obtained in plasma [14].
In a controlled analytical setting, it is therefore imperative to acknowledge and address the Ht effect, as it poses a significant obstacle to the effectiveness of any DBS method. This is the reason that various tactics have been developed to reduce Ht impact. Many approaches have been put forth in the scientific literature; however, the majority of current solutions are constrained by their high cost, need for additional blood analyses and complexity of the techniques and equipment used. Yet, a well-researched approach, namely the application of correction factors, appears to be receiving more attention due to its obvious benefits, including its low equipment requirements and laboratory budget needs. Under this strategy, an appropriate linear-type equation can be used to predict the sample’s Ht value using the area of the formed blood spot, which can be easily estimated through image analysis. This strategy is based on the actual mathematical correlation of the Ht value with a dispersion parameter, such as the DBS area. It is possible then to obtain a correction factor, which is produced by their ratio, by applying the same mathematical formula to both calibration as well as unknown samples.
After scanning the DBS card with the appropriate blood volume applied, an image processing method can be employed to facilitate a simple and accurate estimation of DBS areas. The corresponding methodology, which is based on the application of an appropriately written Matlab® algorithm on previously scanned cards [32,35], was tested on 131 DBS samples as part of the present research. The results have undoubtedly shown that the predicted Ht values following the imaging process and mathematical calculation are strongly correlated with the actual measured Ht values obtained using a Ht analyzer.
This work extensively employed method comparison in order to investigate this correlation. In fact, evaluating the similarity between two quantitative measurement methods in a bioanalytical laboratory is fairly common. Comparing experimental techniques is a crucial and important step in the validation process of analytical methods. Comparability approaches in bioanalysis have been the subject of several research groups, and pertinent statistical techniques have been put forth and discussed in the scientific literature. A very well-acknowledged analysis was first put forth by Altman and Bland [36], based on quantifying the agreement between two quantitative measurements by examining the mean difference and creating limits of agreement. The Deming regression model is another approach that can be used to compare methods with success [37] and has been applied in our current research. A further statistical technique that provides useful estimation of the agreement between analytical methods and potential systematic bias between them is the Passing and Bablock regression analysis [38,39], being a robust, non-parametric analysis and insensitive to the distribution of errors and data outliers. Additionally, the two Ht estimation methods were also compared by a “mountain plot” [40]. All these statistical approaches have demonstrated a high degree of method similarity when used on our current dataset.
The achievement of DBS formation consistency regardless of Ht value and the assurance of accurate and precise blood spotting onto the filter paper are particularly important for the correct understanding of the Ht effect and the effective resolution of related concerns in DBS analysis. Regulatory-based acceptance criteria may be compromised, and assay bias may result from the use of DBSs as a sample collection tool in certain situations. A bioanalytical method’s inherent bias may be caused by a number of variables, including pipetting technique, filter paper type, sample volume and temperature, as well as laboratory personnel. Specifically, if a suitable protocol is suggested, these factors, which frequently impact DBS formation, can be regarded as part of the overall assay bias that is controllable. Because of this, earlier research has already established a particular preparation protocol [41], which is also applied in our current work as well.
We acknowledge that the current work has certain limitations. These limitations are primarily related to the particular conditions that must be met to guarantee blood spotting consistency and, by extension, DBS areas. These conditions may impose limitations on the sample preparation process in different laboratories (i.e., various filter papers). As per our previous findings [41], the preparation procedure that yields consistent DBS formation for blood samples in a broad Ht range (20% to 60%) suggests that the sample has to be at room or body temperature, the precise and accurate delivery of a sample volume is optimally ensured by the employment of the reverse pipetting technique, and the handling of samples has to be undertaken by a qualified, experienced analyst with the use of a calibrated pipette (ideally, a fixed volume one). Indeed, temperature has a profound, direct effect on the viscosity of blood. According to [42] in an in vitro model, temperature changes have a significant impact on fluid distribution secondary to changes in blood viscosity. This seems scientifically sound, as when blood becomes cold, it becomes “thicker” and presents a slower flow rate. Viscosity and temperature are, therefore, inversely correlated, and applying blood samples at refrigerator temperature has been demonstrated to raise the %RSD value at all Ht levels [41]. Furthermore, when handling blood samples during the spot formation procedure, the reverse pipetting technique has proven to be the most appropriate. Given that analysts’ levels of experience vary when it comes to pipetting of viscous samples, it stands to reason that the reverse pipetting technique can reduce %RSD value differences. In fact, the properties of blood samples make specialized training necessary for analysts handling these biological samples [41]. Overall, it is clear that the suggested methodology for sample preparation can be considered suitable in a DBS analysis.

5. Conclusions

Comprehending the impact of hematocrit could dictate the future of DBS techniques employed in controlled bioanalytical settings. DBS techniques will find it difficult to be accepted as valid surrogates for conventional liquid biomatrices methods if the Ht impact is not taken into consideration for partial DBS analysis. Numerous strategies have been put forth to mitigate the Ht effect on DBS analysis. Based on a reliable mathematical correlation between Ht and DBS area as determined by image analysis, a novel method for Ht determination in DBS samples on filter paper was proposed. This method was applied to test 131 DBS samples, and, when the computed Ht values were compared with respective measurements from a conventional Ht analyzer, the results were found to be reliable and fully correlated. Overall, image analysis for the purpose of determining DBS area is extremely straightforward and inexpensive. As blood sample temperature, pipetting technique and analyst experience level can all have a significant impact on the %RSD value of DBS areas, it is also acknowledged that the current methodology is meaningful when a meticulous sample preparation protocol is followed. DBS techniques are currently gaining interest as an alternative bioanalytical approach in many scientific areas, such as clinical and pharmacokinetic trials or therapeutic drug monitoring. Therefore, the proposed Ht prediction methodology can be a valuable tool for the application of DBS analysis in real-life settings. For this reason, future work may include research targeting the improvement of the methodology, such as the study of additional parameters potentially influencing the outcome (e.g., additional experiments using blood samples under different conditions or demographic groups, comparison of Ht from capillary or venous blood samples, investigation of potential impact of drug substance-related factors or comparison of the current methodology to other Ht-prediction techniques).

Author Contributions

Conceptualization, A.M. and Y.D.; methodology, C.D., N.K. and M.R.; software, C.D. and Y.D.; investigation, C.D., N.K. and A.M.; writing—original draft preparation, C.D., N.K. and M.R.; writing—review and editing, A.M. and Y.D.; supervision, A.M. and Y.D.; All authors have read and agreed to the published version of the manuscript.

Funding

This research received no external funding.

Institutional Review Board Statement

Not applicable.

Informed Consent Statement

Not applicable.

Data Availability Statement

Data presented in this study are available on request from the corresponding author.

Conflicts of Interest

The authors declare no conflicts of interest.

Appendix A

Matlab algorithm:
N1 = imread(‘D:\Location_1’);
N1 = imadjust(N1,[],[],3);
N1 = im2bw(N1);
scale = imcrop(N1);
scale = imclose(scale, strel(‘square’,1));
scale = imopen(scale, strel(‘square’,5));
imwrite(scale,[‘D:\Location_2’]);
N1 = imopen(N1,strel(‘disk’,1));
N1 = imclose(N1,strel(‘disk’,8));
imwrite(N1,[‘D:\Location_3’]);
A = imcrop(N1);
imwrite(A,[‘D:\ Location_4’]);
Aarea = bwarea(imcomplement(A))
scalearea = bwarea(imcomplement(scale))
realareaA = Aarea/scalearea

References

  1. Guthrie, R.; Susi, A. A simple phenylalanine method for detecting phenylketonuria in large populations of newborn infants. Pediatrics 1963, 32, 338–343. [Google Scholar] [CrossRef] [PubMed]
  2. Chace, D.H. Mass spectrometry in newborn and metabolic screening: Historical perspective and future directions. J. Mass. Spectrom. 2009, 44, 163–170. [Google Scholar] [CrossRef] [PubMed]
  3. Wilhelm, A.J.; den Burger, J.C.G.; Swart, E.L. Therapeutic Drug Monitoring by Dried Blood Spot: Progress to date and future directions. Clin. Pharmacokinet. 2014, 53, 961–973. [Google Scholar] [CrossRef]
  4. Stove, C.P.; Ingels, A.S.; De Kesel, P.M.; Lambert, W.E. Dried blood spots in toxicology: From the cradle to the grave? Crit. Rev. Toxicol. 2012, 42, 230–243. [Google Scholar] [CrossRef]
  5. Spooner, N.; Lad, R.; Barfield, M. Dried blood spots as a sample collection technique for the determination of pharmacokinetics in clinical studies: Considerations for the validation of a quantitative bioanalytical method. Anal. Chem. 2009, 81, 1557–1563. [Google Scholar] [CrossRef]
  6. Patel, P.; Tanna, S.; Mulla, H.; Kairamkonda, V.; Pandya, H.; Lawson, G. Dexamethasone quantification in dried blood spot samples using LC-MS: The potential for application to neonatal pharmacokinetic studies. J. Chromatogr. B Anal. Technol. Biomed. Life Sci. 2010, 878, 3277–3282. [Google Scholar] [CrossRef]
  7. Sharma, A.; Jaiswal, S.; Shukla, M.; Lal, J. Dried blood spots: Concepts, present status, and future perspectives in bioanalysis. Drug Test Anal. 2014, 6, 399–414. [Google Scholar] [CrossRef]
  8. Denniff, P.; Spooner, N. The effect of hematocrit on assay bias when using DBS samples for the quantitative bioanalysis of drugs. Bioanalysis 2010, 2, 1385–1395. [Google Scholar] [CrossRef]
  9. O’Mara, M.; Hudson-Curtis, B.; Olson, K.; Yueh, Y.; Dunn, J.; Spooner, N. The effect of hematocrit and punch location on assay bias during quantitative bioanalysis of dried blood spot samples. Bioanalysis 2011, 3, 2335–2347. [Google Scholar] [CrossRef]
  10. De Kesel, P.M.; Sadones, N.; Capiau, S.; Lambert, W.E.; Stove, C.P. Hemato-critical issues in quantitative analysis of dried blood spots: Challenges and solutions. Bioanalysis 2013, 5, 2023–2041. [Google Scholar] [CrossRef]
  11. Beutler, E.; Waalen, J. The definition of anemia: What is the lower limit of normal of the blood hemoglobin concentration? Blood 2006, 107, 1747–1750. [Google Scholar] [CrossRef] [PubMed]
  12. Jager, N.G.L.; Rosing, H.; Schellens, J.H.; Beijnen, J.H. Procedures and practices for the validation of bioanalytical methods using dried blood spots: A review. Bioanalysis 2014, 6, 2481–2514. [Google Scholar] [CrossRef] [PubMed]
  13. ICH Guideline M10 on Bioanalytical Method Validation and Study Sample Analysis-Step 5 (EMA/CHMP/ICH/172948/2019). 2022. Available online: https://www.ema.europa.eu/en/ich-m10-bioanalytical-method-validation-scientific-guideline (accessed on 9 September 2024).
  14. Daousani, C.; Karalis, V.; Malenović, A.; Dotsikas, Y. Hematocrit effect on dried blood spots in adults: A computational study and theoretical considerations. Scand. J. Clin. Lab. Investig. 2019, 79, 325–333. [Google Scholar] [CrossRef]
  15. Capiau, S.; Veenhof, H.; Koster, R.A.; Bergqvist, Y.; Boettcher, M.; Halmingh, O.; Keevil, B.G.; Koch, B.D.P.; Linden, R.; Pistos, C.; et al. Official International Association for Therapeutic Drug Monitoring and Clinical Toxicology Guideline: Development and validation of Dried Blood Spot-based methods for Therapeutic Drug Monitoring. Ther. Drug Monit. 2019, 41, 409–430. [Google Scholar] [CrossRef]
  16. De Kesel, P.M.; Capiau, S.; Lambert, W.E.; Stove, C.P. Current strategies for coping with the hematocrit problem in dried blood spot analysis. Bioanalysis 2014, 6, 1871–1874. [Google Scholar] [CrossRef]
  17. Velghe, S.; Delahaye, L.; Stove, C.P. Is the hematocrit still an issue in quantitative dried blood spot analysis? J. Pharm. Biomed. Anal. 2019, 163, 188–196. [Google Scholar] [CrossRef]
  18. De Kesel, P.M.; Lambert, W.E.; Stove, C.P. Does volumetric absorptive microsampling eliminate the hematocrit bias for caffeine and paraxanthine in dried blood samples? A comparative study. Anal. Chim. Acta 2015, 881, 65–73. [Google Scholar] [CrossRef]
  19. Li, F.; Zulkoski, J.; Fast, D.; Michael, S. Perforated dried blood spots: A novel format for accurate microsampling. Bioanalysis 2011, 3, 2321–2333. [Google Scholar] [CrossRef]
  20. Leuthold, L.A.; Heudi, O.; Déglon, J.; Raccuglia, M.; Augsburger, M.; Picard, F.; Kretz, O.; Thomas, A. New microfluidic-based sampling procedure for overcoming the hematocrit problem associated with dried blood spot analysis. Anal. Chem. 2015, 87, 2068–2071. [Google Scholar] [CrossRef]
  21. Verplaetse, R.; Henion, J. Hematocrit-independent quantitation of stimulants in Dried Blood Spots: Pipet versus microfluidic-based volumetric sampling coupled with automated Flow-Through Desorption and Online Solid Phase Extraction-LC-MS/MS Bioanalysis. Anal. Chem. 2016, 88, 6789–6796. [Google Scholar] [CrossRef]
  22. Abu-Rabie, P.; Denniff, P.; Spooner, N.; Chowdhry, B.Z.; Pullen, F.S. Investigation of different approaches to incorporating internal standard in DBS quantitative bioanalytical workflows and their effect on nullifying hematocrit-based assay bias. Anal. Chem. 2015, 87, 4996–5003. [Google Scholar] [CrossRef] [PubMed]
  23. Cao, H.; Jiang, Y.; Wang, S.; Cao, H.; Li, Y.; Huang, J. Dried Plasma Spot Based LC-MS/MS Method for Monitoring of Meropenem in the Blood of Treated Patients. Molecules 2022, 27, 1991. [Google Scholar] [CrossRef] [PubMed]
  24. Lombardi, V.; Carassiti, D.; Giovannoni, G.; Lu, C.-H.; Adiutori, R.; Malaspina, A. The potential of neurofilaments analysis using dry-blood and plasma spots. Sci. Rep. 2020, 10, 97. [Google Scholar] [CrossRef]
  25. Nakahara, T.; Otani, N.; Ueno, T.; Hashimoto, K. Development of a hematocrit-insensitive device to collect accurate volumes of dried blood spots without specialized skills for measuring clozapine and its metabolites as model analytes. J. Chromatogr. B 2018, 1087–1088, 70–79. [Google Scholar] [CrossRef]
  26. Capiau, S.; Stove, V.V.; Lambert, W.E.; Stove, C.P. Prediction of the hematocrit of dried blood spots via potassium measurement on a routine clinical chemistry analyser. Anal. Chem. 2013, 85, 404–410. [Google Scholar] [CrossRef]
  27. De Kesel, P.M.; Capiau, S.; Stove, V.V.; Lambert, W.E.; Stove, C.P. Potassium-based algorithm allows correction for the hematocrit bias in quantitative analysis of caffeine and its major metabolite in dried blood spots. Anal. Bioanal. Chem. 2014, 406, 749–755. [Google Scholar] [CrossRef]
  28. Liao, H.-W.; Lin, S.-W.; Lin, Y.-T.; Lee, C.-H.; Kuo, C.-H. Identification of potential sphingomyelin markers for the estimation of hematocrit in dried blood spots via a lipidomic strategy. Anal. Chim. Acta 2018, 1003, 34–41. [Google Scholar] [CrossRef]
  29. Richardson, G.; Marshall, D.; Keevil, B.G. Prediction of haematocrit in dried blood spots from the measurement of haemoglobin using commercially available sodium lauryl sulphate. Ann. Clin. Biochem. 2018, 55, 363–367. [Google Scholar] [CrossRef]
  30. Delahaye, L.; Heughebaert, L.; Lühr, C.; Lambrecht, S.; Stove, C.P. Near-infrared-based hematocrit prediction of dried blood spots: An in-depth evaluation. Clin. Chim. Acta 2021, 523, 239–246. [Google Scholar] [CrossRef]
  31. Capiau, S.; Wilk, L.S.; De Kesel, P.M.; Aalders, M.C.G.; Stove, C.P. Correction for the Hematocrit bias in Dried Blood Spot analysis using a nondestructive, single-wavelength reflectance-based Hematocrit prediction method. Anal. Chem. 2018, 90, 1795–1804. [Google Scholar] [CrossRef]
  32. Foivas, A.; Malenović, A.; Kostić, N.; Božić, M.; Knežević, M.; Loukas, Y.L.; Dotsikas, Y. Quantitation of brinzolamide in dried blood spots by a novel LC-QTOF-MS/MS method. J. Pharm. Biomed. Anal. 2016, 119, 84–90. [Google Scholar] [CrossRef] [PubMed]
  33. Daousani, C.; Karalis, V.; Loukas, Y.L.; Schulpis, K.H.; Alexiou, K.; Dotsikas, Y. Dried Blood Spots in Neonatal Studies: A Computational Analysis for the Role of the Hematocrit Effect. Pharmaceuticals 2023, 16, 1126. [Google Scholar] [CrossRef] [PubMed]
  34. MedCalc Statistical Software, Version 23.0.1; MedCalc Software bv: Ostend, Belgium, 2023. Available online: https://www.medcalc.org (accessed on 15 May 2024).
  35. Kostić, N.; Dotsikas, Y.; Jović, N.; Stevanović, G.; Malenović, A.; Medenica, M. Quantitation of pregabalin in dried blood spots and dried plasma spots by validated LC-MS/MS methods. J. Pharm. Biomed. Anal. 2015, 10, 79–84. [Google Scholar] [CrossRef]
  36. Bland, J.M.; Altman, D.G. Statistical methods for assessing agreement between two methods of clinical measurement. Lancet 1986, 1, 307–310. [Google Scholar] [CrossRef]
  37. Cornbleet, P.J.; Gochman, N. Incorrect least-squares regression coefficients in method-comparison analysis. Clin. Chem. 1979, 25, 432–438. [Google Scholar] [CrossRef]
  38. Passing, H.; Bablok, W. A new biometrical procedure for testing the equality of measurements from two different analytical methods. Application of linear regression procedures for method comparison studies in clinical chemistry, Part I. J. Clin. Chem. Clin. Biochem. 1983, 21, 709–720. [Google Scholar] [CrossRef]
  39. Passing, H.; Bablok, W. Comparison of several regression procedures for method comparison studies and determination of sample sizes. Application of linear regression procedures for method comparison studies in Clinical Chemistry, Part II. J. Clin. Chem. Clin. Biochem. 1984, 22, 431–445. [Google Scholar] [CrossRef]
  40. Krouwer, J.S.; Monti, K.L. A simple, graphical method to evaluate laboratory assays. Eur. J. Clin. Chem. Clin. Biochem. 1995, 33, 525–527. [Google Scholar]
  41. Rmandić, M.; Dotsikas, Y.; Malenović, A. Identification of the factors affecting the consistency of DBS formation via experimental design and image processing methodology. Microchem. J. 2019, 145, 1003–1010. [Google Scholar] [CrossRef]
  42. Stammers, A.H.; Vang, S.N.; Mejak, B.L.; Rauch, E.D. Quantification of the effect of altering hematocrit and temperature on blood viscosity. J. Extra Corpor. Technol. 2003, 35, 143–151. [Google Scholar] [CrossRef]
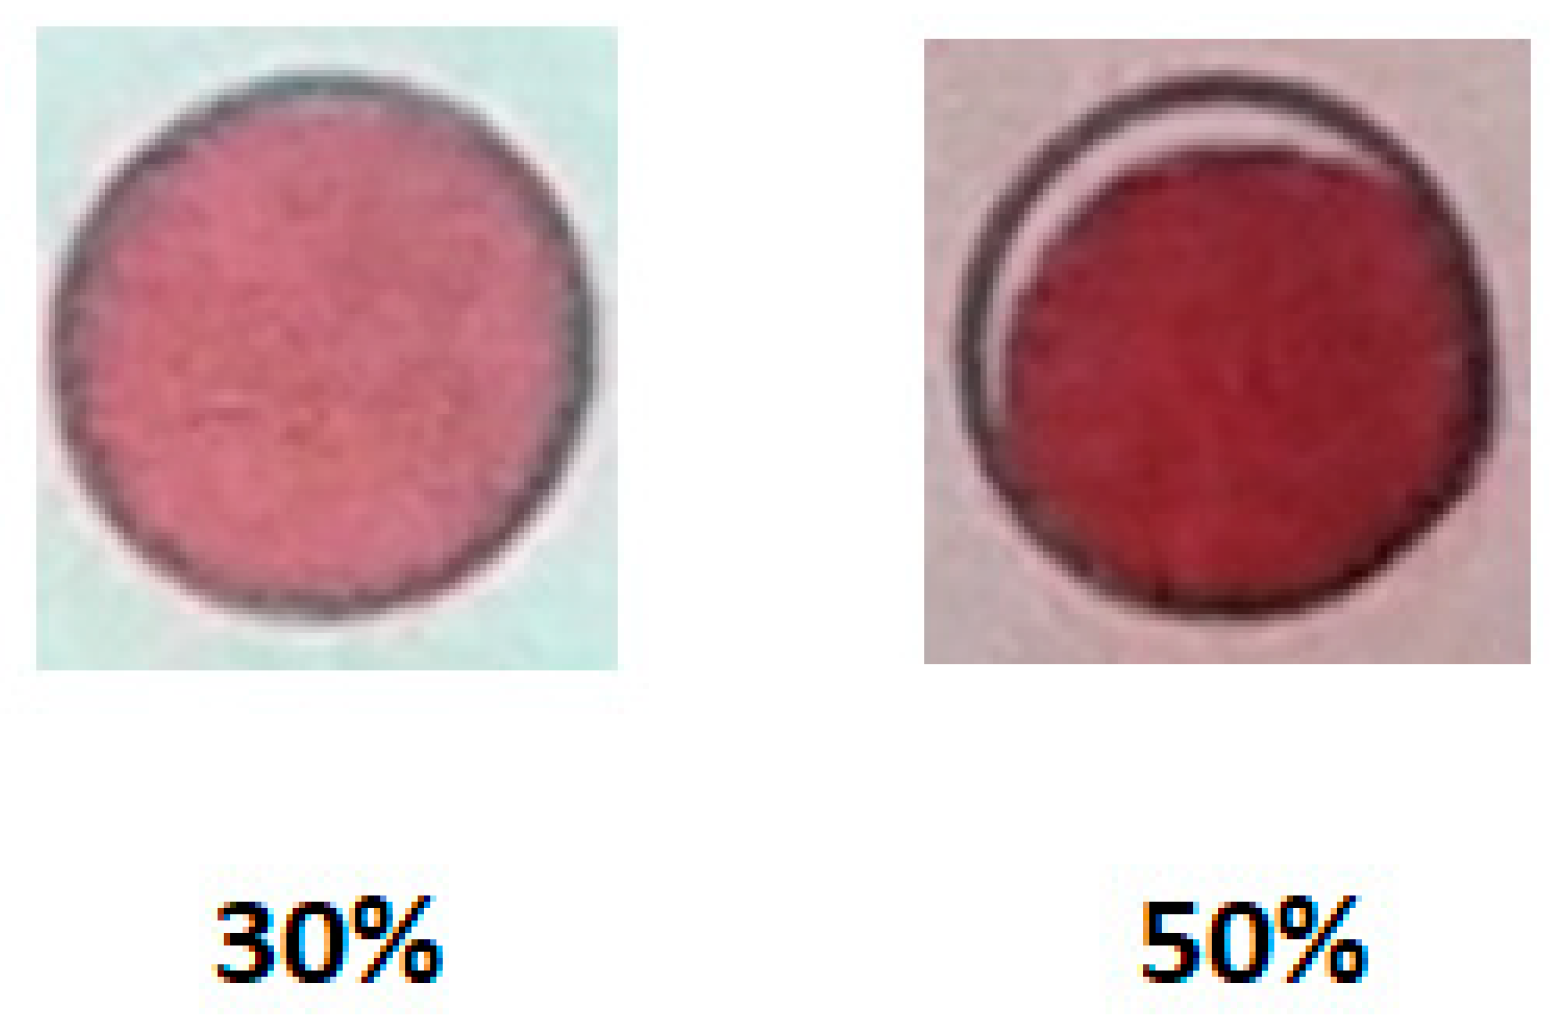
Figure 1. Dried blood spots obtained from blood with different Ht values (30% and 50%).
Applsci 14 09860 g001
Figure 2. Bland–Altman plot comparing the calculated and measured Ht values in 131 DBS samples. The solid blue line represents the mean Ht difference (0.3) between the two methodologies and DBSs; the red lines represent 95% limits of agreement set to 1.96 x standard deviation (SD) (lower = −3.2, upper = 3.8). The green dotted line represents the 95% CI of the mean difference, and the blue dotted lines represent the 95% CI of the limits of agreement.
Applsci 14 09860 g002
Figure 3. (a) Deming regression plot and (b) residual plot comparing calculated and measured Ht values in 131 DBS samples.
Applsci 14 09860 g003
Figure 4. (a) Passing and Bablock plot and (b) residual plot comparing calculated and measured Ht values in 131 DBS samples.
Applsci 14 09860 g004
Figure 5. Mountain plot comparing calculated and measured Ht values in 131 DBS samples. The median of the differences is close to zero when the two methods are compared.
Applsci 14 09860 g005
Table 1. Mathematical formula that establishes a relationship between a measurement (y) of blood dispersion on the paper (DBS area) and the percentage of Ht levels (x). The specific paper and blood volume used are indicated [32].
FormulaDetails
y = −0.0070x + 1.32
(R2 = 0.984)
y: area (cm2),
Paper: Whatman 903™,
Blood volume: 50 μL
Table 2. Paired samples t-test.
Sample 1 (Calculated Ht)Sample 2 (Measured Ht)
Sample size131131
Arithmetic mean39.944339.6733
95% Confidence interval (CI) for the mean39.2385 to 40.650138.9956 to 40.3510
Variance16.673915.3718
Standard deviation (SD)4.08343.9207
Standard error of the mean0.35680.3426
Mean difference−0.2710
SD of mean difference1.7936
Standard error of mean difference0.1567
95% CI−0.5810 to 0.03903
Test statistic t−1.729
Degrees of freedom (DFs)130
Two-tailed probabilityp = 0.0861
Table 3. Passing and Bablock regression equation (y = −1.653226 + 1.048387x).
Systematic differences
Intercept A−1.6532
95% CI−5.5200 to 1.7893
Proportional differences
Slope B1.0484
95% CI0.9643 to 1.1500
Random differences
Residual standard deviation (RSD)1.2674
±1.96 RSD Interval−2.4840 to 2.4840
Linear model validity
Cusum test for linearityNo significant deviation from linearity (p = 0.55)
Disclaimer/Publisher’s Note: The statements, opinions and data contained in all publications are solely those of the individual author(s) and contributor(s) and not of MDPI and/or the editor(s). MDPI and/or the editor(s) disclaim responsibility for any injury to people or property resulting from any ideas, methods, instructions or products referred to in the content.