
Mediterranean Aquaponics: Fasting and Refeeding in a Polyculture Aquaponic System

 , ,
, ,  , and
, and 
Abstract
1. Introduction
2. Materials and Methods
2.1. Experimental Design—Animal and Plant Procurement
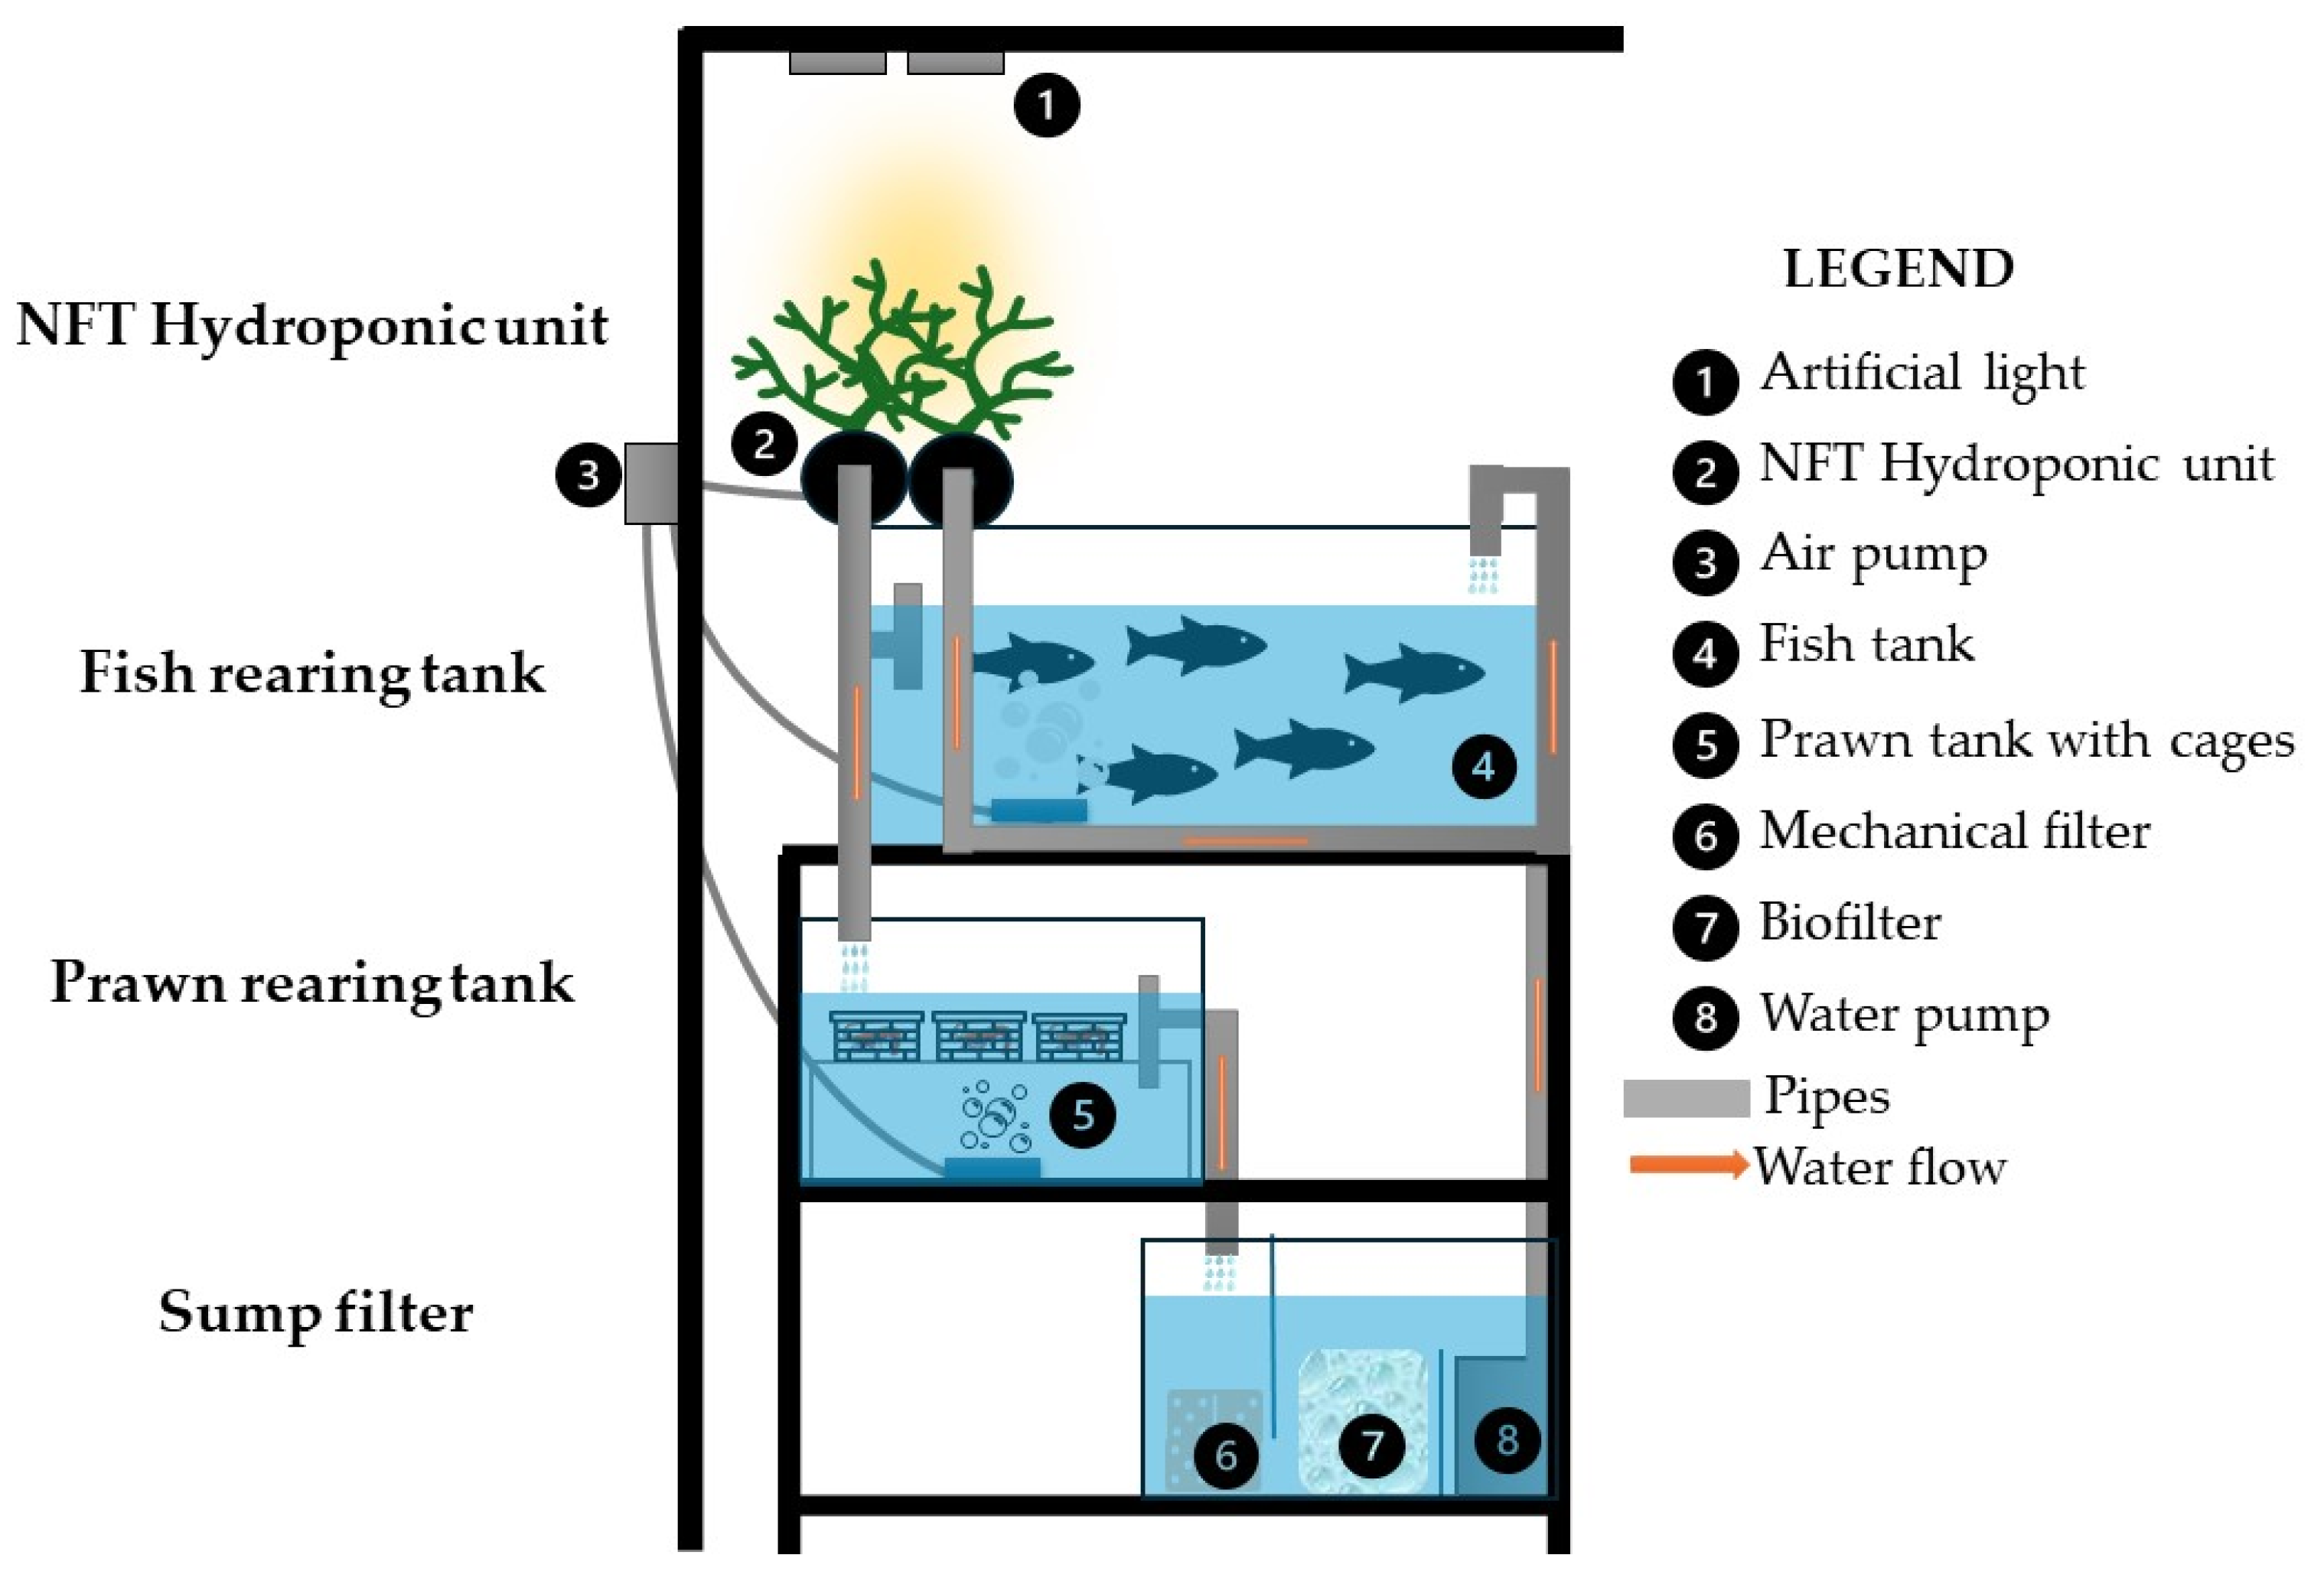
2.2. Rearing System and Conditions
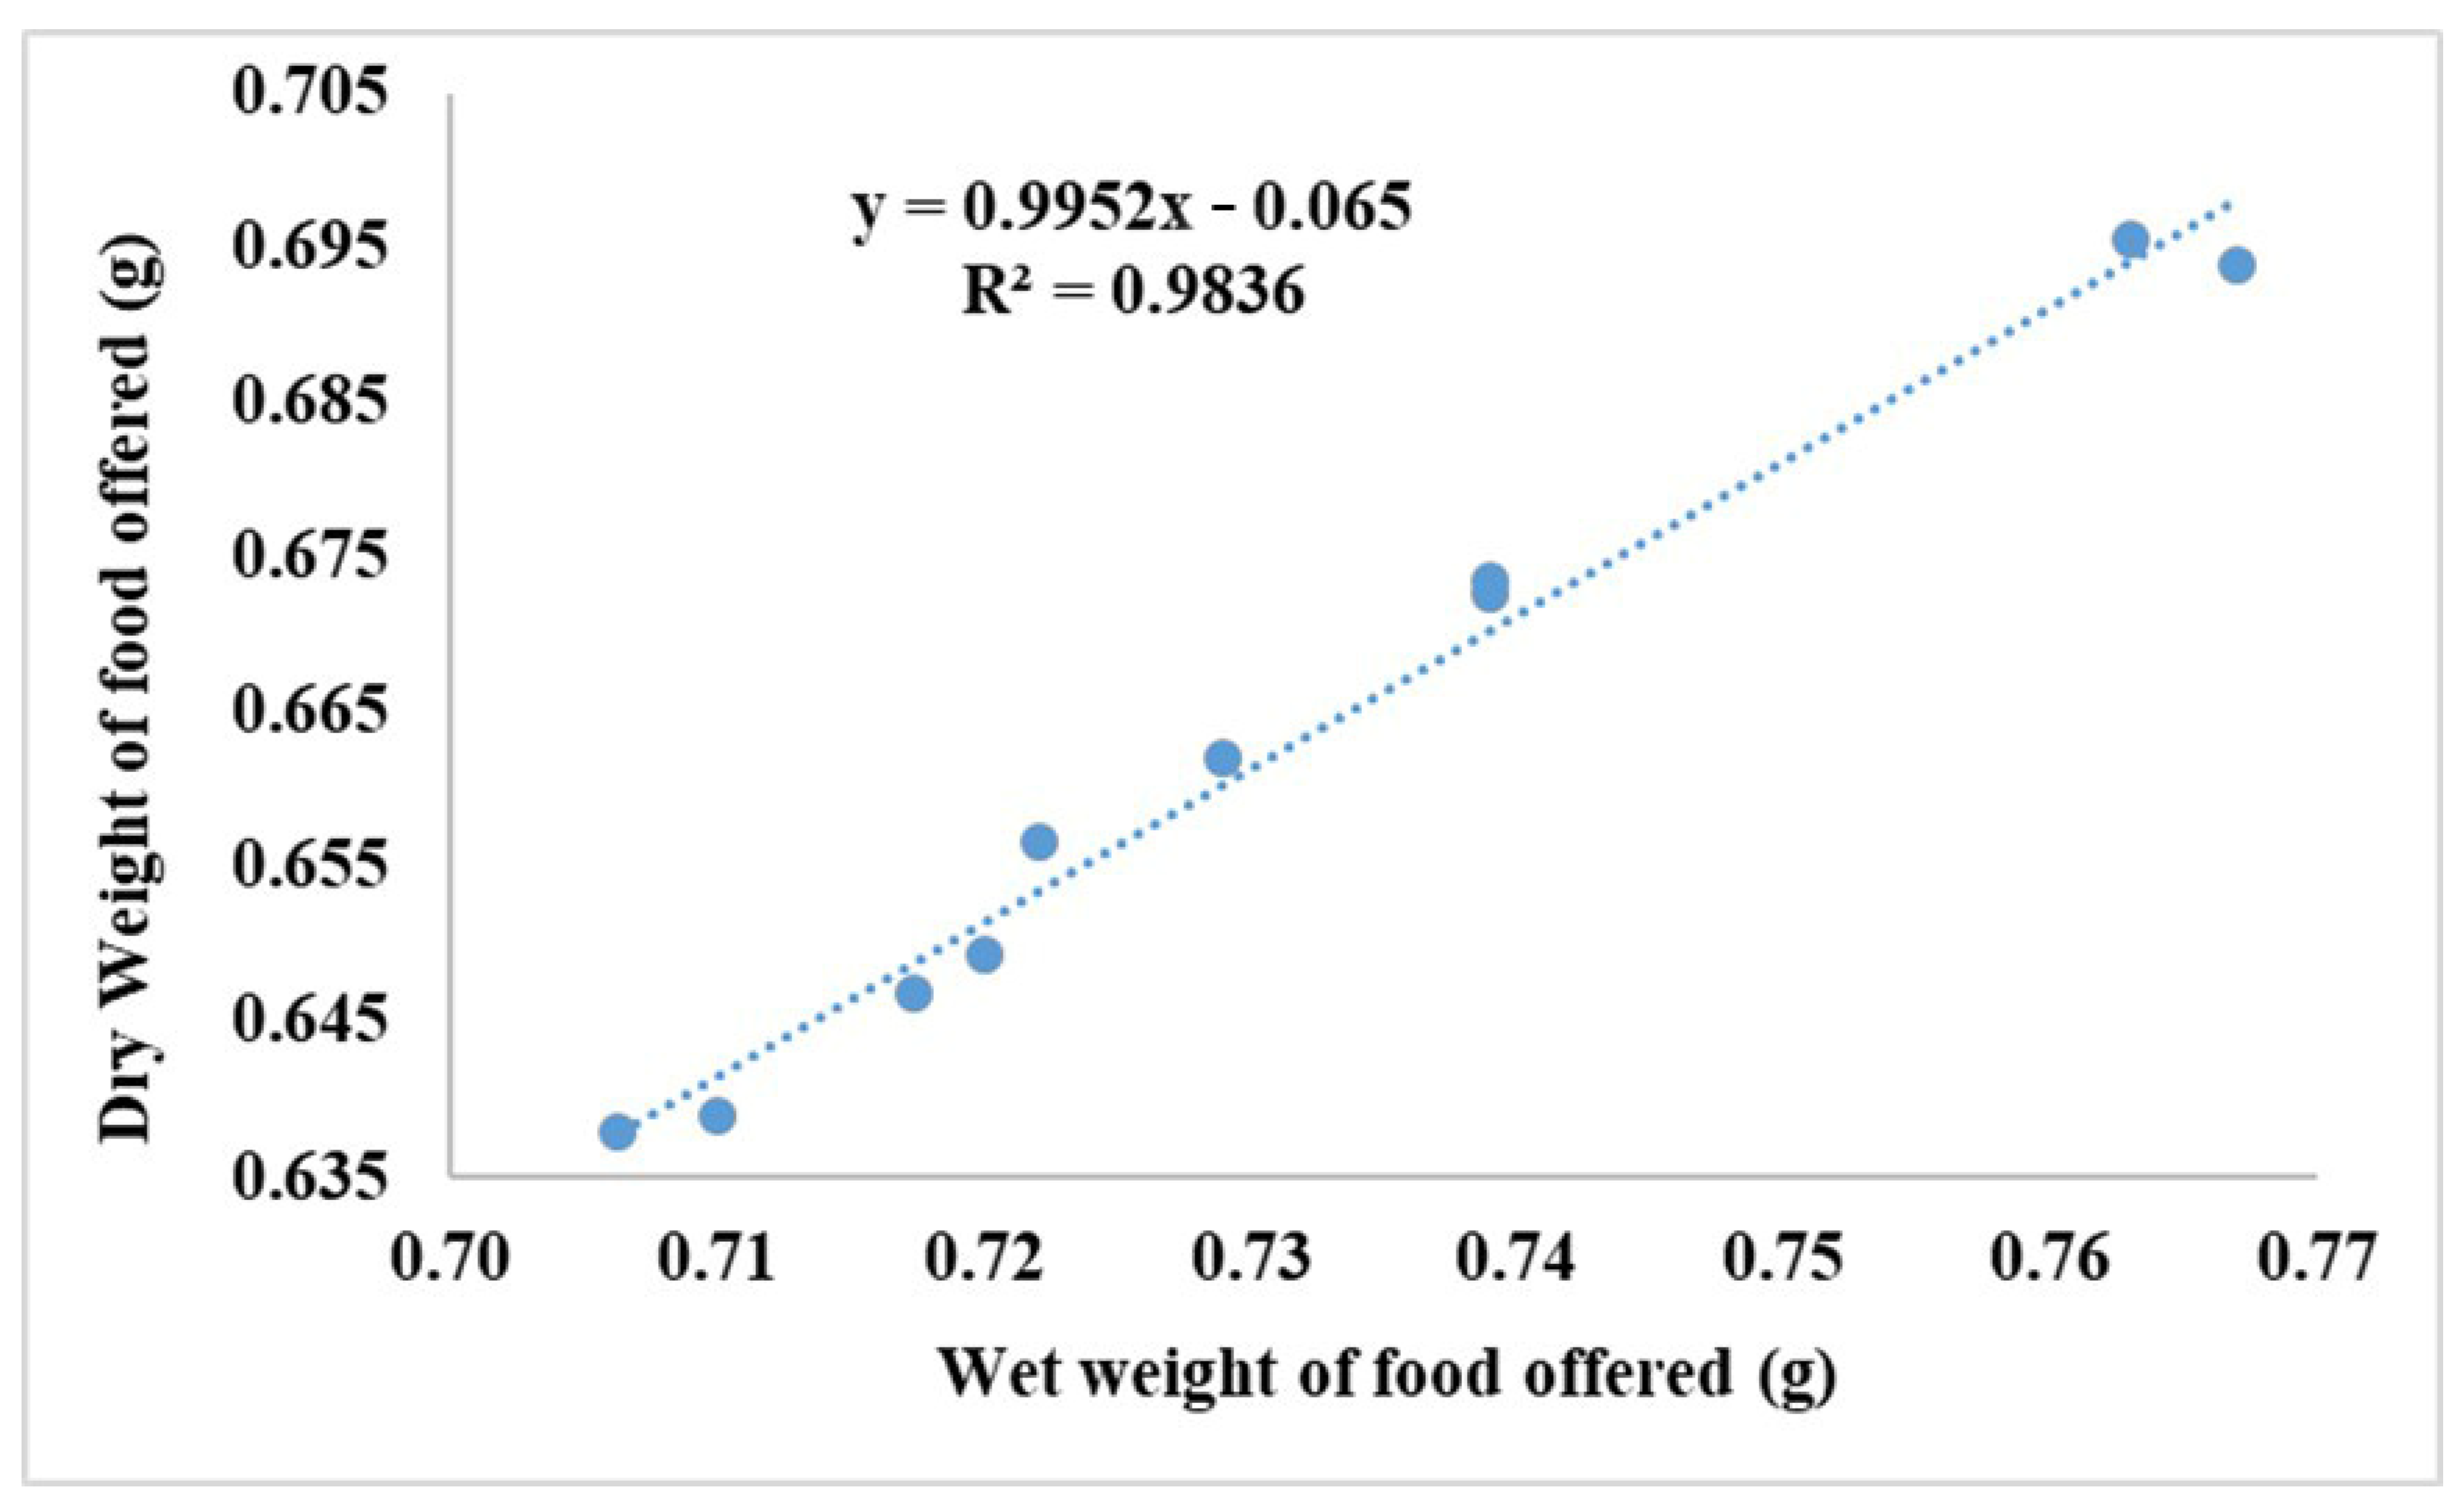
2.3. Feed Intake and Utilization
2.4. Water Quality Criteria
2.5. Photosynthetic Pigment Content
2.6. Sampling—Chemical Analysis
2.7. Nutritional and Plant Growth Indices
2.8. Statistical Analysis
3. Results
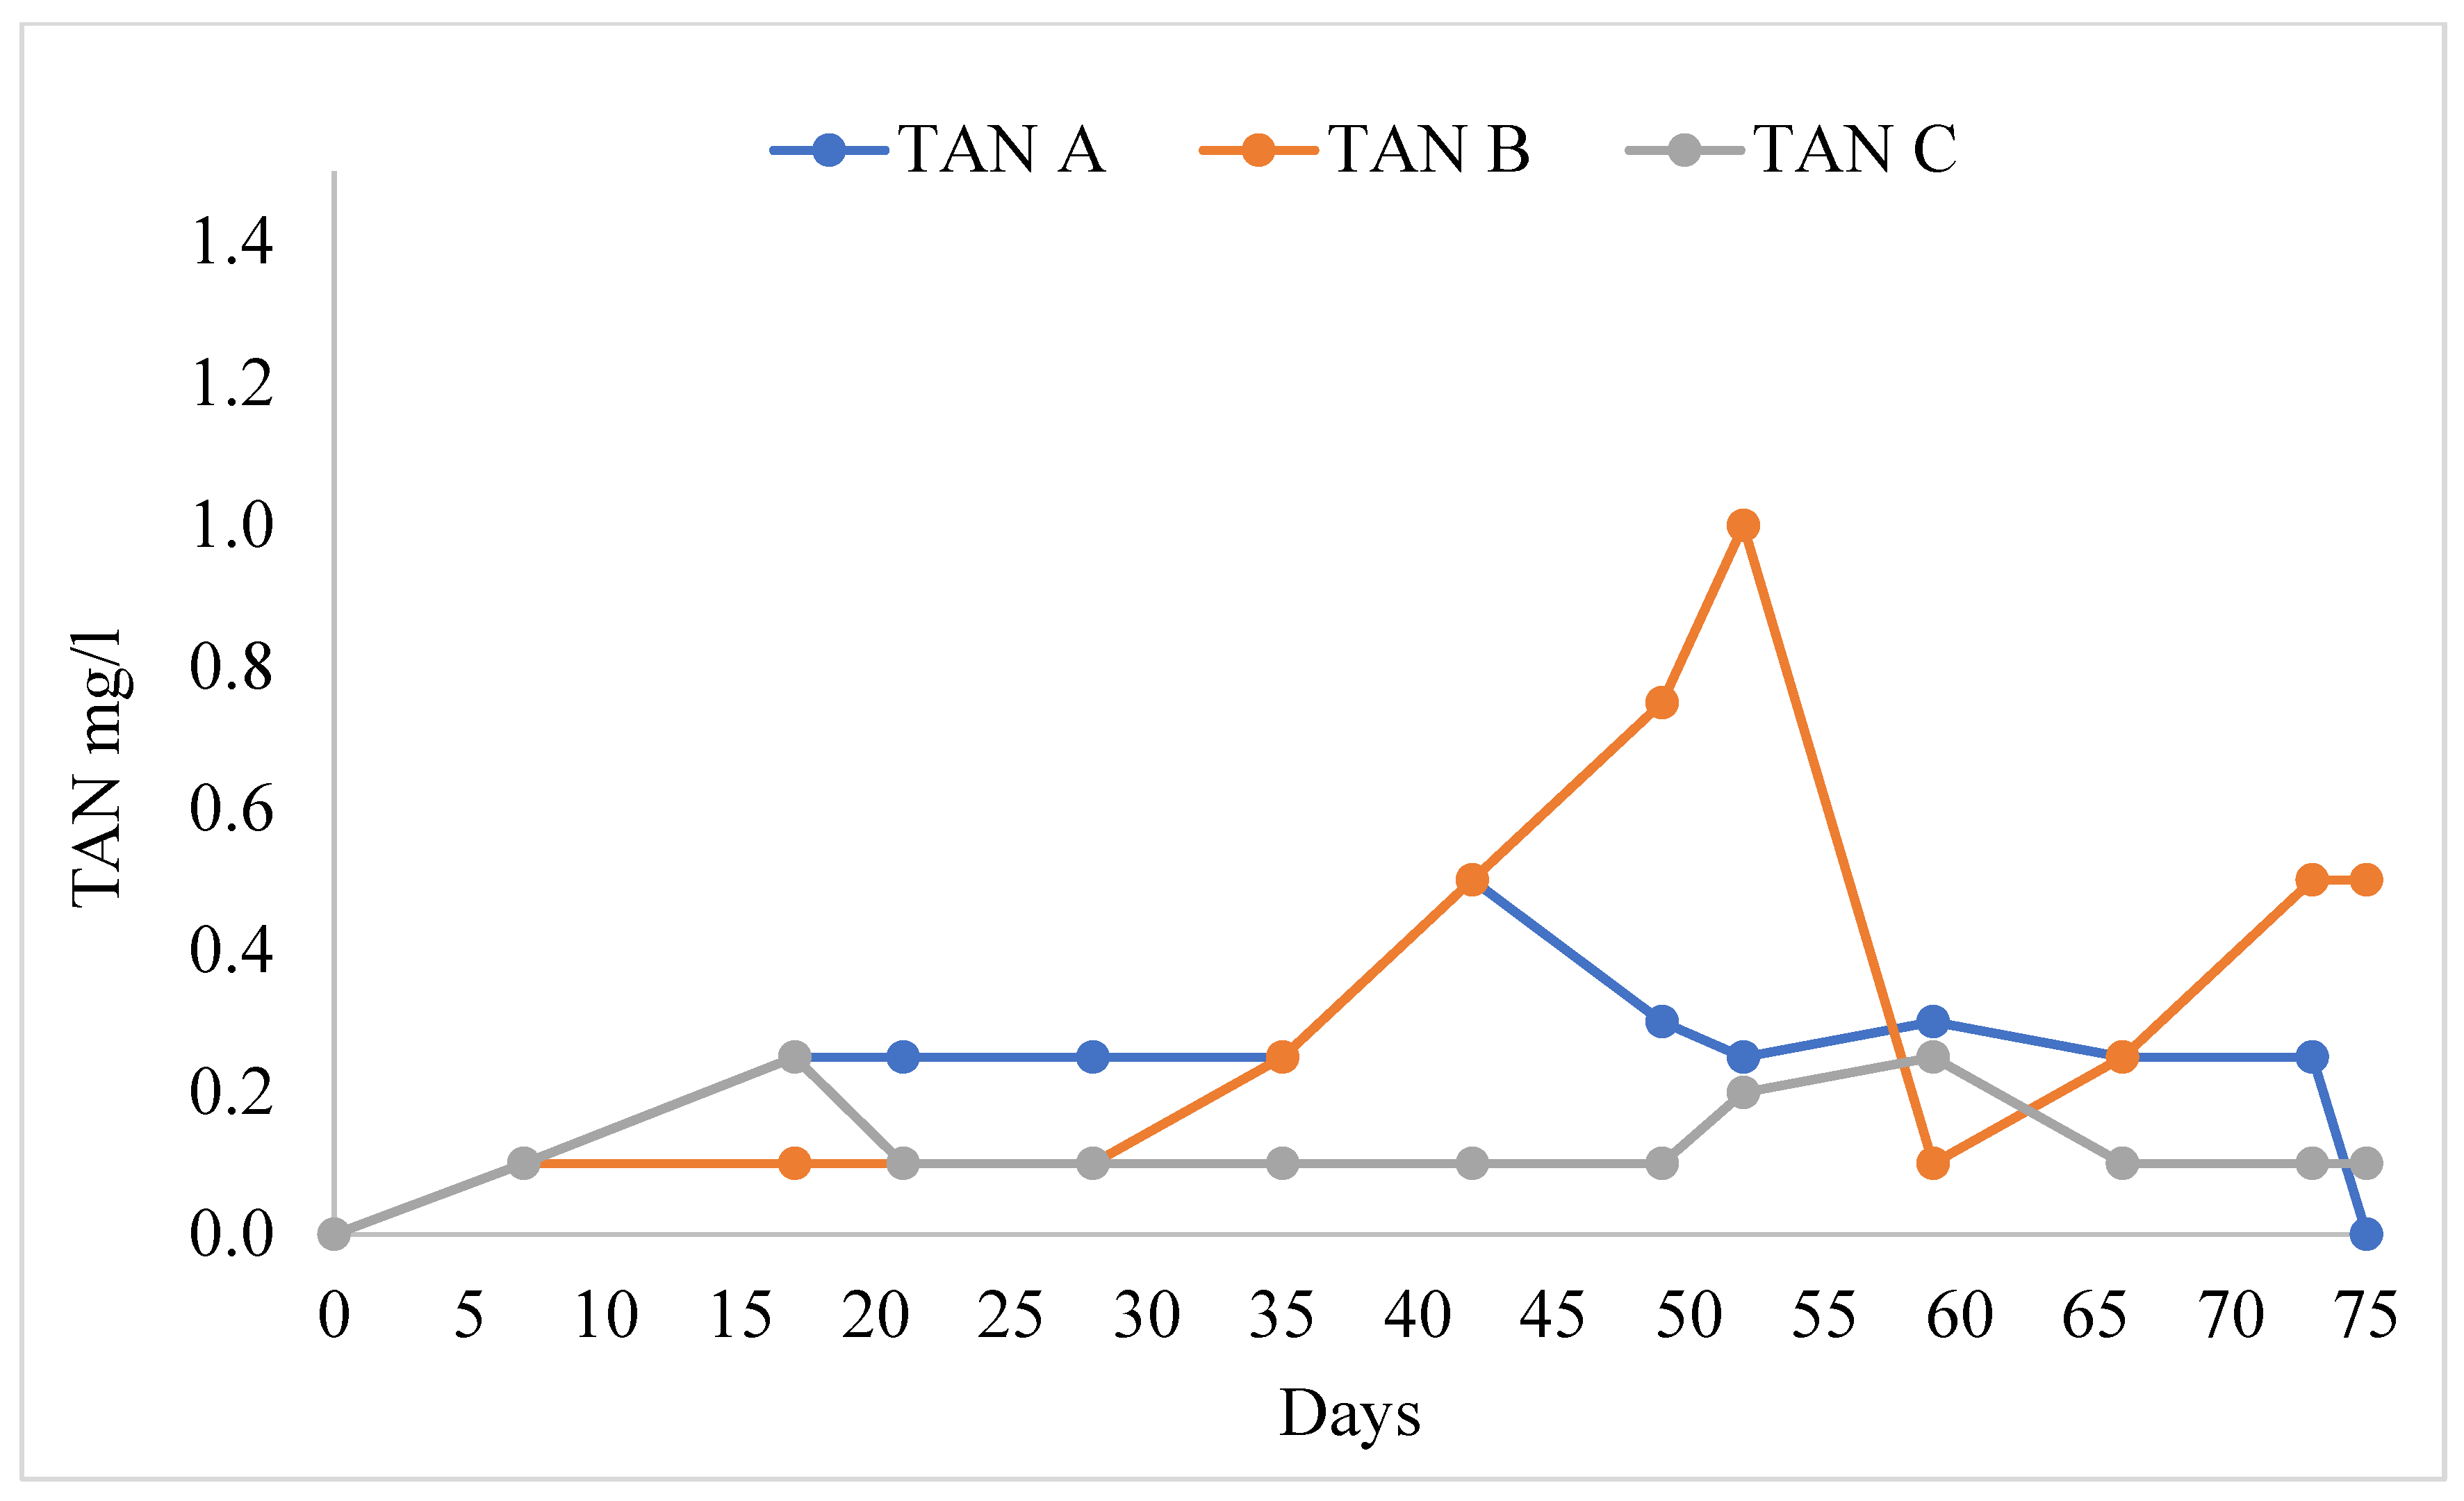
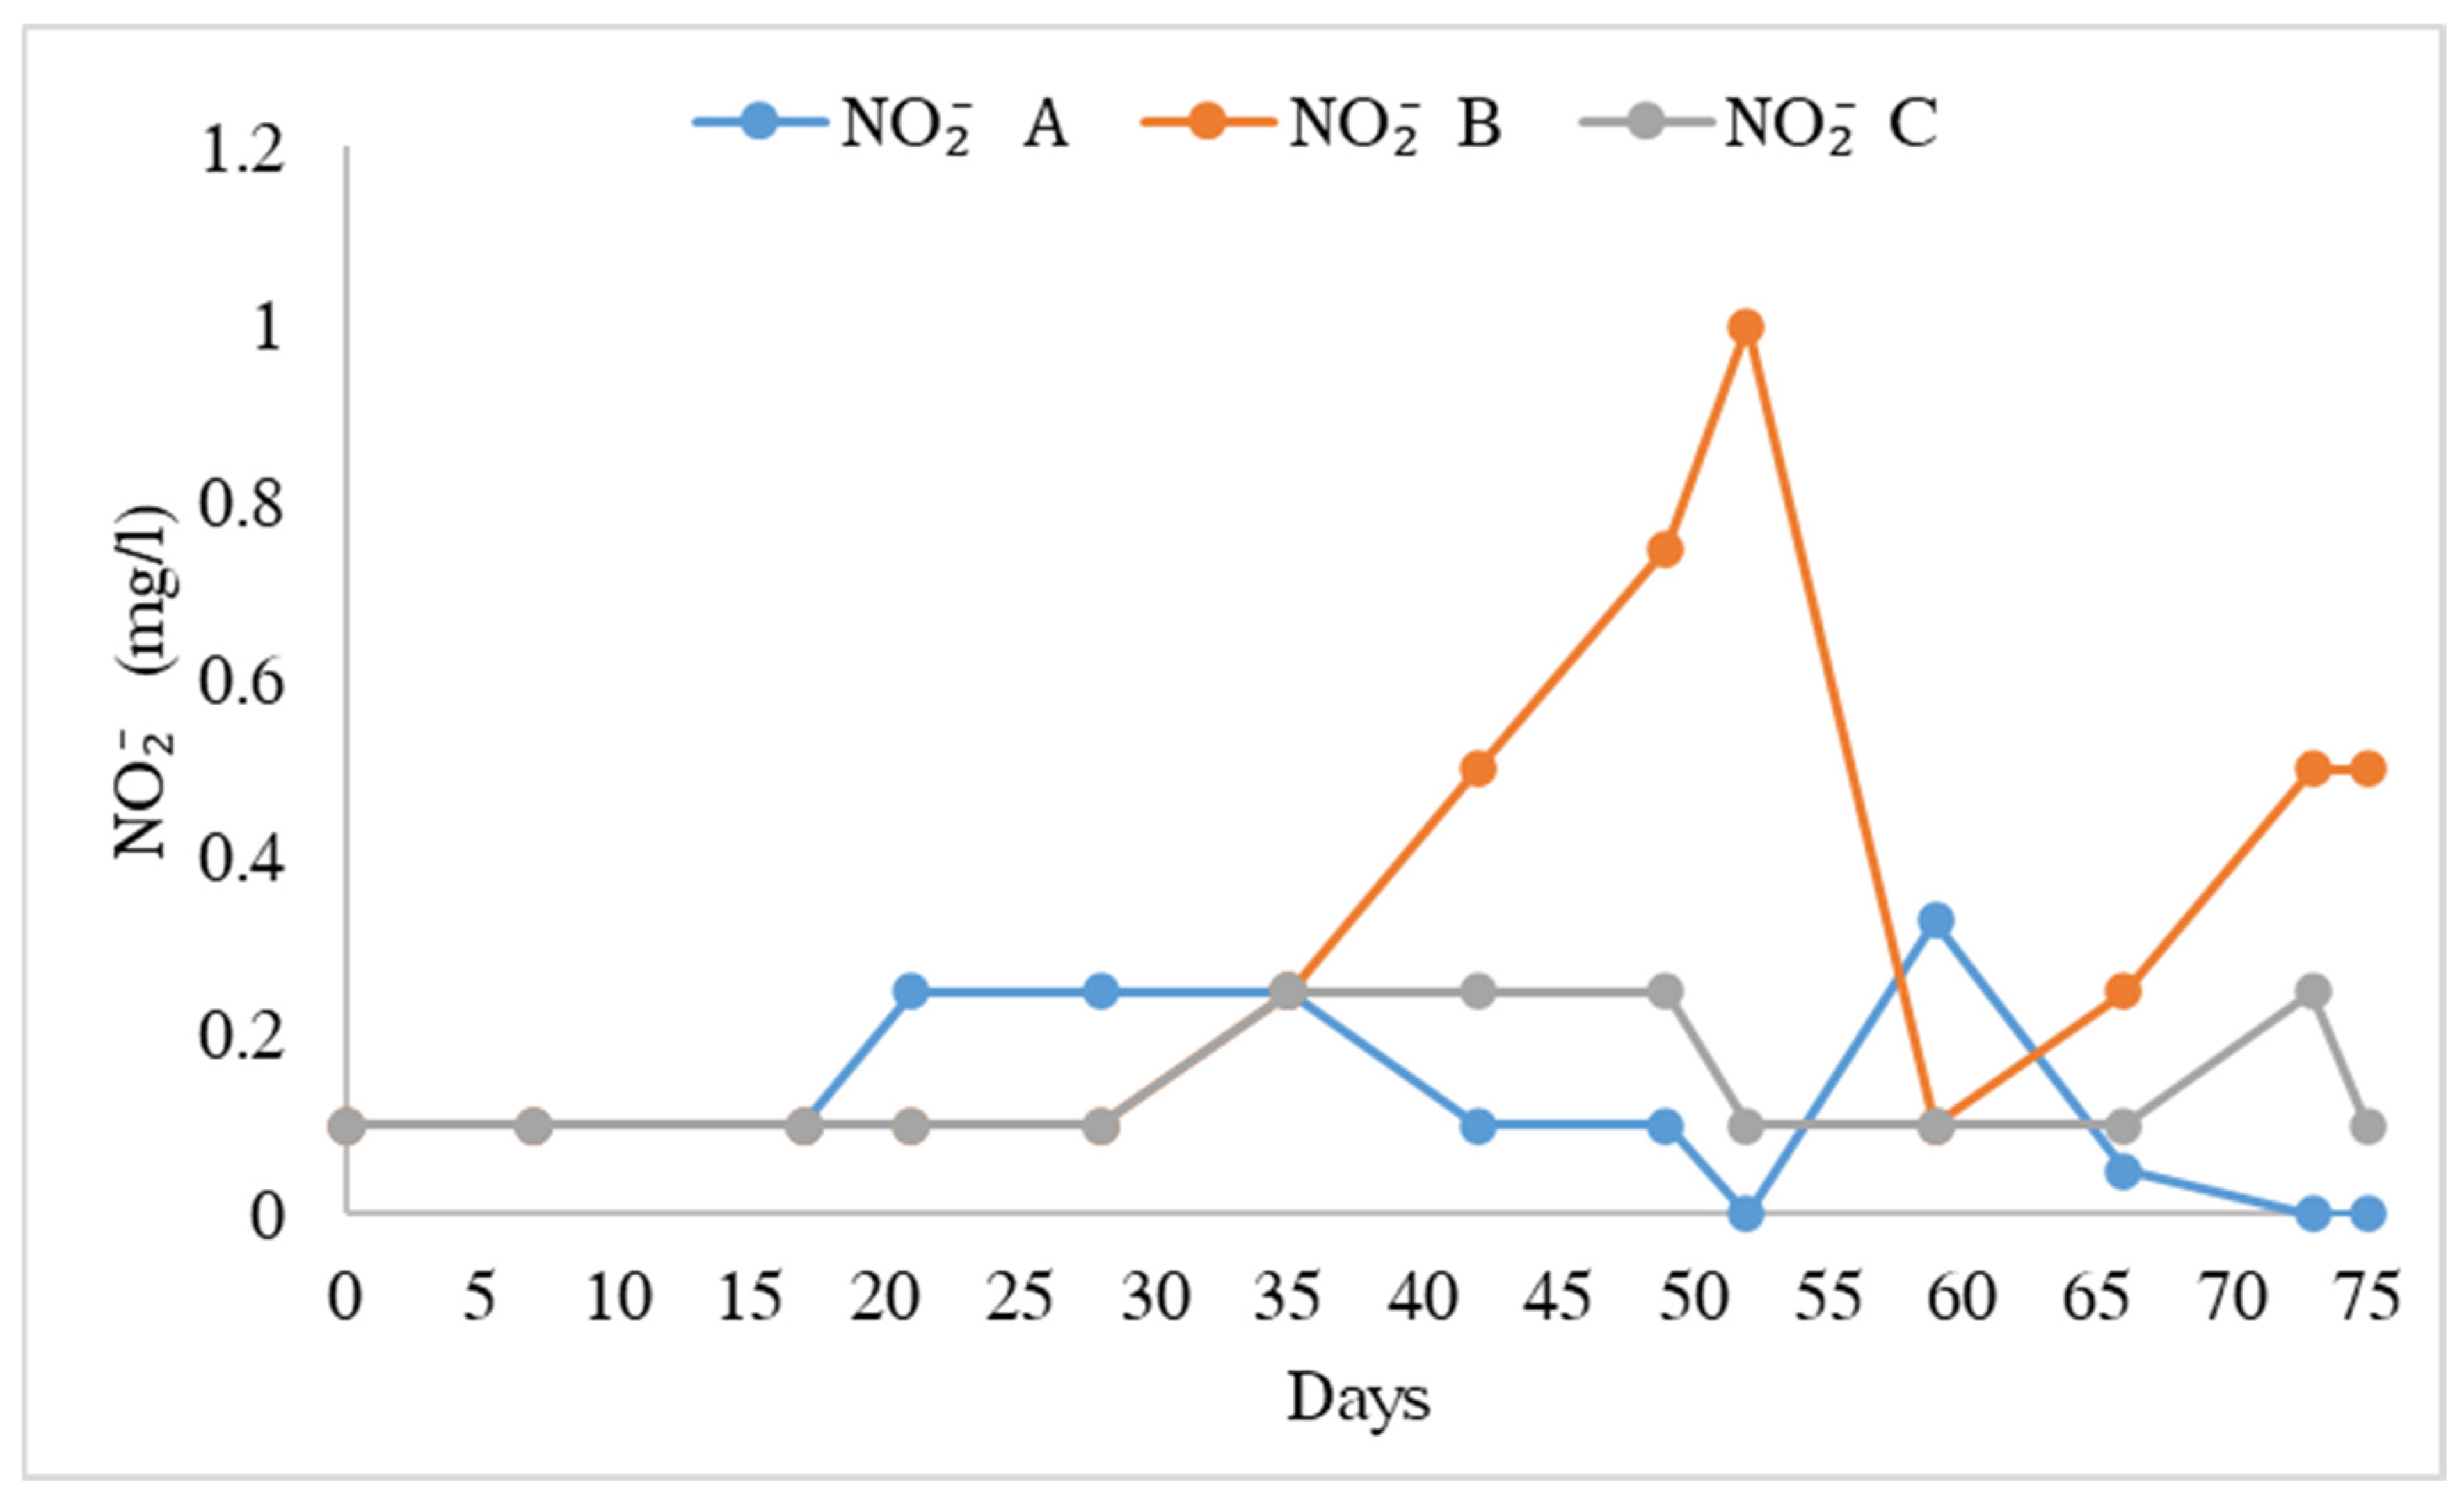
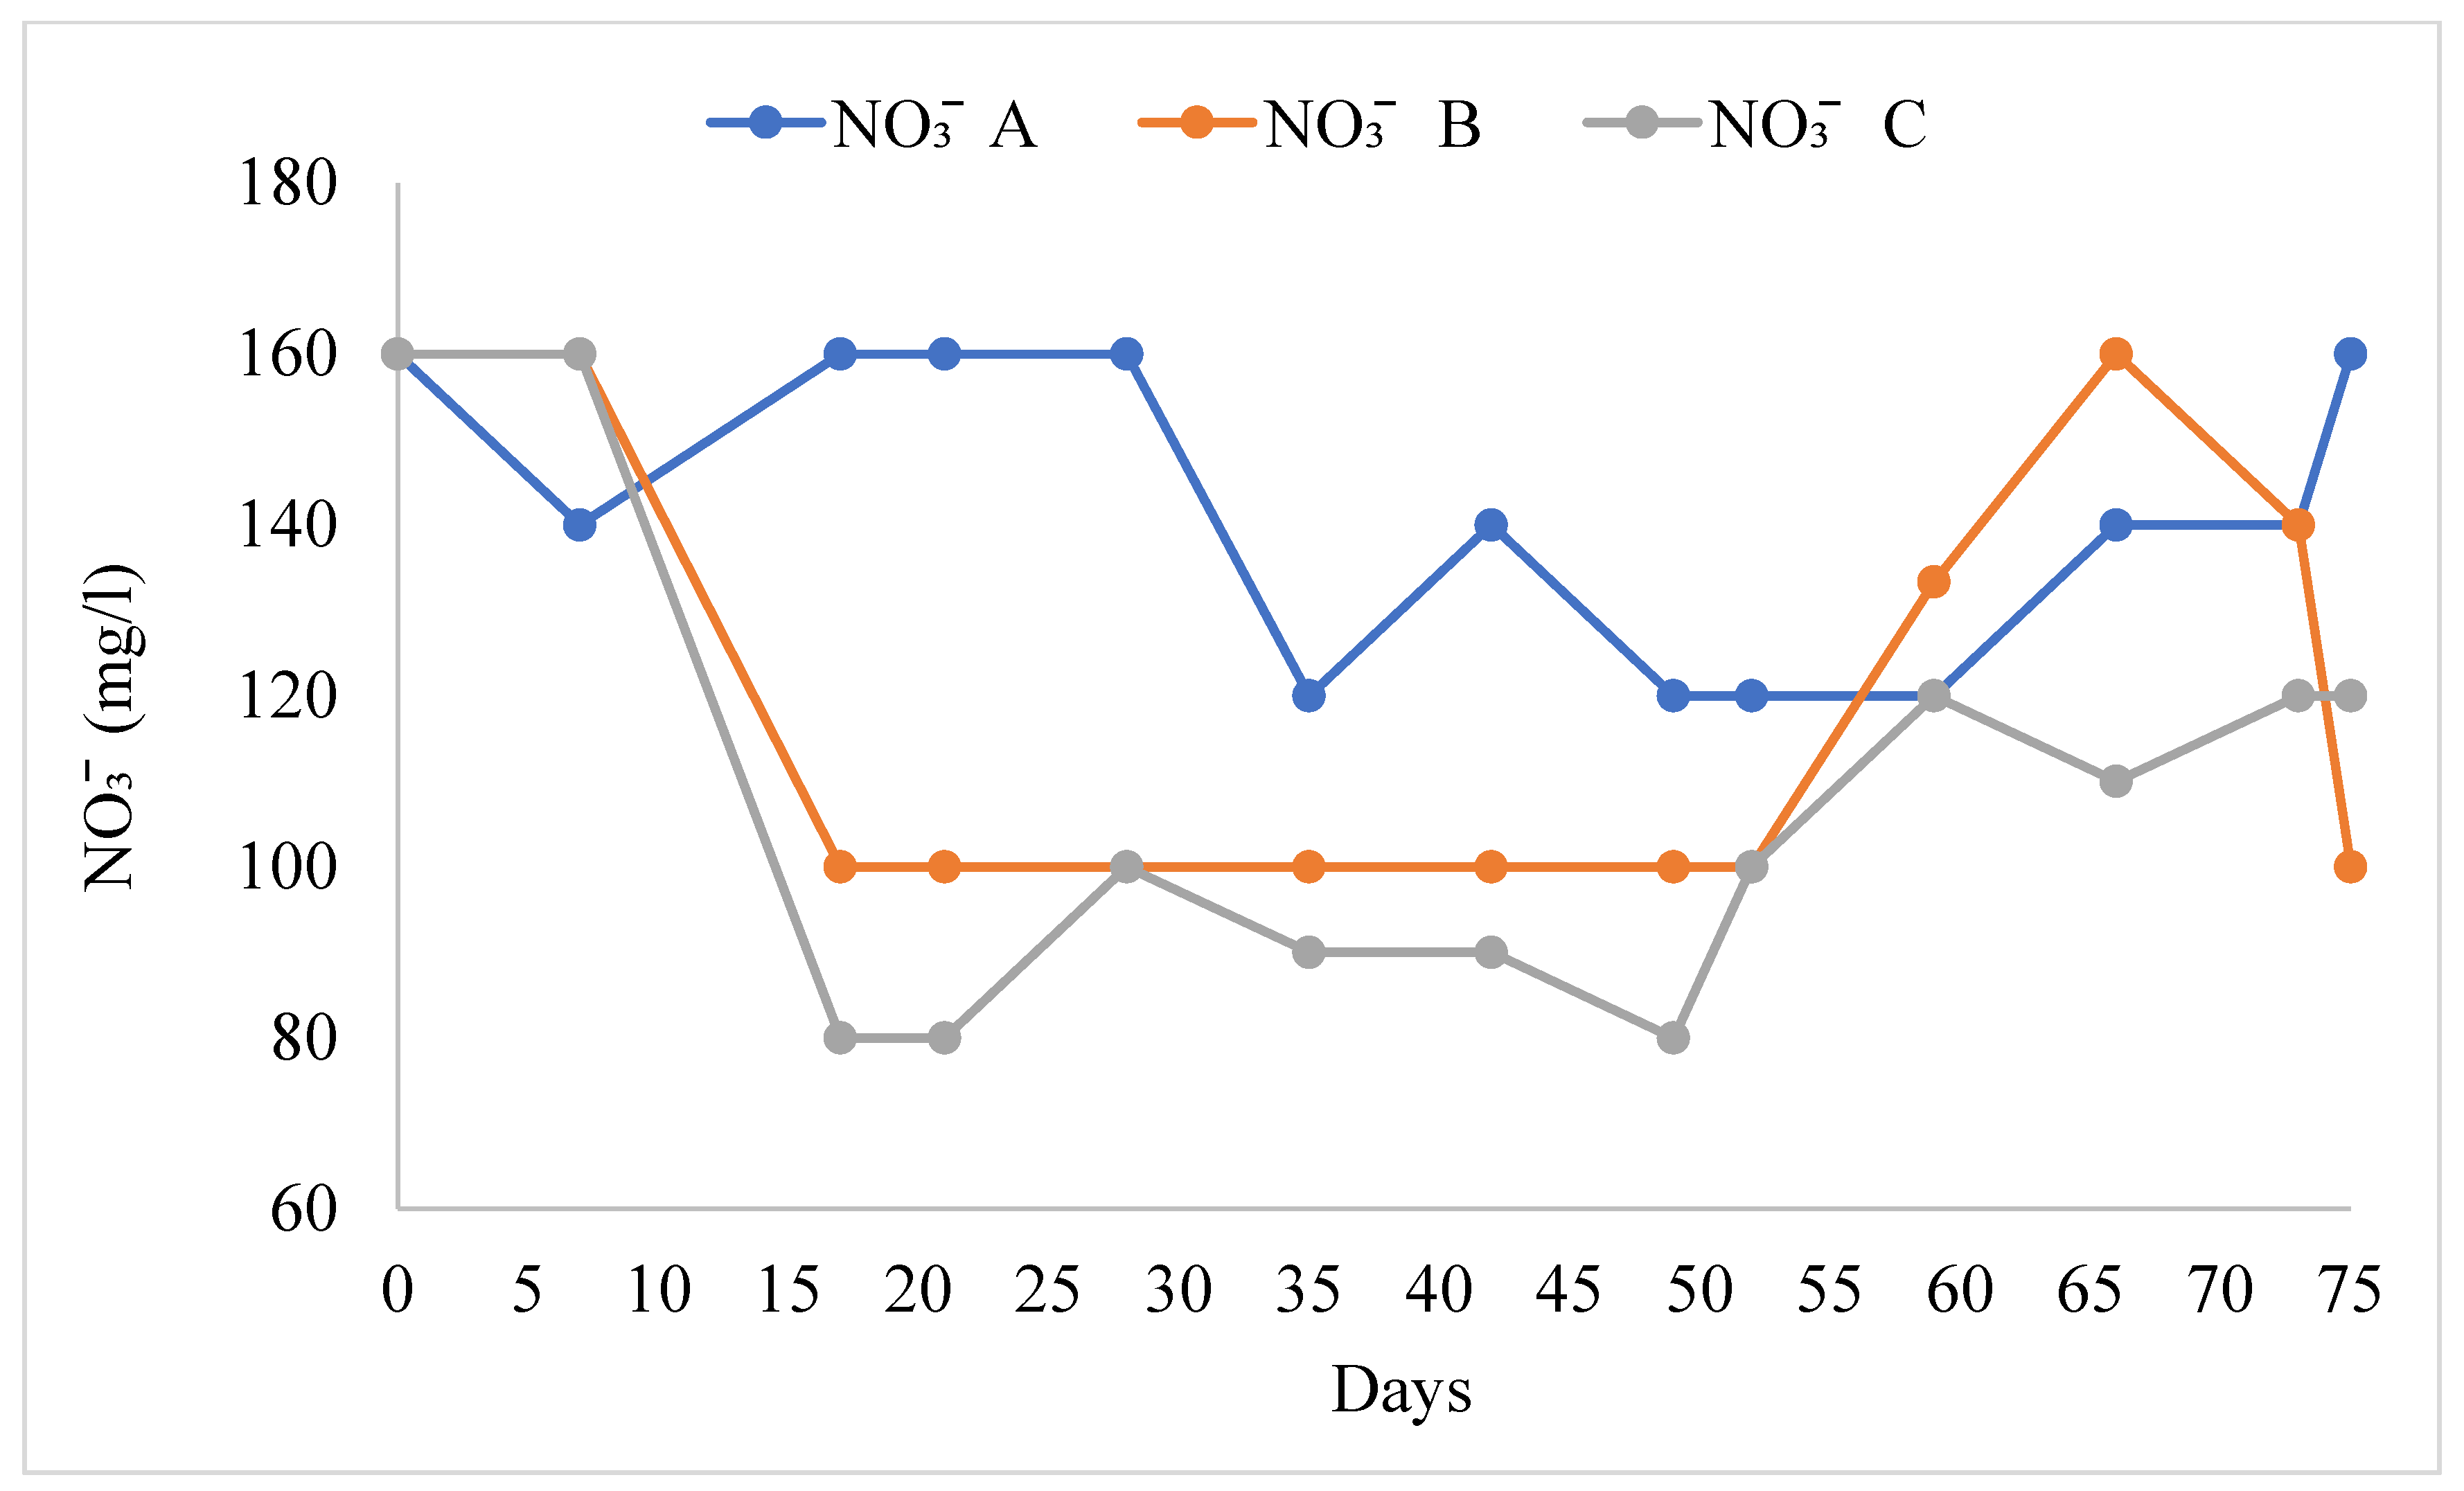
3.1. Water Quality
3.2. Fish, Prawn, and Plant Growth Performance Indices
4. Discussion
4.1. Water Quality
4.2. Fish Growth Performance
4.3. Prawn Growth Performance
4.4. Plant Growth Performance
5. Conclusions
Author Contributions
Funding
Institutional Review Board Statement
Informed Consent Statement
Data Availability Statement
Acknowledgments
Conflicts of Interest
References
- Somerville, C.; Cohen, M.; Pantanella, E.; Stankus, A.; Lovatelli, A. Small-scale aquaponic food production: Integrated fish and plant farming. FAO Fish. Aquac. Tech. Pap. 2014, 589, I. [Google Scholar]
- Diver, S.; Rinehart, L. Aquaponics-Integration of Hydroponics with Aquaculture; Attra: Butte, MT, USA, 2000. [Google Scholar]
- Zhang, X.; Zhang, Y.; Zhang, Q.; Liu, P.; Guo, R.; Jin, S.; Liu, J.; Chen, L.; Ma, Z.; Liu, Y. Evaluation and analysis of water quality of marine aquaculture area. Int. J. Environ. Res. Public Health 2020, 17, 1446. [Google Scholar] [CrossRef] [PubMed]
- Zhao, W.; Liu, C.; Li, D.; Zheng, Y. Energy-saving techniques in urban aquaponics farms by optimizing equipment operating scheme. Aquaculture 2024, 587, 740873. [Google Scholar] [CrossRef]
- Vlahos, N.; Berillis, P.; Levizou, E.; Patsea, E.; Panteli, N.; Demertzioglou, M.; Morfesis, K.; Voudouri, G.; Krigas, N.; Kormas, K.; et al. Investigating Salinity Effects in Brackish Aquaponics Systems: Evidencing the Co-Cultivation of the Halophyte Crithmum maritimum with the Euryhaline Sparus aurata. Appl. Sci. 2023, 13, 3385. [Google Scholar] [CrossRef]
- Mitsopoulos, I.; Kontou, I.G.; Babouklis, K.; Vlahos, N.; Berillis, P.; Levizou, E.; Mente, E. Starvation and re-feeding of Gilthead seabream (Sparus aurata) and European seabass (Dicentrarchus labrax) co-cultured with glasswort (Salicornia europaea) in a polyculture aquaponic system. PeerJ 2024, 12, e17814. [Google Scholar] [CrossRef]
- Stathopoulou, P.; Berillis, P.; Levizou, E.; Sakellariou-Makrantonaki, M.; Kormas, A.K.; Angelaki, A.; Kapsis, P.; Vlahos, N.; Mente, E. Basil and Nile tilapia production in a small scale aquaponic system. J. Fish. Sci. 2018, 12, 1–3. [Google Scholar]
- Baganz, G.F.M.; Timpe, A.; Baganz, D.; Staaks, G.; Hunger, B.; Kloas, W.; Lohrberg, F. City or hinterland–site potentials for upscaled aquaponics in a Berlin case study. npj Urban Sustain. 2022, 2, 29. [Google Scholar] [CrossRef]
- Kotzen, B.; Emerenciano, M.G.C.; Moheimani, N.; Burnell, G.M. Aquaponics: Alternative types and approaches. In Aquaponics Food Production Systems: Combined Aquaculture and Hydroponic Production Technologies for the Future; Springer Nature: Dordrecht, The Netherlands, 2019; pp. 301–330. [Google Scholar] [CrossRef]
- Rossi, L.; Bibbiani, C.; Fierro-Sañudo, J.F.; Maibam, C.; Incrocci, L.; Pardossi, A.; Fronte, B. Selection of marine fish for integrated multi-trophic aquaponic production in the Mediterranean area using DEXi multi-criteria analysis. Aquaculture 2021, 535, 736402. [Google Scholar] [CrossRef]
- Puccinelli, M.; Fierro-Sañudo, J.F.; Bibbiani, C.; Fronte, B.; Maibam, C.; Dubois, T.; Pardossi, A.; Incrocci, L.; Rossi, L. Multi-Criteria DEXi Analysis for the Selection of Crop Species for Saltwater Aquaponics. Horticulturae 2022, 8, 703. [Google Scholar] [CrossRef]
- Anderson, C.E. A Review of Structure in Several North Carolina Salt Marsh Plants; Reimold, R.J., Queen, W.H., Eds.; Ecology of Halophytes; Academic Press, Inc.: New York, NY, USA, 1974; pp. 307–344. [Google Scholar]
- Ellison, A.M. Effects of competition, disturbance, and herbivory on Salicornia europaea. Ecology 1987, 68, 576–586. [Google Scholar] [CrossRef]
- González-Ortegón, E.; Sargent, P.; Pohle, G.; Martinez-Lage, A. The Baltic prawn Palaemon adspersus Rathke, 1837 (Decapoda, Caridea, Palaemonidae): First record, possible establishment, and illustrated key of the subfamily Palaemoninae in northwest Atlantic waters. Aquat. Invasions 2014, 10, 299–312. [Google Scholar] [CrossRef]
- Janas, U.; Spicer, J.I. Seasonal and temperature effects on osmoregulation by the invasive prawn Palaemon elegans Rathke, 1837 in the Baltic Sea. Mar. Biol. Res. 2010, 6, 333–337. [Google Scholar] [CrossRef]
- Glamuzina, B.; Pešić, A.; Joksimović, A.; Glamuzina, L.; Matić-Skoko, S.; Conides, A.; Klaoudatos, D.; Zacharaki, P. Observations on the increase of wild gilthead seabream, Sparus aurata abundance, in the eastern Adriatic Sea: Problems and opportunities. Int. Aquat. Res. 2014, 6, 127–134. [Google Scholar] [CrossRef]
- FAO. Brief to The State of World Fisheries and Aquaculture 2024; Blue Transformation in Action; FAO: Rome, Italy, 2024. [Google Scholar] [CrossRef]
- Federation of Greek Maricultures. Annual Report 2023. Available online: https://fishfromgreece.com/wp-content/uploads/2023/10/HAPO_AR23_WEB-NEW.pdf (accessed on 29 August 2024).
- Rubio, V.C.; Sánchez-Vázquez, F.J.; Madrid, J.A. Effects of salinity on food intake and macronutrient selection in European sea bass. Physiol. Behav. 2005, 85, 333–339. [Google Scholar] [CrossRef]
- Gaylord, T.G.; Gatlin, D.M. Dietary protein and energy modifications to maximize compensatory growth of channel catfish (Ictalurus punctatus). Aquaculture 2001, 194, 337–348. [Google Scholar] [CrossRef]
- Ali, A.; Al-Asgah, N.; Al-Ogaily, S.; Ali, S. Effect of feeding different levels of alfalfa meal on the growth performance and body composition of Nile tilapia (Oreochromis niloticus) fingerlings. Asian Fish. Sci. 2003, 16, 59–68. [Google Scholar] [CrossRef]
- Grigorakis, K.; Alexis, M. Effects of fasting on the meat quality and fat deposition of commercial-size farmed gilthead sea bream (Sparus aurata, L.) fed different dietary regimes. Aquac. Nutr. 2005, 11, 341–344. [Google Scholar] [CrossRef]
- Mattila, J.; Koskela, J.; Pirhonen, J. The effect of the length of repeated feed deprivation between single meals on compensatory growth of pikeperch Sander lucioperca. Aquaculture 2009, 296, 65–70. [Google Scholar] [CrossRef]
- Thomas, M.; Pasquet, A.; Aubin, J.; Nahon, S.; Lecocq, T. When more is more: Taking advantage of species diversity to move towards sustainable aquaculture. Biol. Rev. 2021, 96, 767–784. [Google Scholar] [CrossRef]
- Vlahos, N.; Levizou, E.; Patsea, E.; Tasiou, K.; Berillis, P.; Antonopoulou, E.; Bekiari, V.; Martou, N.; Morfesis, K.; Lazari, D.; et al. Salinity affects the efficiency of a brackish aquaponics system of sea bass (Dicentrarchus labrax) and rock samphire (Crithmum maritimum). Aquaculture 2023, 571, 739493. [Google Scholar] [CrossRef]
- Helland, S.; Grisdale-Helland, B.; Nerland, S. A simple method for the measurement of daily feed intake of groups of fish in tanks. Aquaculture 1996, 139, 157–163. [Google Scholar] [CrossRef]
- Liddicoat, M.I.; Tibhitts, S.; Butler, E.I. The determination of ammonia in seawater. Limnol. Oceanogr. 1975, 20, 131–132. [Google Scholar] [CrossRef]
- Lichtenthaler, H.K.; Wellburn, A.R. Determinations of total carotenoids and chlorophylls a and b of leaf extracts in different solvents. Biochem. Soc. Trans. 1983, 11, 591–592. [Google Scholar] [CrossRef]
- AOAC. Official Methods of Analysis, 16th ed.; AOAC INTERNATIONAL: Washington, DC, USA, 1995. [Google Scholar]
- Endut, A.; Jusoh, A.; Ali, N.; Nik, W.B.W.; Hassan, A. A study on the optimal hydraulic loading rate and plant ratios in recirculation aquaponic system. Bioresour. Technol. 2010, 101, 1511–1517. [Google Scholar] [CrossRef] [PubMed]
- Karapanagiotidis, I.T.; Kyritsi, S.; Dretaki-Stamou, G.; Psofakis, P.; Neofytou, M.C.; Mente, E.; Vlahos, N.; Karalazos, V. The effect of different dietary protein levels on growth performance and nutrient utilization of snarpsnout sea bream (Diplodus puntazzo). Aquac. Res. 2021, 53, 1909–1917. [Google Scholar] [CrossRef]
- Adaklı, A.; Taşbozan, O. The effects of different cycles of starvation and refeeding on growth and body composition on europaean sea bass (Dicentrarchus labrax). Turkish J. Fish Aquat. 2015, 15, 419–427. [Google Scholar] [CrossRef]
- Zar, J.H. Biostatistical Analysis; Prentice-Hall: London, UK, 1999; p. 718. [Google Scholar]
- Boyd, C.E.; Tucker, C.S. Handbook for aquaculture water quality. In Handbook for Aquaculture Water Quality; USDA ARS: Washington, DC, USA, 2014; p. 439. [Google Scholar]
- Das, A.; Choudhury, T.G.; Mandal, S. Compensatory growth in fishes a boon to aquaculture. Aquac. Eur. 2012, 37, 20–23. [Google Scholar]
- Xu, X.; Ji, W.; Castell, J.D.; O’Dor, R. The nutritional value of dietary n-3 and n-6 fatty acids for the Chinese prawn (Penaeus chinensis). Aquaculture 1993, 118, 277–285. [Google Scholar] [CrossRef]
- Buzby, K.M.; Lin, L.-S. Scaling aquaponic systems: Balancing plant uptake with fish output. Aquac. Eng. 2014, 63, 39–44. [Google Scholar] [CrossRef]
- Quinta, R. Effectiveness of Halophytic Plants in the Treatment of Marine Aquaculture Wastewater; Bangor University: Bangor, UK, 2013. [Google Scholar]
- Yildiz, H.Y.; Robaina, L.; Pirhonen, J.; Mente, E.; Domínguez, D.; Parisi, G. Fish Welfare in aquaponic systems: Its relation to water quality with an emphasis on feed and faeces—A review. Water 2017, 9, 13. [Google Scholar] [CrossRef]
- Tyson, R.V.; Simonne, E.H.; White, J.M.; Lamb, E.M. Reconciling water parameters impacting nitrification in aquaponics: The pH levels. Proc. Fla. State Hortic. Soc. 2004, 117, 79–83. [Google Scholar]
- Wu, X.-Y.; Chen, Y.-Y.; Lai, J.-S.; Liu, Y.; Song, M.-J.; Gong, Q.; Long, Z.-H. Effects of starvation and refeeding on growth performance, appetite, growth hormone–insulin-like growth factor axis levels and digestive function of Acipenser dabryanus. Br. J. Nutr. 2020, 126, 695–707. [Google Scholar] [CrossRef] [PubMed]
- Ziegelbecker, A.; Sefc, K.M. Growth, body condition and contest performance after early-life food restriction in a long-lived tropical fish. Nat. Ecol. Evol. 2021, 11, 10904–10916. [Google Scholar] [CrossRef] [PubMed]
- Ali, M.Z.; Jauncey, K. Evaluation of mixed feeding schedules with respect to compensatory growth and body composition in African catfish Clarias gariepinus. Aquac. Nutr. 2004, 10, 39–45. [Google Scholar] [CrossRef]
- Jobling, M. Are compensatory growth and catch-up growth two sides of the same coin? Aquac. Int. 2010, 18, 501–510. [Google Scholar] [CrossRef]
- Hasanpour, S.; Oujifard, A.; Mozanzadeh, M.T.; Safari, O. Compensatory growth, antioxidant capacity and digestive enzyme activities of Sobaity (Sparidentex hasta) and yellowfin seabreams (Acanthopagrus latus) subjected to ration restriction. Aquac. Nutr. 2021, 27, 2448–2458. [Google Scholar] [CrossRef]
- Goede, R.W. Organismic indices and an autopsy-based assessment as indicators of health and condition of fish. Am. Fish. Soc. Symp. 1990, 8, 93–108. [Google Scholar]
- Krogdahl, Å.; Bakke-McKellep, A.M. Fasting and refeeding cause rapid changes in intestinal tissue mass and digestive enzyme capacities of Atlantic salmon (Salmo salar L.). Comp. Biochem. Physiol. Part A Mol. Integr. Physiol. 2005, 141, 450–460. [Google Scholar] [CrossRef]
- Eroldoğan, O.T.; Taşbozan, O.; Tabakoğlu, S. Effects of restricted feeding regimes on growth and feed utilization of juvenile gilthead sea bream, Sparus aurata. J. World Aquac. Soc. 2008, 39, 267–274. [Google Scholar] [CrossRef]
- Maclean, A.; Metcalfe, N.B. Social status, access to food, and compensatory growth in juvenile Atlantic salmon. J. Fish Biol. 2001, 58, 1331–1346. [Google Scholar] [CrossRef]
- Xie, P. Gut contents of bighead carp (Aristichthys nobilis) and the processing and digestion of algal cells in the alimentary canal. Aquaculture 2001, 195, 149–161. [Google Scholar] [CrossRef]
- Zhu, X.; Cui, Y.; Ali, M.; Wootton, R.J. Comparison of compensatory growth responses of juvenile three-spined stickleback and minnow following similar food deprivation protocols. J. Fish Biol. 2001, 58, 1149–1165. [Google Scholar] [CrossRef]
- Hvas, M.; Nilsson, J.; Vågseth, T.; Nola, V.; Fjelldal, P.G.; Hansen, T.J.; Oppedal, F.; Stien, L.H.; Folkedal, O. Full compensatory growth before harvest and no impact on fish welfare in Atlantic salmon after an 8-week fasting period. Aquaculture 2022, 546, 737415. [Google Scholar] [CrossRef]
- Nikki, J.; Pirhonen, J.; Jobling, M.; Karjalainen, J. Compensatory growth in juvenile rainbow trout, Oncorhynchus mykiss (Walbaum), held individually. Aquaculture 2004, 235, 285–296. [Google Scholar] [CrossRef]
- Alvarez-Lajonchère, L.; Ibarra-Castro, L. Aquaculture species selection method applied to marine fish in the Caribbean. Aquaculture 2013, 408, 20–29. [Google Scholar] [CrossRef]
- Quinton, J.C.; Blake, R.W. The effect of feed cycling and ration level on the compensatory growth response in rainbow trout, Oncorhynchus my kiss. J. Fish Biol. 1990, 37, 33–41. [Google Scholar] [CrossRef]
- Türkmen, S.; Eroldoğan, O.T.; Yılmaz, H.A.; Ölçülü, A.; Inan, G.A.K.; Erçen, Z.; Tekelioğlu, N. Compensatory growth response of European sea bass (Dicentrarchus labrax L.) under cycled starvation and restricted feeding rate. Aquac. Res. 2012, 43, 1643–1650. [Google Scholar] [CrossRef]
- Yılmaz, H.A.; Eroldogan, O.T. Combined effects of cycled starvation and feeding frequency on growth and oxygen consumption of gilthead sea bream, Sparus aurata. J. World Aquac. Soc. 2011, 42, 522–529. [Google Scholar] [CrossRef]
- Das, P.; Mandal, S.C.; Bhagabati, S.K.; Akhtar, M.S.; Singh, S.K. Important live food organisms and their role in aquaculture. Front. Aquac. 2012, 5, 69–86. [Google Scholar]
- Cho, S.H.; Park, B.H.; Lee, S.-M. Effect of feeding ratio on growth and body composition of juvenile olive flounder Paralichthys olivaceus fed extruded pellets during the summer season. Aquaculture 2006, 251, 78–84. [Google Scholar] [CrossRef]
- Jezierska, B.; Hazel, J.R.; Gerking, S.D. Lipid mobilization during starvation in the rainbow trout, Salmo gairdneri Richardson, with attention to fatty acids. J. Fish Biol. 1982, 21, 681–692. [Google Scholar] [CrossRef]
- Satoh, S.; Takeuchi, T.; Watanabe, T. Studies on nutritive-value of dietary lipids in fish. Effects of starvation and environmental-temperature on proximate and fatty-acid compositions of tilapia-nilotica. Bull. Jpn. Soc. Sci. Fish. 1984, 50, 79–84. [Google Scholar] [CrossRef]
- Castro, C.; Corraze, G.; Pérez-Jiménez, A.; Larroquet, L.; Cluzeaud, M.; Panserat, S.; Oliva-Teles, A. Dietary carbohydrate and lipid source affect cholesterol metabolism of European sea bass (Dicentrarchus labrax) juveniles. Br. J. Nutr. 2015, 114, 1143–1156. [Google Scholar] [CrossRef] [PubMed]
- Coutinho, F.; Peres, H.; Guerreiro, I.; Pousão-Ferreira, P.; Oliva-Teles, A. Dietary protein requirement of sharpsnout sea bream (Diplodus puntazzo, Cetti 1777) juveniles. Aquaculture 2012, 356, 391–397. [Google Scholar] [CrossRef]
- Peres, H.; Santos, S.; Oliva-Teles, A. Lack of compensatory growth response in gilthead seabream (Sparus aurata) juveniles following starvation and subsequent refeeding. Aquaculture 2011, 318, 384–388. [Google Scholar] [CrossRef]
- Känkänen, M.; Pirhonen, J. The effect of intermittent feeding on feed intake and compensatory growth of whitefish Coregonus lavaretus L. Aquaculture 2009, 288, 92–97. [Google Scholar] [CrossRef]
- Mastoraki, M.; Vlahos, N.; Patsea, E.; Chatzifotis, S.; Mente, E.; Antonopoulou, E. The effect of insect meal as a feed ingredient on survival, growth, and metabolic and antioxidant response of juvenile prawn Palaemon adspersus (Rathke, 1837). Aquac. Res. 2020, 51, 3551–3562. [Google Scholar] [CrossRef]
- Palma, J.; Bureau, D.P.; Andrade, J.P. Effects of binder type and binder addition on the growth of juvenile Palaemonetes varians and Palaemon elegans (Crustacea: Palaemonidae). Aquac. Int. 2008, 16, 427–436. [Google Scholar] [CrossRef]
- Gupta, A.; Gupta, S.K.; Priyam, M.; Siddik, M.A.; Kumar, N.; Mishra, P.K.; Gupta, K.K.; Sarkar, B.; Sharma, T.R.; Pattanayak, A. Immunomodulation by dietary supplements: A preventive health strategy for sustainable aquaculture of tropical freshwater fish, Labeo rohita (Hamilton, 1822). Rev. Aquac. 2021, 13, 2364–2394. [Google Scholar] [CrossRef]
- Kumar, P.; Biswas, G.; Ghoshal, T.; Kailasam, M.; Christina, L.; Vijayan, K. Current knowledge on the biology, captive breeding and aquaculture of the brackishwater catfish, Mystus gulio (Hamilton, 1822): A review. Aquaculture 2019, 499, 243–250. [Google Scholar] [CrossRef]
- Cárdenas-Pérez, S.; Rajabi Dehnavi, A.; Leszczyński, K.; Lubińska-Mielińska, S.; Ludwiczak, A.; Pierni, A. Salicornia europaea L. Functional traits indicate its optimum growth. Plants 2022, 11, 1051. [Google Scholar] [CrossRef]
- Rozema, J.; Schat, H. Salt tolerance of halophytes, research questions reviewed in the perspective of saline agriculture. Environ. Exp. Bot. 2013, 92, 83–95. [Google Scholar] [CrossRef]
- De Souza, M.M.; Mendes, C.R.; Doncato, K.B.; Badiale-Furlong, E.; Costa, C.S. Growth, phenolics, photosynthetic pigments, and antioxidant response of two new genotypes of sea asparagus (Salicornia neei Lag.) to salinity under greenhouse and field conditions. Agriculture 2018, 8, 115. [Google Scholar] [CrossRef]
- Pinheiro, I.; Carneiro, R.F.S.; do Nascimento Vieira, F.; Gonzaga, L.V.; Fett, R.; de Oliveira Costa, A.C.; Magallon-Barajas, F.J.; Seiffert, W.Q. Aquaponic production of Sarcocornia ambigua and pacific white shrimp in biofloc system at different salinities. Aquaculture 2020, 519, 734918. [Google Scholar] [CrossRef]
- Castagna, A.; Mariottini, G.; Gabriele, M.; Longo, V.; Souid, A.; Dauvergne, X.; Magné, C.; Foggi, G.; Conte, G.; Santin, M.; et al. Nutritional Composition and Bioactivity of Salicornia europaea L. Plants Grown in Monoculture or Intercropped with Tomato Plants in Salt-Affected Soils. Acta Hortic. 2022, 8, 828. [Google Scholar] [CrossRef]
- Barreira, L.; Resek, E.; Rodrigues, M.J.; Rocha, M.I.; Pereira, H.; Bandarra, N.; da Silva, M.M.; Varela, J.; Custódio, L. Halophytes: Gourmet food with nutritional health benefits? J. Food Compos. Anal. 2017, 59, 35–42. [Google Scholar] [CrossRef]
- Winicov, I.; Bastola, D.R. Salt tolerance in crop plants: New approaches through tissue culture and gene regulation. Acta Physiol. Plant. 1997, 19, 435–449. [Google Scholar] [CrossRef]

| A | B | C | |
|---|---|---|---|
| TAN (mg/L) | 0.231 ± 0.032 ab | 0.333 ± 0.081 b | 0.132 ± 0.022 a |
| NO2− (mg/L) | 0.134 ± 0.110 a | 0.331 ± 0.083 b | 0.151 ± 0.024 a |
| NO3− (mg/L) | 141.6 ± 4.8 a | 119.5 ± 7.4 b | 108.5 ± 7.6 b |
| NO3−in (mg/L) | 126.9 ± 6.9 b | 117.9 ± 7.2 ab | 96.9 ± 5.9 a |
| NO3−out (mg/L) | 111.9 ± 5.8 b | 93.1 ± 6.3 ab | 84.6 ± 4.0 a |
| pH | 8.106 ± 0.091 a | 8.207 ± 0.063 a | 8.091 ± 0.071 a |
| A | B | C | |
|---|---|---|---|
| European sea bass | |||
| Initial body weight (IBW, g) | 3.387 ± 0.031 a | 3.385 ± 0.040 a | 3.401 ± 0.041 a |
| Initial body length (IBL, cm) | 7.03 ± 0.05 a | 7.02 ± 0.06 a | 7.02 ± 0.06 a |
| Final body weight (FBW, g) | 15.61 ± 0.12 a | 17.82 ± 0.08 c | 16.57 ± 0.21 b |
| Final body length (FBL, cm) | 15.39 ± 0.09 a | 18.32 ± 0.28 b | 21.70 ± 0.13 c |
| Fulton Factor (K, g/cm3) | 0.991 ± 0.022 a | 0.990 ± 0.021 a | 0.982 ± 0.079 a |
| Weight gain (WG, g) | 12.23 ± 0.12 a | 14.44 ± 0.08 c | 13.18 ± 0.21 b |
| SGR (%/days) | 2.040 ± 0.018 a | 2.216 ± 0.020 c | 2.112 ± 0.029 b |
| Feed conversion ratio (FCR) | 0.916 ± 0.010 c | 0.773 ± 0.009 a | 0.853 ± 0.013 b |
| Protein efficiency ratio (PER) | 2.029 ± 0.022 a | 2.396 ± 0.014 c | 2.188 ± 0.032 b |
| Nitrogen retention (NR, %) | 37.94 ± 0.38 a | 42.91 ± 0.25 b | 43.94 ± 0.71 b |
| Lipid retention (LR, %) | 9.213 ± 0.68 c, b | 2.173 ± 1.253 a | 5.995 ± 0.261 b, a |
| Survival (S, %) | 86.67 ± 0.00 a | 93.33 ± 0.00 b | 84.45 ± 1.11 a |
| Prawns | |||
| Initial prawn weight (IBWp. g) | 1.140 ± 0.051 a | 1.134 ± 0.059 a | 1.209 ± 0.082 a |
| Initial prawn length (IBLp, cm) | 4,46 ± 0.19 a | 4.32 ± 0.16 a | 4.34 ± 0.16 a |
| Final prawn weight (FBWp. g) | 1.548 ± 0.042 a | 1.459 ± 0.061 a | 1.668 ± 0.139 a |
| Final prawn length (FBLp, cm) | 5.22 ± 0.19 b | 4.34 ± 0.15 a | 5.04 ± 0.16 a |
| Prawn Fulton Factor (Kp, g/cm3) | 1.141 ± 0.122 a | 1.856 ± 0.181 b | 1.364 ± 0.194 ab |
| Prawn weight gain (WGp, g) | 0.408 ± 0.020 b | 0.329 ± 0.031 a | 0.458 ± 0.013 b |
| SGRp (%/days) | 0.414 ± 0.018 a | 0.342 ± 0.011 b | 0.415 ± 0.032 a |
| Prawn survival (Sp, %) | 88.89 ± 0.00 a | 88.99 ± 0.00 a | 77.78 ± 0.00 b |
| A | B | C | |
|---|---|---|---|
| Moisture (%) | 73.71 ± 0.52 a | 74.91 ± 0.67 ab | 75.77 ± 0.52 b |
| Protein (%) | 68.12 ± 0.23 a | 70.18 ± 0.35 b | 69.26 ± 0.21 b |
| Lipid (%) | 11.03 ± 0.09 c | 9.56 ± 0.27 a | 10.42 ± 0.03 b |
| Ash (%) | 8.77 ± 0.30 a | 9.21 ± 0.29 ab | 10.51 ± 0.13 b |
| Energy (%) | 22.38 ± 0.05 b | 22.12 ± 0.08 a | 22.43 ± 0.10 b |
| A | B | C | |
|---|---|---|---|
| Initial biomass (IB), g | 5.11 ± 0.49 a | 5.09 ± 0.53 a | 5.11 ± 1.14 a |
| Initial height (IH), cm | 16.34 ± 1.39 a | 16.73 ± 1.24 a | 16.73 ± 1.49 a |
| Initial branches (IBr) | 2.88 ± 0.35 a | 3.00 ± 0.66 a | 2.25 ± 0.27 a |
| Final biomass (FB), g | 9.35 ± 0.99 a | 11.63 ± 1.47 a | 10.60 ± 1.75 a |
| Final height (FH), cm | 23.43 ± 0.91 a | 27.48 ± 1.89 b | 20.48 ± 1.77 a |
| Final branches (FBr) | 5.33 ± 0.21 a | 6.33 ± 0.67 a | 6.00 ± 0.46 a |
| Yield (kg/m2) | 31.82 ± 3.82 a | 42.38 ± 5.66 b | 32.35 ± 6.73 a |
| Photosynthetic pigments | |||
| Chlorophyll A (Chl a), mg/g | 15.20 ± 0.88 ab | 13.99 ± 0.84 a | 18.33 ± 1.05 b |
| Chlorophyll B (Chl b), mg/g | 4.78 ± 0.31 a | 4.62 ± 0.38 a | 5.41 ± 0.44 a |
| Carotenoids, mg/g | 5.03 ± 0.29 a | 5.09 ± 0.37 a | 5.53 ± 0.21 a |
| Chemical composition | |||
| Nitrogen (%) | 16.24 ± 0.13 a | 17.75 ± 0.25 b | 16.65 ± 0.27 a |
| Ash (%) | 13.55 ± 0.15 a | 13.59 ± 0.29 a | 14.64 ± 0.15 b |
| Moisture (%) | 79.31 ± 1.85 a | 85.59 ± 1.52 b | 86.75 ± 0.72 b |
Disclaimer/Publisher’s Note: The statements, opinions and data contained in all publications are solely those of the individual author(s) and contributor(s) and not of MDPI and/or the editor(s). MDPI and/or the editor(s) disclaim responsibility for any injury to people or property resulting from any ideas, methods, instructions or products referred to in the content. |
© 2024 by the authors. Licensee MDPI, Basel, Switzerland. This article is an open access article distributed under the terms and conditions of the Creative Commons Attribution (CC BY) license (https://creativecommons.org/licenses/by/4.0/).
Share and Cite
Mitsopoulos, I.; Papadopoulou, A.; Vlahos, N.; Berillis, P.; Levizou, E.; Mente, E. Mediterranean Aquaponics: Fasting and Refeeding in a Polyculture Aquaponic System. Appl. Sci. 2024, 14, 9829. https://doi.org/10.3390/app14219829
Mitsopoulos I, Papadopoulou A, Vlahos N, Berillis P, Levizou E, Mente E. Mediterranean Aquaponics: Fasting and Refeeding in a Polyculture Aquaponic System. Applied Sciences. 2024; 14(21):9829. https://doi.org/10.3390/app14219829
Chicago/Turabian StyleMitsopoulos, Ioannis, Anastasia Papadopoulou, Nikolaos Vlahos, Panagiotis Berillis, Efi Levizou, and Eleni Mente. 2024. "Mediterranean Aquaponics: Fasting and Refeeding in a Polyculture Aquaponic System" Applied Sciences 14, no. 21: 9829. https://doi.org/10.3390/app14219829
APA StyleMitsopoulos, I., Papadopoulou, A., Vlahos, N., Berillis, P., Levizou, E., & Mente, E. (2024). Mediterranean Aquaponics: Fasting and Refeeding in a Polyculture Aquaponic System. Applied Sciences, 14(21), 9829. https://doi.org/10.3390/app14219829