Abstract
Colorimetric temperature measurement is an essential technique in radiometric thermometry. Traditional colorimetric methods determine temperature by comparing the ratio of radiative energies within two narrow bands at specific wavelengths, effectively mitigating the effects of the emissivity of the measured object and ambient conditions. However, these methods typically approximate integration using area calculations when calculating radiative energy. This article eliminates this approximation and calculates the radiative energy with accurate integration. Based on the principle of monotonicity, this article demonstrates for the first time that when two narrow-band infrared radiations are selected, as long as their wavelength ranges do not overlap, the ratio of radiative energies within these bands maintains a monotonic relationship with the measured temperature. This allows the temperature to be inferred from the energy ratio. Furthermore, this conclusion is extended to arbitrary widths of bands as long as their wavelength ranges do not overlap. Building on this foundation, a thermopile-based colorimetric temperature measurement method for arbitrary bandwidth is proposed. Simulation experiments validate this method, showing that the energy ratio maintains a monotonic relationship with the measured temperature as long as the infrared radiation wavelength ranges absorbed by the thermopile do not overlap. The simulation results are consistent with the mathematical proof.
1. Introduction
Temperature is a crucial parameter that reflects the state of matter, playing a vital role in daily life, industrial production, national defense, military applications, and scientific research. There are two primary categories of temperature measurement methods based on different principles: contact and non-contact. Contact temperature measurement commonly utilizes thermocouples or resistance thermometers [1]. This method is easy to operate and yields results closer to the actual temperature. However, sensors require direct contact with the object, which may disrupt the temperature field of the object and result in slower response time, thereby restricting its applicability to high-temperature or corrosive objects. Non-contact temperature measurement, employing radiation-sensitive sensors, offers advantages such as high accuracy, rapid response time, a wide temperature measurement range, and minimal interference with the object’s temperature field [2]. Non-contact temperature measurement currently relies primarily on radiation thermometry. According to Planck’s radiation law, which calculates radiative temperature, the infrared energy emitted by the object itself reliably assesses the surface temperature of the object [3]. Radiation thermometry techniques mainly include total radiation thermometry, single-wavelength thermometry (brightness thermometry), dual-wavelength thermometry (colorimetric thermometry), and multi-wavelength thermometry. The application of radiation thermometry necessitates considering emissivity, which is influenced by material properties, surface conditions, temperature, and radiation wavelength. Therefore, accurately determining emissivity values presents a significant challenge. Moreover, when measuring the radiative temperature of targets in the atmosphere, atmospheric molecules and aerosol particles impact the absorption and scattering attenuation of target radiation. In addition, the atmosphere emits background radiation, which affects measurement accuracy [4,5,6]. Total radiation thermometry simplifies optical designs, reduces size, and lowers costs. However, this method calculates temperature by measuring the entire band of radiation energy, making it difficult to obtain the total emissivity of different objects across the full spectrum and, consequently, challenging to achieve high accuracy [7]. Single-wavelength thermometry provides a straightforward system structure by detecting radiation within a narrow band. However, it requires the selected bandwidth to be as narrow as possible, which reduces the energy received by the detector and thereby affects measurement accuracy. Additionally, this method is susceptible to factors such as object emissivity and atmospheric attenuation, leading to lower accuracy [8]. Multi-wavelength thermometry provides rich signal information and achieves high measurement accuracy but involves complex processes and higher costs. In addition, strict wavelength selection is necessary, which limits its widespread adoption in radiation thermometry [9,10]. Dual-wavelength thermometry determines temperature by comparing the ratio of radiation energies in two narrow-band wavelength ranges [11]. When these bands are close in wavelength, the degree of radiation energy attenuation is similar, enhancing its immunity to interference compared to total radiation thermometry and single-wavelength thermometry. This method reduces the impact of environmental factors like smoke, dust, vapor, and particles during transmission, while also effectively mitigating the effect of emissivity [12]. As a result, the measured result closely approximates the actual temperature of the object, making it more accurate than brightness temperature and radiance temperature. Especially when the object being measured approaches a grey body, the measured temperature can be considered equivalent to the true temperature. Dual-wavelength thermometry finds widespread application across various temperature measurement fields. However, this method demands intricate optical system design to obtain narrow-band wavelength ranges at specific wavelengths. Additionally, it requires meticulous attention to the infrared detector’s spectral responsivity in the selected narrow-band wavelength ranges, which limits detector selection. Moreover, excessively narrow wavelength bands can cause the detector to receive less energy, which might affect the accuracy of the measurement. A comparison of several radiation thermometry methods is shown in Table 1.

Table 1.
Comparison of several radiation thermometry methods.
This article first introduces the principles of several main radiation thermometry methods and analyzes the advantages and limitations of each method. The remaining structure of the article is as follows: Section 2 explains the temperature measurement principle of traditional colorimetric thermometry. Section 3 uses the monotonicity principle to prove the monotonic relationship between the ratio of radiative energies in two bands and temperature, proposing a thermopile-based colorimetric temperature measurement method for arbitrary bandwidth. Section 4 validates this method through simulation and analyzes the simulation results. Section 5 presents the conclusions of this article.
2. Temperature Measurement Principles
2.1. Planck’s Law
An ideal blackbody, as defined, absorbs all incident energy without any transmission or reflection at any temperature [13]. The radiance of a blackbody, denoted as , is described by Planck’s law, which relates radiance to wavelength and absolute temperature [14]:
in the equation, is the first radiation constant, and is the second radiation constant. At low temperatures and short wavelengths, , which implies . Therefore, Planck’s formula simplifies to Wien’s formula:
2.2. Wien’s Displacement Law
Wien’s displacement law describes the relationship between the wavelength corresponding to the peak of the blackbody radiation curve and the temperature . It is expressed as follows [15]:
According to Planck’s law and Wien’s displacement law, as temperature increases, the peak of the blackbody radiation curve shifts towards shorter wavelengths. Therefore, when the ratio of radiance at two wavelengths changes, the corresponding temperature value also changes.
2.3. Principle of Colorimetric Temperature Measurement
In reality, ideal blackbodies are nearly non-existent [16]. Therefore, it is necessary to introduce an emissivity coefficient , which varies with material properties and surface conditions, known as spectral emissivity. The radiance emitted by a real object is given by:
Colorimetric temperature measurement determines temperature by comparing the ratio of radiative energies in two narrow-band wavelength ranges of the object being measured. Assuming the selected wavelengths are and , and the widths of the two narrow-band ranges are and respectively, the radiative energies and in these two bands are given by:
Since the wavelength bands are narrow, the integral regions can be approximated by rectangles. Therefore, Equation (5) can be approximated as:
The ratio of radiative energies is given by:
Taking the logarithm of both sides of Equation (7), we obtain:
When using colorimetric temperature measurement, it is typically assumed that the object being measured is a grey body, which means . Therefore, the colorimetric temperature can be calculated using Equation (9):
3. Mathematical Proof of Temperature Measurement Methods
3.1. Relationship Between Ratio of Radiative Energies Within Two Bands and Temperature
Traditional colorimetric temperature measurement selects two narrow-band wavelength ranges at two specific wavelengths and calculates the measured temperature using the ratio of radiative energies within these bands. However, when calculating the radiative energy within each band, the conventional approach approximates the definite integral as the area of a rectangle, as shown in Equation (6). This article avoids such approximations and calculates the radiative energies within the two narrow bands using Equation (5). It proves the strictly monotonic relationship between the ratio of radiative energies and temperature through derivation. The following is the proof of the strict monotonicity of with respect to :
According to the monotonicity principle, for any function , if it is continuous on and differentiable on , then if within , then the function is strictly increasing on . Similarly, if within , the function is strictly decreasing on . Therefore, demonstrating that the sign of is unique establishes the strict monotonicity of with respect to .
Before thermopiles receive the radiative energy from the measured object, they are affected by the spectral absorption characteristics of absorbing media, such as air impurities, during the transmission process, resulting in a certain degree of energy attenuation. The attenuation function of the radiance emitted during transmission through a medium is denoted as , Where represents the wavelength, represents the ambient temperature, and represents the ambient humidity. In this study, the primary variables under discussion are wavelength and temperature, while humidity is considered constant. Considering the spectral absorption characteristics of the absorbing medium, and in conjunction with Equation (4) (assuming the object being measured is a grey body), the radiance emitted by the object is:
in the equation, . Substituting Equation (10) into Equation (5), we obtain the radiative energies and within the two narrow-band wavelength ranges as follows:
in the equation, , , , . Therefore, the ratio of radiative energies is given by:
Taking the logarithm of both sides of Equation (12), we obtain:
Taking the derivative of both sides of Equation (13) with respect to , we obtain:
in the equation,
clearly , , , therefore, according to Equation (14), the sign of is determined solely by .
Then discuss from Equation (14) individually:
in the equation, the integration range , because , the sign of is determined solely by . When is satisfied, . When is satisfied, . Therefore, when the wavelength ranges and do not overlap, the sign of is uniquely determined. Consequently, the sign of is uniquely determined, implying that the sign of is also uniquely determined.
since , combined with Equation (17), it is known that when the wavelength ranges of the narrow bands and do not overlap, specifically when and do not overlap, the sign of is uniquely determined, indicating that is strictly monotonic with respect to .
Based on this conclusion, we can further extend it to two arbitrarily wide bands. Regardless of their specific widths, as long as their wavelength ranges do not overlap, the ratio of radiation energies within these bands and the measured temperature exhibit a strictly monotonic relationship.
3.2. Thermopile-Based Colorimetric Thermometry with Arbitrary Bandwidth
Thermopile sensors operate based on the Seebeck effect and infrared radiation principles. They convert the absorption of infrared radiation into thermal energy through the photothermal effect, detecting changes in resistance or electric potential to achieve accurate and efficient infrared sensing [17]. They are characterized by their broad absorption of infrared radiation wavelength, compact size, high sensitivity, no need for cooling, and low detection costs [18].
Building upon the established monotonicity, considering the many advantages of thermopiles as detectors for infrared radiation, this article extends the traditional colorimetric thermometry to propose an arbitrary bandwidth colorimetric thermometry based on thermopiles. This method employs thermopiles as infrared detectors, enabling the selection of infrared bands of any width rather than being confined to narrow bands at specific wavelengths. The thermopiles absorb infrared radiation within two selected bands and convert the received energies into two voltage or current signals. The temperature of the measured object can be determined by comparing the ratio of these signals. As long as the ratio of the electrical signals remains strictly monotonic with respect to , the output ratio of electrical signals directly yields a uniquely determined temperature value. By calibrating with a standard radiation source (such as a blackbody furnace), the relationship curve between the thermopile electrical signal ratio and the measured temperature can be fitted. Ultimately, the temperature of the measured object can be determined based on the output electrical signal ratio. Here is the proof that is strictly monotonic with respect to :
Combining Equation (11), we can obtain the electric signals and generated by two thermopiles absorbing infrared radiation within two different spectral bands:
in the equation, , , where and denote the spectral transmittances of the optical filters for two thermopiles, and and represent the responsivities of the respective thermopiles. Additionally, , , as well as , , correspond to the lower and upper wavelength limits of the infrared radiation bands absorbed by these thermopiles, furthermore, it holds that , .
The ratio between the two electric signals is given by:
Applying the same procedure as in Equation (12) to Equation (19), we eventually obtain:
in the equation,
clearly, , , , thereby according to Equation (20), the sign of is determined solely by .
Discussing from Equation (20) individually:
observing Equation (22), it is evident that the sign of is also determined solely by . Therefore, when the wavelength ranges of and do not overlap, with respect to is strictly monotonic. This means that regardless of the widths of the infrared bands absorbed by the two thermopiles, as long as the wavelength ranges of these bands do not overlap, the ratio of the electric signals with respect to is strictly monotonic. The temperature can be determined by using the ratio of electrical signals and the temperature relationship curve calibrated with a blackbody furnace. This method is based on the principle of colorimetric thermometry and allows for temperature measurement even when the spectral emissivity of the object is unknown. This method effectively reduces the impact of atmospheric media and background radiation on measurement results. In addition, compared to traditional narrow-band colorimetric thermometry, it utilizes thermopiles as infrared detectors, significantly lowering costs. Moreover, it covers a wider range of absorption bands, providing richer spectral information. It does not require expensive optical systems with complex manufacturing processes, thereby reducing the size of the temperature measurement system.
4. Simulation Results and Discussion
4.1. Simulation Based on Thermopile Product Parameters
Firstly, several thermopiles from well-known manufacturers are selected for simulation. The selected thermopiles and their parameters are as follows:
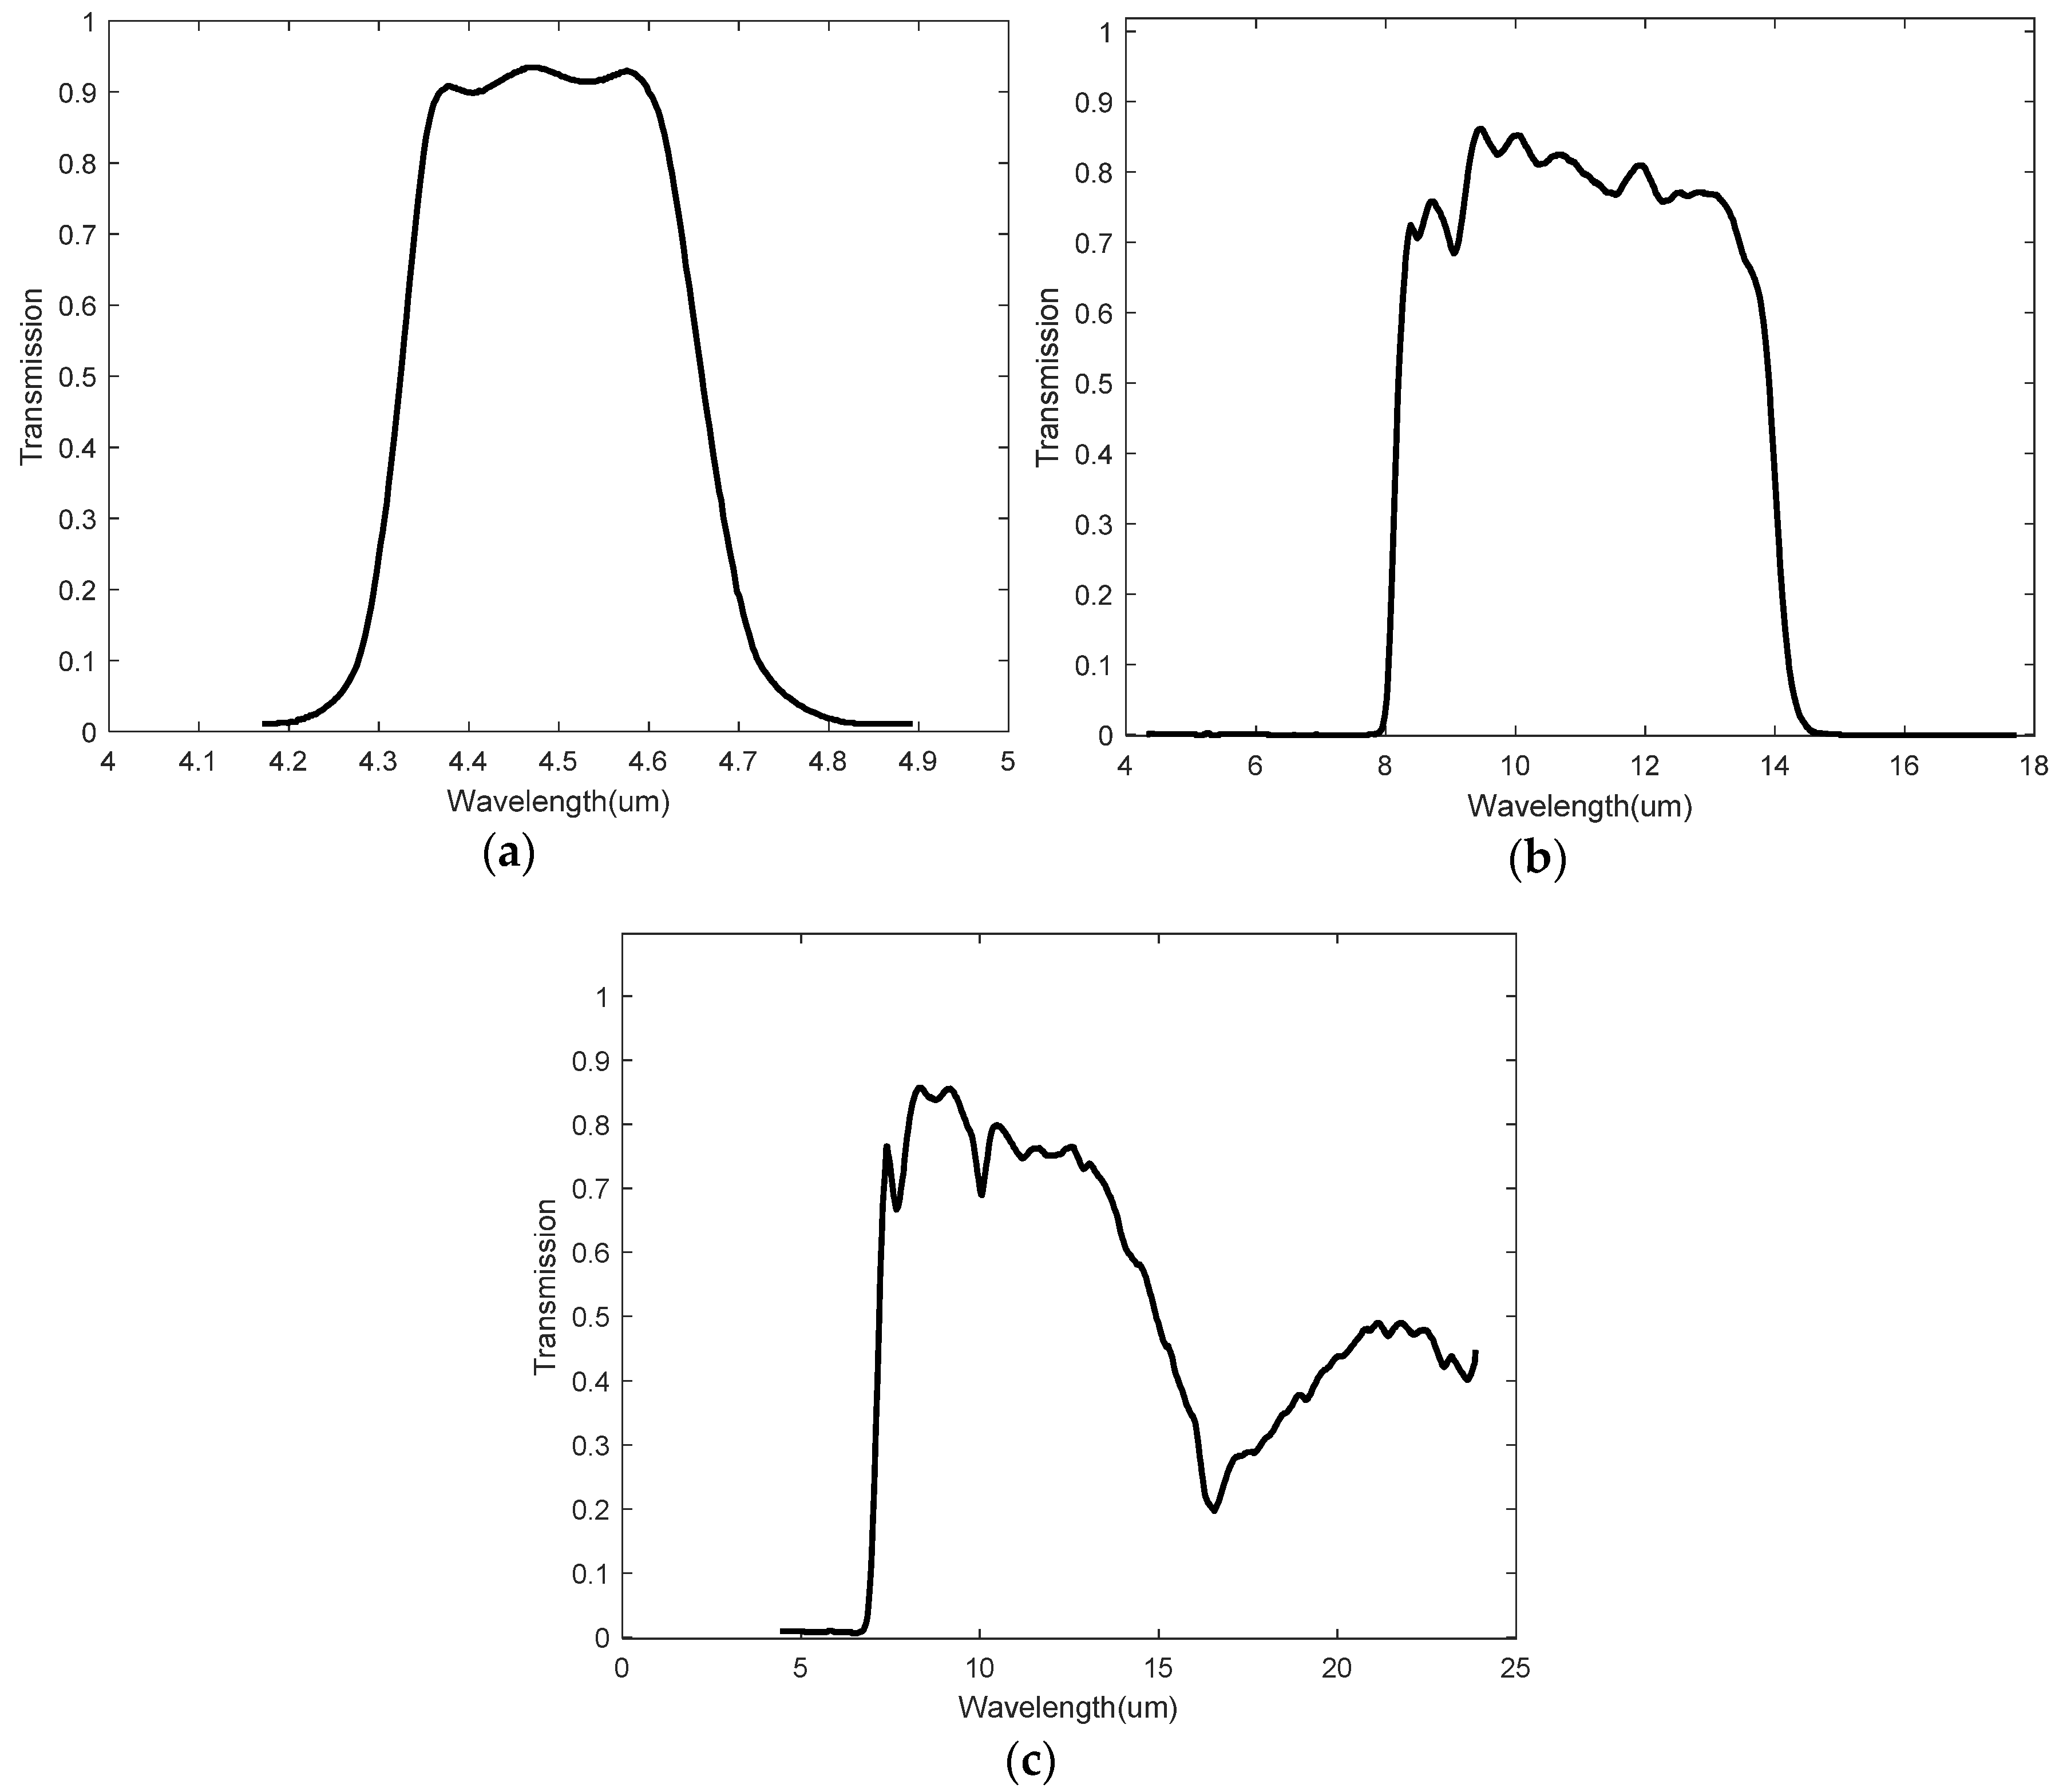
- Hamamatsu T15770 (Hamamatsu Photonics, Hamamatsu, Japan): responsivity of 50 V/W. The spectral transmittance of the optical filter is shown in Figure 1a, with a passband wavelength range of 4.2~4.9 μm [19];
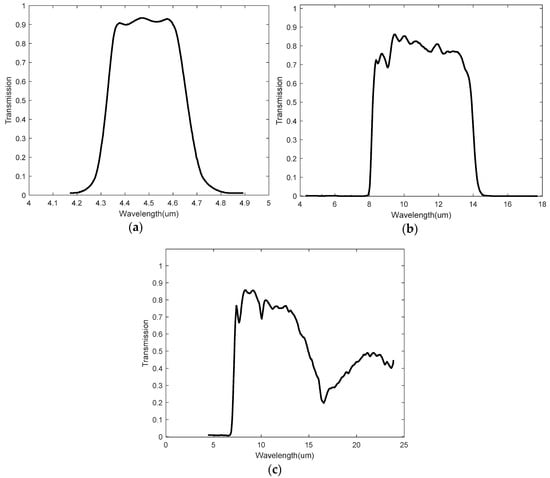 Figure 1. Thermopile spectral transmittances. (a) Spectral transmittance of T15770; (b) spectral transmittance of TS318-1B0814; and (c) spectral transmittance of TS305-11C55.
 - TE TS318-1B0814 (TE Connectivity, Schaffhausen, Switzerland): responsivity of 50 V/W. The spectral transmittance of the optical filter is shown in Figure 1b, with a passband wavelength range of 7.5~15 μm [20];
- TE TS305-11C55 (TE Connectivity, Schaffhausen, Switzerland): responsivity of 84 V/W. The spectral transmittance of the optical filter is shown in Figure 1c. Although the manufacturer does not provide the transmittance curve for wavelength greater than 25 μm, this does not affect the simulation results. It is assumed that the passband wavelength range is 6~25 μm [20].
Using MATLAB R2022b (9.13.0.2049777) for simulation, the aim is to derive the relationship curve for the electric signal ratio and temperature . The specific simulation steps are as follows:
- Import the spectral transmittance curves of the two selected thermopiles into MATLAB, convert them to binary format, and extract the raw data of the curves from the binary images for further processing and saving;
- Import the responsivity data of the two selected thermopiles and the raw data of the spectral transmittance curves obtained in step 1 into MATLAB. Integrate them according to Equation (18). For each temperature value , compute and . Then, using Equation (19), calculate the electric signal ratio at the current temperature ;
- Within the range of 273~1000 K, obtain a value at regular step intervals and repeat step 2. This will yield a value for each corresponding value, ultimately resulting in the relationship curve.
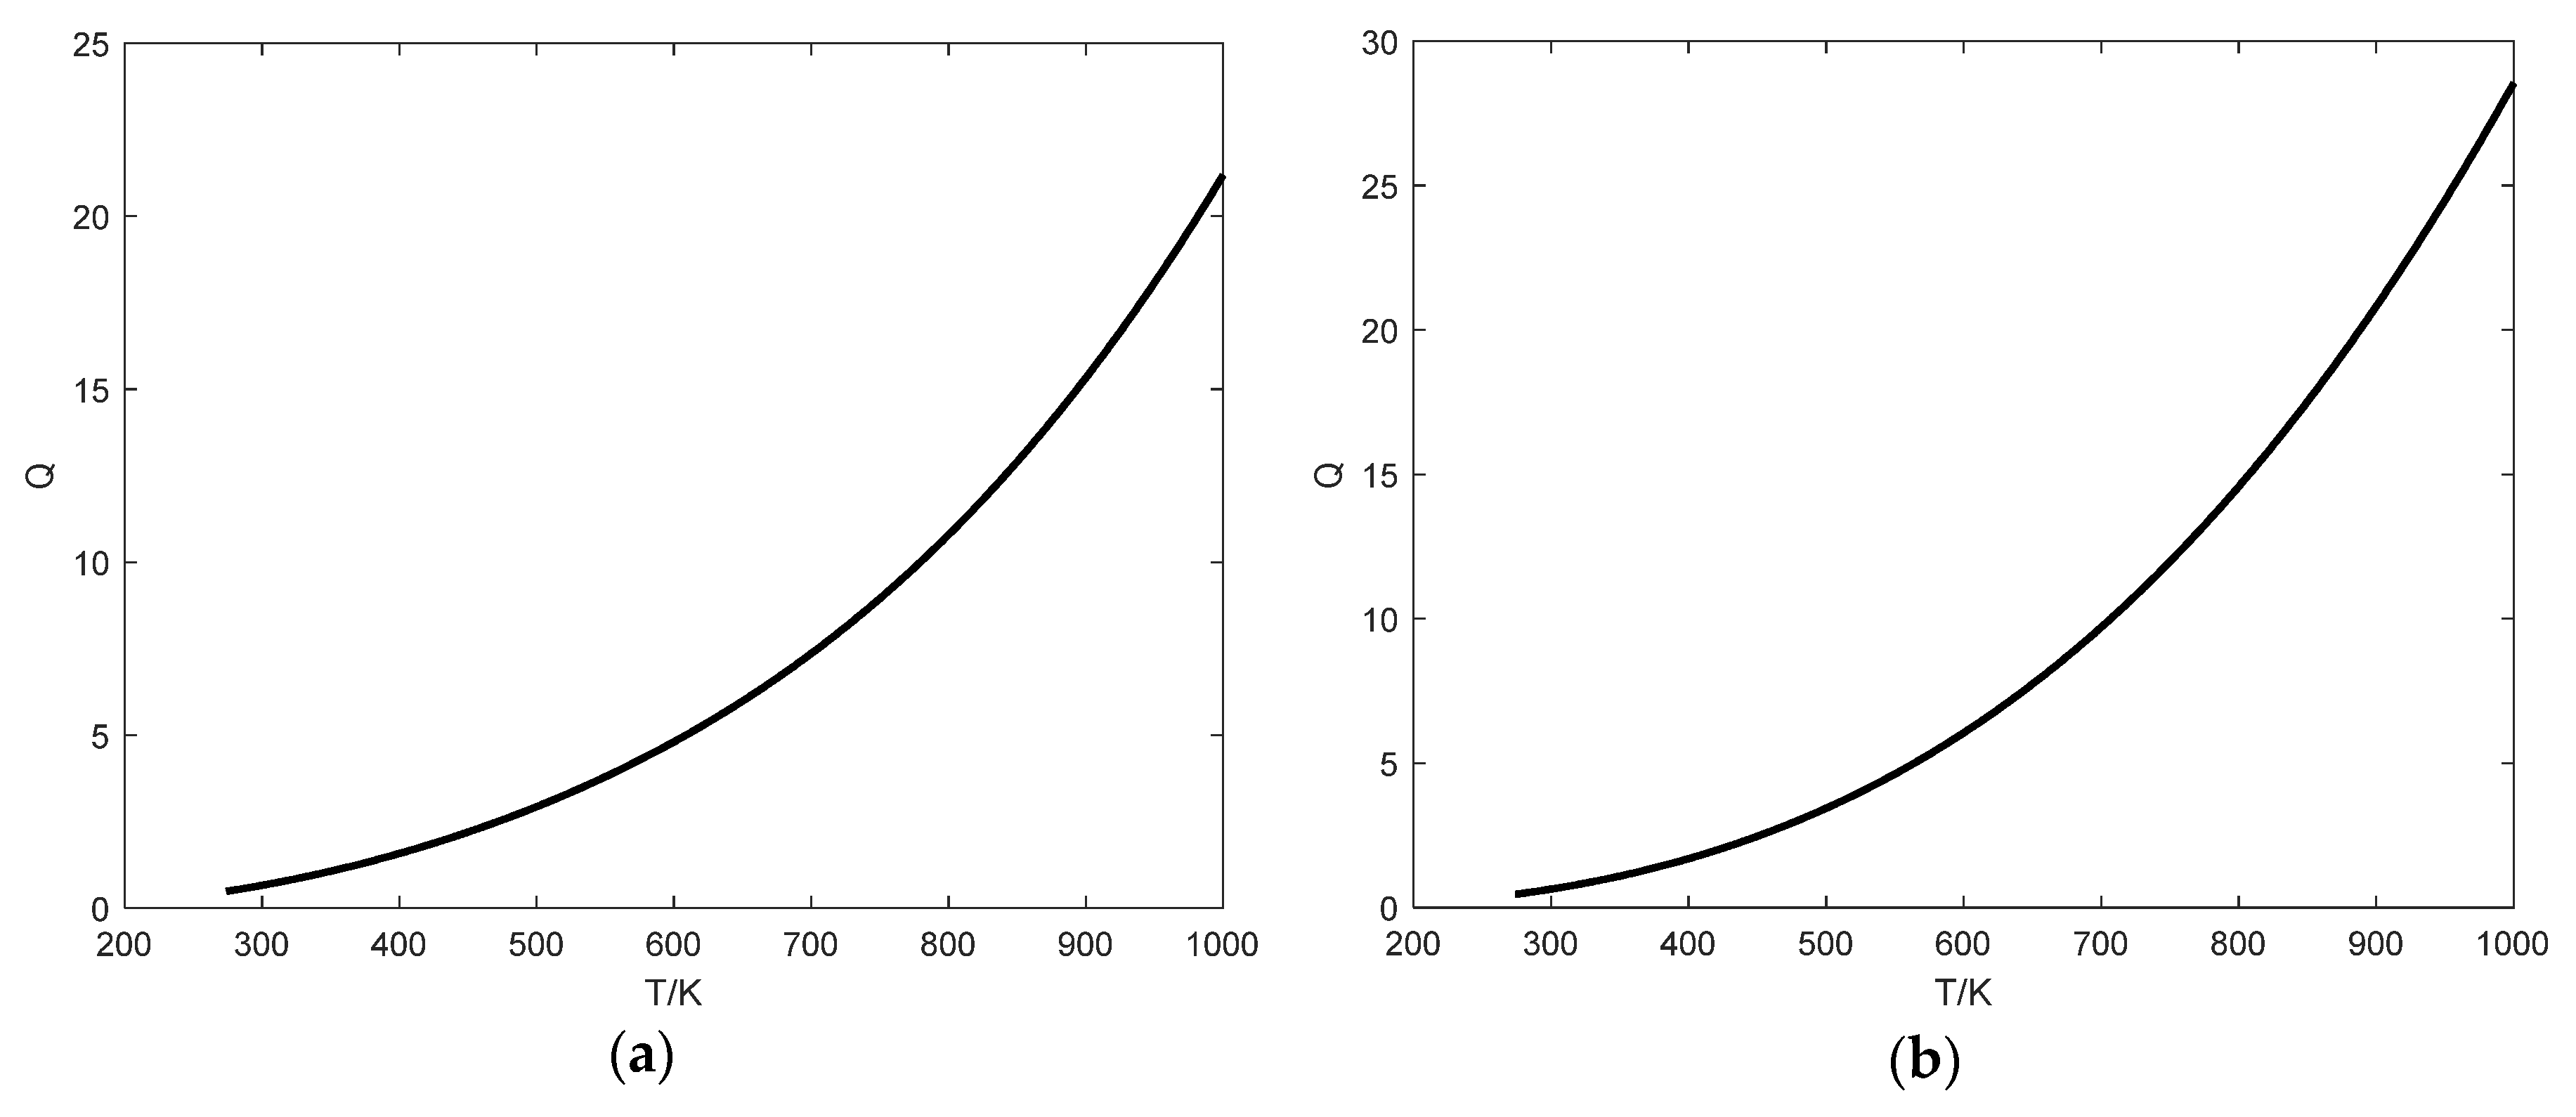
First, T15770 and TS318-1B0814 are selected for simulation. The wavelength ranges of the infrared bands absorbed by these two thermopiles do not overlap. The relationship curve obtained from the simulation is shown in Figure 2a. Next, TS318-1B0814 and TS305-11C55 are selected for simulation. The wavelength ranges of the infrared bands absorbed by these two thermopiles do overlap. The resulting relationship curve is shown in Figure 2b.
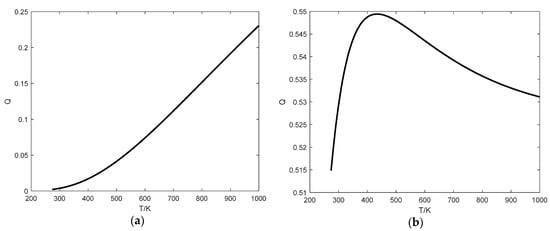
Figure 2.
Relationship curves. (a) relationship curve using T15770 and TS318-1B0814; (b) relationship curve using TS318-1B0814 and TS305-11C55.
According to the results shown in Figure 2, when the wavelength ranges of the infrared bands absorbed by the selected thermopiles do not overlap, there is a strictly monotonic relationship between temperature and the electric signal ratio . This allows for temperature measurement based on the output value. However, when the wavelength ranges of the infrared bands absorbed by the selected thermopiles do overlap, the relationship between temperature and the electric signal ratio is not strictly monotonic. In this case, a single value corresponds to two different values, making it impossible to determine the temperature solely based on the electric signal ratio. The simulation results are consistent with the mathematical proof.
4.2. Simulation Based on Randomly Generated Spectral Transmittance and Responsivity of Thermopiles
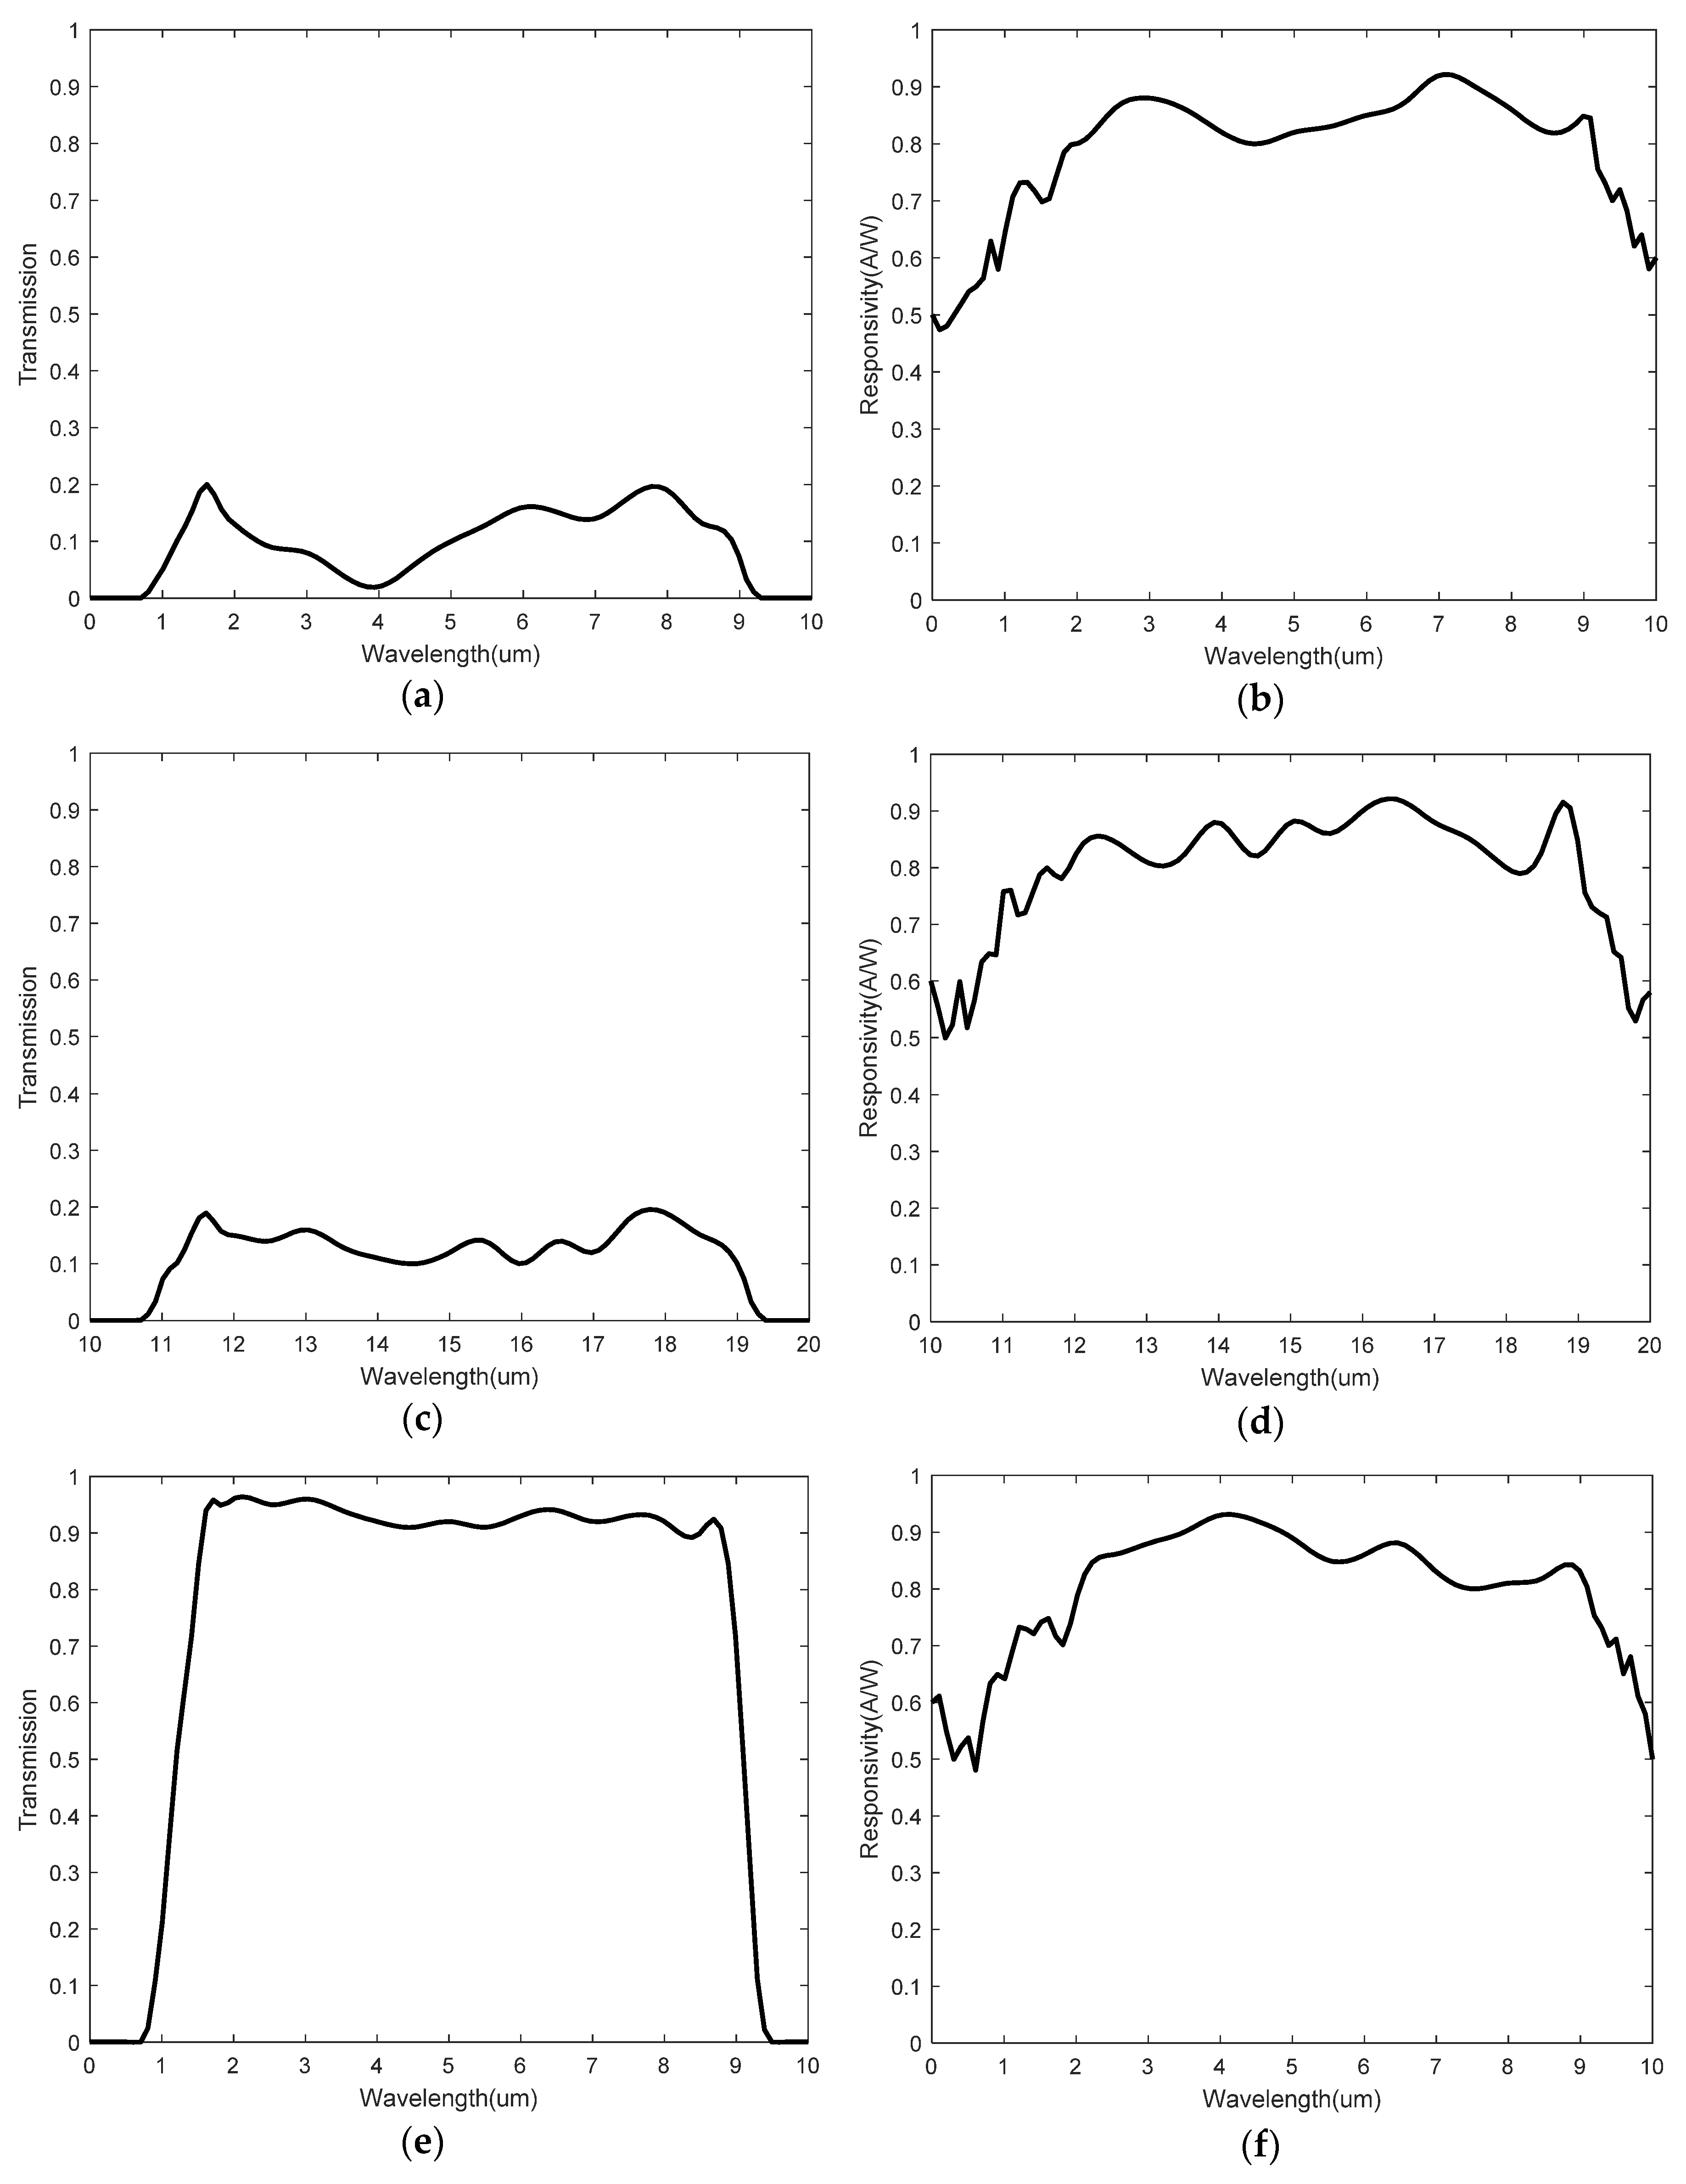
To validate the relationship between the ratio of thermopile electrical signals and the temperature of the measured object under extreme conditions of very high and very low spectral transmittance, as well as to enhance the randomness of the simulation conditions and the generalizability of the results, we artificially generated spectral transmittance and responsivity data for four thermopiles. Using MATLAB, the responsivity images and spectral transmittance images of four thermopiles are randomly generated. These images are shown in Figure 3. The thermopiles are numbered for descriptive purposes.
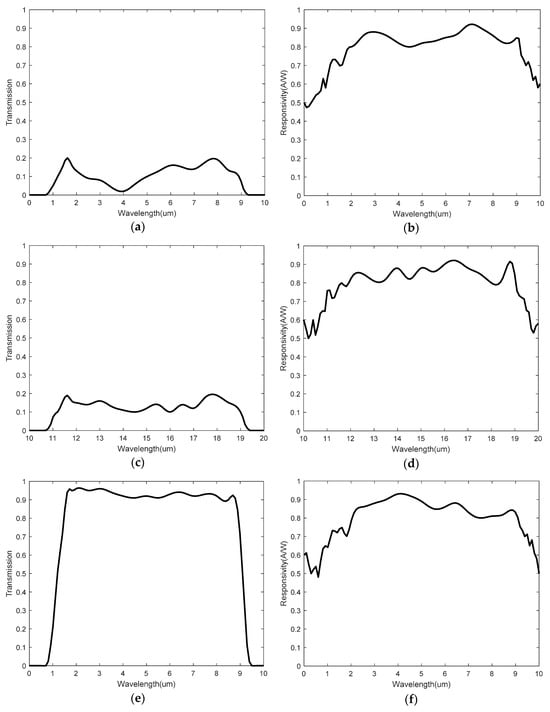
Figure 3.
Spectral transmittances and responsivities of thermopiles. (a) Spectral transmittance of thermopile 1; (b) responsivity of thermopile 1; (c) spectral transmittance of thermopile 2; (d) responsivity of thermopile 2; (e) spectral transmittance of thermopile 3; (f) responsivity of thermopile 3; (g) spectral transmittance of thermopile 4; (h) responsivity of thermopile 4.
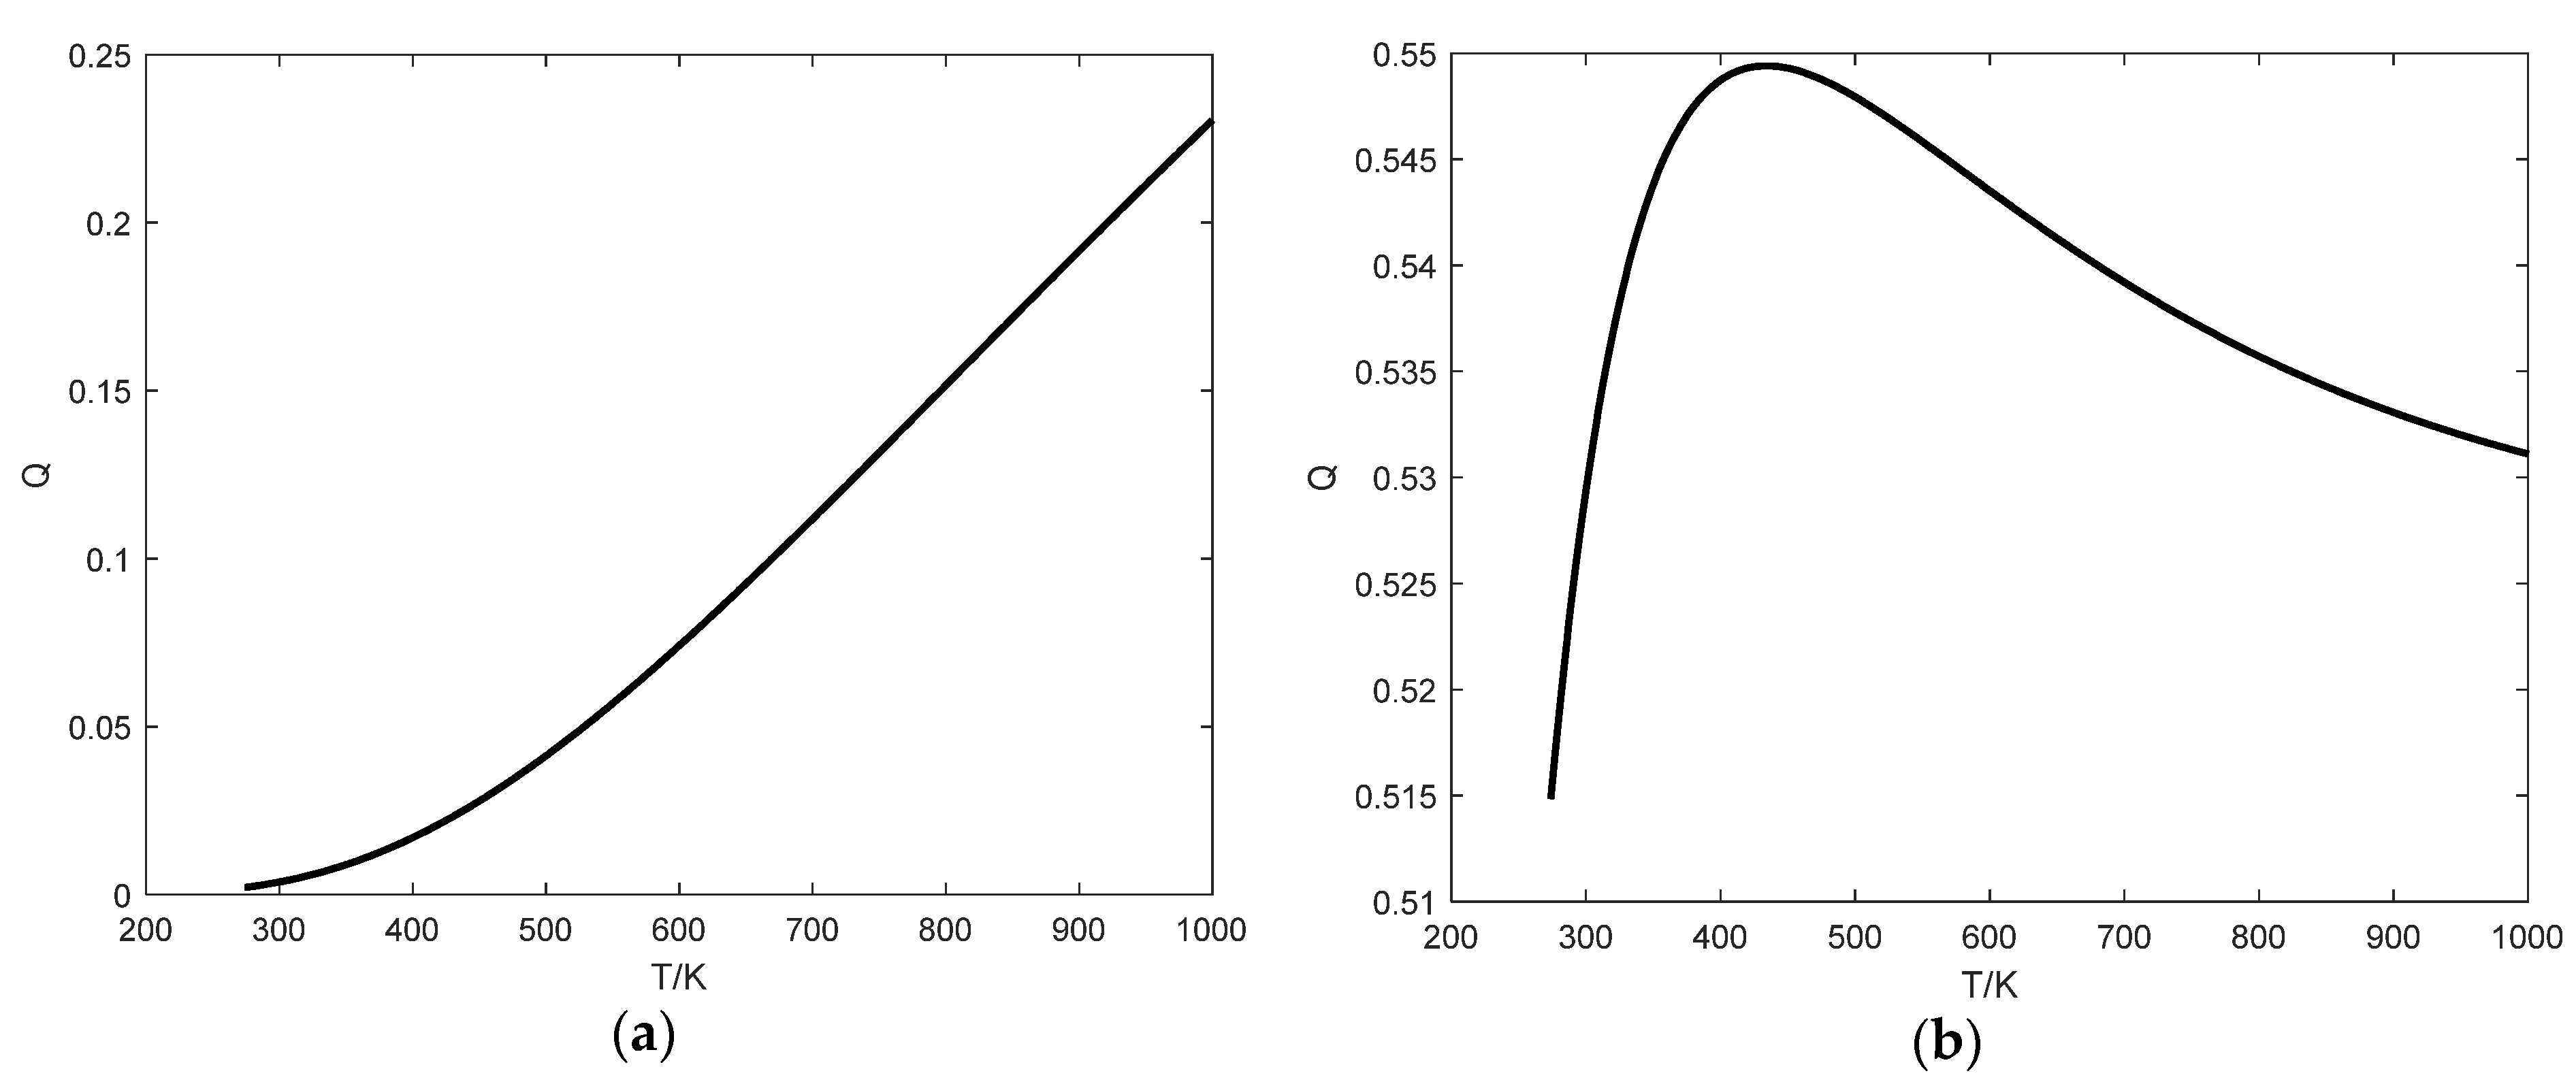
From Figure 3a,c,e,g, we can see that the passband wavelength ranges for thermopile 1 and thermopile 3 are 0 μm~10 μm, while for thermopile 2 and thermopile 4, those are 10 μm~20 μm. The spectral transmittances of thermopile 1 and thermopile 2 are less than 0.2, while those of thermopile 3 and thermopile 4 are greater than 0.9. The wavelength ranges of the infrared bands absorbed by thermopile 1 and thermopile 2 do not overlap. Simulation is conducted using thermopile 1 and thermopile 2 to test the result when the spectral transmittances of the two thermopiles are below 0.2. The simulation result is shown in Figure 4a. Similarly, the wavelength ranges of the infrared bands absorbed by thermopile 3 and thermopile 4 do not overlap. Simulation is conducted using thermopile 3 and thermopile 4 to test the result when the spectral transmittances of the two thermopiles are above 0.9. The simulation result is shown in Figure 4b.
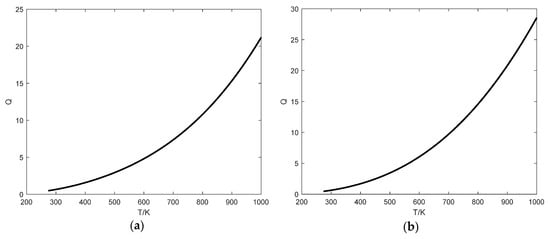
Figure 4.
Relationship curves. (a) relationship curve using thermopile 1 and thermopile 2; (b) relationship curve using thermopile 3 and thermopile 4.
Based on Figure 4, it is evident that as long as the wavelength ranges of the infrared bands absorbed by two thermopiles do not overlap, there remains a strictly monotonic relationship between temperature and the electric signal ratio . This relationship holds even when the spectral transmittances of two thermopiles are below 0.2 or above 0.9. Therefore, temperature measurement can still be effectively performed using the thermopile-based arbitrary bandwidth colorimetric thermometry method.
5. Conclusions
This study has demonstrated that when the wavelength ranges of two arbitrarily wide infrared bands do not overlap, there exists a monotonic relationship between the ratio of radiative energies within these bands and the temperature of the object being measured. This relationship allows for the determination of the object’s temperature based on the energy ratio. Building upon this finding, the study proposes a thermopile-based arbitrary bandwidth colorimetric thermometry method for the first time. Simulation experiments are conducted to validate this method. The simulation results indicate that when the wavelength ranges of the two bands do not overlap, there is a monotonic relationship between the electric signal ratio and the measured temperature, making this method suitable for temperature measurement. However, when the wavelength ranges overlap, the electric signal ratio may exhibit non-monotonic behavior with respect to temperature, making it impossible to determine the temperature of the object. The thermopile-based arbitrary bandwidth colorimetric thermometry method enables temperature measurement even when the emissivity of the measured object is unknown. Additionally, it offers advantages such as wide absorption band coverage and low measurement costs, presenting promising applications in various fields.
Author Contributions
Conceptualization, Q.J. and G.D.; methodology, Q.J.; software, Q.J.; validation, Q.J., Y.M. and G.D.; formal analysis, Q.J.; investigation, Y.M.; resources, G.D.; data curation, K.W.; writing—original draft preparation, Q.J.; writing—review and editing, G.D. and X.C.; visualization, Q.J.; supervision, X.C.; project administration, G.D. and X.C.; funding acquisition, X.C. All authors have read and agreed to the published version of the manuscript.
Funding
This research is supported by the National Key Research and Development Plan (Grant No. 2021YFB3203104).
Institutional Review Board Statement
Not applicable.
Informed Consent Statement
Not applicable.
Data Availability Statement
The original contributions presented in the study are included in the article, further inquiries can be directed to the corresponding author.
Conflicts of Interest
The authors declare no conflicts of interest.
References
- Sultan, M.A. Fire Resistance Furnace Temperature Measurements: Plate Thermometers vs. Shielded Thermocouples. Fire Technol. 2006, 42, 253–267. [Google Scholar] [CrossRef]
- Muller, M.; Budde, W.; Gottfried-Gottfried, R.; Hubel, A.; Jahne, R.; Kuck, H. A thermoelectric infrared radiation sensor with monolithically integrated amplifier stage and temperature sensor. Sens. Actuators A-Phys. 1996, 54, 601–605. [Google Scholar] [CrossRef]
- Zhu, J.; Wang, B.T.; Sun, C.; Ding, M. Ultrahigh-Temperature Measurements Based on Reflected Radiation Error Correction. IEEE Trans. Instrum. Meas. 2024, 73, 1–7. [Google Scholar] [CrossRef]
- Shen, J.L.; Zhang, Y.C.; Xing, T.T. The study on the measurement accuracy of non-steady state temperature field under different emissivity using infrared thermal image. Infrared Phys. Technol. 2018, 94, 207–213. [Google Scholar] [CrossRef]
- Zhang, C.; Gauthier, E.; Pocheau, C.; Balorin, C.; Pascal, J.Y.; Jouve, M.; Aumeunier, M.H.; Courtois, X.; Loarer, T.; Houry, M. Surface temperature measurement of the plasma facing components with the multi-spectral infrared thermography diagnostics in tokamaks. Infrared Phys. Technol. 2017, 81, 215–222. [Google Scholar] [CrossRef]
- King, J.L.; Jo, H.J.; Loyalka, S.K.; Tompson, R.V.; Sridharan, K. Computation of total hemispherical emissivty from directional spectral models. Int. J. Heat Mass Transf. 2017, 109, 894–906. [Google Scholar] [CrossRef]
- Gulyaev, I.P.; Dolmatov, A.V. Spectral-brightness pyrometry: Radiometric measurements of non-uniform temperature distributions. Int. J. Heat Mass Transf. 2018, 116, 1016–1025. [Google Scholar] [CrossRef]
- Muller, M.; Fabbro, R.; El-Rabii, H.; Hirano, K. Temperature measurement of laser heated metals in highly oxidizing environment using 2D single-band and spectral pyrometry. J. Laser Appl. 2012, 24, 022006. [Google Scholar] [CrossRef]
- Liu, H.; Zheng, S. Measurement of temperature and wavelength-dependent emissivity distributions using multi-wavelength radiation thermometry. Opt. Commun. 2020, 472, 125895. [Google Scholar] [CrossRef]
- Xing, J.; Cui, S.; Qi, W.; Zhang, F.; Sun, X.; Sun, W. A data processing algorithm for multi-wavelength pyrometry-which does not need to assume the emissivity model in advance. Meas. J. Int. Meas. Confed. 2015, 67, 92–98. [Google Scholar] [CrossRef]
- Wang, B.T.; Niu, Y.X.; Yang, Y.; Liang, T.; Qin, X.D.; Ding, M. Sapphire Fiber High-Temperature Sensor Based on Colorimetric Method. IEEE Trans. Instrum. Meas. 2022, 71, 1–6. [Google Scholar] [CrossRef]
- Zhao, J.; Liu, Z.; Wang, B.; Hua, Y.; Wang, Q. Cutting temperature measurement using an improved two-color infrared thermometer in turning Inconel 718 with whisker-reinforced ceramic tools. Ceram. Int. 2018, 44, 19002–19007. [Google Scholar] [CrossRef]
- Guzmán, V. A geometric description of blackbody-like systems in thermodynamic equilibrium. J. Geom. Phys. 2018, 131, 246–250. [Google Scholar] [CrossRef]
- Shu, S.; Wang, Z.; Yang, Z.; Zhang, Y.; Chen, M.; Tao, X.; Liu, C. Emissivity measurement of tungsten based on a double-wavelength infrared thermometer between 140 and 500 °C. Infrared Phys. Technol. 2021, 116, 103801. [Google Scholar] [CrossRef]
- Stewart, S.M. Spectral Peaks and Wien’s Displacement Law. J. Thermophys. Heat Transf. 2012, 26, 689–692. [Google Scholar] [CrossRef]
- Zhao, Y.; Wang, J.; He, Y. Development and characterization of a high-emissivity reference blackbody radiation source with V-grooves and large aperture at low-temperature. Infrared Phys. Technol. 2023, 133, 104862. [Google Scholar] [CrossRef]
- Shen, N.; Yu, J.; Tang, Z. An Uncooled Infrared Microbolometer Array for Low-Cost Applications. IEEE Photonics Technol. Lett. 2015, 27, 1247–1249. [Google Scholar] [CrossRef]
- Graf, A.; Arndt, M.; Sauer, M.; Gerlach, G. Review of micromachined thermopiles for infrared detection. Meas. Sci. Technol. 2007, 18, R59–R75. [Google Scholar] [CrossRef]
- Technical Manual for Hamamatsu T15770 Thermopile. Available online: https://www.hamamatsu.com.cn/cn/zh-cn/product/optical-sensors/infrared-detector/thermopile-detector/T15770.html (accessed on 28 June 2024).
- Technical Manual for TE connectivity TS318-1B0814 and TS305-11C55 Thermopiles. Available online: https://www.te.com.cn/commerce/DocumentDelivery/DDEController?Action=showdoc&DocId=Data+Sheet%7FTS3XX-Series%7FA%7Fpdf%7FEnglish%7FENG_DS_TS3XX-Series_A.pdf%7FCAT-IR0001 (accessed on 28 June 2024).

Disclaimer/Publisher’s Note: The statements, opinions and data contained in all publications are solely those of the individual author(s) and contributor(s) and not of MDPI and/or the editor(s). MDPI and/or the editor(s) disclaim responsibility for any injury to people or property resulting from any ideas, methods, instructions or products referred to in the content. |
© 2024 by the authors. Licensee MDPI, Basel, Switzerland. This article is an open access article distributed under the terms and conditions of the Creative Commons Attribution (CC BY) license (https://creativecommons.org/licenses/by/4.0/).