1. Introduction
Annular pressure buildup is caused by fluid expansion due to temperature rise, which in turn leads to an increase in pressure in the annular space between the layers of the casing [
1,
2,
3]. For onshore and shallow water wells, annular pressure buildup can be reduced by wellhead pressure relief. However, for deepwater wells where the wellhead is located underwater, the annular pressure cannot be released or reduced [
4,
5]. Therefore, the accurate prediction of annular pressure buildup is crucial for the casing design and safe production of deepwater oil and gas wells [
6,
7,
8].
After several hours of production in Well A-2 of the Marlin Oilfield in the Gulf of Mexico, the high-temperature fluid caused the annular pressure to rise, resulting in the collapse of the production casing [
9,
10,
11,
12]. During the drilling of Well Pompano A-31 in the Gulf of Mexico, the high circulating temperature of the drilling fluid caused the high annular pressure, resulting in the collapse of the 16″casing [
13,
14].
A. Adams [
15] studied the design and strength analysis of multi-layer tubing-casing and proposed the use of SLA (Service Life Analysis) based on the wellbore string system to check the overall loading of wellbore strings. The method takes into account the additional loads generated by the thermal expansion of annular fluid for the first time. M.A. Goodman [
16] applied the SLA casing design method to study and analyze the casing strength of HPHT wells in the field. A.S. Halal and R.F. Mitchell [
17] took into account the fluid nonlinear PTV relationship and elastic deformation of the casing and performed a rigorous mathematical derivation. Lubinski [
18] proposed that the annular pressure buildup is important to the wellbore. The thermal expansion of confined annulus fluid can cause packer leakage, and a high wellbore profile temperature can cause tubing bending. Klementich [
19] and Adams [
15], respectively, proposed that the annular fluids generate annular pressure buildup through being heated. Oudeman [
20] proposed that the annular pressure buildup is mainly caused by the thermal expansion/compression characteristics of the fluid trapped in the annulus, the deformation of the casing, and the migration of the fluid into the annulus, and established a calculation model for annular pressure buildup. In previous studies, only the impact of casing-free section deformation on annular pressure buildup was investigated. However, the impact of casing sealing section deformation on annular pressure buildup has not been studied [
21,
22,
23,
24,
25]. B. Moe [
26] simplified the calculation of casing deformation in the PVT equation and gave suggestions on how to prevent annular pressure. In 2006, Deng Yuanzhou [
27] proposed an iterative model to predict annular pressure. Considering the coupling effect of annular pressure and volume, the calculation result of the iterative method is 10% smaller than that of the traditional method, mainly due to the influence of annular volume change. Huang Xiaolong et al. [
28] established a calculation model of annulus pressure by using the plane strain equation and analyzed the influences of reservoir temperature, bottom-hole temperature, fluid properties, production flow rate, and well mechanism on annulus pressure buildup model for the wellbore–reservoir system. The annular temperature calculated by this model was more accurate than that calculated by the traditional semistable method. In 2009 and 2010, A.R. Hasan [
23] proposed two models, semi-steady state and transient, to calculate the annular pressure in the production process, in which the thermal expansion of the fluid and the leakage effect of the fluid were strictly considered.
In order to illustrate the influence of casing sealing section deformation on annular pressure buildup, in this paper, a coordination deformation model of casing-cement sheath-formation was established, and then a new multi-string annular pressure buildup model was proposed. The influence of casing sealing section deformation on annular pressure was analyzed. The results show that the error of the annular pressure buildup model established in this paper, which considers the deformation of the sealed casing, is about 13% lower than that predicted without considering this factor and is closer to the measured value in the field. This study has important practical significance for guiding the casing string design and safety production of deepwater oil and gas wells.
2. Source and Formation Mechanism of Annular Pressure
2.1. Thermally Induced Annular Pressure
At present, the sources that cause the increase in annular pressure between casing mainly include the following three categories:
- (1)
Sustained Casing Pressure
Sustained casing pressure refers to the pressure phenomenon that persists in the casing annulus after the wellhead is relieved through the blowout valve. According to the statistics of the U.S. Department of Mines, sustained casing pressure mainly exists in the jacket annulus, which is mainly caused by casing leakage, packer failure, and poor cementing quality. Once sustained casing pressure is created, it is usually necessary to replace the oil casing to eliminate that part of the annular pressure;
- (2)
Operator-Imposed Pressure
The annulus pressure rise caused by operation and construction mainly comes from special production processes, such as gas lifting, heavy oil thermal recovery, and annulus pressure monitoring and pressure test measures. Therefore, the management of this part of annulus pressure needs to select appropriate process technology and manage it in accordance with relevant company standards;
- (3)
Thermally Induced Pressure
Due to the relatively high temperature of the oil and gas extracted from the formation, the high-temperature laminar flow will continue to lose heat to the low-temperature medium around the wellbore during the upward migration along the wellbore, which causes the thermal expansion of the closed fluid medium in the casing and forms the trap pressure. This part of pressure is common in the development of deep-water, high-temperature oil and gas fields. Because pressure relief cannot be achieved through the wellhead, casing collapse accidents caused by annular thermal effect are prone to occur in the initial stage of production, threatening wellbore safety and integrity. In this paper, the annular pressure caused by the thermal effect is studied and analyzed.
2.2. Formation Mechanism of Annular Pressure
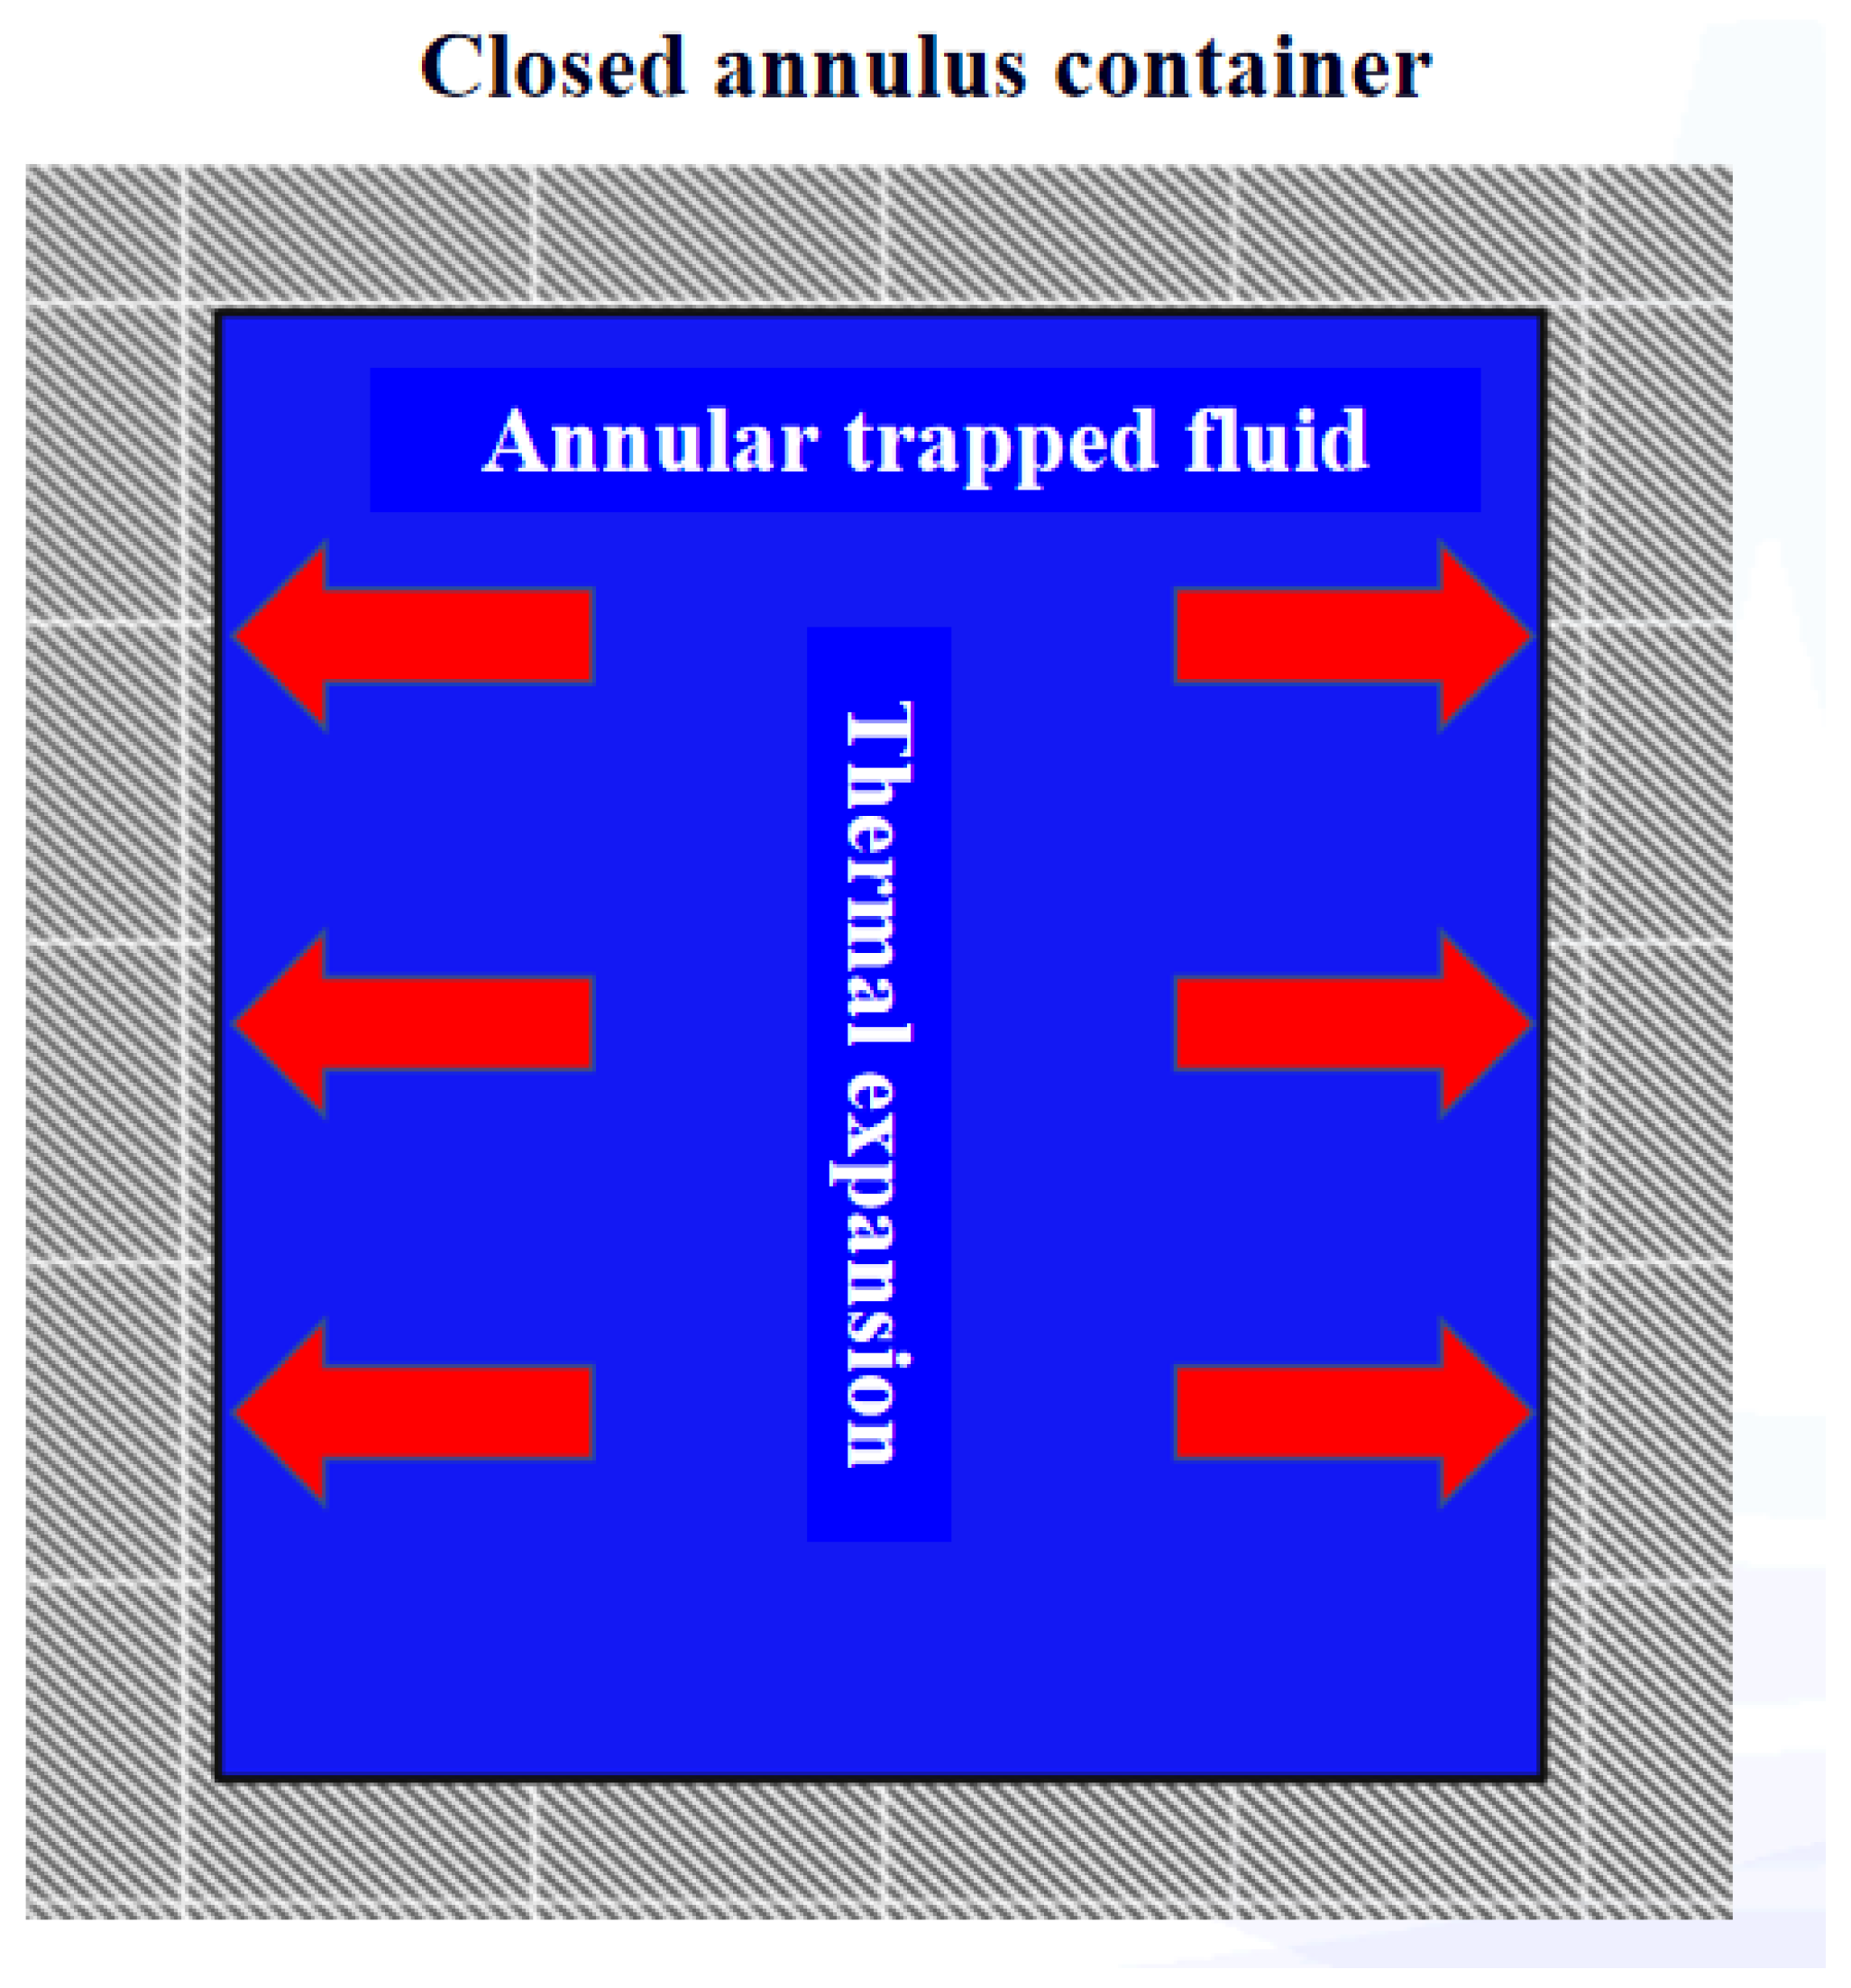
For the study of the formation mechanism of annular pressure buildup caused by the thermal effect, it can first be reduced to a simple physical model; in a closed structural space filled with fluid, how much pressure will be generated in the container after the annulus fluid is heated? As can be seen from
Figure 1, due to the limitation of the rigid structure volume, the annulus fluid cannot expand freely after heating, so a certain force will be generated on the inner wall of the container, which the annulus pressure buildup required to be solved. According to Newton’s third law, the inner wall of the container will also exert the same amount of reaction force on the annular fluid; that is, when the volume of the annular fluid expands, it is also affected by the volume compression effect, and the two are coupled. Therefore, on the premise that the integrity of the container structure is not damaged, the annular pressure rise problem in the confined space is mainly related to the thermal expansion performance of the fluid itself and the change of the annulus volume.
3. Wellbore Annulus Volume Model
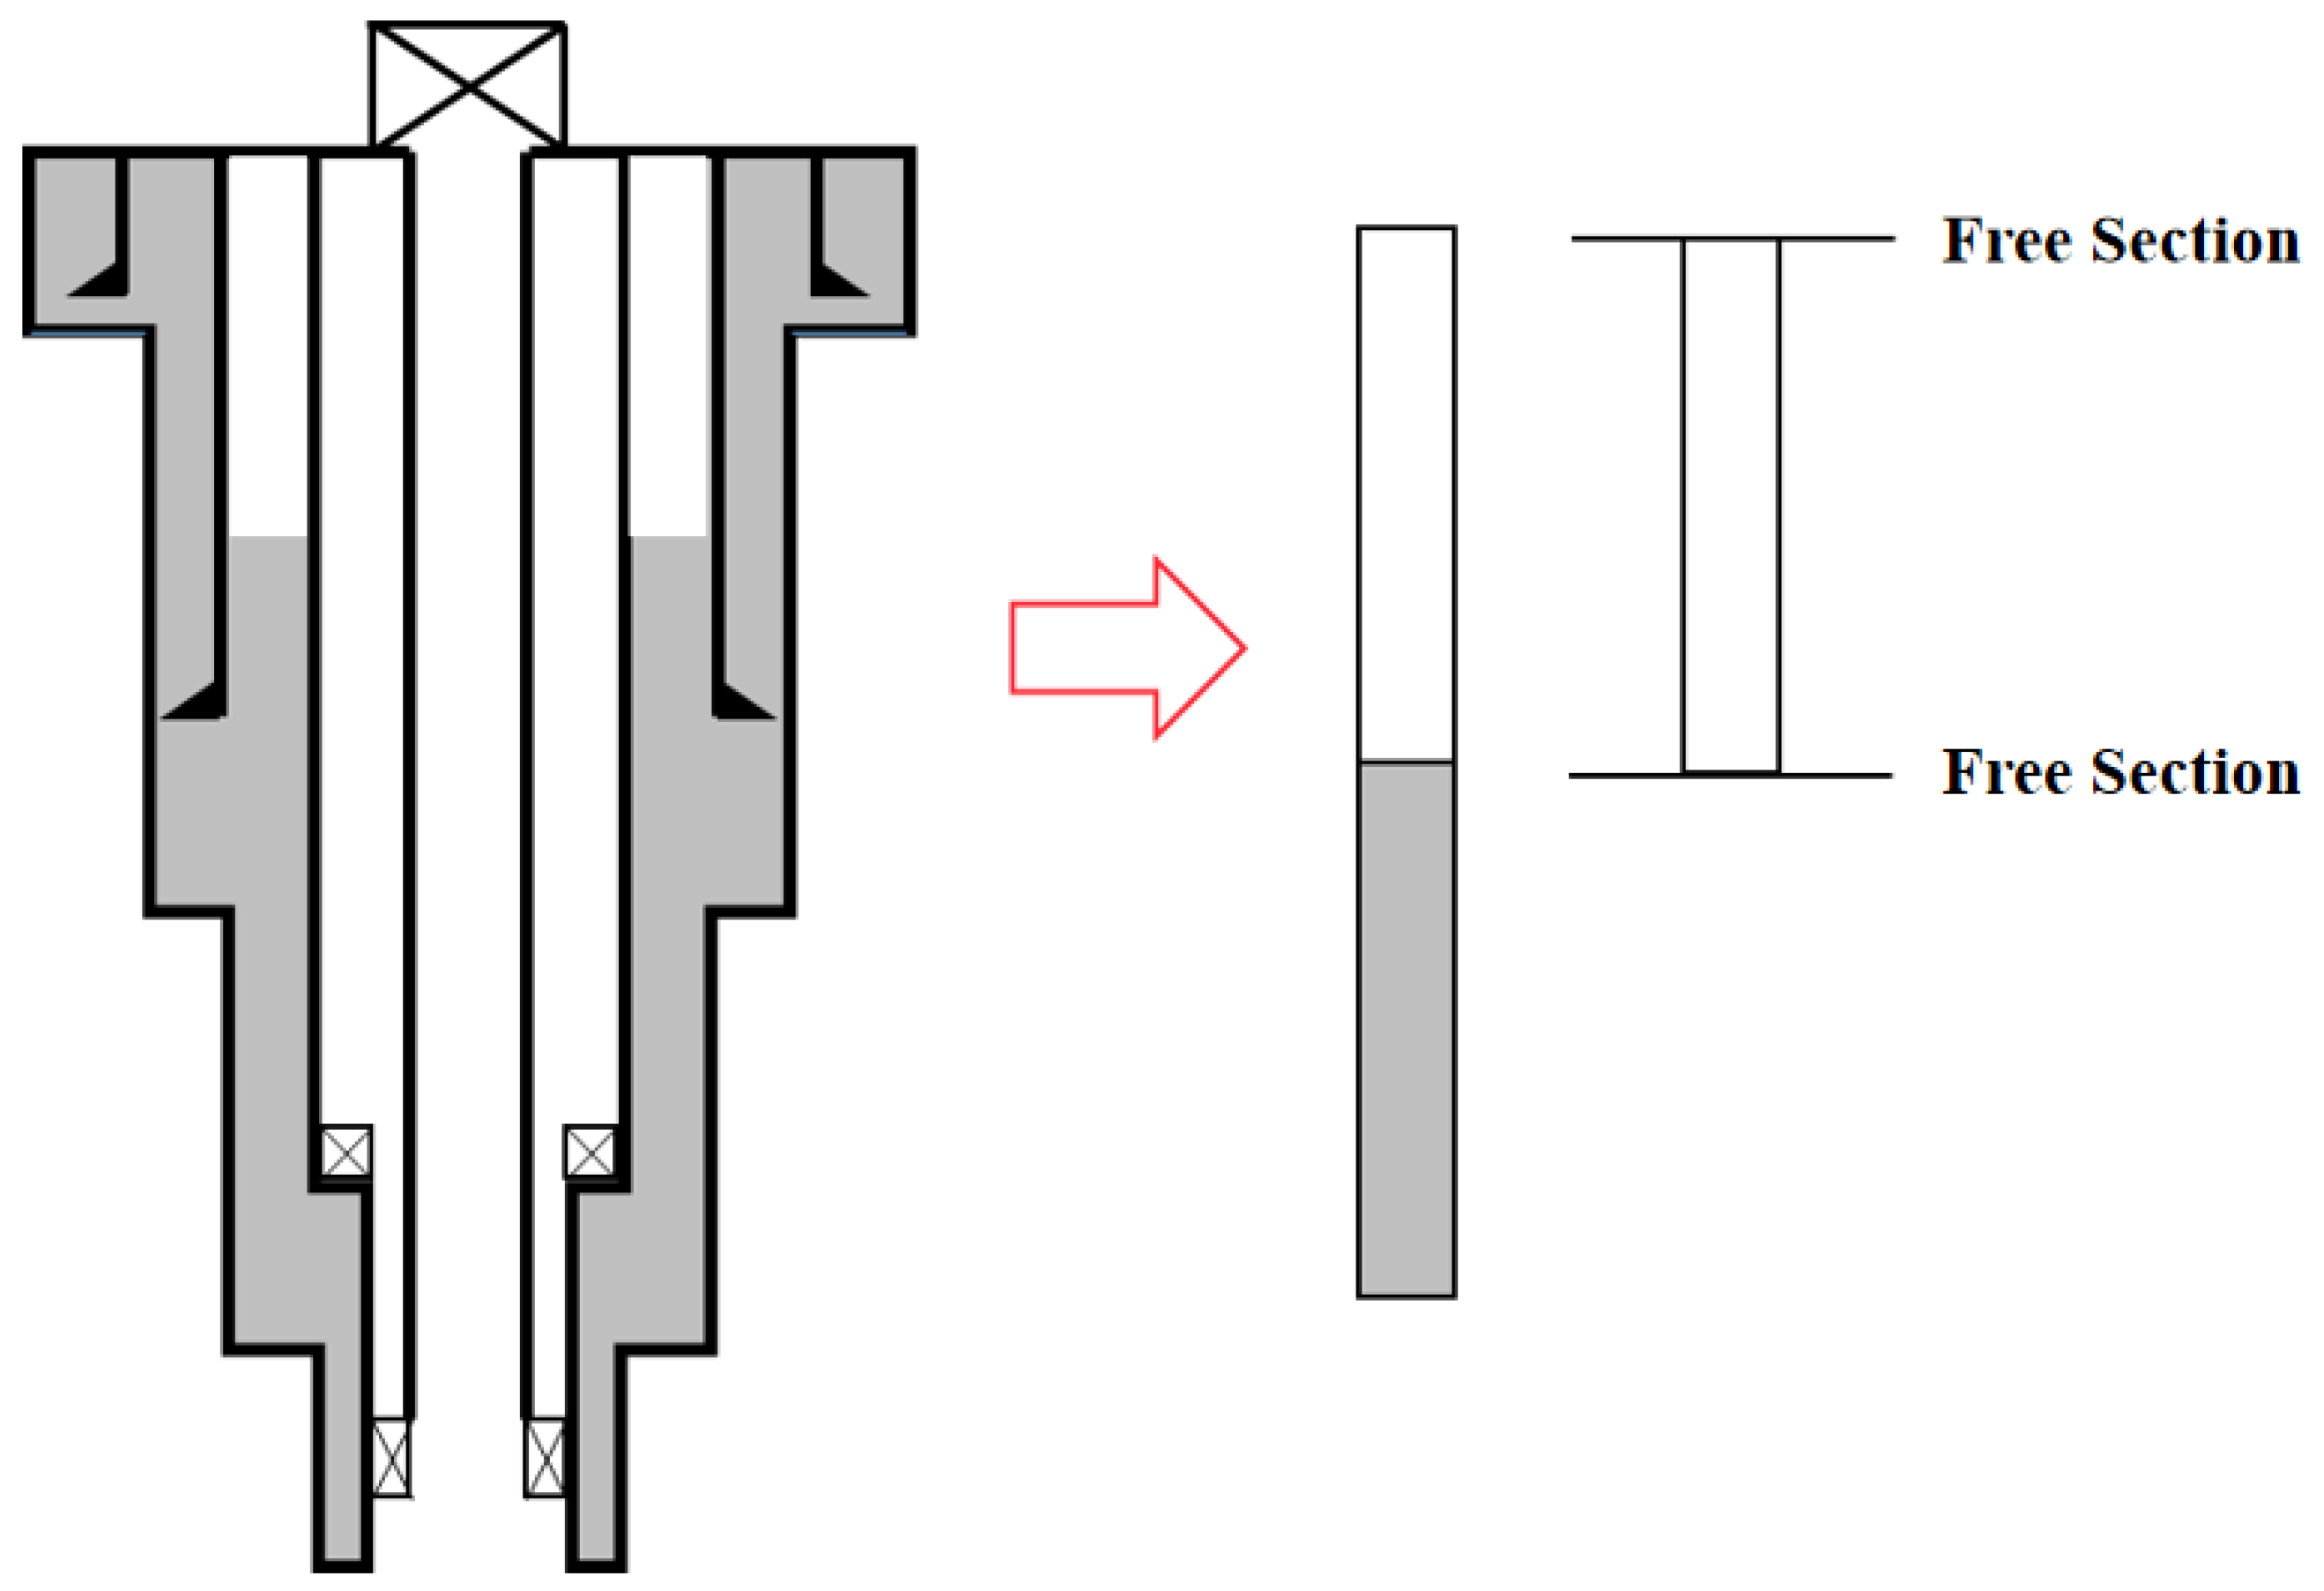
As shown in
Figure 2, the cementing operation is carried out after the casing is run in the wellbore, but the cement does not return to the wellhead. In the process of displacement change, all parts of the medium at the first and second cementation planes are always tightly cemented. According to the cement return height outside the casing, the casing can be divided into a free section and a sealed section. The free section of the casing is subjected to internal and external liquid pressure. The sealing section of the casing is subjected to internal and external hydraulic pressure as well as cement ring pressure. The change in wellbore annulus volume takes into account the deformation of the free section of the casing and the deformation of the sealing section [
29,
30,
31,
32]. After the cementing operation, due to the cementing effect of cement slurry, the casing, cement ring, and formation in the sealing section become a tightly connected elastic body, which forms the outer surface of the wellbore formation system and plays the role of sealing formation fluid and preventing gas channeling. Under the coupling of temperature and pressure, the medium in each part of the wellbore formation system will change. The elastomer composed of casing, cement ring, and formation in the sealing section will produce elastic deformation under the effect of thermal stress and inner annular pressure and expand outward in the radial direction of the wellbore.
3.1. Deformation of Casing-Free Section
The deformation of the casing-free section consists of two parts: one is caused by thermal expansion, and the other is caused by stress. Assuming the total radial strain of the free section of casing is
, then the strain due to the stress part is
. Therefore, the following occurs:
under planar conditions,
= 0;
Where is radial stress, MPa; is circumferential stress, MPa; is axial stress, MPa; is the radial strain, m; is circumferential stress, m; is the axial stress, m; is the elastic modulus of elastomer, MPa; is Poisson’s ratio of an elastic body, dimensionless; is the expansion coefficient of the elastomer, °C−1; is the temperature change, °C.
Due to the difference between the subsea wellhead and the land wellhead, the deformation ability of the deepwater casing in the longitudinal direction is limited after cementing. According to the theory of thermoelasticity, the wellbore formation system can be regarded as the two-dimensional plane strain problem of a multi-layer composite thick-walled barrel for displacement and stress analysis and solution. The geometric equation of the plane strain problem in polar coordinates is as follows:
The wellbore formation system belongs to the axisymmetric plane strain problem, which only considers the deformation along the radial direction, so the geometric equation is simplified as follows:
In polar coordinates, the physical equation of plane strain considering temperature change is as follows:
Therefore, the state equation of stress and strain derived from the formula is as follows:
Because the wellbore formation system belongs to axisymmetric plane strain problem, the influence of physical force can be ignored. At the same time, the tangential stress is zero, and the magnitude of the circumferential stress is independent of the rotation Angle, so the formula can be simplified as follows:
The plane stress satisfies the equilibrium equation:
The boundary conditions are as follows:
Substituting the constitutive equation expressed by stress into the equilibrium Equation (6):
According to the boundary Equation (7), the radial displacement formula of the casing-free section can be obtained:
In the formula, is the change in displacement due to stress, m and is the change in displacement of the elastomer due to temperature, m.
Substituting
r = a and
r = b into Equation (9), respectively, the displacements of the inner and outer boundaries can be obtained:
The expression of each coefficient is as follows:
3.2. Deformation of Casing Sealing Section
The deformation of the casing sealing section must consider the deformation of the external cement sheath and the formation under the influence of thermal expansion and stress. As shown in
Figure 3, assuming that the cement sheath and the formation are regarded as a stressed whole, the cement sheath formation can be divided into a hot area affected by temperature and a cold area not affected by temperature according to the temperature influence range. The inner radius of the casing is
, with an outer radius of
. The outer radius of the cement ring is
. The area where the formation is affected by the temperature is the hot area with a radius of
, and the region where the temperature cannot be swept is the cold area with a radius of
.
For casing deformation, Equation (10) can also be used for its calculation. The pressure in the casing is , the pressure at the cementation surface of the casing and cement sheath is , the pressure at the cementation surface of the cement sheath and the formation hot zone is , and the pressure at the interface of the hot and cold areas is .
When
, the
,
,
, the radial deformation of the casing is as follows:
When
, the
,
,
, the radial deformation of the cement sheath is as follows:
When
, the
,
,
, the radial deformation of the formation hot area is as follows:
When
, the
, considering the assumption that the formation is infinite, the radial deformation of the formation’s cold area is as follows:
where
According to the principle of coordinated deformation, when or , the deformation at the junction of the hot and cold zone meets Equations (14) and (15) at the same time, and the deformation of the casing sealing section can be obtained by combining Equation (12) with Equation (16).
4. Multi-String Annular Pressure Buildup Model
The annulus pressure buildup is the increase in fluid expansion pressure in the sealed annulus between each layer of casing due to temperature rise. The typical calculation model is as follows:
The first term on the right side of the equation represents the pressure due to the thermal expansion effect, and the second term represents the pressure due to the annular deformation caused by the thermal effect or load of the casing. The third term is the pressure due to annular fluid leakage or reservoir fluid overflow into the annulus.
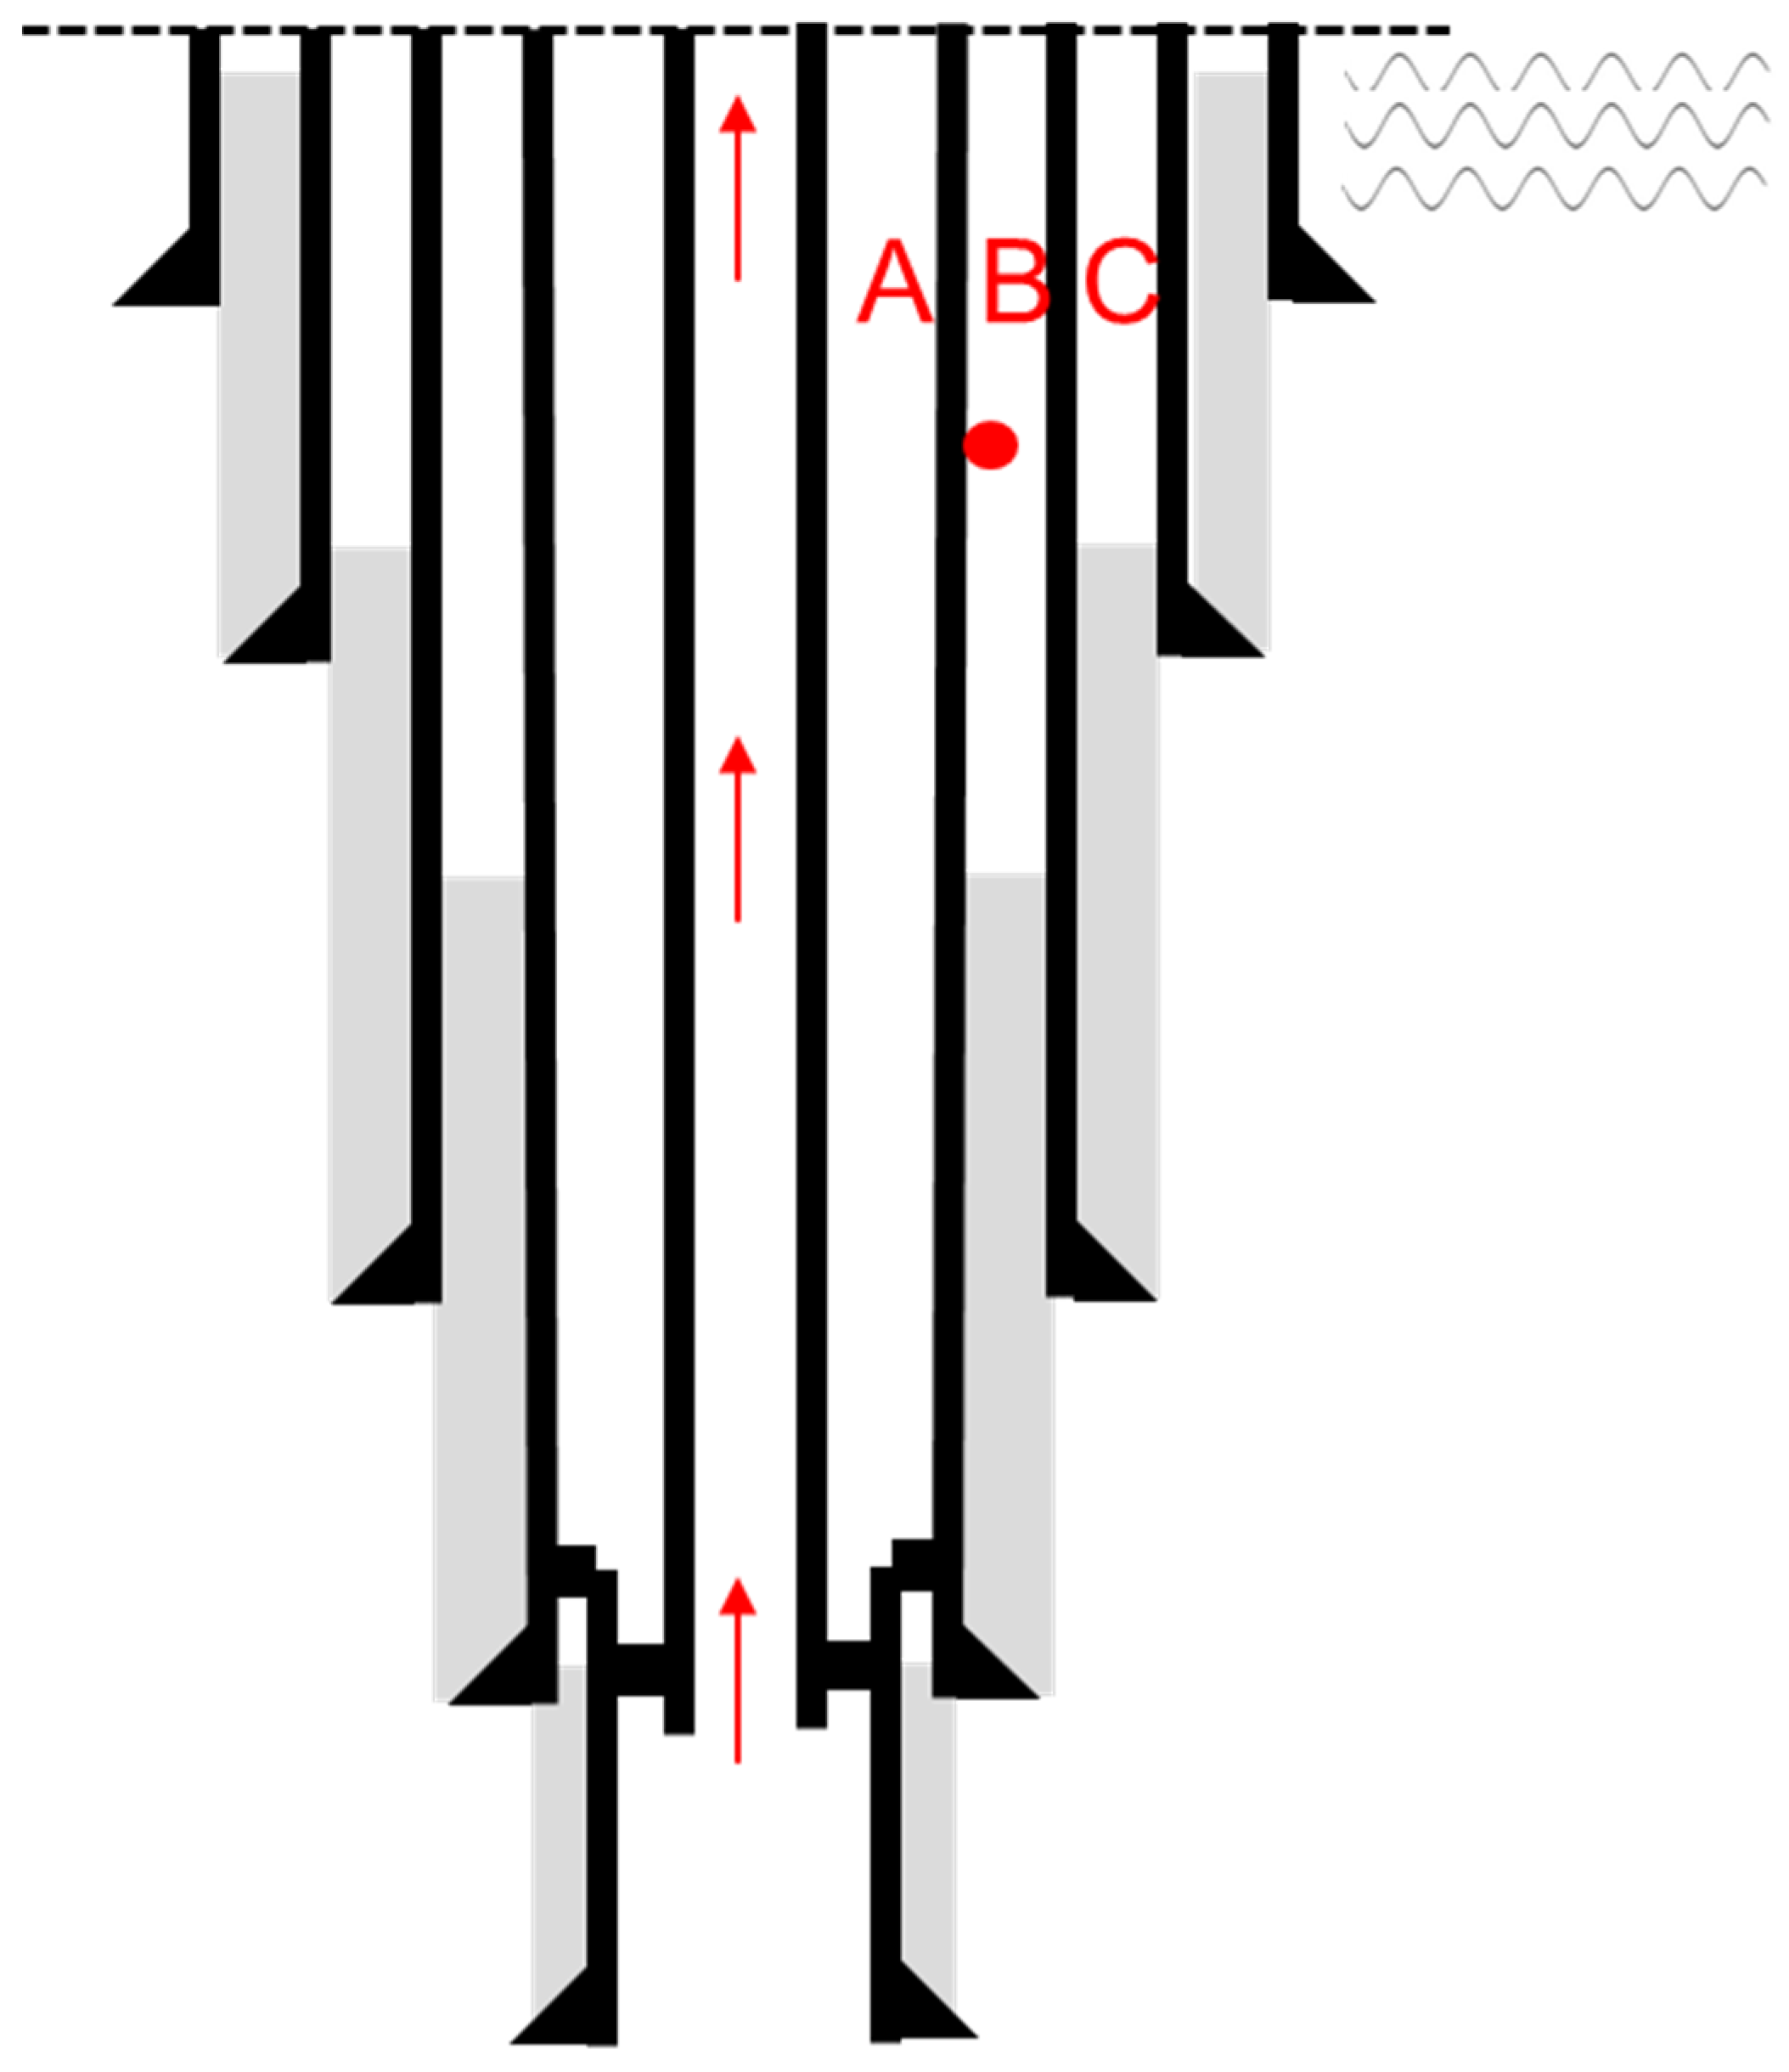
In the typical three-annulus well structure, the tubing and production casing form the A annulus, the production casing and intermediate casing form the B annulus, and the intermediate casing and surface casing form the C annulus. When the production parameters of oil and gas wells and the annular drilling fluid system are determined, according to the calculation formula of annular pressure buildup, the main factor affecting annular pressure buildup is the change of annular volume. The annular pressure buildup is affected by the pressure of the adjacent annulus; therefore, the casing annulus pressure buildup values are solved as a system.
Taking the A annulus as an example, the changes of annulus volume mainly include the following: ① radial deformation of tubing; ② the radial deformation of the casing-free section (related to the B annulus pressure); ③ the radial deformation of the casing sealing section.
The volume change caused by the radial deformation of the tubing is as follows:
The volume change caused by the radial deformation of the casing-free section (related to the B annulus pressure) is as follows:
The volume change caused by the radial deformation of the casing sealing section is as follows:
In the process of calculating the change of the A annulus volume, the influence of the B annular pressure on the A annulus volume needs to be considered.
The deformation of annulus B and C can be obtained using the same method. The change of the B annulus volume is affected by the pressure of annulus A and C, and the change of the C annulus volume is affected by the B annulus pressure.
5. Solution
A, B, and C annular pressure buildup is affected by each other and needs to be solved iteratively by using multiple strings. The three annular pressure buildup calculation formulas are transformed to form a set of ternary quadratic equations:
where
P1 is the A annular pressure, MPa,
P2 is the B annular pressure, MPa, and
P3 is the C annular pressure, MPa.
The ternary quadratic equations are solved by Newton’s iterative method. The solution of
is obtained by establishing the equation
, taking the derivative
of the equation, and then, according to Newton’s iteration principle.
Therefore, the calculation steps of annular pressure buildup of multi-string are as follows:
(1) Based on the wellbore structure and the production parameters, the temperature profile of the well is solved, and then the temperature change of the fluid in the sealed section, the free section, and the annulus of each layer of the case is obtained;
(2) Obtain of the annular volume change according to the wellbore structure;
(3) Establish a set of equations for calculating the annular pressure buildup;
(4) Setting an initial pressure matrix;
(5) Calculate the derivative matrix DF of the pressure equation;
(6) Obtain the annular pressure buildup matrix according to Newton’s iteration principle;
(7) Comparing the pressure obtained in step (6) with the initial value and repeating steps (4) to (6) if the error is not within the range;
(8) Obtain the annular pressure buildup value of each annular space.
6. Model Validation
To verify the model established in the paper, an example well was selected. The wellbore structure of the example well is shown in
Table 1 and
Figure 4 The high-precision temperature and pressure sensors were placed on the outer wall of the 9 5/8″ casing at a depth of 190 m. The casing was properly cemented, and the cement was returned to 2438 m. This well was further drilled to a depth of 3627 m, and a 7″ tailpipe was installed.
6.1. Well Structure
After the test was completed, the well was abandoned, and the 9 5/8″ casing with sensors was retrieved. The three testing processes clearly demonstrated the changes in temperature and pressure data during well flushing, flow testing, and pressure rise.
As the temperature rose from 17 °C to 65 °C, the pressure increased from 1.2 MPa to 25 MPa. The internal pressure resistance strength of the 13 3/8″ P110 72 lbs/ft casing was 51 MPa, and the external compression resistance strength of the 9 5/8″ P110 72 lbs/ft casing was 54.7 MPa. The density of the drilling fluid was 1.3 g/cm3. Due to the pressure of the liquid column, the pressure increased by 26 MPa from the sensor position to the mud return position at 2328 m.
6.2. Annular Pressure Buildup Calculation
According to casing and annulus fluid temperature changes, annular pressure buildup was iteratively solved for the well, and annular pressure buildup simulation analysis was carried out in three cases:
(1) Only the expansion and compression effect of the liquid is considered;
(2) Considering the expansion and compression effect of liquid and the deformation of the casing-free section;
(3) Consider the expansion and compression effect of the liquid, the deformation of the casing-free section, and the sealing section.
The annular pressure buildup values are shown in
Figure 5.
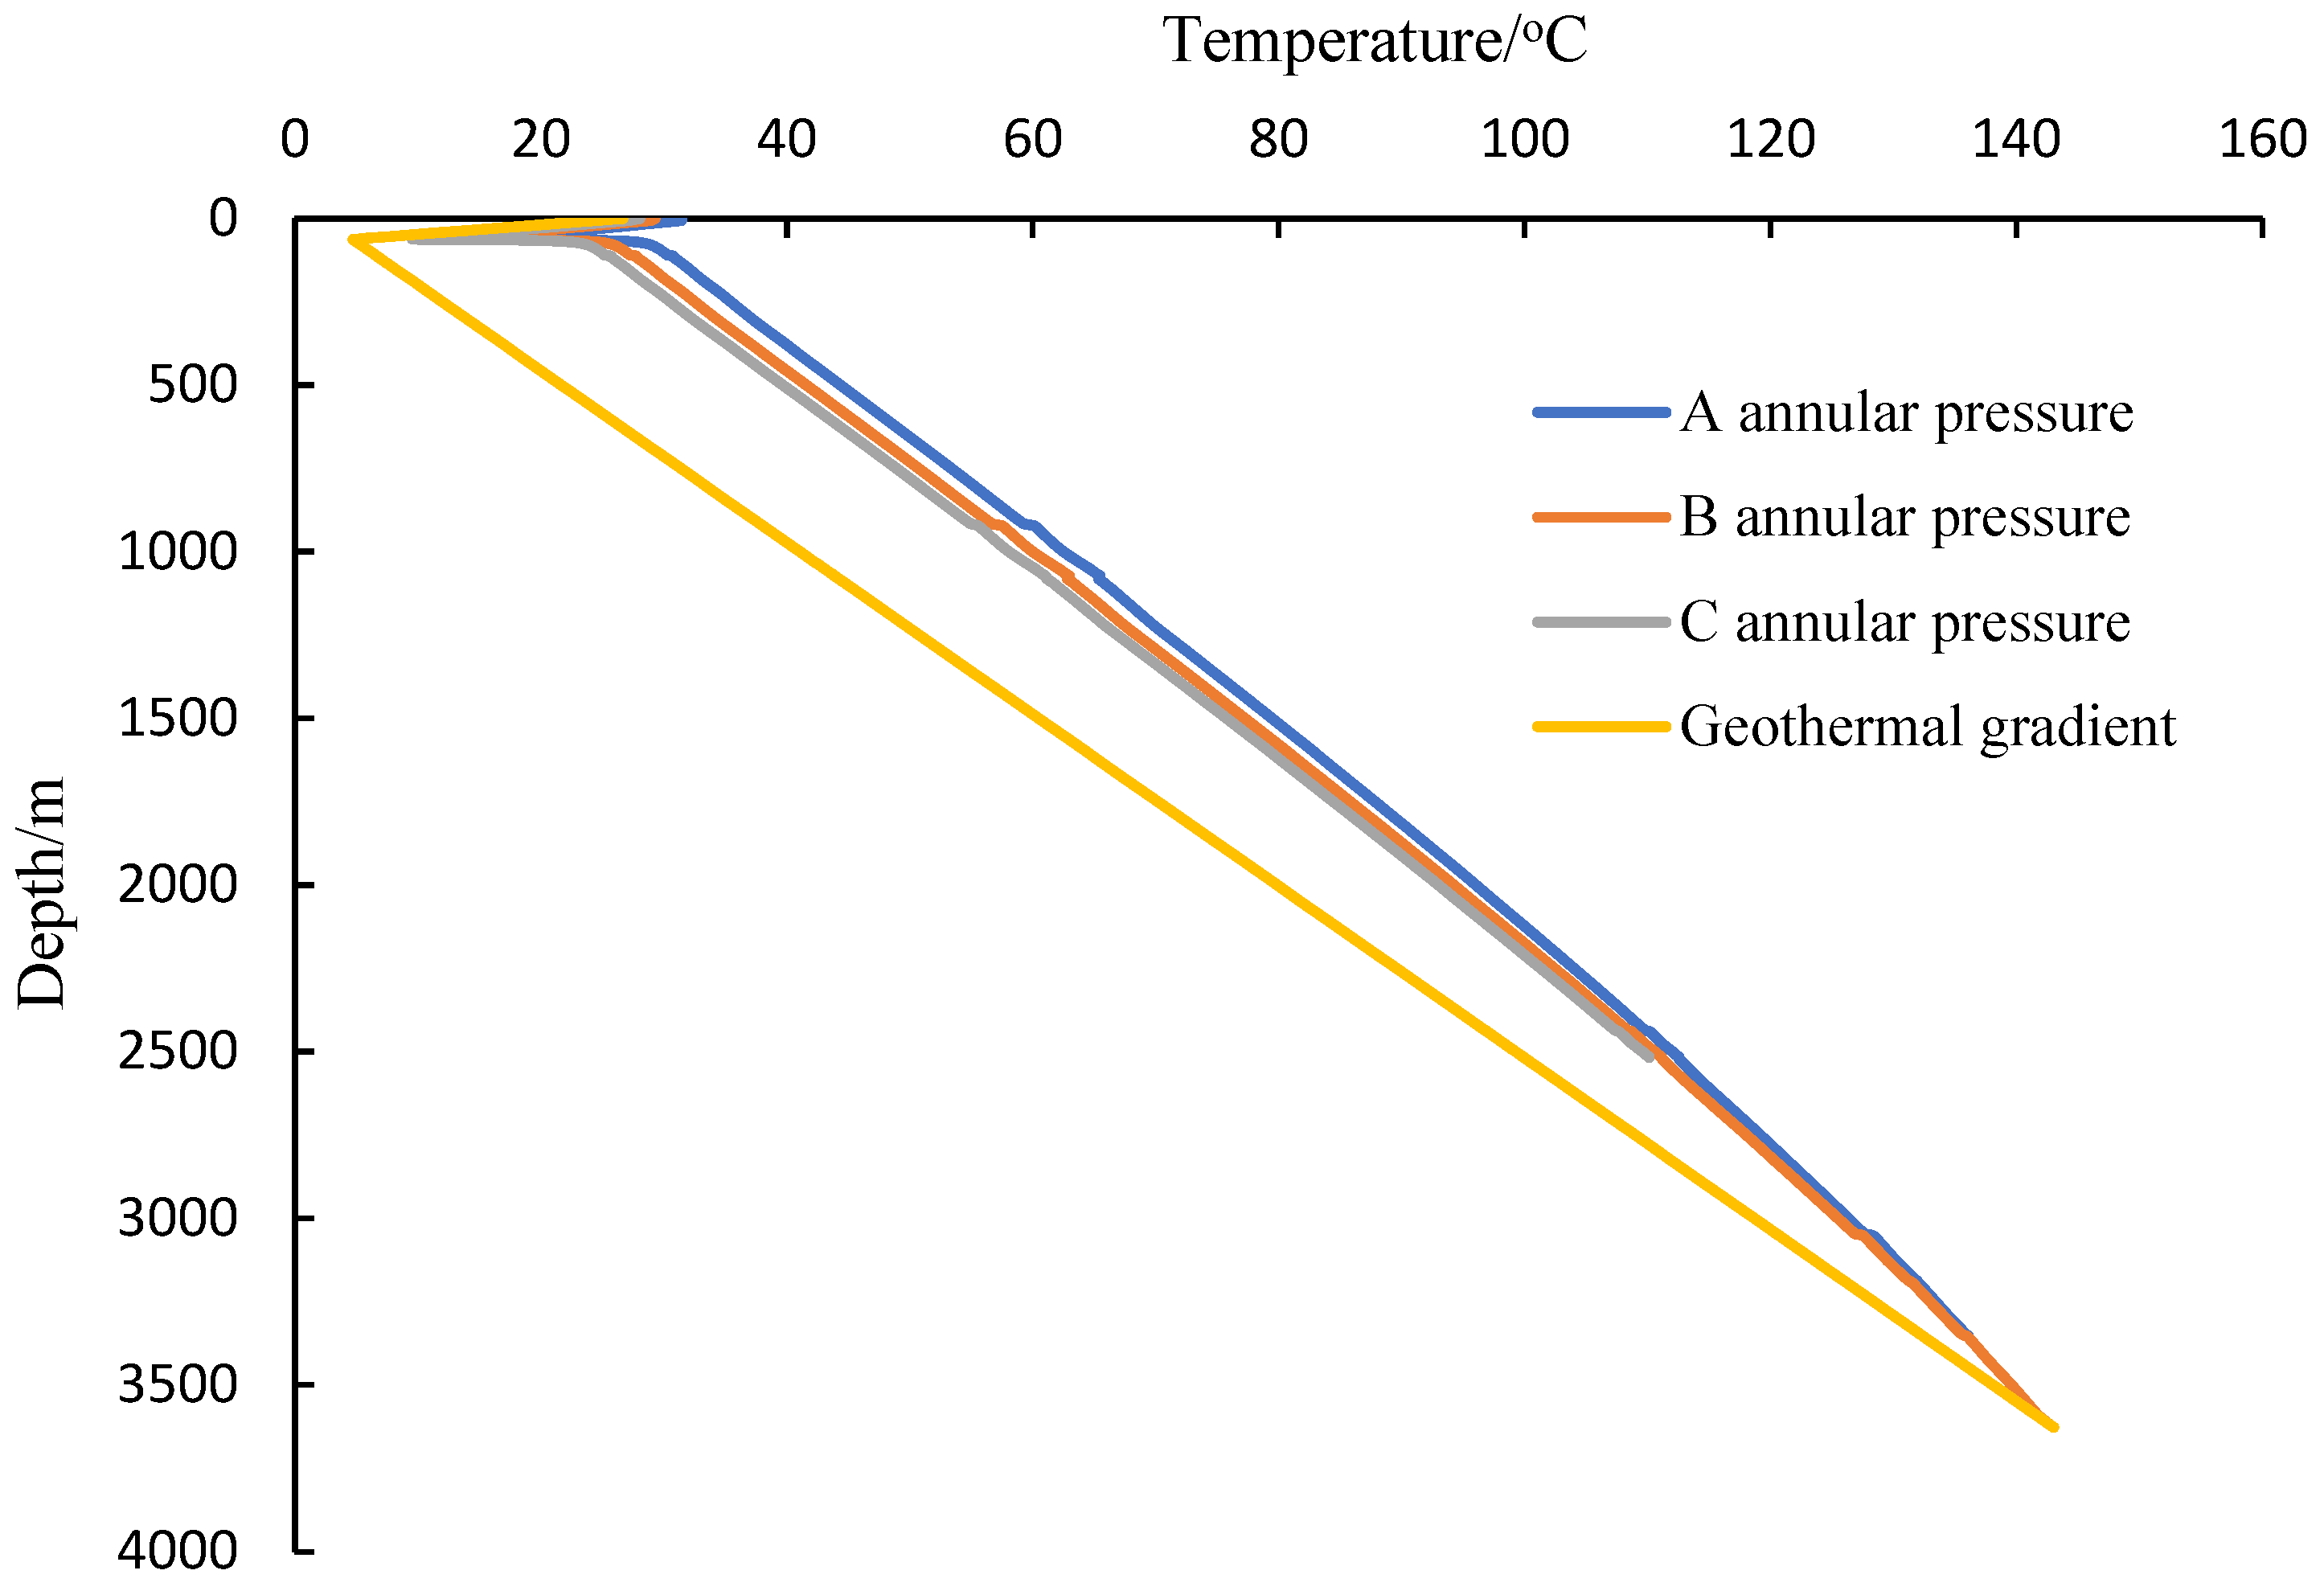
As can be seen from
Figure 5, for annulus A and B, C1 and C2 were basically equal because there was little difference in deformation of the free section of the casing in the inner and outer layers and little change in annulus volume.
For the C annulus, only the inner casing had a free section of pressure, and the annulus volume was reduced; therefore, C2 was greater than C1.
If the deformation of the sealed section is considered, it can be seen from the figure that the C3 values were all lower than the C1 and C2 values, and the predicted value of the trap pressure was smaller than that without considering the deformation of the sealing section.
Due to the different annular cement return heights, the sealing section had different influences on the trap pressure of A, B, and C and had the greatest influence on the C annular pressure buildup and the least influence on the A annular pressure buildup.
Specifically, the annular trap pressure predicted by the case of B annulus C3 was better than that predicted by the case of C1 and C2, which decreased by 14.9% and 13.6%, respectively. The predicted annular trap pressure of the C annulus C3 was 13.2% and 14.8%, which was lower than that of C1 and C2, respectively.
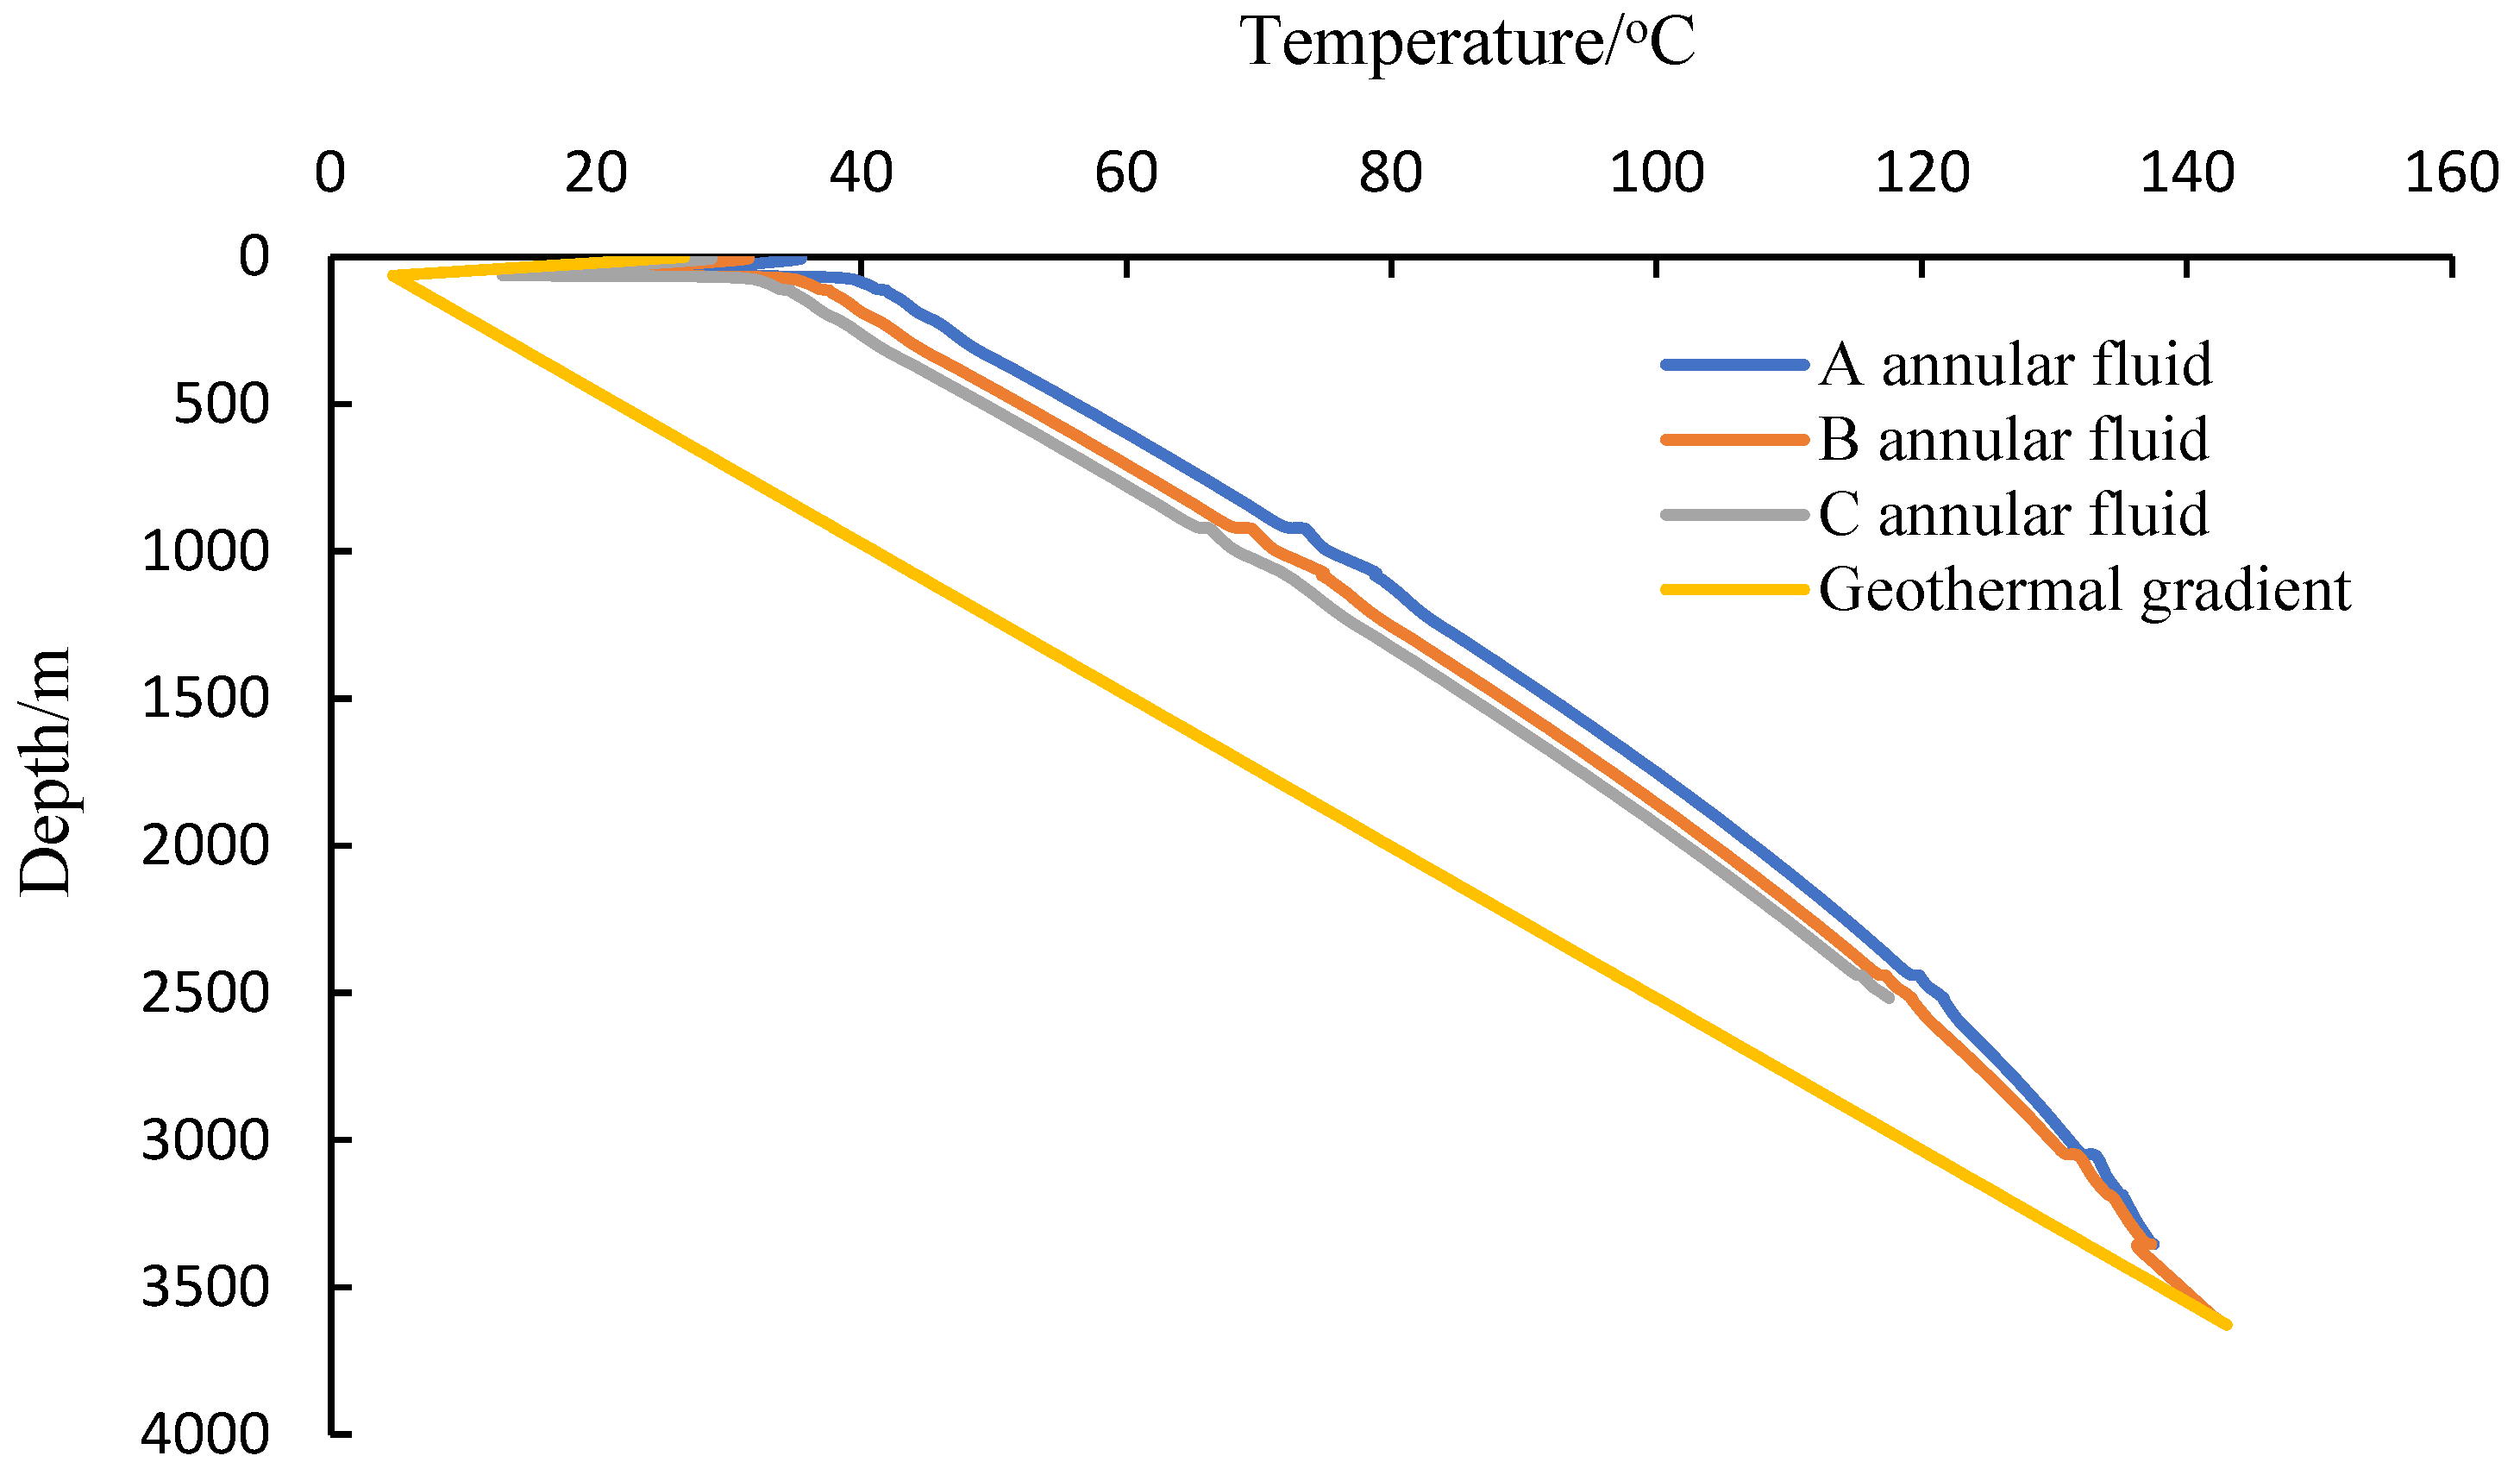
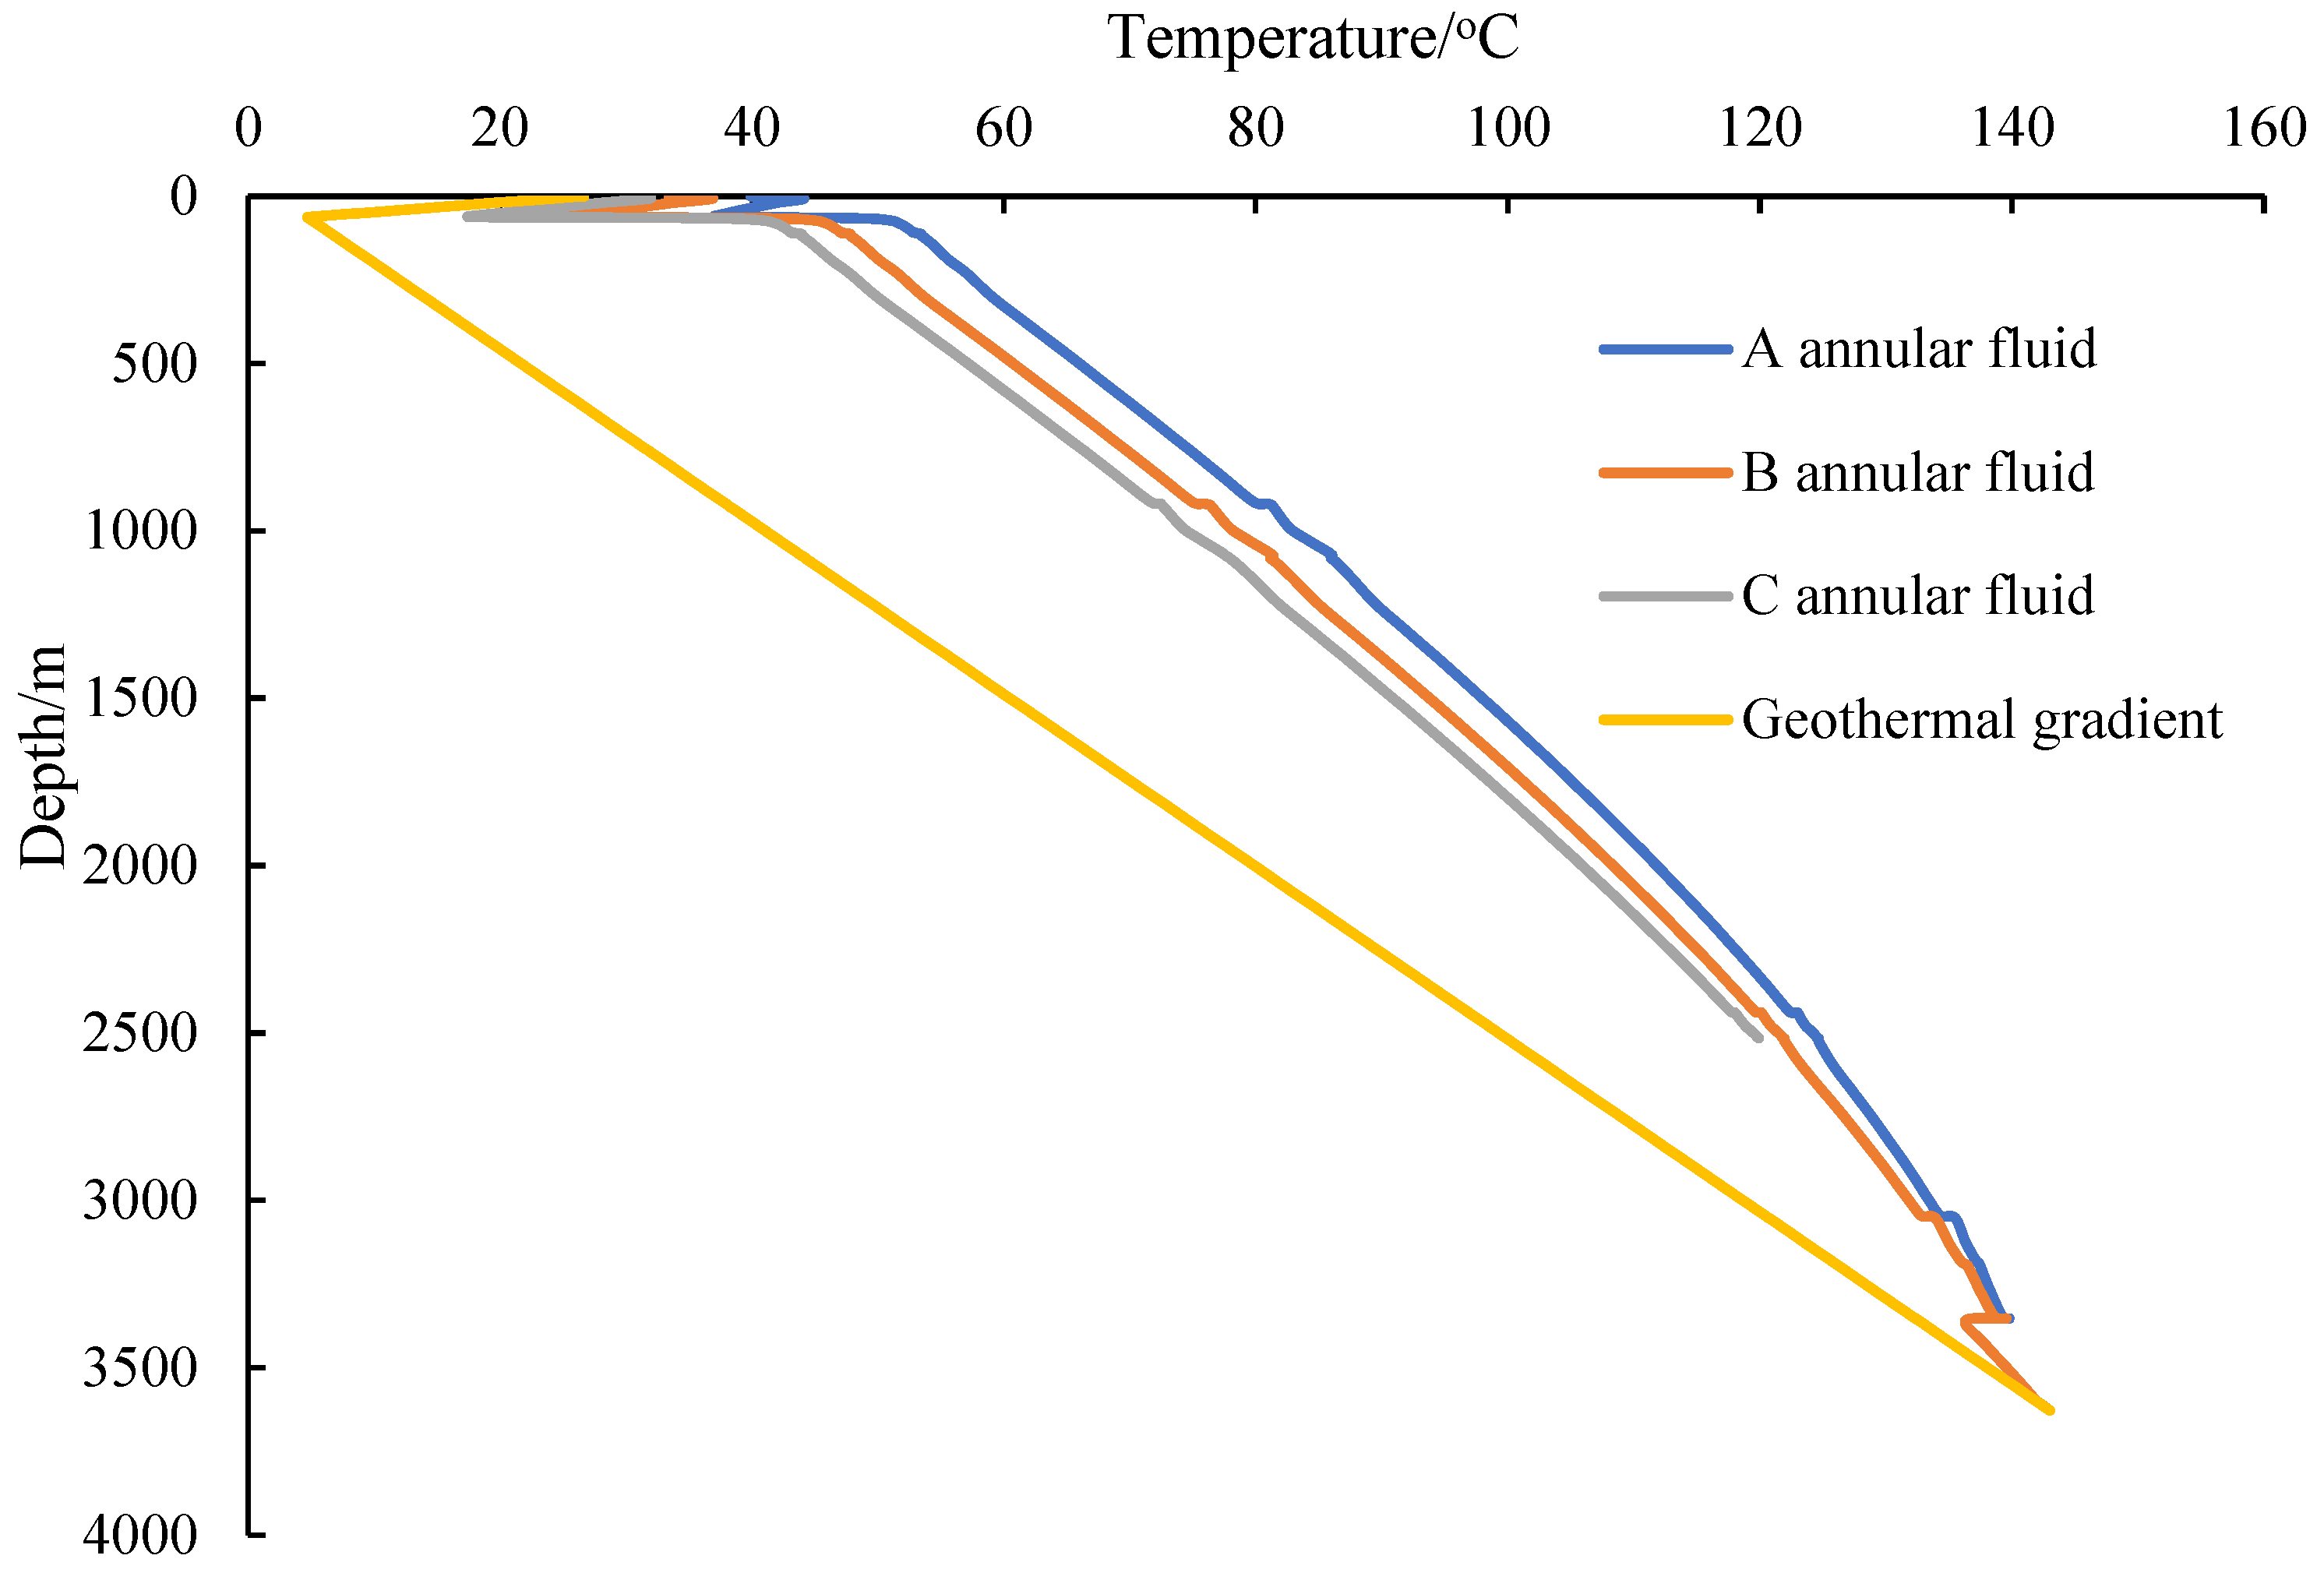
6.3. Wellbore Temperature Profile
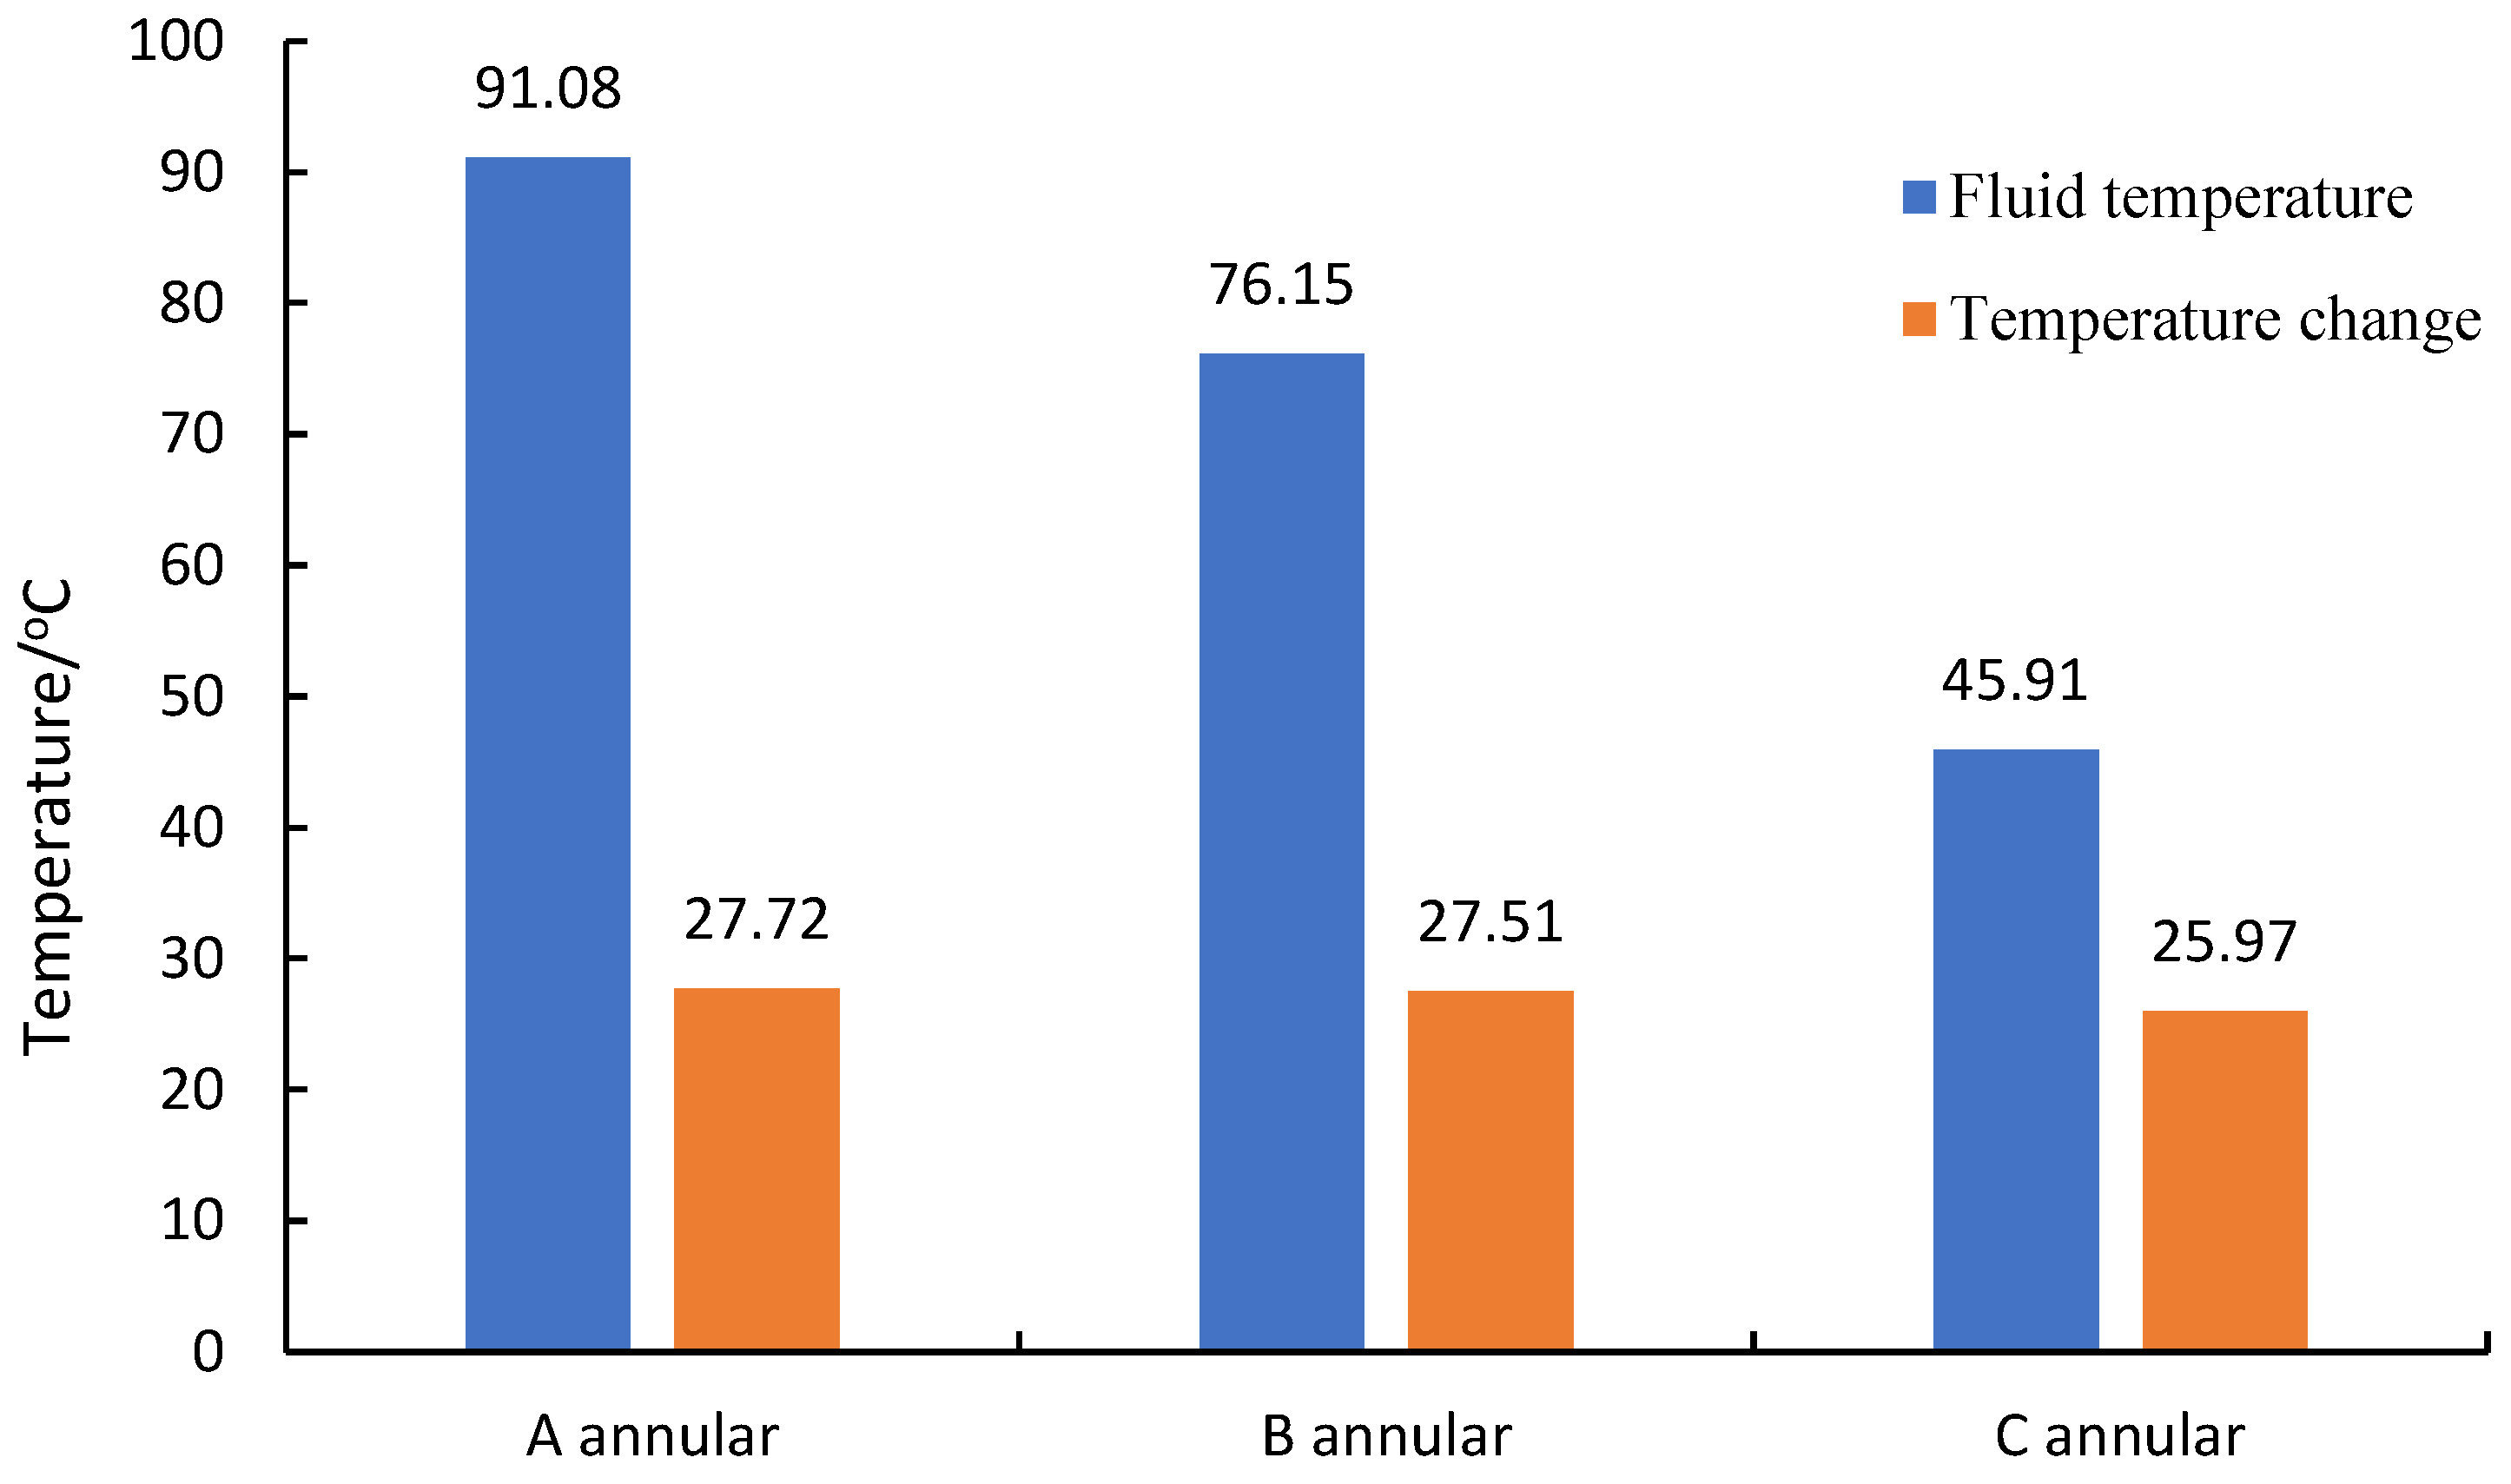
The average temperature and average temperature changes in the annulus when the temperature sensor reached 30 °C are shown in
Figure 6 and
Figure 7.
The wellbore temperature profile and the average temperature and average temperature changes in the annulus when the temperature sensor reached 40 °C are shown in
Figure 8 and
Figure 9.
The wellbore temperature profile and the average temperature and average temperature changes in the annulus when the temperature sensor reached 50 °C are shown in
Figure 10 and
Figure 11.
6.4. Comparison Between Calculated and Measured Values
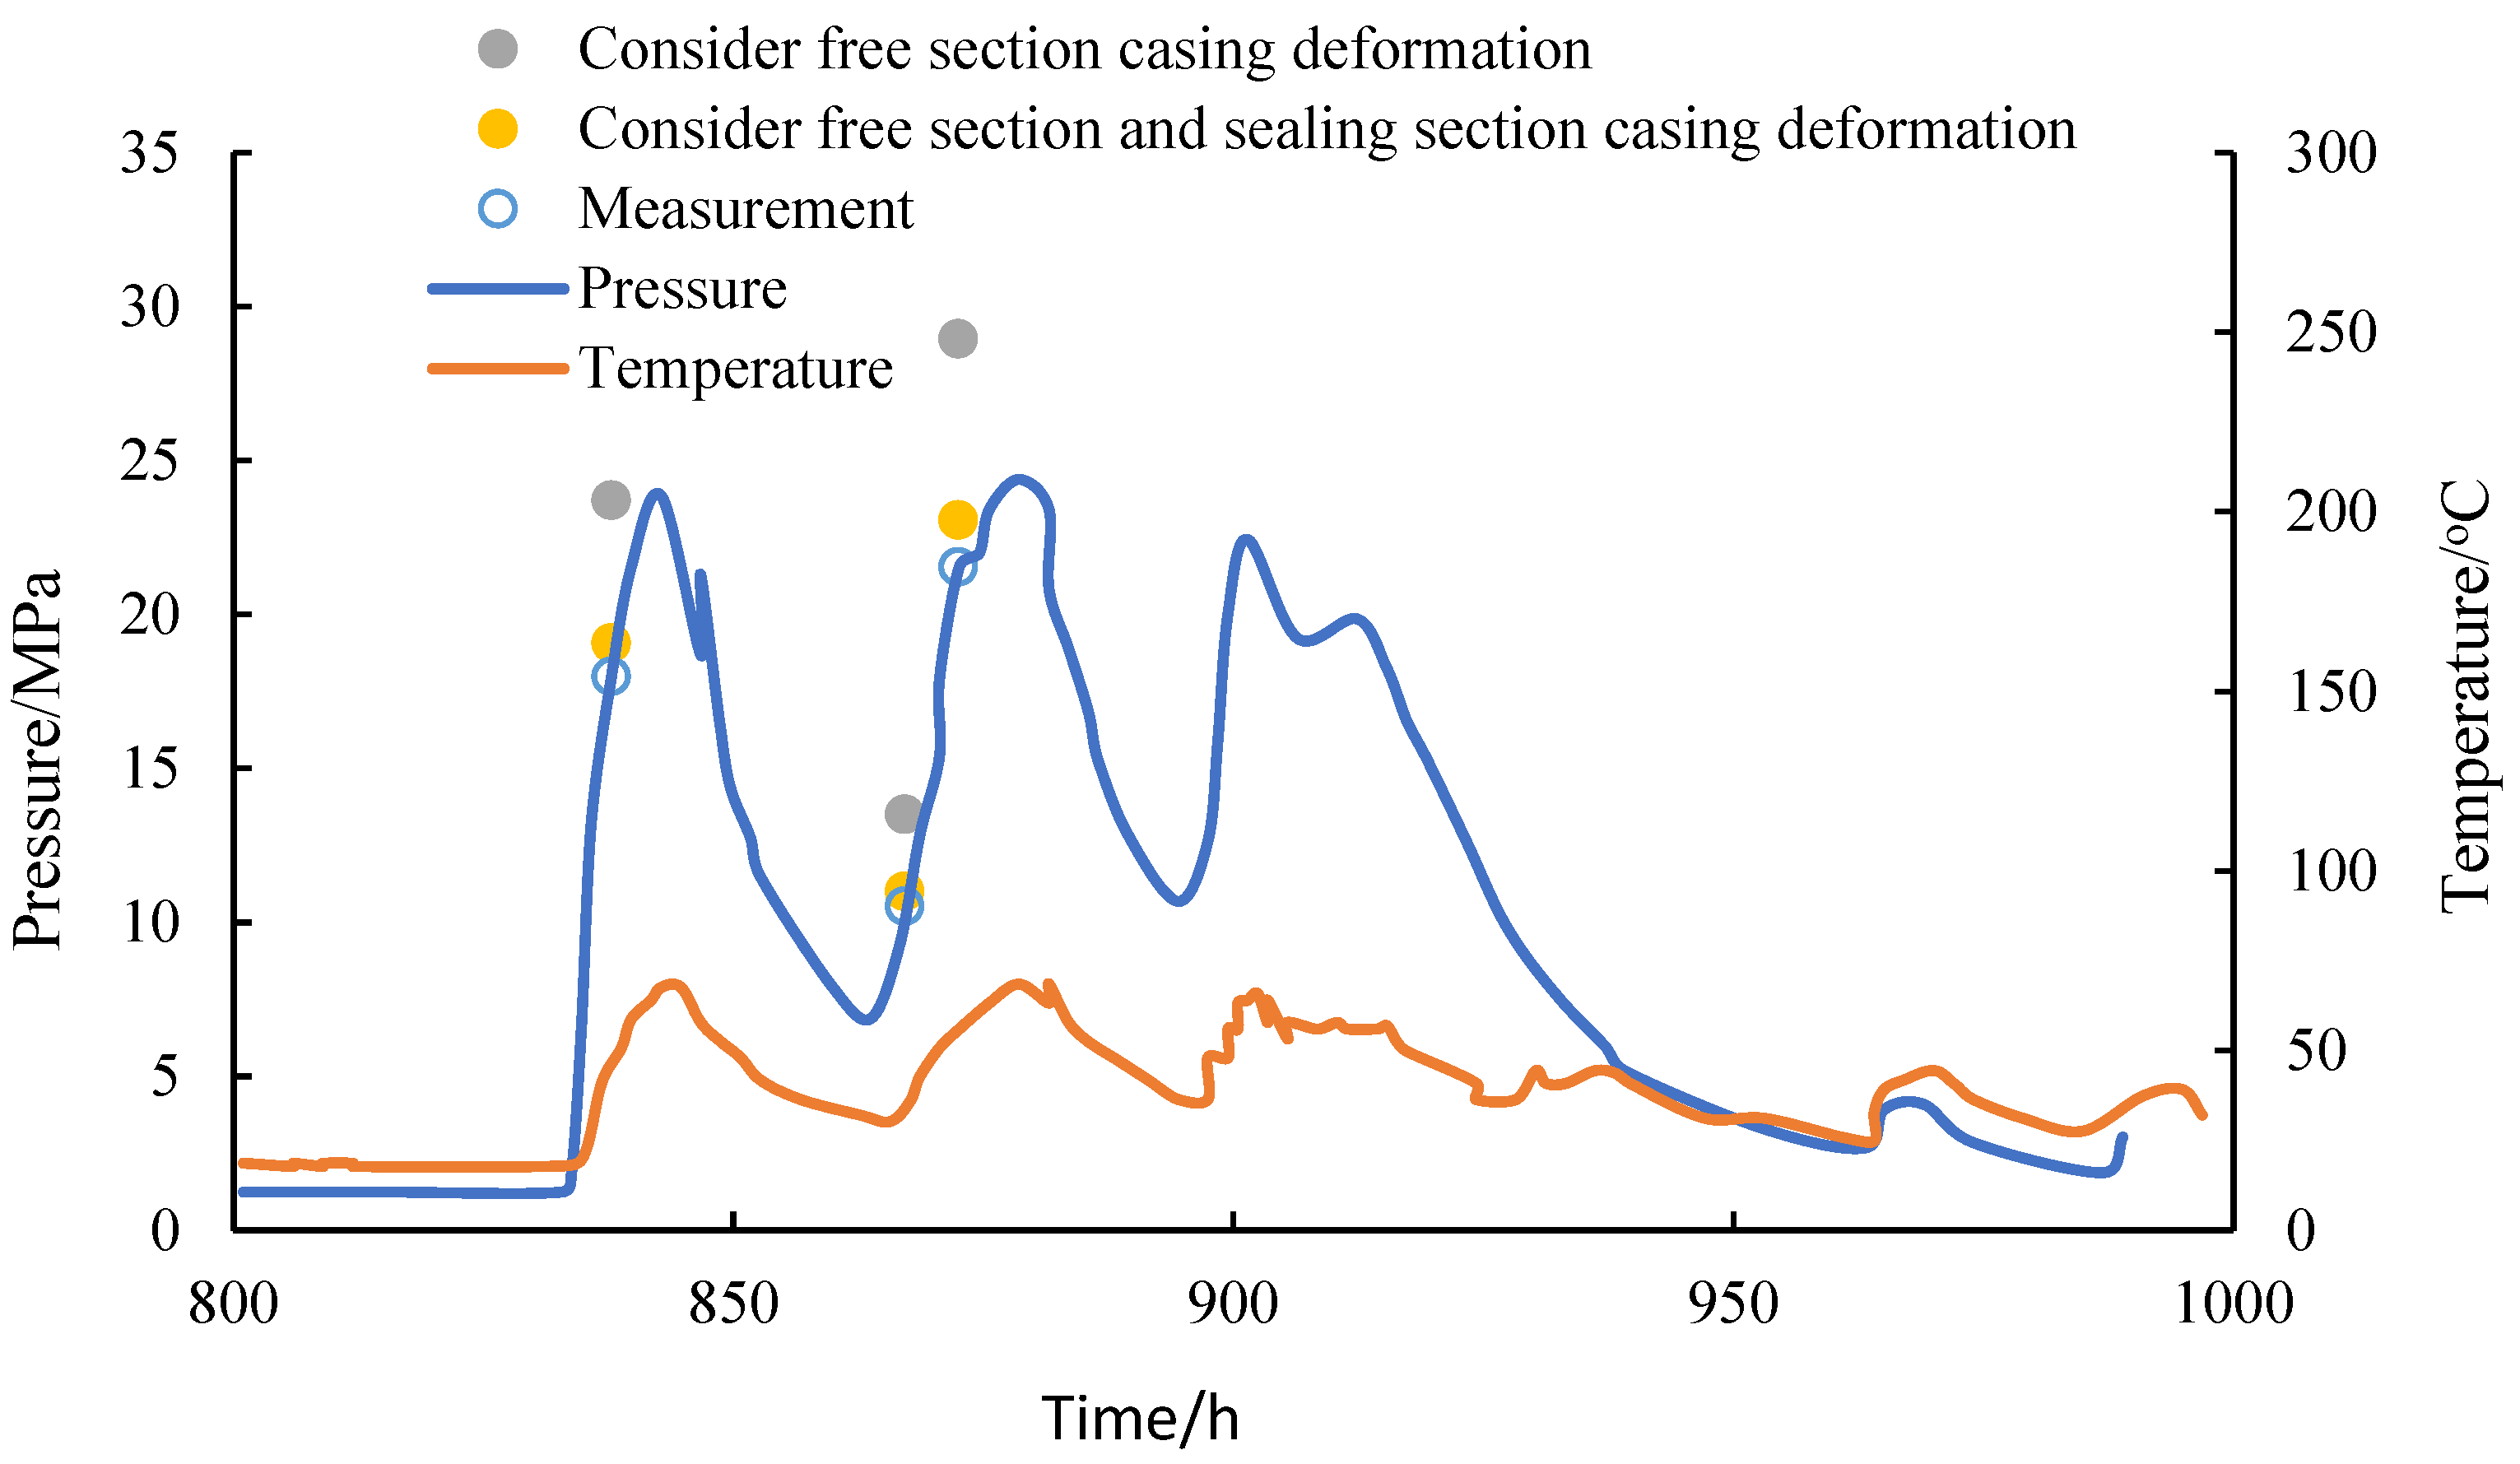
Based on the average temperature and temperature changes of the annulus at temperature points of 30 °C, 40 °C, and 50 °C, combined with the experimentally measured thermal and physical parameters of the annulus fluid, the annulus pressure buildup at each temperature point can be determined. As shown in
Figure 12, Wellcat software (The version is EDM5000.17.2 belonged to Schlumberger, USA) was also used to compare it with the measured data and data calculated by the model in this paper.
According to
Table 2, the calculated values of Wellcat were larger than the measured values, with an error of 10–30%. By comparison, the error calculated using the model established in this article was within 10%, which was smaller than that calculated by Wellcat, thus verifying the accuracy of the model.
7. Results and Discussion
7.1. Wellbore Temperature
In this section, the example well in
Section 6.1 was used for analysis. The well parameters are described in
Section 6.1. The average temperature of the annulus at different production times was calculated and is shown in
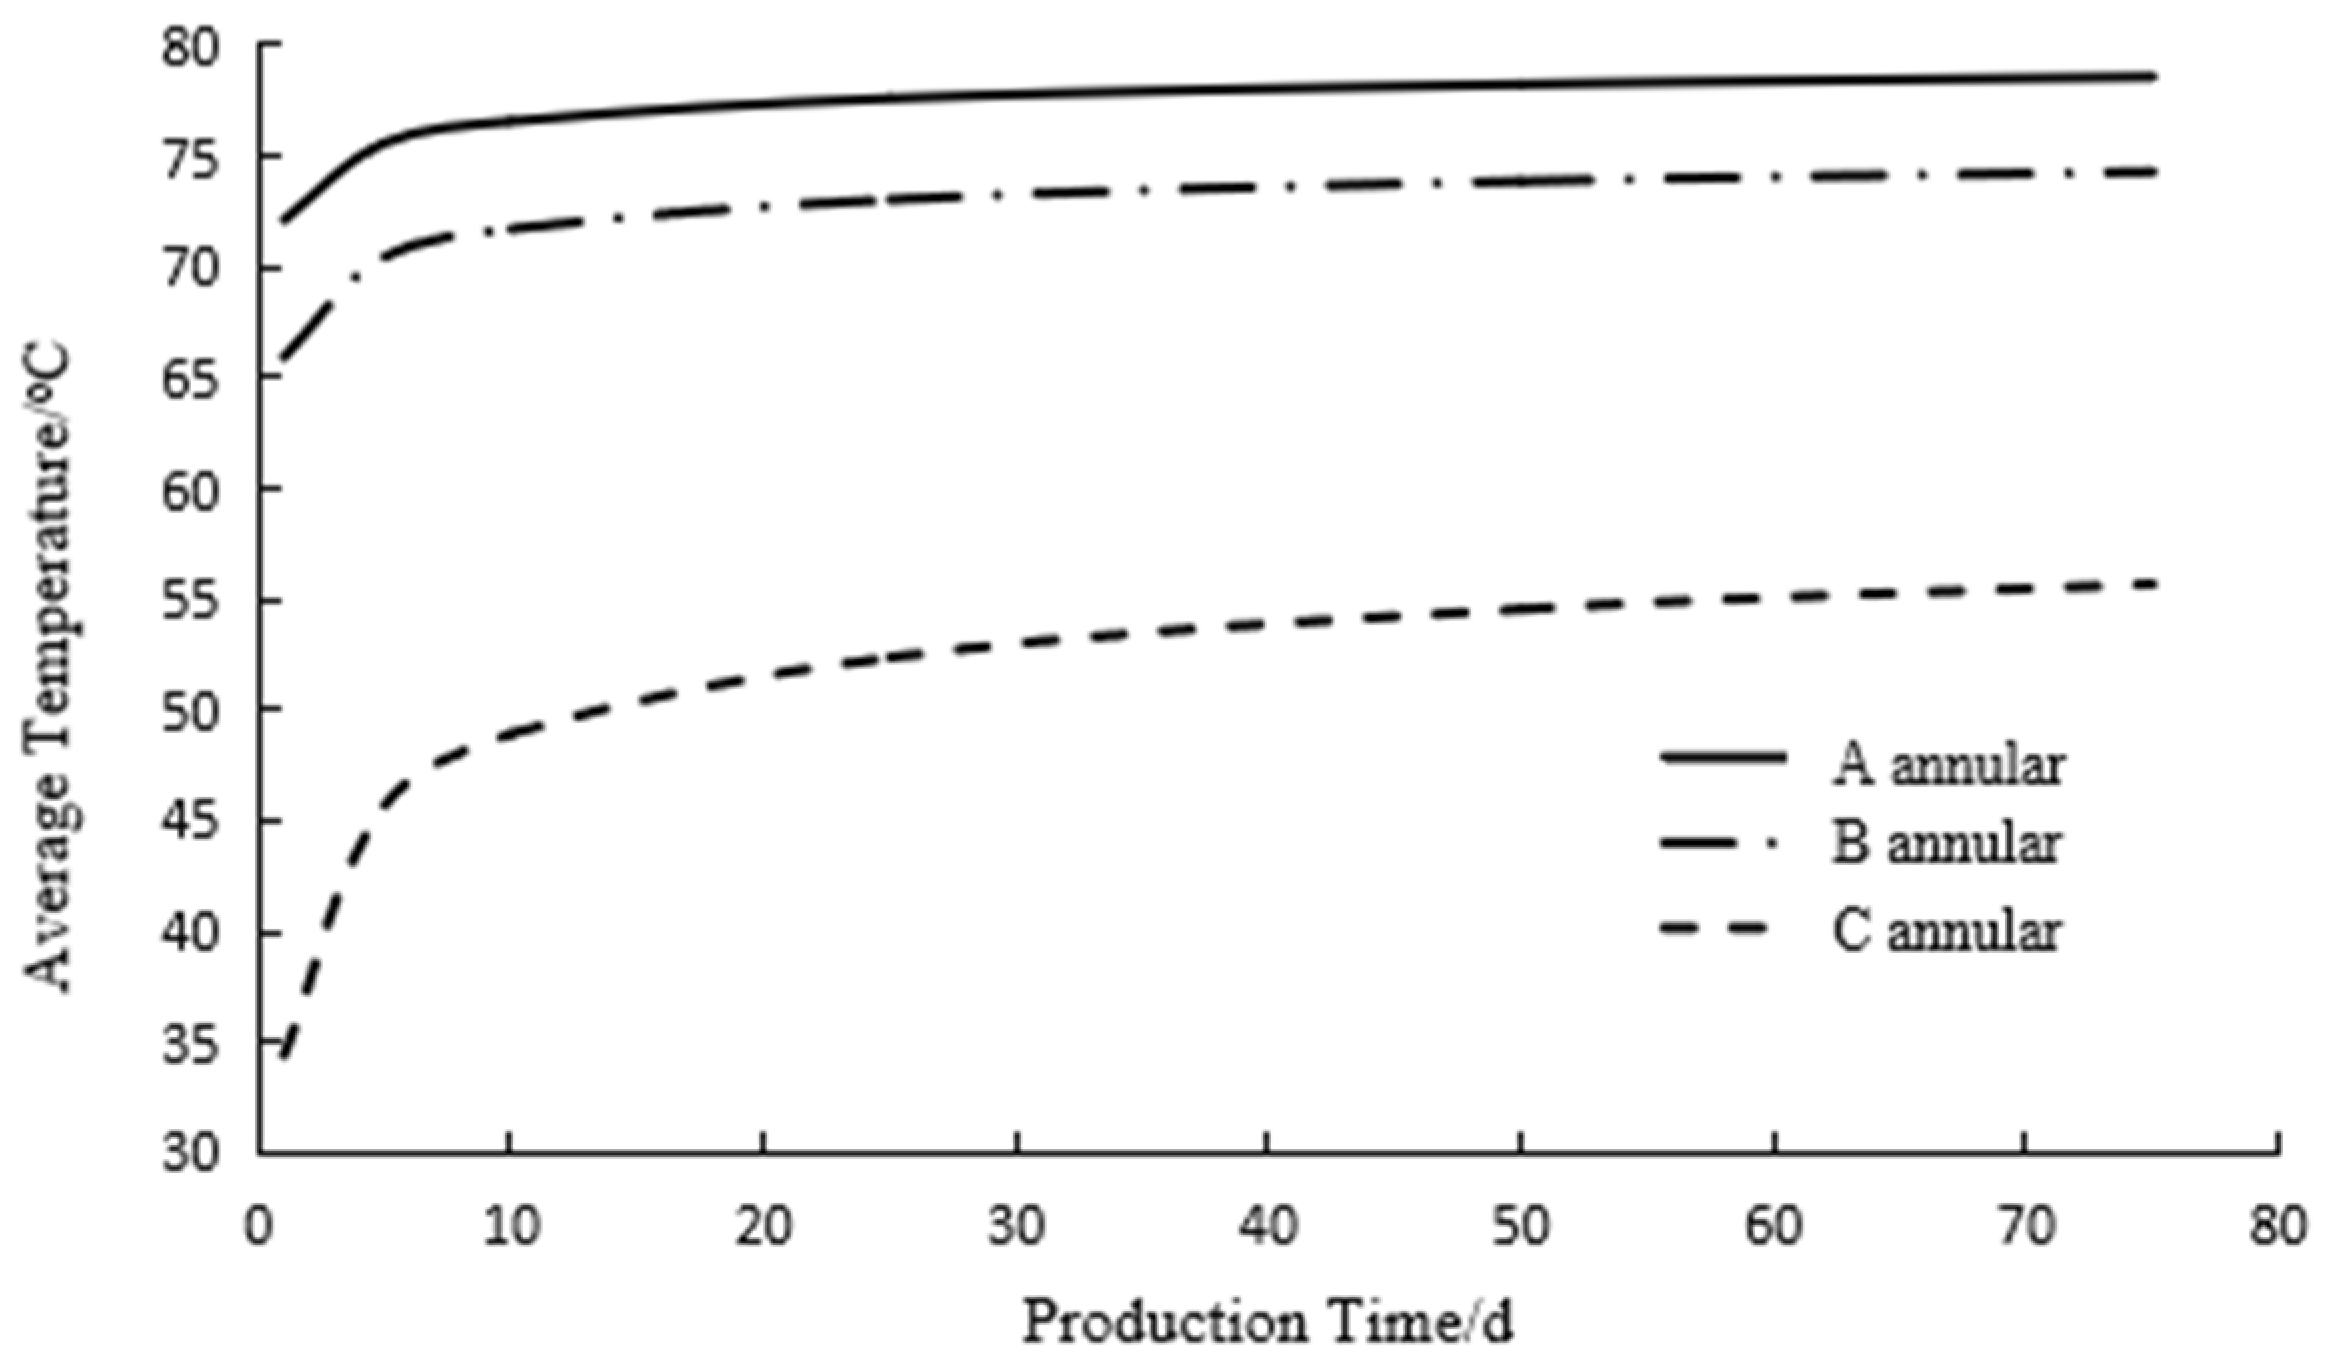
Figure 13. The increase in temperature is the main factor causing annulus pressure buildup, and the annulus pressure buildup increases as the temperature rises. The temperature profile of the annular fluid is related to the production rate and production time of oil and gas wells. As shown in
Figure 11, the temperature of the annular fluid increased rapidly in the early stage of production, then slowly increased and finally stabilized. The temperature of the annular fluid changed significantly in the early stage of production. The temperature profile of the annular fluid slowly increased with the production of oil and gas wells, as shown in
Figure 14.
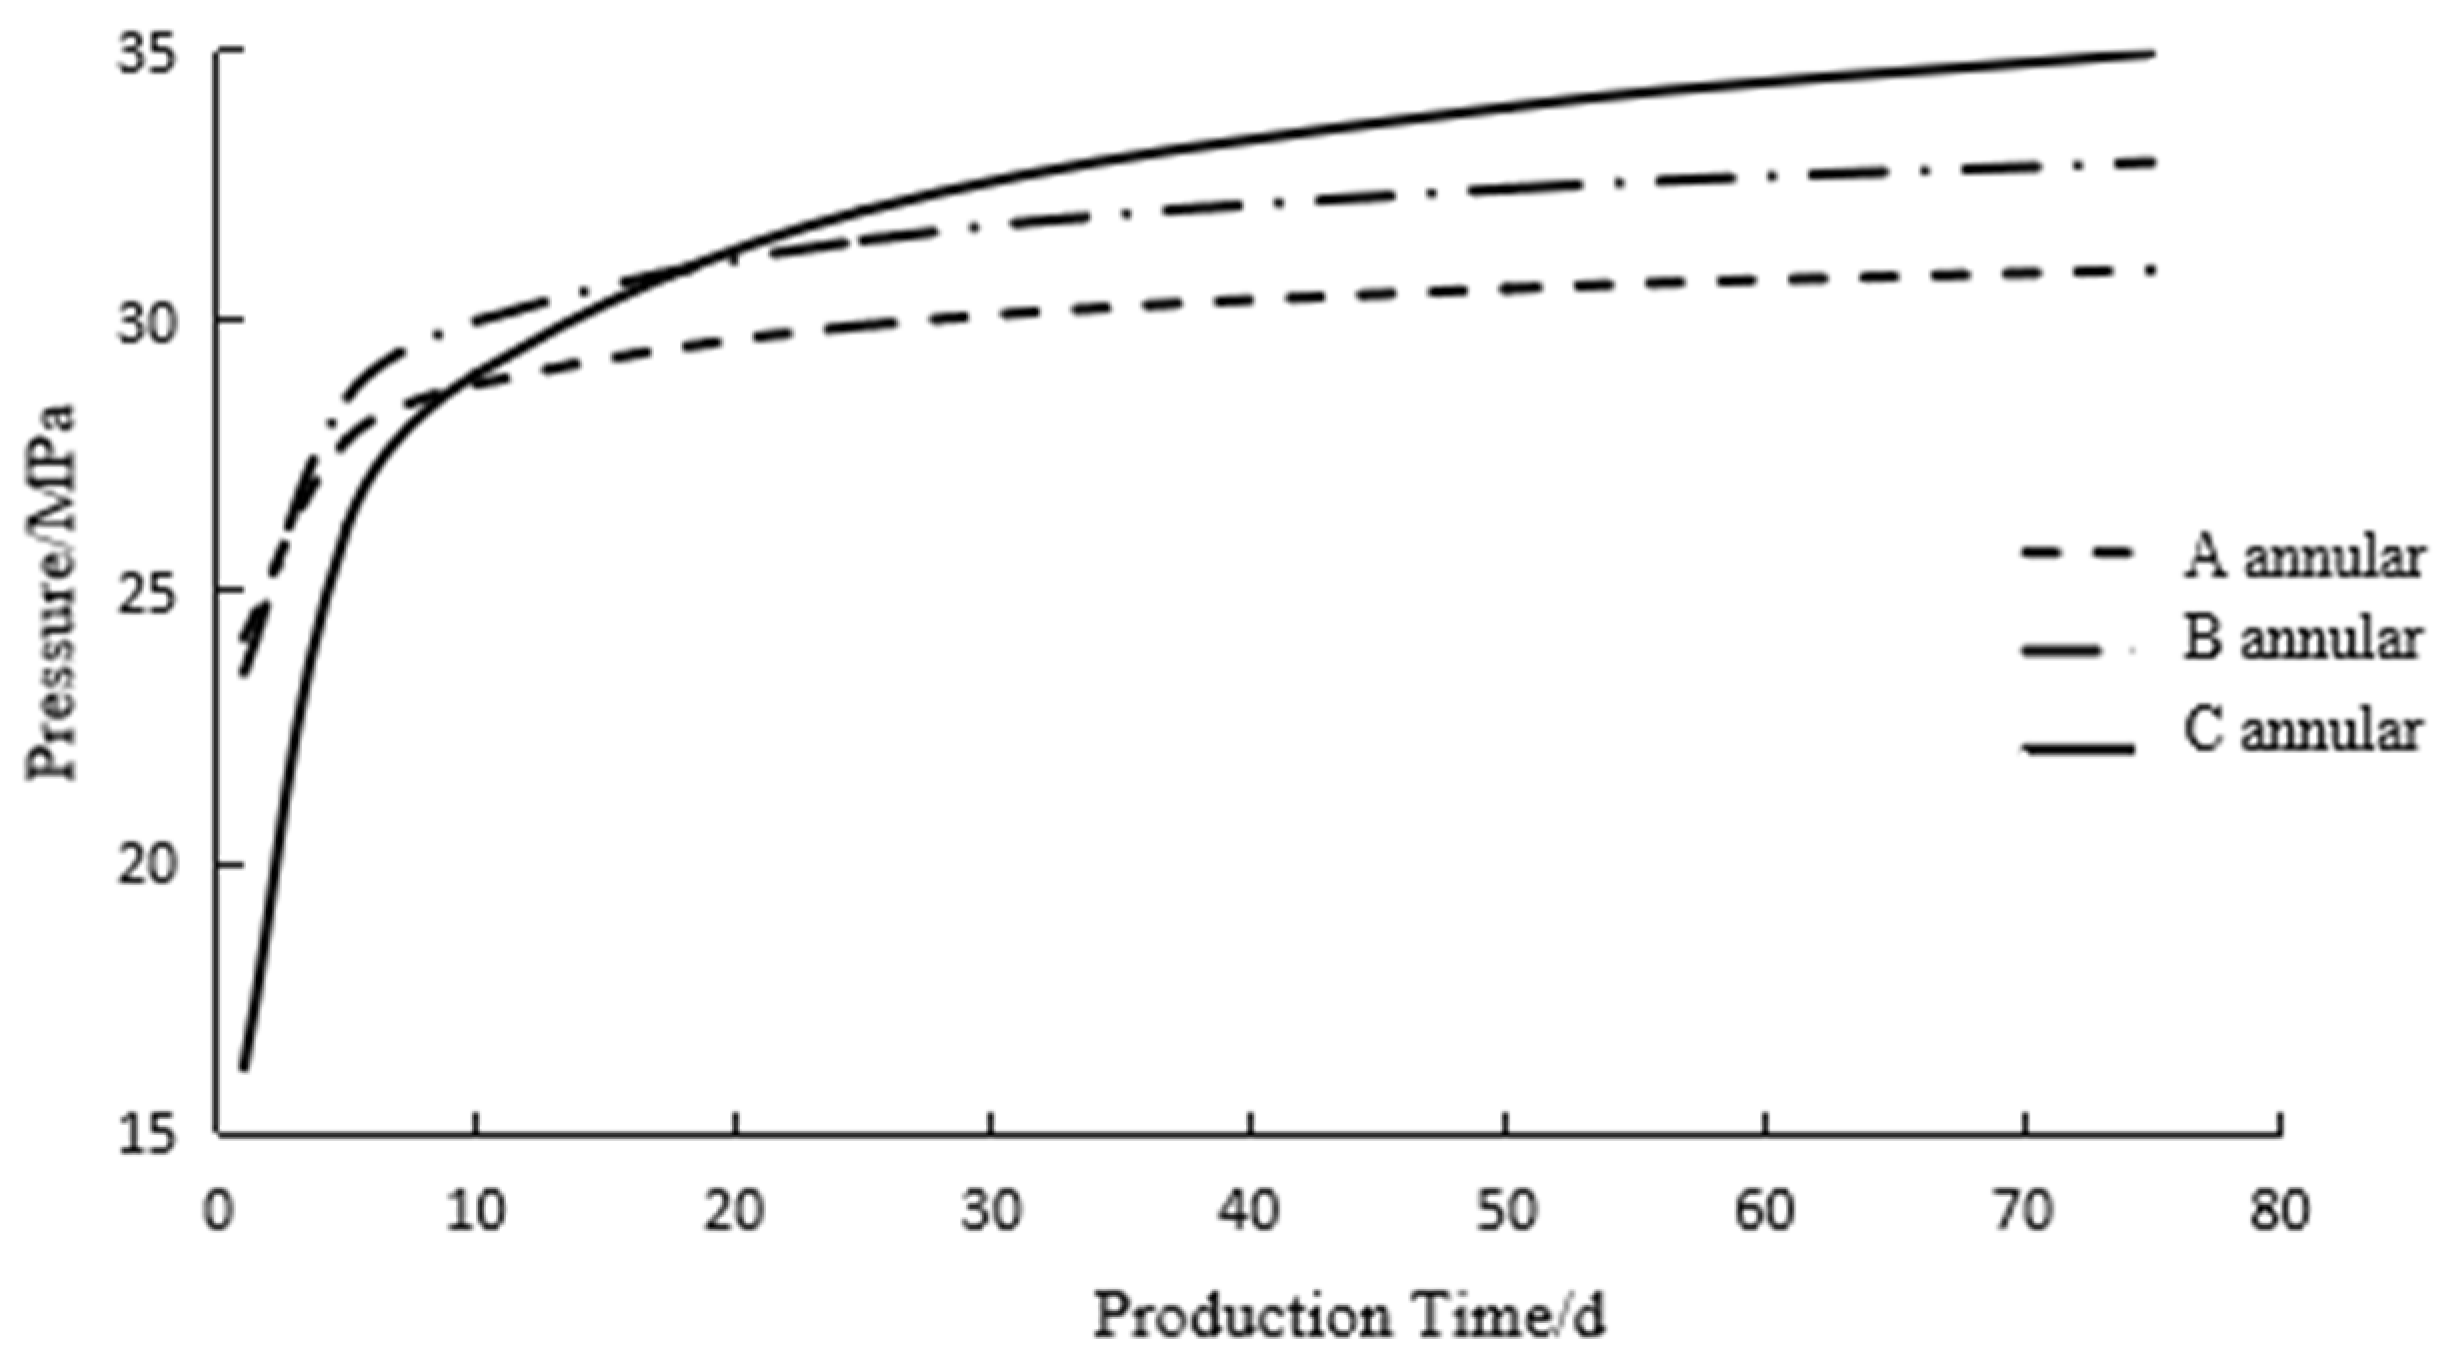
In the early stage of production, due to the unstable temperature distribution in the wellbore, there were significant changes in annulus pressure buildup, as shown in
Figure 15. Within the first 20 days of production, the pressure in the B annulus was the highest. As the temperature gradually stabilized due to the location of the C annulus fluid at the wellhead, the average temperature of the annulus fluid changed greatly, and the C annulus pressure was the highest. Although the fluid temperature in the A annulus was the highest, the temperature change in the A annulus was minimal, resulting in the lowest pressure formed in the A annulus.
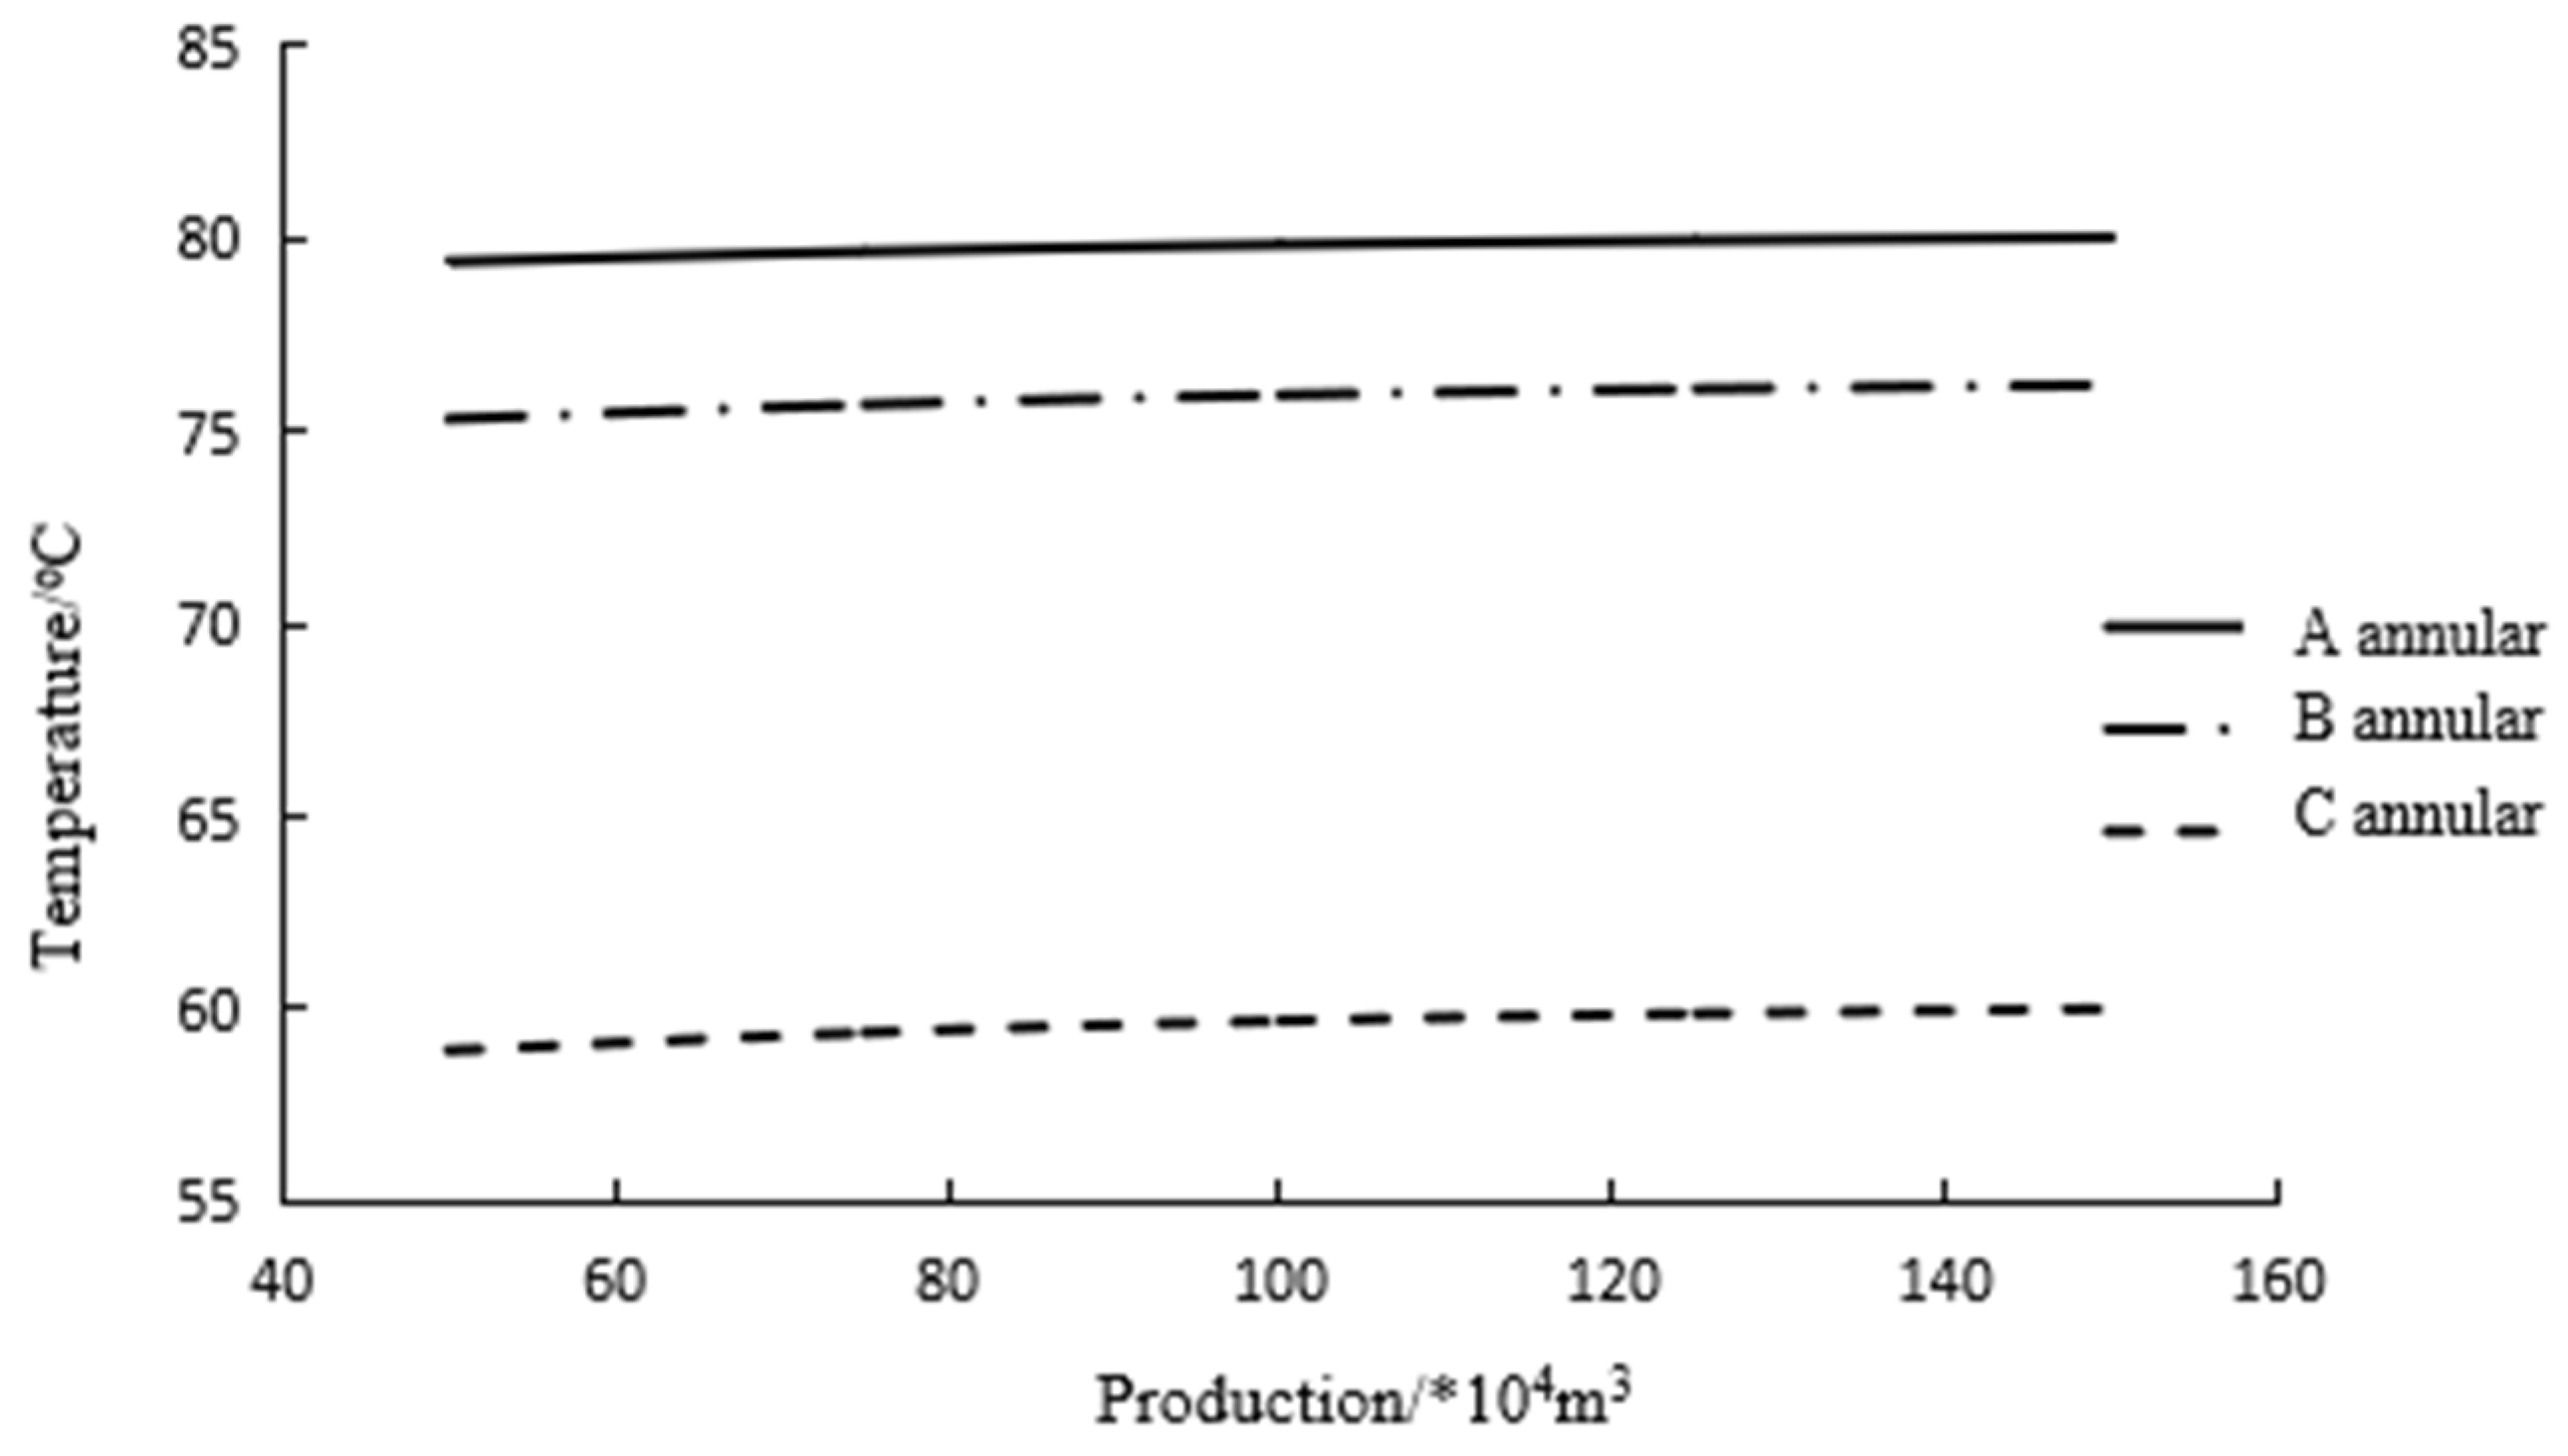
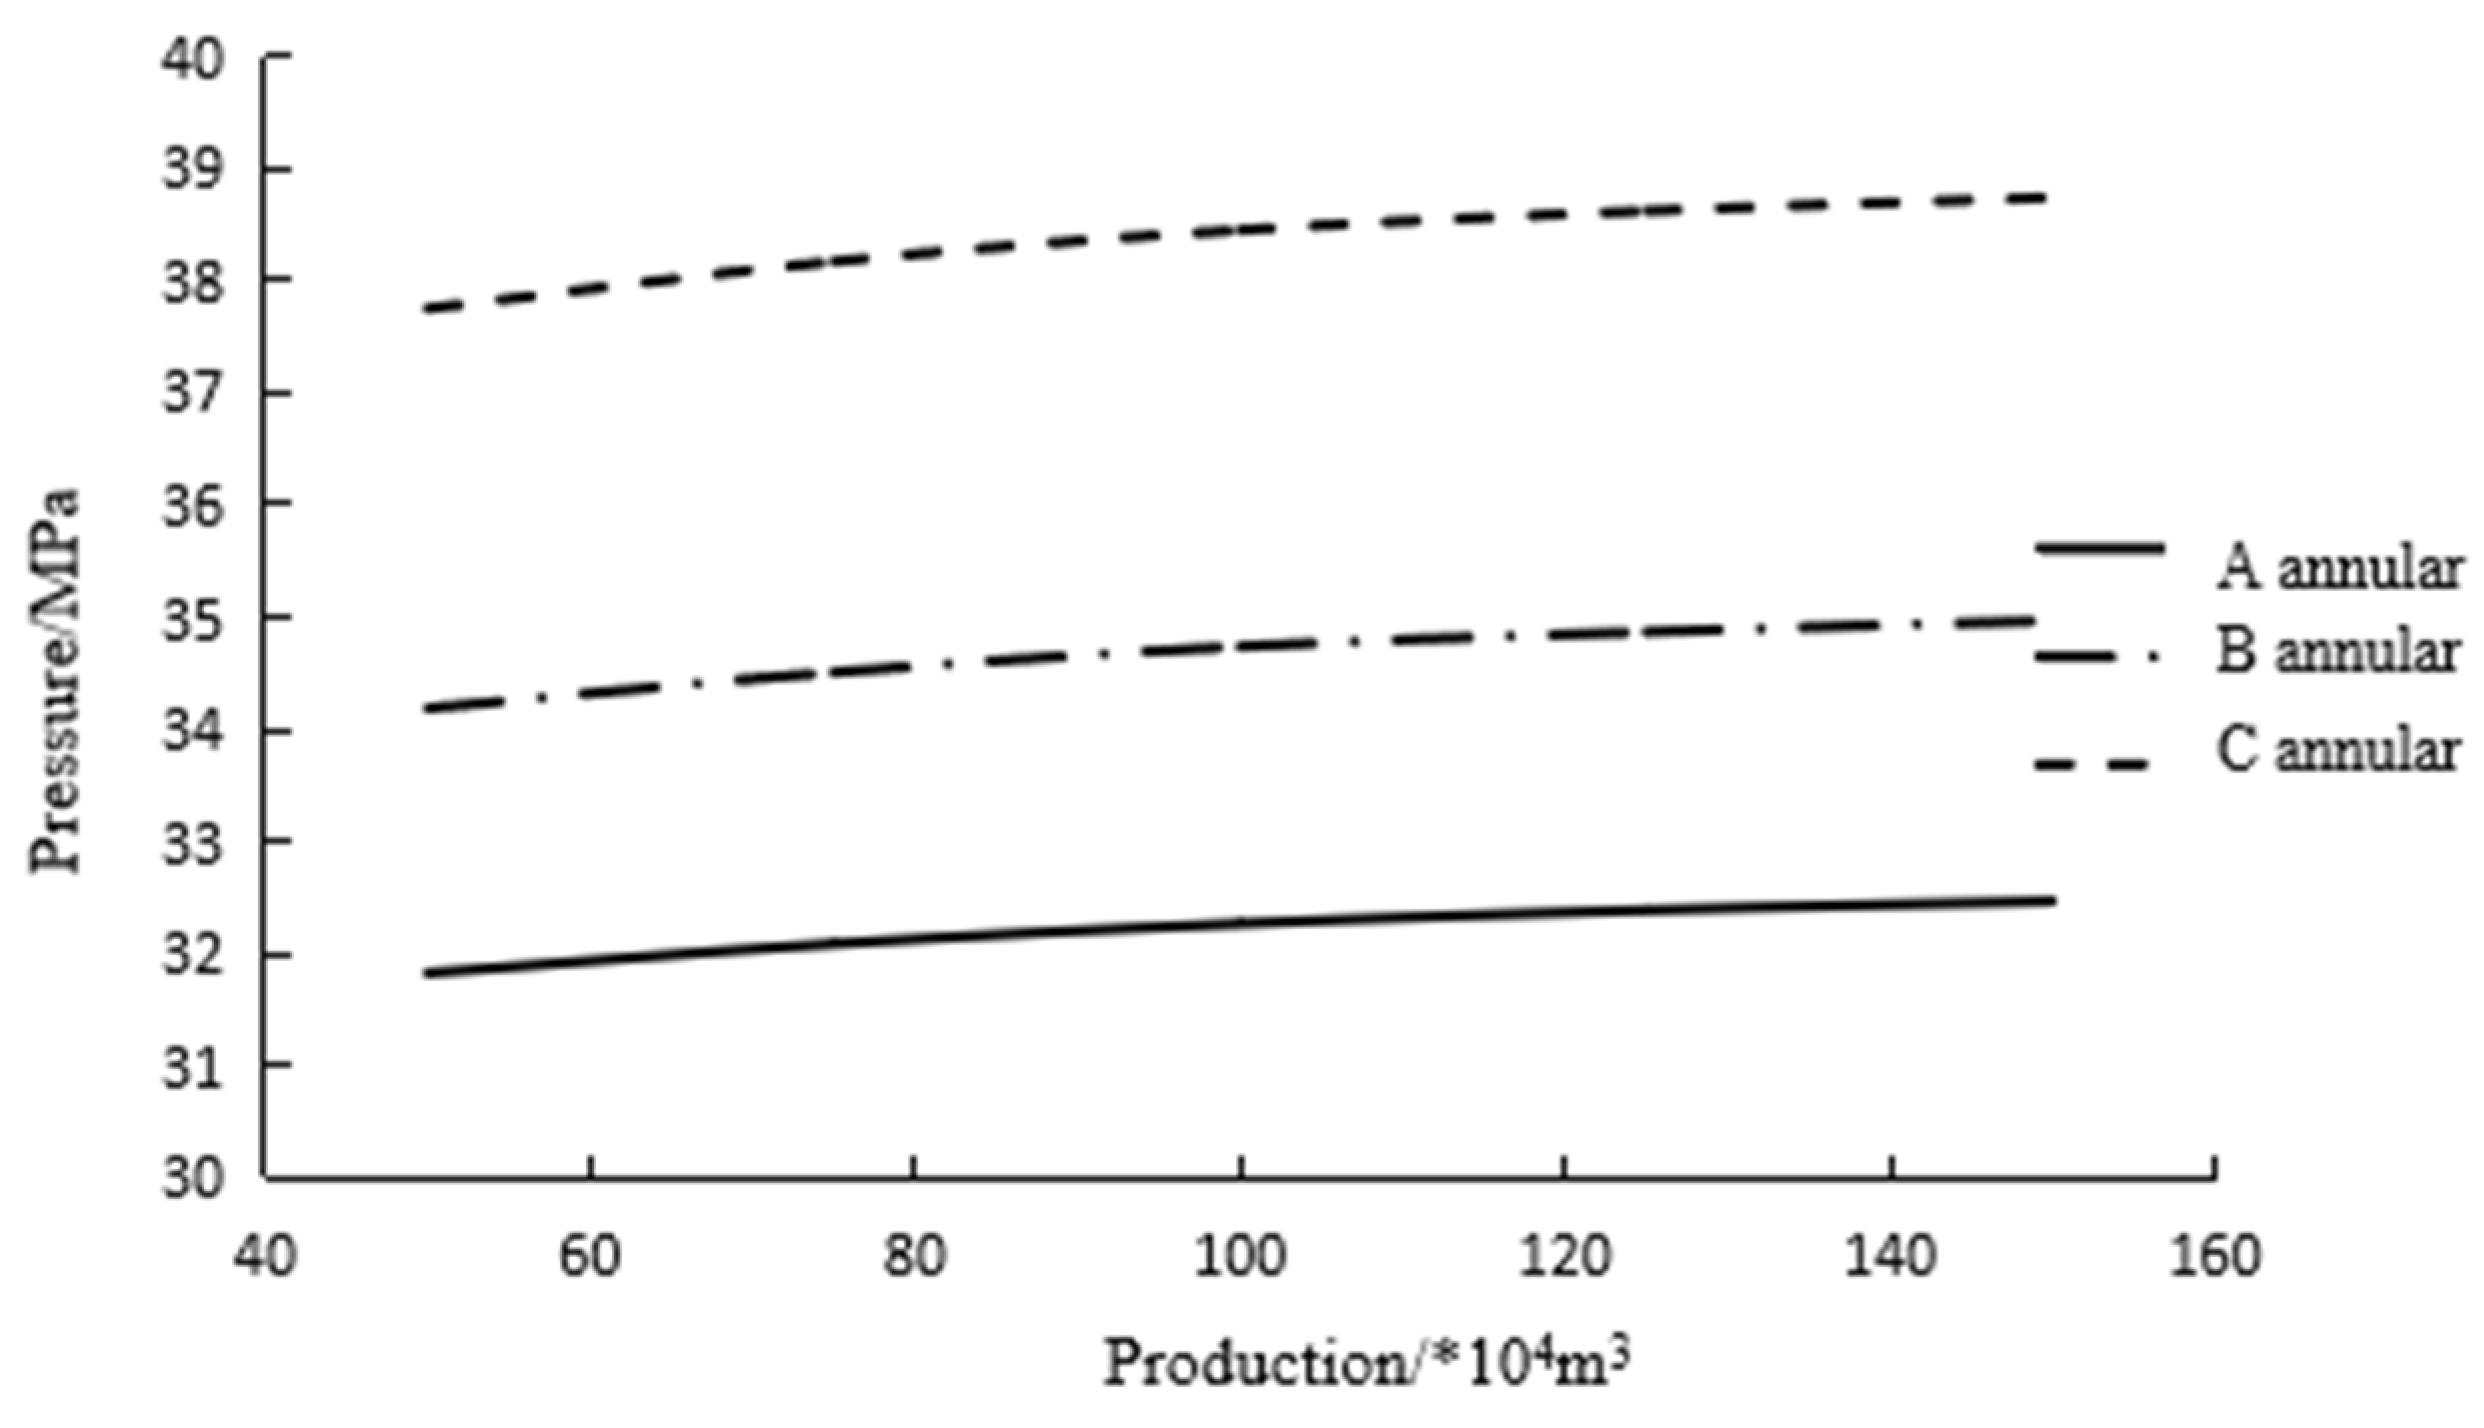
With the increase in wellbore production, the annular pressure gradually increased. Due to the maximum temperature change in the C annulus, the annular pressure was the highest, while the temperature change in the A annulus was the smallest, and the annular pressure was the smallest, as shown in
Figure 16.
7.2. Thermal Properties Parameters of Drilling Fluid
The expansion coefficient and compression coefficient of the annular fluid vary with different temperatures.
Table 3 shows the expansion coefficient and compression coefficient of the annular fluid at different temperatures. As the temperature of the annular fluid increased from 34.42 °C to 55.71 °C, both the expansion coefficient and compression coefficient of the fluid increased with temperature, and the increase in the expansion coefficient was greater than that of the compression coefficient. In the process of calculating the pressure, the expansion coefficient and compression coefficient should be selected according to different temperatures. Using a constant coefficient may lead to significant errors.
Figure 17 shows the annular pressure calculated using the expansion coefficient and compression coefficient, which vary with temperature, as well as a constant coefficient. The constant coefficient was used for the expansion coefficient and the compression coefficient at 55.71 °C, and the maximum error of the annular pressure calculated using the constant coefficient was 11.58%.
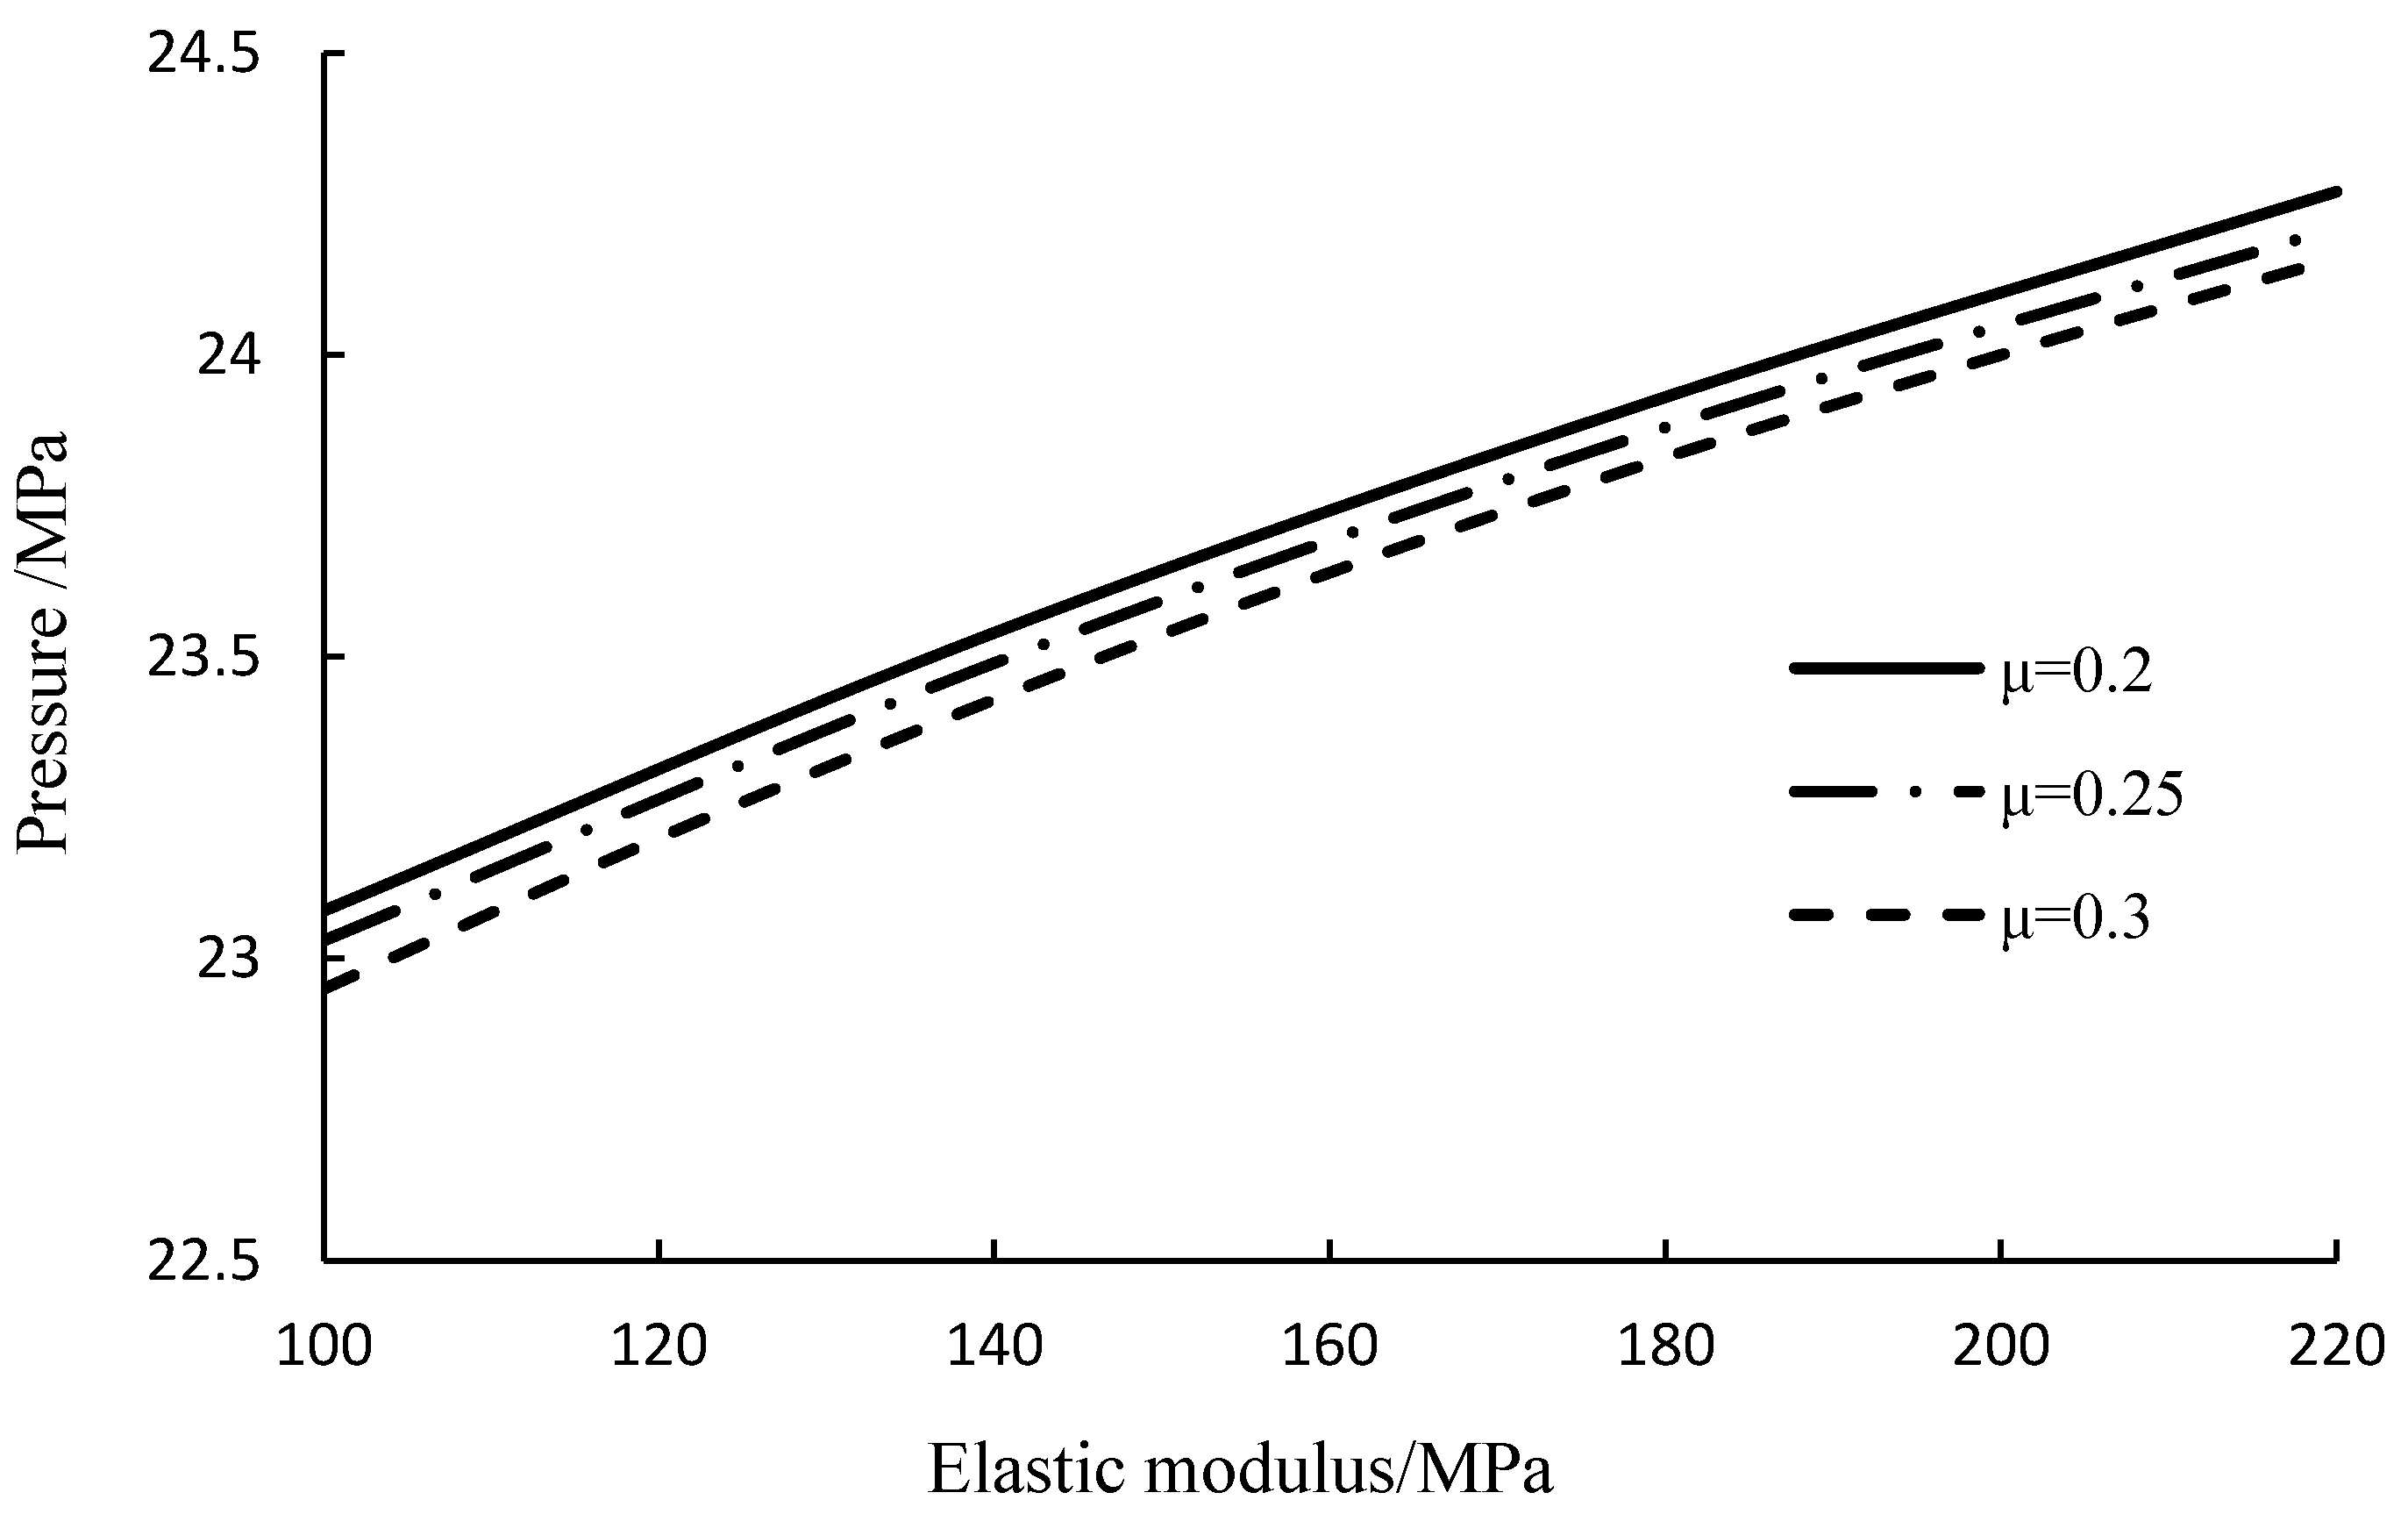
7.3. Casing Parameters
The elastic modulus of the casing varies with temperature, and different types of pipes experience varying changes in elastic modulus due to temperature fluctuations. These changes have an impact on the radial deformation of the casing and the volume change of the annulus, thereby affecting the annulus pressure.
Table 4 shows the elastic modulus of three common types of pipes at different temperatures. Similarly, Poisson’s ratio and elastic modulus can also affect casing deformation and annulus pressure.
As shown in
Figure 18, annulus pressure increased linearly and rapidly with the increase in casing elastic modulus. On the contrary, the higher the Poisson’s ratio, the lower the annular pressure, but the smaller the variation of annular pressure.
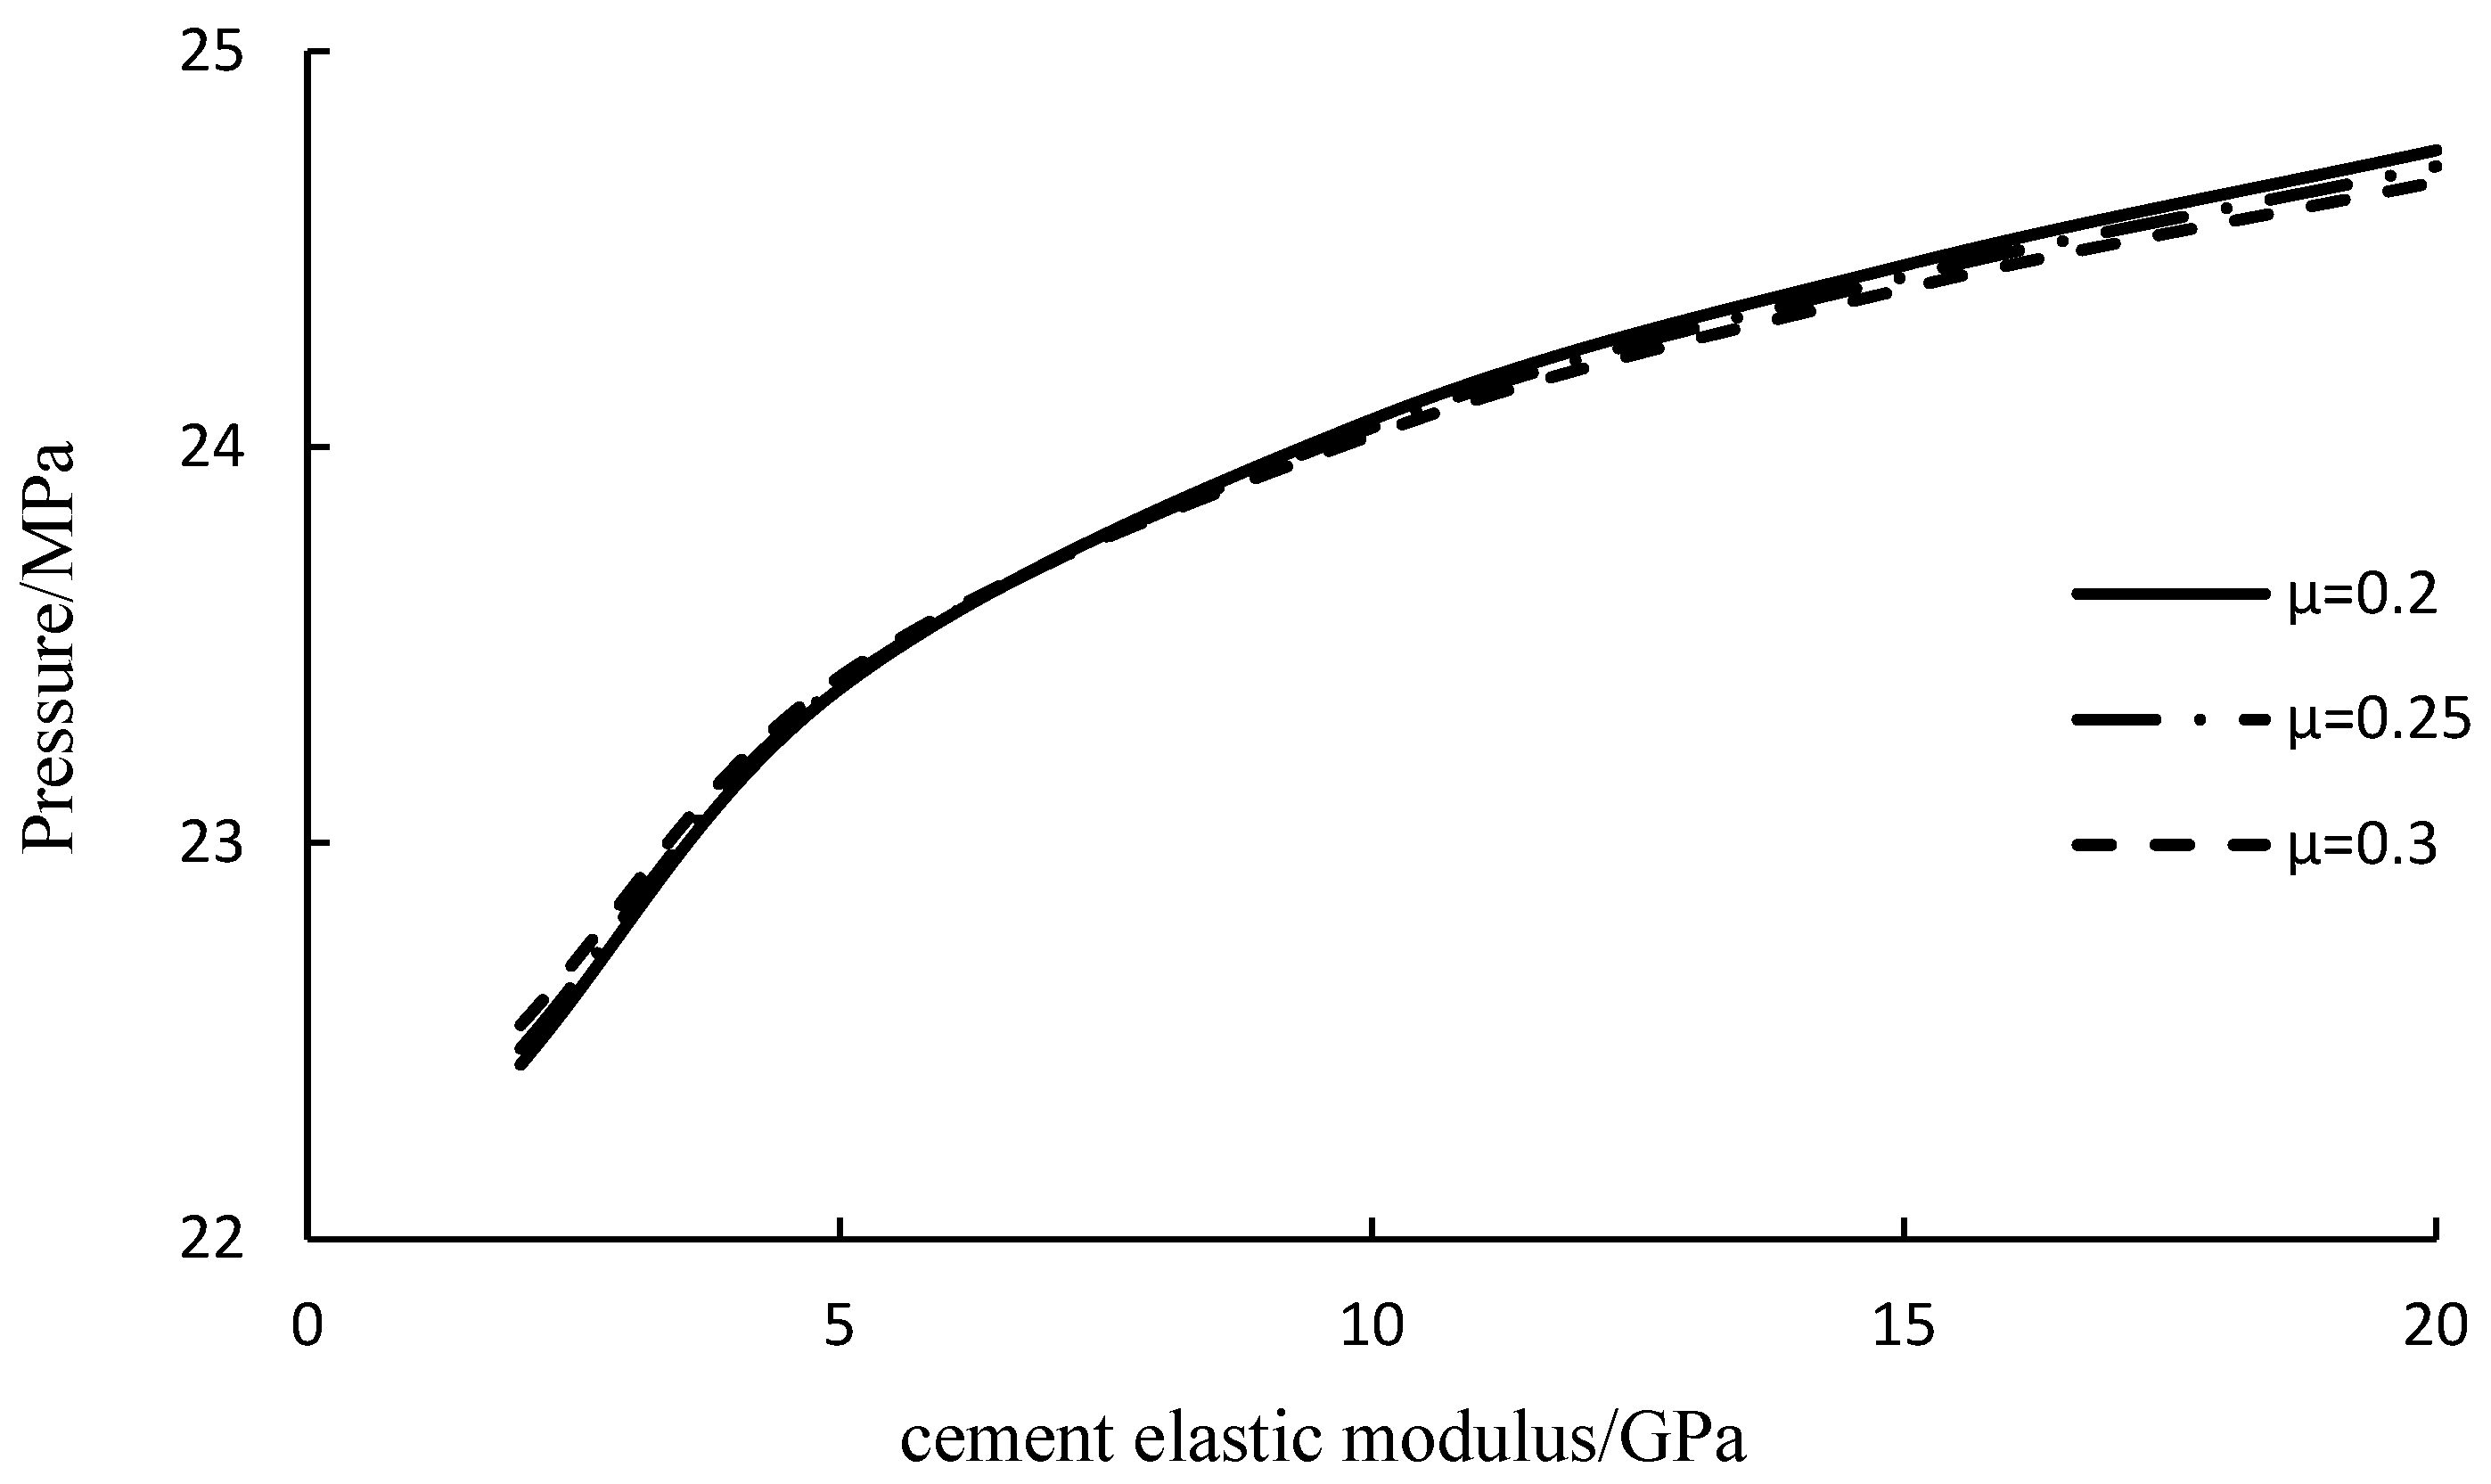
7.4. Cement Sheath
As shown in
Figure 19, the larger the elastic modulus of the cement sheath, the smaller the radial displacement of the sealing section casing under compressive and thermal loads. This results in a smaller change in annular volume, leading to a higher pressure. The Poisson’s ratio of the cement sheath had a smaller impact on the annular pressure.
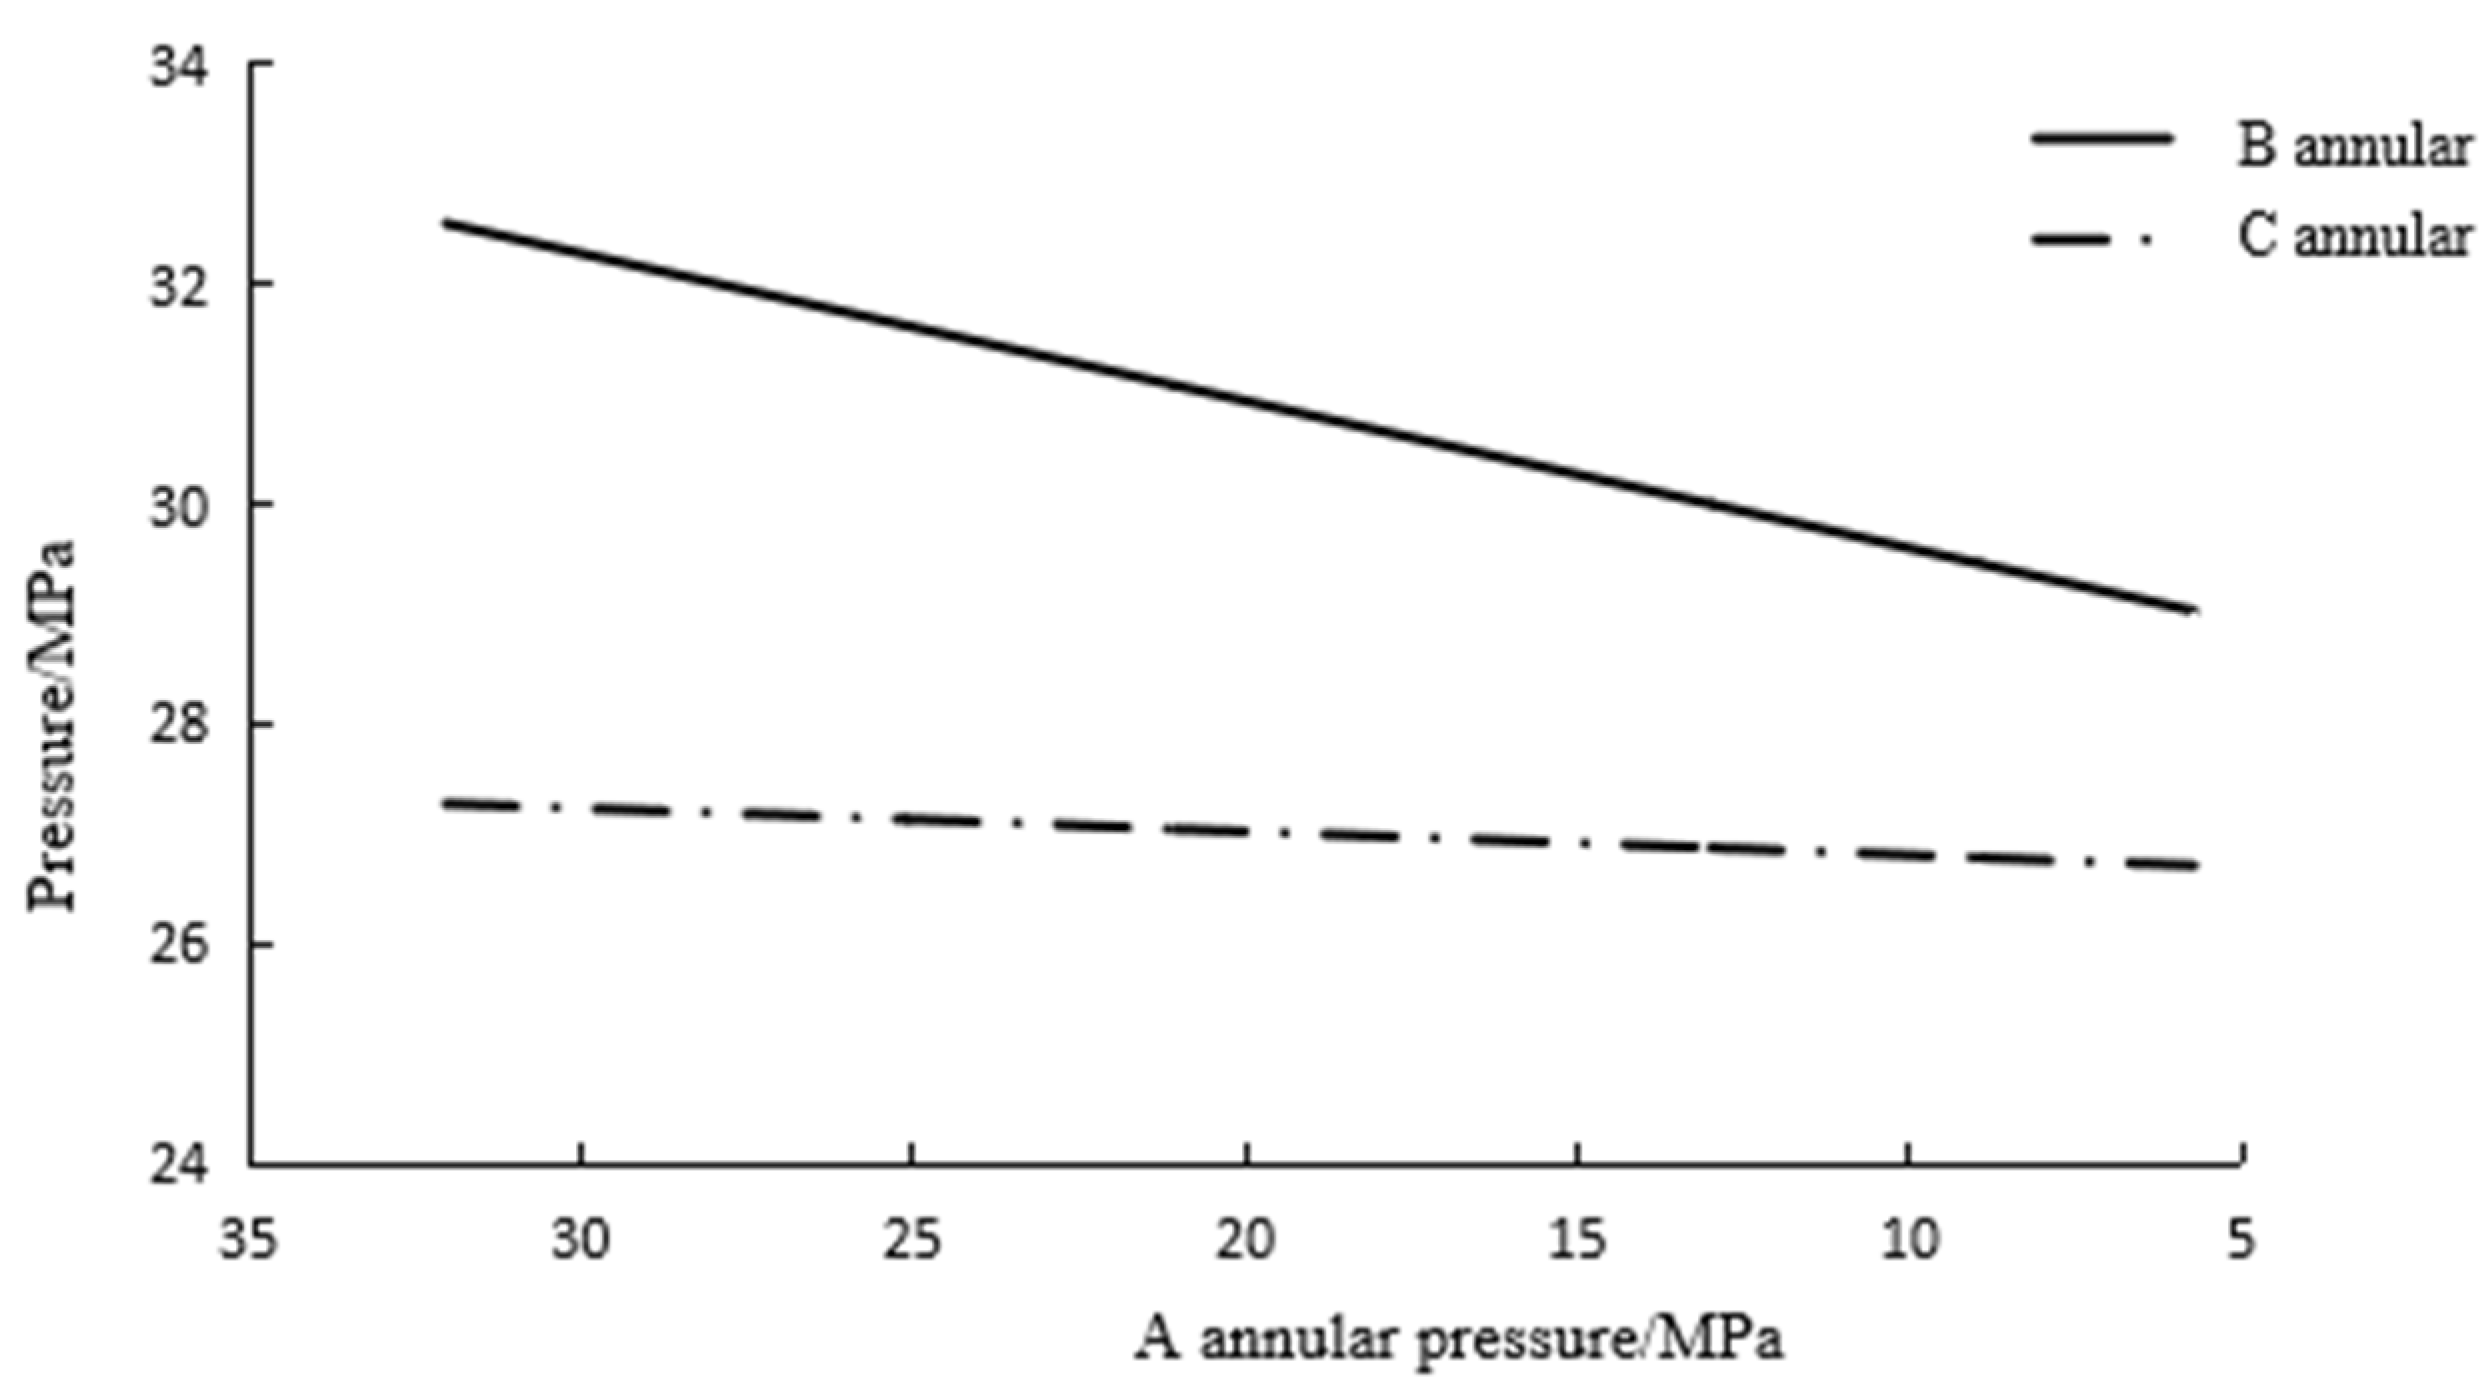
7.5. Release of Annular Pressure
In deepwater oil and gas wells, the special structure of the wellhead device only allows the A annulus pressure to be released through the wellhead pressure relief valve, while the B and C annulus pressure buildup cannot be released through the wellhead. Due to the mutual influence of A, B, and C annulus pressure buildup, when A annulus is depressurized, the B and C annulus pressure buildup would be affected correspondingly.
Figure 20 shows the effect of the A annulus on the annulus pressure buildup of the B and C annulus during pressure release. When the A annulus was depressurized, the annulus pressure buildup in the B and C annulus decreased, and the annular pressure buildup in the B annulus decreased faster.
8. Conclusions
Based on elastic deformation theory, a new deformation model of the casing sealing section is established, and a new prediction method for multi-string annular pressure buildup is developed. The annular pressure buildup predicted by considering the deformation of the casing sealing section is about 13% lower than that predicted by not considering this factor, which is closer to the measured value. Based on the obtained results, the following conclusions can be drawn.
(1) The annular pressure increases with the increase in the elastic modulus of the casing while decreasing with the increase in Poisson’s ratio.
(2) Based on elastic deformation theory, the deformation model of the casing sealing section is established, and the prediction method of multi-string annular pressure buildup is improved. The predicted annular pressure buildup value considering casing sealing section deformation is about 13% lower than that without considering this factor. This also shows that the predicted annular pressure buildup value considering casing sealing section deformation is lower than that without considering casing sealing section deformation and is more consistent with reality.
(3) Temperature rise is the most important factor causing the annular pressure buildup, and the annulus pressure buildup increases with the increase in temperature. The annular fluid temperature profile is related to oil and gas well production and production time. The annulus fluid temperature increases rapidly at the initial stage of production, then slowly increases and finally becomes stable. The annular fluid temperature profile increases slowly with the increase in oil and gas production.
(4) Reducing the pressure in the A annulus also releases the annulus pressure buildup in the B and C annulus, while the annulus pressure buildup in the B annulus decreases faster.
Author Contributions
Conceptualization, R.X. and L.Z.; methodology, R.X.; software, R.X.; validation, R.X. and L.Z.; formal analysis, R.X.; investigation, R.X.; resources, L.Z.; data curation, R.X.; writing—original draft preparation, R.X.; writing—review and editing, L.Z.; visualization, R.X.; supervision, L.Z.; project administration, R.X.; funding acquisition, R.X. All authors have read and agreed to the published version of the manuscript.
Funding
This work is supported by the Major technology projects of China National Offshore Oil Corporation Limited (KJGG-2022-17-05).
Institutional Review Board Statement
Not applicable.
Informed Consent Statement
Not applicable.
Data Availability Statement
The original contributions presented in the study are included in the article, further inquiries can be directed to the corresponding author.
Conflicts of Interest
Author Renjun Xie was employed by the company CNOOC Research Institute Ltd. The remaining authors declare that the research was conducted in the absence of any commercial or financial relationships that could be construed as a potential conflict of interest. The authors declare that this study received funding from China National Off-shore Oil Corporation Limited. The funder was not involved in the study design, collection, analysis, interpretation of data, the writing of this article or the decision to submit it for publication.
References
- Mainguy, M.; Innes, R. Explaining sustained “A”-annulus pressure in major north sea high-pressure/high-temperature fields. SPE Drill. Complet. 2019, 34, 71–80. [Google Scholar] [CrossRef]
- Sathuvalli, U.B.; Pilko, R.M.; Gonzalez, R.A.; Pai, R.M.; Sachdeva, P.; Suryanarayana, P.V. Design and performance of annular-pressure-buildup mitigation techniques. SPE Drill. Complet. 2017, 32, 168–183. [Google Scholar] [CrossRef]
- Ma, T.; Tang, Y.; Chen, P.; He, Y. Mitigation of annular pressure buildup for deepwater wells using a recovery relief method. Energy Sci. Eng. 2019, 7, 1727–1747. [Google Scholar] [CrossRef]
- da Veiga, A.P.; Martins, I.O.; Barcelos, J.G.; Ferreira, M.V.D.; Alves, E.B.; da Silva, A.K.; Hasan, A.R.; Barbosa, J.R., Jr. Predicting thermal expansion pressure buildup in a deepwater oil well with an annulus partially filled with nitrogen. J. Pet. Sci. Eng. 2022, 208, 109275. [Google Scholar] [CrossRef]
- Liu, Z.C.; Samuel, R.; Gonzales, A.; Kang, Y.F. Modeling and simulation of annular pressure buildup APB management using syntactic foam in HP/HT deepwater wells. In Proceedings of the SPE Deepwater Drilling and Completions Conference, Galveston, TX, USA, 14–15 September 2016; SPE: Richardson, TX, USA, 2016. [Google Scholar]
- Azzola, J.H.; Tselepidakis, D.; Pattillo, P.D.; Richey, J.F.; Tinker, S.J.; Miller, R.; Segreto, S.J. Application of Vacuum–Insulated Tubing to Mitigate Annular Pressure Buildup. SPE Drill. Complet. 2007, 22, 46–51. [Google Scholar] [CrossRef]
- Mwang’Ande, A.W.; Liao, H.; Zeng, L. Mitigation of annulus pressure buildup in offshore gas wells by determination of top of cement. J. Energy Resour. Technol. 2019, 141, 102901. [Google Scholar] [CrossRef]
- Guan, Z.-C.; Zhang, B.; Wang, Q.; Liu, Y.-W.; Xu, Y.-Q.; Zhang, Q. Design of thermal-insulated pipes applied in deepwater well to mitigate annular pressure build-up. Appl. Therm. Eng. 2016, 98, 129–136. [Google Scholar] [CrossRef]
- Bradford, D.W.; Fritchie, D.G.; Gibson, D.H.; Gosch, S.W.; Pattillo, P.D.; Sharp, J.W.; Taylor, C.E. Marlin Failure Analysis and Redesign; Part 1—Description of Failure. In Proceedings of the IADC/SPE Drilling Conference, Dallas, TX, USA, 26–28 February 2002. SPE 74528. [Google Scholar]
- Ellis, R.C.; Fritchie, D.G.; Gibson, D.H.; Gosch, S.W.; Pattillo, P.D. Marlin Failure Analysis and Redesign; Part 2—Redesign. In Proceedings of the IADC/SPE Drilling Conference, Dallas, TX, USA, 26–28 February 2002. SPE 74529. [Google Scholar]
- Gosch, S.W.; Horne, D.J.; Pattillo, P.D.; Sharp, J.W.; Shah, P.C. Marlin Failure Analysis and Redesign; Part 3—VIT Completion with Real-Time Monitoring. In Proceedings of the IADC/SPE Drilling Conference, Dallas, TX, USA, 26–28 February 2002. SPE 74530. [Google Scholar]
- Vargo, R.F., Jr.; Payne, M.; Faul, R.; LeBlanc, J.; Griffith, J.E. Practical and Successful Prevention of Annular Pressure Buildup on the Marlin Project. In Proceedings of the SPE Annual Technical Conference and Exhibition, San Antonio, TX, USA, 29 September–2 October 2002. SPE 77473. [Google Scholar]
- Pattillo, P.D.; Cocales, B.W.; Morey, S.C. Analysis of an annular pressure buildup failure during drill ahead. SPE Drill. Complet. 2006, 21, 242–247. [Google Scholar] [CrossRef]
- Ansari, M.T. Evaluation of Annular Pressure Buildup (APB) During WCD Blowout of Deepwater Hp/Ht Wells. Master’s Thesis, Texas A&M University, College Station, TX, USA, 2014. [Google Scholar]
- Adams, A. How to Design for Annulus Fluid Heat-Up. In Proceedings of the SPE Annual Technical Conference and Exhibition, Dallas, TX, USA, 6–9 October 1991. SPE 22871. [Google Scholar]
- Goodman, M.A.; Halal, A.S. Case study: HPHT casing design achieved with multistring analysis. In Proceedings of the SPE Annual Technical Conference and Exhibition, Houston, TX, USA, 3–6 October 1993. SPE 26322. [Google Scholar]
- Halal, A.S.; Mitchell, R.F. Casing design for trapped annular pressure buildup. SPE Drill. Complet. 1994, 9, 107–114. [Google Scholar] [CrossRef]
- Lubinski, A.; Althouse, W.S.; Logan, J.L. Helical buckling of tubing sealed in packers. J. Pet. Technol. 1962, 14, 655–670. [Google Scholar] [CrossRef]
- Klementich, E.F.; Jellison, M.J. A service life model for casing strings. SPE Drill. Eng. 1986, 1, 141–152. [Google Scholar] [CrossRef]
- Oudeman, P.; Bacarreza, L.J. Field Trial Results of Annular Pressure Behavior in a High-Pressure/High-Temperature Well. SPE Drill. Complet. 1995, 10, 1084–1088. [Google Scholar] [CrossRef]
- Maiti, S.; Gupta, H.; Vyas, A.; Kulkarni, S.D. Evaluating precision of annular pressure buildup (APB) estimation using machine-learning tools. SPE Drill. Complet. 2022, 37, 93–103. [Google Scholar] [CrossRef]
- Oudeman, P.; Kerem, M. Transient behavior of annular pressure build-up in HP/HT wells. SPE Drill. Complet. 2006, 21, 234–241. [Google Scholar] [CrossRef]
- Hasan, A.R.; Izgec, B.; Kabir, C.S. Sustaining production by managing annular-pressure buildup. SPE Prod. Oper. 2010, 25, 195–203. [Google Scholar] [CrossRef]
- Yin, F.; Gao, D.L. Improved calculation of multiple annuli pressure buildup in subsea HPHT wells. In Proceedings of the IADC/SPE Asia Pacific Drilling Technology Conference, Bangkok, Thailand, 25–27 August 2014; SPE: Richardson, TX, USA, 2014. [Google Scholar]
- Kang, Y.; Gonzales, A.; Liu, Z.; Samuel, R. Modeling and Simulation of Annular Pressure Buildup APB in a Deepwater Wellbore with Vacuum-Insulated Tubing. In Proceedings of the SPE/IADC Drilling Conference and Exhibition, The Hague, The Netherlands, 14–16 March 2017; SPE: Richardson, TX, USA, 2017. [Google Scholar]
- Moe, B.; Erpelding, P. Annular Pressure Buildup: What Is It and What to do About It. Deep. Technol. 2000, 21, 2–4. [Google Scholar]
- Deng, Y.; Chen, P.; Zhang, H. Iterative method for calculating confined annular pressure in oil and gas wells. Offshore Oil 2006, 26, 93–96. [Google Scholar]
- Huang, X.; Yan, D.; Tian, R. Analysis of deepwater casing annular-void ring closure pressure calculation and control technology. China Offshore Oil Gas 2014, 26, 65–69. [Google Scholar]
- Liu, J.; Fan, H.; Peng, Q.; Deng, S.; Kang, B.; Ren, W. Research on the prediction model of annular pressure buildup in subsea wells. J. Nat. Gas Sci. Eng. 2015, 27, 1677–1683. [Google Scholar] [CrossRef]
- Wang, H.; Zhang, H.; Li, J.; Sun, T. Study on annular pressure buildup phenomenon in subsea wells considering the effect of cement. Energy Sci. Eng. 2022, 10, 81–95. [Google Scholar] [CrossRef]
- Gao, D.; Feng, Q.; Zheng, H. On a method of prediction of the annular pressure buildup in deepwater wells for oil & gas. Comput. Model. Eng. Sci. (CMES) 2012, 89, 1–15. [Google Scholar]
- Dong, G.; Chen, P. A review of the evaluation methods and control technologies for trapped annular pressure in deepwater oil and gas wells. J. Nat. Gas Sci. Eng. 2017, 37, 85–105. [Google Scholar] [CrossRef]
Figure 1.
Schematic of single sealed annular pressure buildup.
Figure 1.
Schematic of single sealed annular pressure buildup.
Figure 2.
Schematic diagram of wellbore structure.
Figure 2.
Schematic diagram of wellbore structure.
Figure 3.
Schematic diagram of casing-cement sheath formation system.
Figure 3.
Schematic diagram of casing-cement sheath formation system.
Figure 4.
Wellbore structure diagram.
Figure 4.
Wellbore structure diagram.
Figure 5.
Annular pressure buildup comparison diagram.
Figure 5.
Annular pressure buildup comparison diagram.
Figure 6.
Temperature profile.
Figure 6.
Temperature profile.
Figure 7.
Average temperature and average temperature variation in the annulus.
Figure 7.
Average temperature and average temperature variation in the annulus.
Figure 8.
Temperature profile.
Figure 8.
Temperature profile.
Figure 9.
Average temperature and average temperature variation in the annulus.
Figure 9.
Average temperature and average temperature variation in the annulus.
Figure 10.
Temperature profile.
Figure 10.
Temperature profile.
Figure 11.
Average temperature and average temperature variation in the annulus.
Figure 11.
Average temperature and average temperature variation in the annulus.
Figure 12.
Comparison of measured pressure and temperature with those calculated by model in this paper.
Figure 12.
Comparison of measured pressure and temperature with those calculated by model in this paper.
Figure 13.
Average temperature of the annulus at different production times.
Figure 13.
Average temperature of the annulus at different production times.
Figure 14.
Temperature profile of annulus at different production rates.
Figure 14.
Temperature profile of annulus at different production rates.
Figure 15.
Annular pressure at different production times.
Figure 15.
Annular pressure at different production times.
Figure 16.
Annular pressure at different production rates.
Figure 16.
Annular pressure at different production rates.
Figure 17.
The influence of fluid expansion coefficient and compression coefficient on annular pressure.
Figure 17.
The influence of fluid expansion coefficient and compression coefficient on annular pressure.
Figure 18.
Relationship between elastic modulus of casing and pressure.
Figure 18.
Relationship between elastic modulus of casing and pressure.
Figure 19.
Relationship between elastic modulus of cement sheath and pressure.
Figure 19.
Relationship between elastic modulus of cement sheath and pressure.
Figure 20.
The impact of A annulus pressure release on B and C annulus pressures.
Figure 20.
The impact of A annulus pressure release on B and C annulus pressures.
Table 1.
Well structure.
| Name | OD (in) | Line Weight (lbm/ft) | Depth (ft) | TOC (ft) |
|---|
| Conductor | 30 | 200 | 377 | |
| Surface casing | 20 | 133 | 3025 | 374 |
| Intermediate casing | 13 3/8 | 72 | 8258 | 3525 |
| Productor casing | 9 5/8 | 53.5 | 10,456 | 8000 |
| Liner | 7 | 38 | 11,900 | |
| Tubing | 3 1/2 | 9.2 | 11,000 | |
Table 2.
Comparison between calculated and measured values.
Table 2.
Comparison between calculated and measured values.
Temperature
(°C) | Measured Pressure
(MPa) | Wellcat Calculated Value
(MPa) | Error
(%) | The Calculated Values of This Model (MPa) | Error
(%) |
|---|
| 30 | 10.52 | 13.51 | 28.42 | 11.00 | 4.56 |
| 40 | 17.98 | 23.7 | 31.81 | 19.07 | 6.06 |
| 50 | 21.54 | 28.94 | 34.35 | 23.06 | 7.05 |
Table 3.
Fluid expansion coefficient and compression coefficient at different temperatures.
Table 3.
Fluid expansion coefficient and compression coefficient at different temperatures.
| Average Temperature of the Annulus (°C) | Annular Temperature Difference
(°C) | Expansion Coefficient (×10−6 °C−1) | Compression Coefficient (×10−6 MPa−1) |
|---|
| 34.42 | 16.08 | 355.15 | 451.03 |
| 45.72 | 27.38 | 397.12 | 460.75 |
| 48.94 | 30.6 | 409.09 | 463.52 |
| 52.39 | 34.05 | 421.90 | 466.49 |
| 54.57 | 36.23 | 430.00 | 468.36 |
| 55.71 | 37.37 | 434.24 | 469.34 |
Table 4.
The elastic modulus of the casing varies with temperature.
Table 4.
The elastic modulus of the casing varies with temperature.
| Type of Casing | 20 °C | 200 °C | 250 °C | 300 °C | 350 °C |
|---|
| N80 (MPa) | 205.94 | 165.73 | 149.06 | 136.31 | 117.68 |
| P110 (MPa) | 205.94 | 184.37 | 177.50 | 172.60 | 166.71 |
| TP90H (MPa) | — | 170.75 | 163.25 | 155.75 | 148.25 |
| Disclaimer/Publisher’s Note: The statements, opinions and data contained in all publications are solely those of the individual author(s) and contributor(s) and not of MDPI and/or the editor(s). MDPI and/or the editor(s) disclaim responsibility for any injury to people or property resulting from any ideas, methods, instructions or products referred to in the content. |
© 2024 by the authors. Licensee MDPI, Basel, Switzerland. This article is an open access article distributed under the terms and conditions of the Creative Commons Attribution (CC BY) license (https://creativecommons.org/licenses/by/4.0/).


