Article

The Potential for the Use of Hydrogen Storage in Energy Cooperatives

by
Maciej Sołtysik
1,2,
Mariusz Kozakiewicz
3 and
Jakub Jasiński
4,*
1
Faculty of Electrical Engineering, Częstochowa University of Technology, Armii Krajowej St. 17, 42-200 Częstochowa, Poland
2
Weglokoks Energia Sp. z o.o., Mickiewicza St. 29, 40-085 Katowice, Poland
3
Collegium of Economic Analysis, Warsaw School of Economics, Madalińskiego 6/8 St., 02-513 Warsaw, Poland
4
Institute of Rural and Agricultural Development, Polish Academy of Sciences, 72 Nowy Świat St., 00-330 Warsaw, Poland
*
Author to whom correspondence should be addressed.
Appl. Sci. 2024, 14(21), 9753; https://doi.org/10.3390/app14219753
Submission received: 2 September 2024 / Revised: 18 October 2024 / Accepted: 19 October 2024 / Published: 25 October 2024
(This article belongs to the Section Green Sustainable Science and Technology)

Abstract

:
According to the European Hydrogen Strategy, hydrogen will solve many of the problems with energy storage for balancing variable renewable energy sources (RES) supply and demand. At the same time, we can see increasing popularity of the so-called energy communities (e.g., cooperatives) which (i) enable groups of entities to invest in, manage, and benefit from shared RES energy infrastructure; (ii) are expected to increase the energy independence of local communities from large energy corporations and increase the share of RES. Analyses were conducted on 2000 randomly selected energy cooperatives and four energy cooperatives formed on the basis of actual data. The hypotheses assumed in the research and positively verified in this paper are as follows: (i) there is a relationship between hydrogen storage capacity and the power of RES, which allows an energy community to build energy independence; (ii) the type of RES generating source is meaningful when optimizing hydrogen storage capacity. The paper proves it is possible to build “island energy independence” at the local level using hydrogen storage and the efficiency of the power-to-power chain. The results presented are based on simulations carried out using a dedicated optimization model implemented by mixed integer programming. The authors’ next research projects will focus on optimizing capital expenditures and operating costs using the Levelized Cost of Electricity and Levelized Cost of Hydrogen methodologies.

1. Introduction

Hydrogen storages are an important element of the European hydrogen strategy [1], the renewable energy market [2], and the development of self-sufficiency of local energy communities [3]—Renewable Energy Community [4] and Citizens Energy Community [5]—and so they are strongly promoted in the strategic documents on the development of the energy market in the EU [6,7]. Hydrogen, along with the increasing share of renewable energy sources [8]—(in May 2022, as part of the “RePowerEU” plan following the Russian aggression against Ukraine, the Commission proposed a new amendment (RED III) to accelerate the transition to clean energy in line with the gradual reduction of dependence on Russian fossil fuels. The European Commission proposed installing heat pumps, increasing the capacity of photovoltaic systems, and importing renewable hydrogen and biomethane to increase the 2030 renewable energy target to 45%)—and the increasingly efficient use of resources in a circular economy [9], are expected to play an important role in the integrated European energy system of the future, becoming a technology that can really compete with lithium-ion storage [10]. Traditional energy storage technologies are described in a valuable and synthetic way in the scientific literature [11], which, together with their application areas, thus provide an interesting reference base for hydrogen technology applications. The European Hydrogen Strategy anticipates that hydrogen will solve many of the problems with energy storage for balancing the variable supply of renewable energy sources (RES) and the variable demand for RES-generated energy [12]. It will also become a catalyst for change in broadly defined urban spaces, including in transportation [13,14]. Starting to use clean hydrogen (according to the European Commission, “clean hydrogen” refers to hydrogen produced by the electrolysis of water with electricity originating from renewable sources. It can also be produced by biogas reforming or by biochemical conversion of biomass, assuming that the sustainability requirements are met) on a wide scale and at a rapid pace is crucial for the EU to achieve its very ambitious climate target of cost-effective greenhouse-gas emission reduction of at least 50–55% by 2030 [1,15]. In the strategy papers concerning achieving climate neutrality, the EU assumes an increase in the share of hydrogen in the European energy mix from the present 2% to 13–14% [6].
However, there is still no guarantee that the EU’s hydrogen production potential can be fully harnessed [16]. At today’s stage of technology development, it is important to be aware of the many barriers and problems that are inherent in the issue of the popularization and use of hydrogen fuel and hydrogen storage [17]. These include:
  • choosing the right research pathways into the use of wind-based, solar-based, or grid-electricity-based electrolysis, or perhaps the use of steam-methane reforming [18];
  • focusing on the development of the most efficient technology and source of hydrogen, i.e., producing hydrogen from natural gas, renewable sources or nuclear energy [19];
  • cost issues and cost dependencies: the cost of renewable hydrogen and the effect of storage on hydrogen production [20];
  • institutional problems: delayed legislation, the lack of standards and certification schemes;
  • the adequate availability of financial and investment instruments from the public (e.g., EU funds) as well as private (banks, VCs);
  • last but not least, the “chicken and egg” problem, meaning supply is waiting for demand to develop and vice versa [16].
Hydrogen storage is a means for storing compressed or liquid hydrogen that can later be used as an energy carrier. Although the use of hydrogen for energy storage is not yet common due to the high costs and energy losses associated with it (currently estimated at about 60% in the so-called “full cycle”) [21,22], the development of hydrogen technologies as well as the gradual introduction of instruments reducing the cost of production and use of renewable hydrogen [23] are one of the key challenges of the emerging EU-level legislation on energy production and improving Europe’s energy neutrality [8,24]. With the development of hydrogen storage technologies, we can expect that the cost of building hydrogen storages and their operation will gradually decrease [25], which will contribute to the further development of the RES market; so we will experience a kind of feedback where hydrogen technologies will drive the development of the RES sector, while the further development of the RES sector will support the work on greater efficiency and lower costs of using hydrogen-storage technologies [26]. The implementation of large-scale solutions [27] and the introduction of newer and newer technologies that allow home storage of RES energy in hydrogen storages [28,29] are already being considered today, not only in terms of entire estates or apartment blocks, but also individual households [30].
The support for the EU hydrogen-strategy implementation and the planned investments in strategic areas for achieving the Green Deal [31] is to be provided by the European Clean Hydrogen Alliance [32], which brings together representatives of industry, civil society, administrations at various levels, and the European Investment Bank (EIB). The Alliance’s activities to identify key and feasible investment projects for creating a hydrogen market in the EU were inaugurated by the European Commission in 2020. The European Commission is already supporting the implementation of hydrogen-related projects through the EU’s financial instruments, including InvestEU within the framework of the Next Generation EU [33].
The hydrogen economy is expected to be an opportunity to strengthen the EU, as it could directly provide up to a million emerging jobs by 2030 and 5.4 million jobs by 2050 [34]. The US administration is also hoping for job growth based on the development of the hydrogen market [35]. The development of hydrogen technology may also represent an opportunity for regions that are currently heavily dependent on conventional energy sources and will be at the risk of poverty once fossil fuels are phased out; renewable hydrogen’s potential to generate jobs is estimated at 10,300 jobs for every billion euros invested [36].
At the same time, various forms of the energy communities are developing in EU countries. In Poland, but also in some other EU countries like Germany, Italy or Denmark [37], they have taken the form of energy cooperatives. These are institutions that enable groups of people or entities to make investments, manage and benefit from joint ownership of RES energy plants and infrastructure, particularly such as photovoltaic panels or wind turbines. The idea behind energy cooperatives is to increase their members’ energy independence from large energy corporations (energy producers or distributors) and to increase the share of renewable sources in energy production and distribution. Today, energy cooperatives are still a small segment of the energy market, but their development is promising. In Germany [38] or Denmark [39], energy cooperatives are already very popular and successfully compete on the market. Also in Poland, an increasing number of such local energy communities [40] and social networks [41] are being established; currently more than ten energy cooperatives are waiting to be registered with the court and entered in the register, with a further several dozen in the pipeline. Previous research work and papers published by the authors show that integrating individual prosumers into an energy cooperative established under the terms set out in Polish law cannot only be profitable [40], but may meet the new challenges of energy communities, such as support for prosumers also in the light of the COVID-19 effect [42], meeting the requirements of the capacity market [43] or even in the much-needed process of crypto-coin “greening” [44].
As the EU will certainly not deviate from the path of developing and supporting the use of hydrogen, and will foster the emergence of local self-sufficient energy communities, we should already consider whether it is viable to combine innovative technological solutions (hydrogen storages) and new institutional solutions for RES (energy cooperatives). In this paper, the authors reflect on the following:
  • Is it possible for an energy cooperative to achieve full or partial energy independence using its own RES and hydrogen storage?
  • What must be the minimum aggregate capacity of RES held by members of an energy cooperative so that, with the use of a hydrogen storage with certain parameters, it is possible not to exchange electricity with the grid?
  • Is it possible to reduce the capacity of a hydrogen storage operating within a cooperative by oversizing the RES held by members of an energy cooperative? If so, what relationship exists in this case between the scale of such oversized sources and the size of the hydrogen storage?
All models of cooperatives proposed and studied in this paper as well as the data on energy production and consumption on farms that are members of a cooperative are based on anonymized actual data obtained from energy consumers and producers living in Polish rural areas.
Our research, which is based on real data, allowed us to create several model energy cooperatives taking into account the legal conditions of forming and developing these institutions, while incorporating an innovative element in the form of hydrogen storage. Second, our paper also fills a literature gap and in a methodological gap, as the methodological approach presented here can easily be applied to other distributed-energy institutions that are and will be established in Europe and other continents. Third, it is novel at the European level as it investigates the problem that has only been partially analyzed with respect to EU countries, i.e., there has been no combined analysis on the formation of energy communities with the use of a hydrogen storage.
An extensive analysis of the literature on the subject indicates an important publication gap, which the authors of this paper seek to fill. Known research and publications in the subject do not link the unique topic of energy storage in the form of green hydrogen within energy communities. Hydrogen storage in itself is so far not very popular, and in combination with “prosumerism” and the development of energy communities it represents a pioneering approach and a non-trivial proposal for building local energy independence. The contribution of the paper to scientific literature lies in proving that: (i) the storage of green hydrogen for later conversion to electricity may also be applicable at the local level; (ii) there is a relationship between the capacity of a hydrogen storage and the capacity of RES that allows for building full energy independence; (iii) the type of RES generating source is important in optimizing the capacity of a hydrogen storage.
The paper is structured as follows. The second section presents and describes the requirements for the formation and operation of energy cooperatives. The section also presents the characteristics of dozens of prosumers (meaning simultaneous consumers and producers of energy), living in rural areas in southern and central Poland, who form the energy cooperatives analyzed in the paper. We also discuss the method of selecting 2000 random energy cooperatives that are also analyzed. We present the key assumptions for the simulations carried out. Section 3 (Materials and Methods) describes the research material, i.e., a sample of energy cooperatives properly selected for simulation purposes, and briefly presents the optimization models used in the research. The subsequent section includes the results of our analyses that are discussed case by case. At the end, we draw conclusions that made it possible to conclude the entire work and research, and indicate the limitations and possible future directions of the authors’ research work to explore the issue presented in this paper.

2. Background and Main Provisions

2.1. Assumptions and Legal Conditions Regarding Energy Cooperatives

According to Polish regulations [45], the purpose of energy cooperative is to produce for the benefit of its members electricity, biogas, biomethane or heat energy from renewable energy sources. The key goal of energy cooperatives (so far they can only be established in rural areas) is to achieve the highest possible level of energy self-sufficiency of the local community based on renewable energy sources [46].
Energy cooperatives operate on the basis of the prosumer system of energy billing based on the discounts: the energy seller (designated by the Energy Regulatory Office: https://www.ure.gov.pl/en (accessed on 22 September 2024)) settles accounts with the energy cooperative only for the difference between the amount of electricity fed into the power distribution network and the amount of electricity taken from the network by the cooperative (its members) for its auxiliaries, in a ratio adjusted by a quantity factor of 1 to 0.6 (for prosumers, Poland uses the ratios of 1 to 0.8 or 1 to 0.7, depending on the system capacity). Both the discount mechanism used in prosumer settlements and the operating conditions of energy cooperatives have been described in detail in previously published research papers devoted to the profitability of creating local energy communities [40,43].
In many EU countries, the institution of energy cooperatives (as one form of prosumer integration) is becoming more common [38,47,48,49]. There are already European rules for energy cooperatives (communities), which provide an umbrella for such institutions set up in the EU [50]. It should be borne in mind that this is a rather general framework, which means that there are many differences between cooperatives from country to country and even from region to region (in terms of structure, operating rules and how energy is billed and exchanged) [51]. The practical and causal dimension of energy cooperatives—cooperation on a local scale on the one hand [52], and the realization of EU and UN climate goals through them on the other [53]—suggests that this way of organizing prosumers will certainly develop and harmonize on a continental scale [54]. This development can already be seen today, for example, through the activities of REScoop.eu—the European federation of energy communities [55].

2.2. Main Provisions Concerning the Analyses Carried Out

This paper continues the work carried out by the authors, so the previous convention of presenting the analyses and results will be maintained.
1.
The first classification being a basis for the analyses concerns the selection of cooperative members. It will be based on an imposed and a random selection of cooperative members.
a.
The former will deal with specific sample cooperatives established on the basis of real and differently profiled demand data for farms, assigned to different tariff groups and with different levels of power demand. The characteristics of the members for the simulated cooperatives are shown in Table 1.
b.
Within the second group, the composition of the cooperatives will be formed by randomly selecting the prosumers that make up the cooperatives (EC1, EC2, EC3, EC4) characterized in the authors’ previous works [40,43]. The analysis will cover 68 actual prosumer profiles, some of which we will randomly select for the structures of the cooperatives taking into account their different sizes. 500 cooperatives will be drawn separately for each of the following numbers of members: 5, 10, 20, 40. A total of 2000 energy cooperatives will be analyzed.
c.
No special key was used to select cooperative members e.g., in terms of matching demand profiles. The demand profile of the cooperative drawn (created) was the sum of the demand profiles of the cooperative members drawn.
2.
For each energy cooperative, the impact of RES generation will be analyzed under three different and independent options, which are the most common in the Polish reality:
a.
The entire installed capacity will come from PV sources.
b.
The entire installed capacity will come from wind turbines.
c.
The installed capacity will be a hybrid combination of wind and PV sources with the share of each source selected through an optimization process.
3.
Three simulations will be conducted for each energy cooperative and each generation option:
a.
The minimum size of the generating source, assuming that the energy cooperative operates on the basis of the discount mechanism described in Section 2.1 and, in more detail, in the authors’ earlier papers [40,43], with a discount factor of 0.6, and uses the power grid as a virtual storage.
b.
The minimum size of the generating source, assuming that the energy cooperative forgoes energy exchange with the grid, thereby forgoing the use of the power grid as a virtual storage. In this scenario, it is assumed that a hydrogen storage will be used to store the energy.
c.
The minimum size of a hydrogen storage.
4.
The following assumptions were made for each of the above simulations:
a.
The optimization begins at the beginning of the calendar year and covers 15 consecutive years.
b.
All calculations are performed in an hourly window based on actual data given at hourly resolution.
c.
The energy independence of an energy cooperative comes after the first quarter of its operation, which means that the capacity of the generating source(s) and of the storage must be properly selected.
d.
The inability to discharge surplus electricity into the power grid, which affects the storage capacity as it is required to capture any surplus energy.
e.
The aggregate electricity demand within the arbitrarily selected structures of the energy cooperatives was selected so that it could be met using micro-installations, being a source of up to 50 kW.
Table 1. Basic information on energy cooperatives and their members.
Designation of the Cooperative#Tariff GroupEnergy Consumption [MWh/Y]
EC11C1111.565
2C12a12.674
3C12b9.067
EC21C117.278
2C12a17.370
3C12b14.887
EC31C119.883
2C12a18.245
3C12b10.369
EC41C115.289
2G111.797
3G110.997
4G122.592
5C12a4.785
6C12a6.294
7C12a6.389
8C12a5.889
9G121.997
10C12b3.197

3. Materials and Methods

3.1. Sampling Energy Cooperatives for Simulation Purposes

The first stage of the analyses and simulations was to conduct an optimal selection of generating sources so to filter out the customers characterized above to obtain prosumers with full energy independence after the first quarter. Depending on the capacity of the source, these prosumers are subject to a discount factor of 0.8 or 0.7. The simulations allowed us to obtain optimal levels of generating source capacity and storage capacity for each prosumer. These prosumers were then grouped into energy cooperatives and presented in Table 2. The average energy demand for the entire cooperative EC1, EC2, EC3 and EC4 is, respectively: 33.305 MWh/year, 39.535 MWh/year, 38.496 MWh/year and 39.227 MWh/year. In Figure 1 below the Table 2, the aggregated data for EC_1, EC_2, EC_3, EC_4 are visualized according to the RES sources adopted.

3.2. Optimization Model

The results presented in the paper were obtained on the basis of data from a simulation of a dedicated mathematical model. The mixed-integer programming technique [56] was used for modeling. The GLPK software was used for modeling, in particular the available high level GMPL language [57] (this software is available on an open-source basis). The COIN-OR/CBC software [58] (also available on an open-source basis) was used to solve the individual optimization tasks. Below we present the more important elements of the model in the variant with hydrogen storage, when minimizing its capacity.
In this model, in hourly granularity, for h from the set Hours = {1,2,..., H}, we minimize the value of the variable:
minimize objective: MSL;
where:
subject to def_max_storage_level{h in Hours}:
SL[h] <= MSL;
SL[h] is a non-negative real variable describing the level of filling of the hydrogen storage at the end of interval h. Assuming that REH is a parameter equal to the efficiency of electricity-to-hydrogen conversion, SS[h] is a non-negative real variable describing the amount of electricity transferred to the storage at hour h, and RS[h] is a non-negative real variable expressing the amount of electricity withdrawn from the storage at hour h, the filling level of the hydrogen storage is modeled by the formula:
subject to def_storage_level{h in Hours}:
SL[h] == SL[h − 1] + REH · SS[h] − RS[h];
In the above, we assume that SL[0] = 0, so the storage was initially empty.
In the optimization task, specific generation profiles of unit photovoltaic and wind sources are assumed. The corresponding generation values are represented in the model by the vectors SRC[pv,h] and SRC[wind,h]. Taking the non-negative variables SRCM[pv] and SRCM[wind] as the size of the sources, the total generation from renewable sources at hour h is represented by the vector G[h] given by the formula:
subject to def_production_level{h in Hours}:
G[h] == SRCM[pv] × SRC[pv,h] + SRCM[wind] × SRC[wind,h];
Depending on the simulation variant, SRCM[pv] or SRCM[wind] were upper bounded by 0.
Let D[h] be the given energy demand at hour h, F[h] be a non-negative real variable representing the amount of electricity purchased from the grid at hour h, and RHE be a parameter equal to the efficiency of hydrogen-to-electricity conversion, then the formula describing the energy balance is modeled as follows:
subject to constr_demand{h in Hours}:
D[h] == F[h] + G[h] − SS[h] + RHE · RS[h];
Only selected parts of the optimization model for the case with hydrogen storage are presented above. Full descriptions of both models—for networked virtual storage and hydrogen storage—can be found here: https://drive.google.com/drive/folders/1AiWk9cJvaSFS3LZNJ2-3XGMVFeVtmdD6?usp=sharing (accessed on 2 September 2024).

4. Results and Discussion

The above shape of energy cooperatives EC1–EC4 underwent nine types of simulation using:
  • breakdown by source type (PV, WIND, MIX),
  • different variants of the cooperative:
    o
    CASE_0: a conventional cooperative connected to a grid and using a virtual network storage in the discount model,
    o
    CASE_1A: a cooperative with a hydrogen storage with the minimum capacities of generating sources,
    o
    CASE_1B: a cooperative with a hydrogen storage with the minimum storage capacity.
Table 3 shows scenarios for the optimal selection of source capacity and storage capacity for each variant of cooperative EC1. A visualization of the data contained in Table 3 can be found in Figure 2 (below the table).
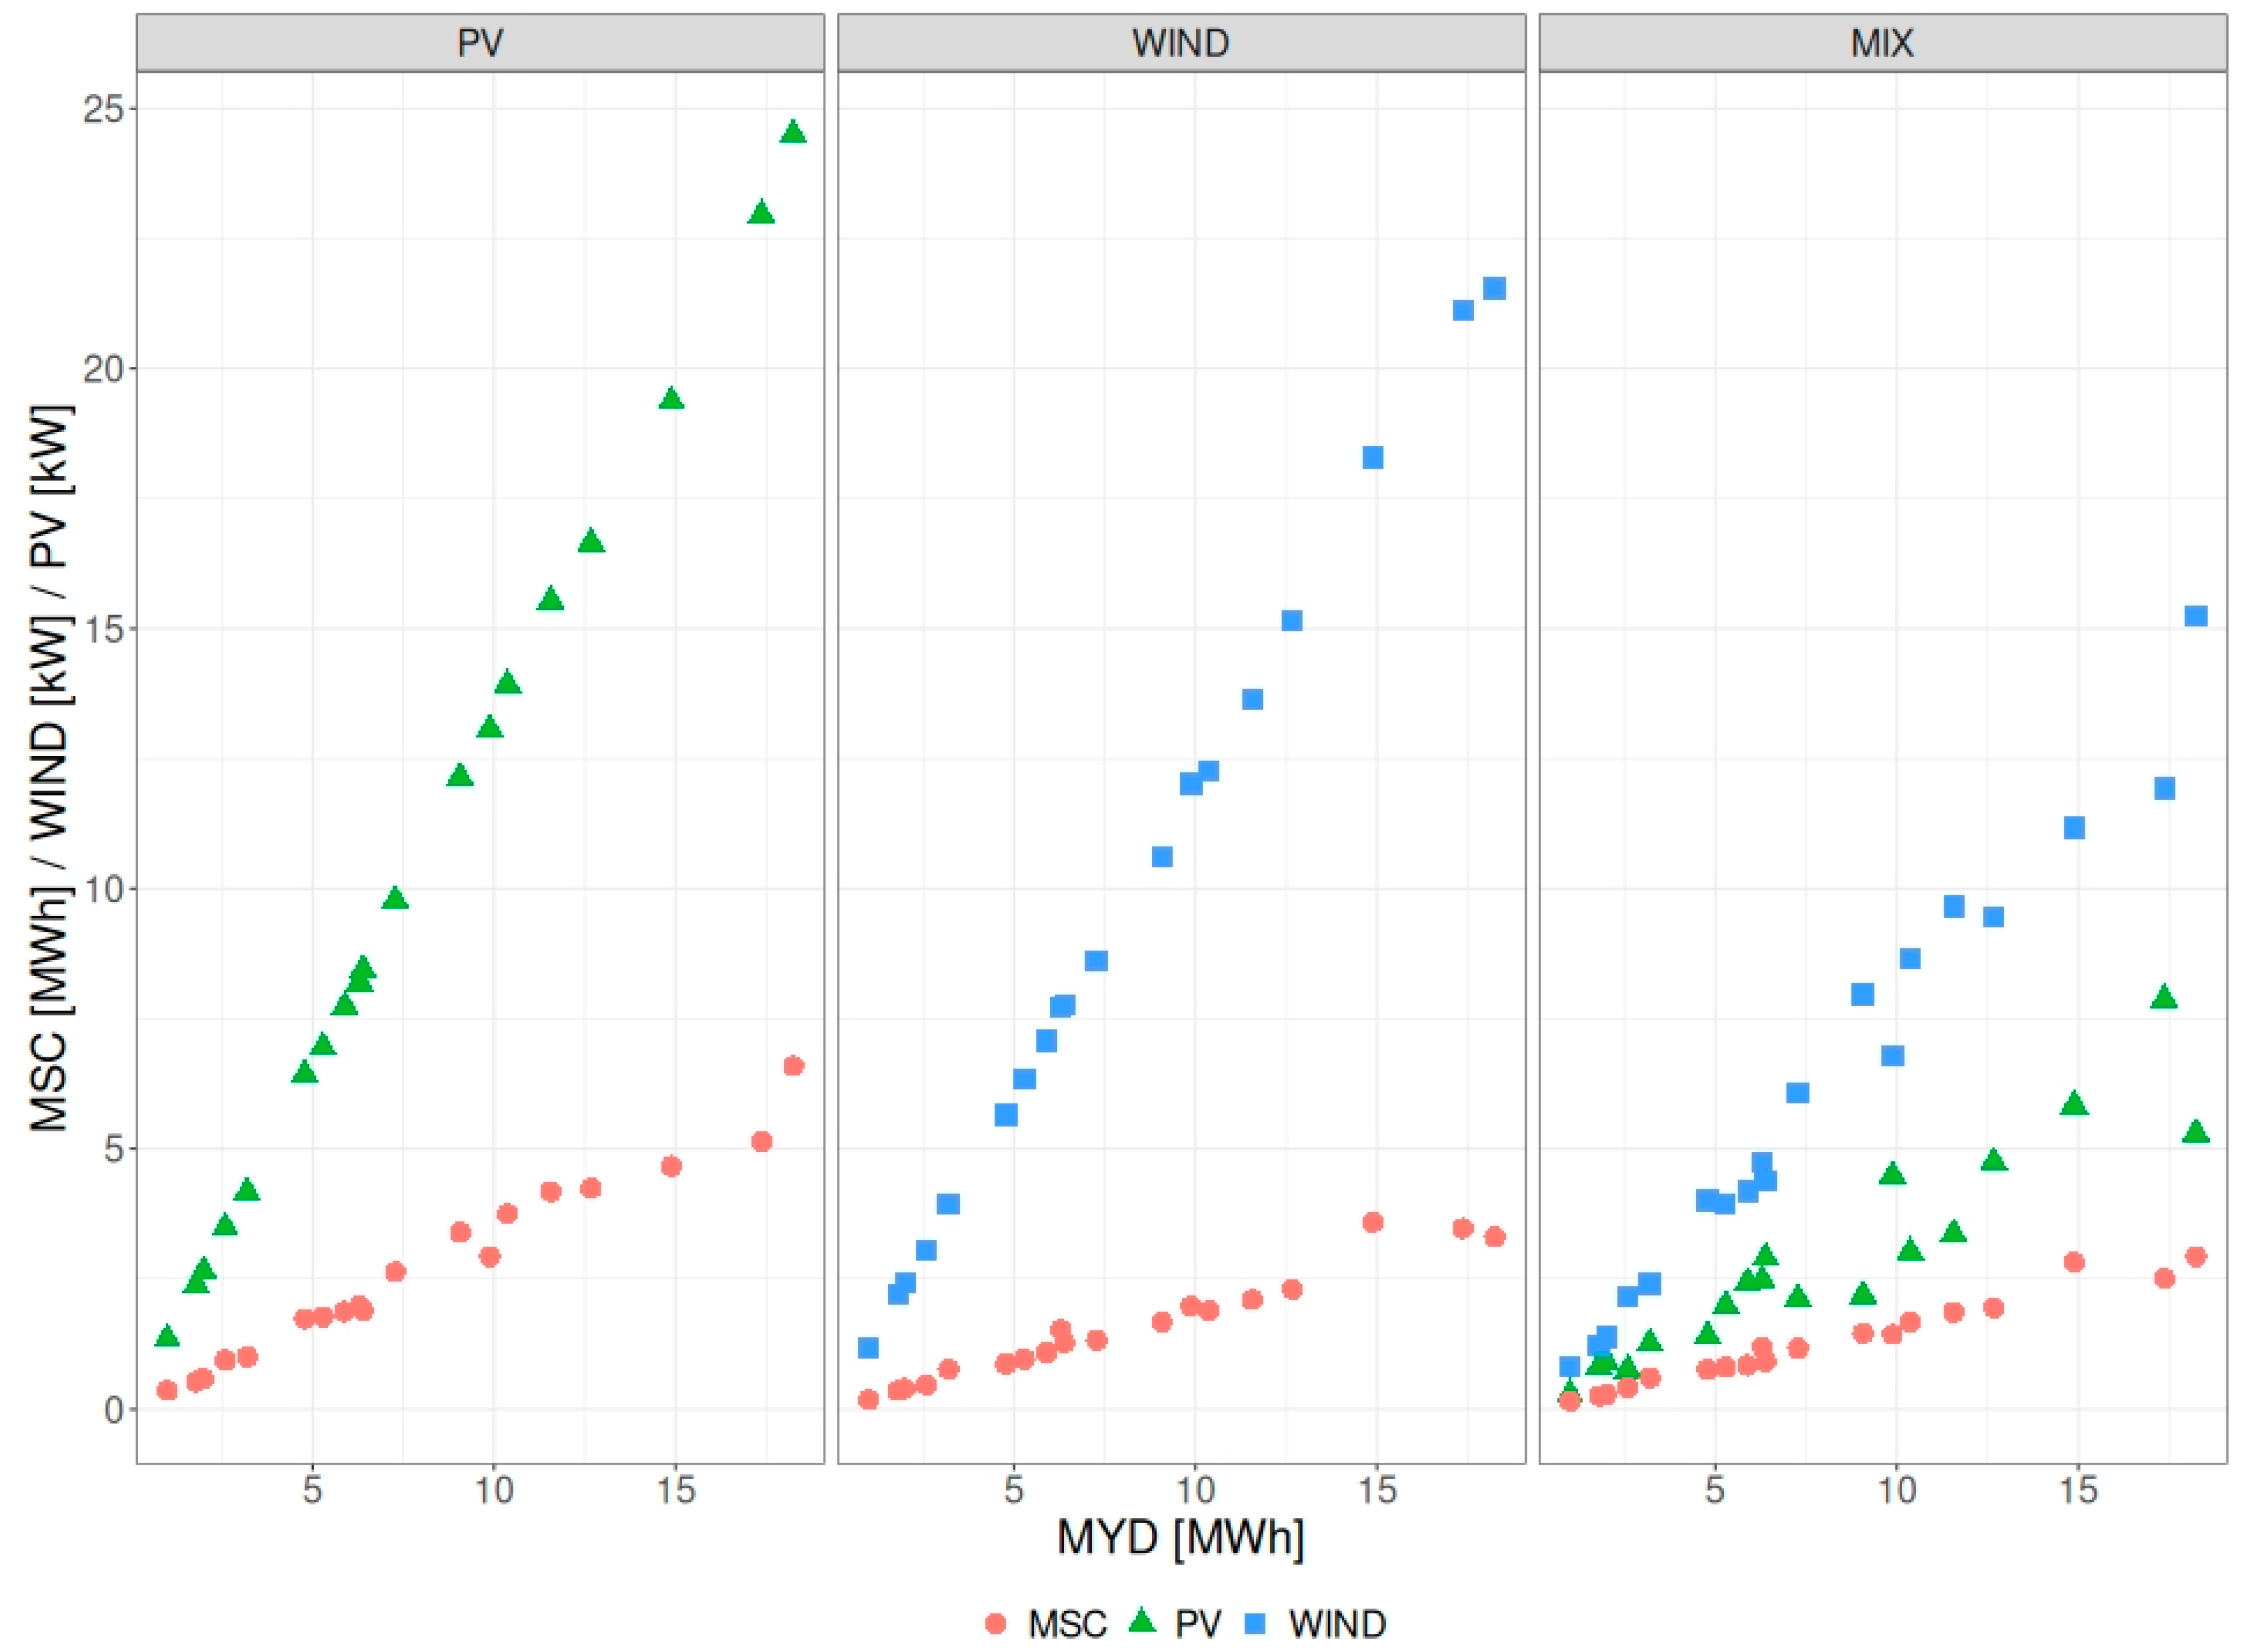
The results obtained by simulation and presented in Table 3 can be interpreted as follows:
  • CASE_0: When PV modules were the only type of source used, the conventional cooperative had a total installed capacity of 44.288 kW and the maximum accumulated surplus electricity (accumulated in the operator’s grid) reached 11.759 MWh.
  • CASE_1A: When a virtual (grid) storage was replaced with a hydrogen storage, the calculation was based on the power-to-power chain [59] with a final efficiency of 29% and on the assumption that the cooperative seeks to minimize the capacity of the sources while meeting the condition of energy self-sufficiency [60]. Then the total installed PV capacity will be 69.873 kW, and the maximum filling in the hydrogen storage will reach 26.77 MWh.
  • CASE_1B: Energy independence of a cooperative is achieved while meeting the criterion of minimum hydrogen storage capacity. In this case, the capacity of the installed PV sources is 92.016 kW, and the storage capacity will reach 19.019 MWh.
An analysis of the results leads to the following conclusions:
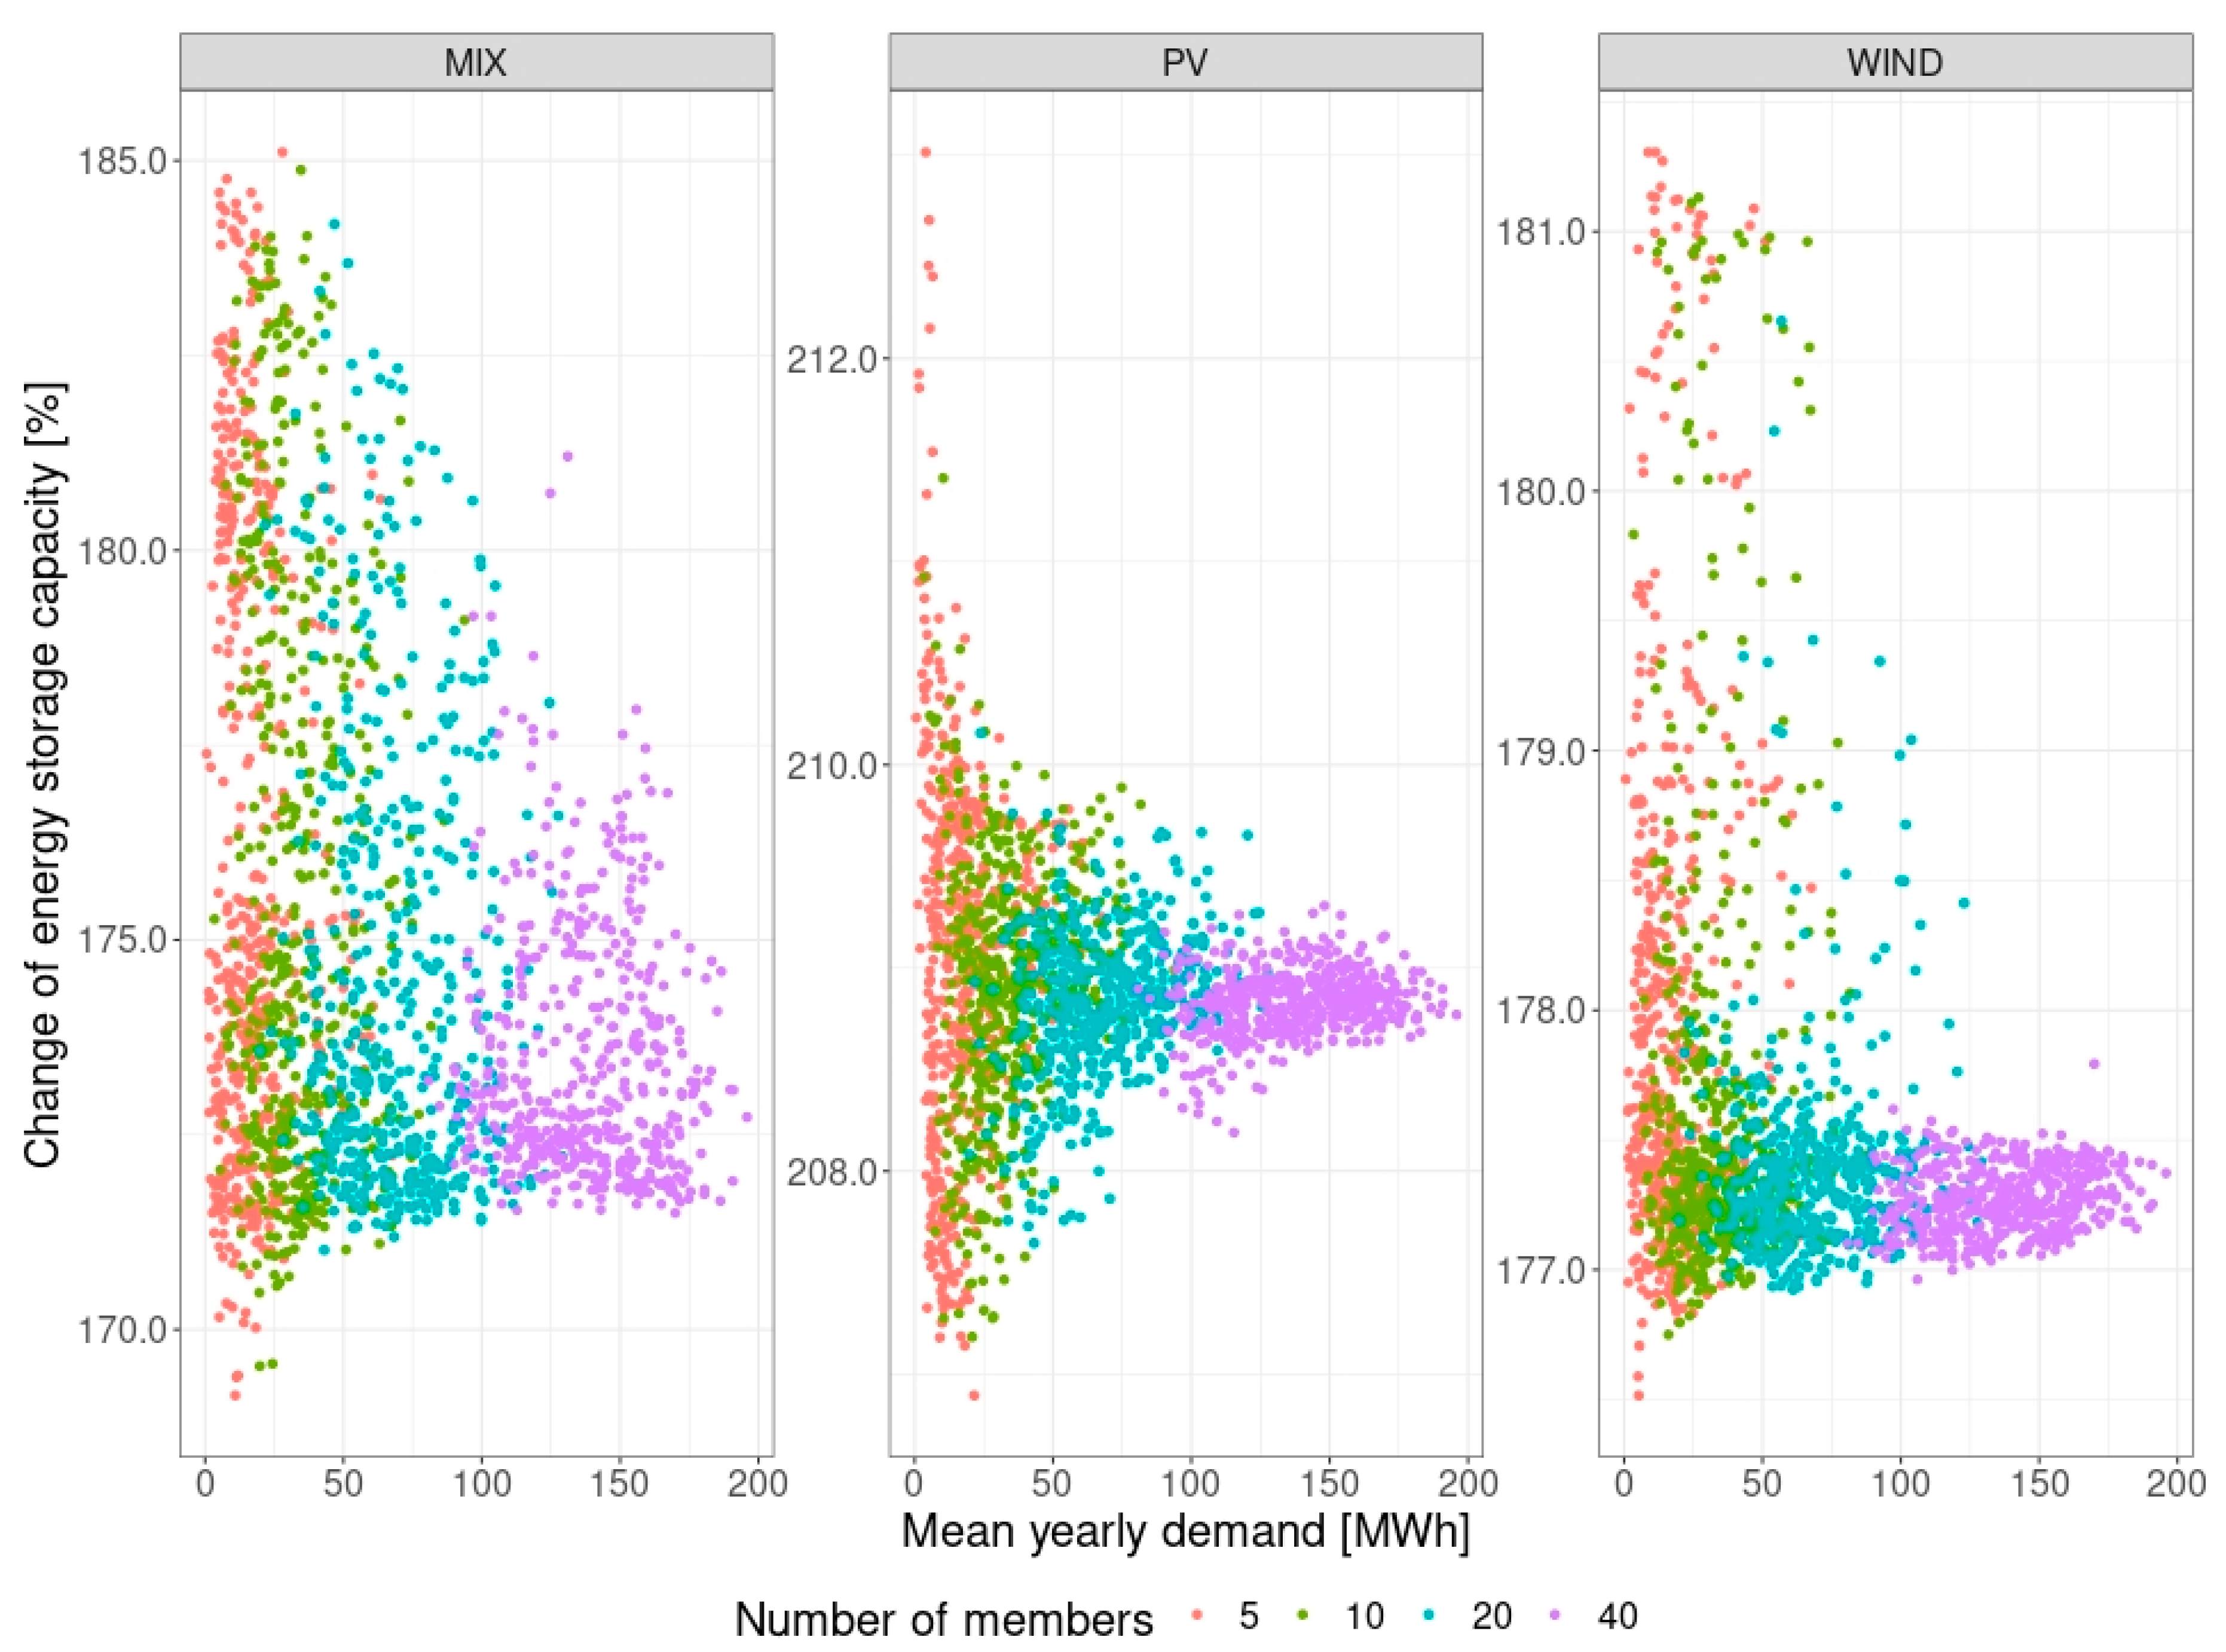
  • From the perspective of the cooperative’s energy balance, it is possible to achieve energy independence by replacing the virtual energy storage in the distribution network by a hydrogen storage fitted with an electrolyzer. This requires oversizing the capacity of the generating source and the storage. For the scenario analyzed based on PV sources, we need to increase the power capacity (CASE_1A/CASE_0) from 44.288 kW to 69.873 kW (by 58%) and storage capacity from 11.759 MWh to 26.77 MWh (by 128%). The need to oversize the capacity of the sources and the storage capacity was also confirmed through simulation carried out at the level of cooperatives of different sizes and random participants. The relationship of the change of energy storage capacity [%] as a function of mean yearly demand [MWh] for CASE_1A vs. CASE_0 is shown in Figure 3 along with the quantiles shown in Table 4. A single point in Figure 1 is the result of one computing session. Depending on the type of generating source and the size of cooperative, we can observe different levels of concentration and symmetry of results, and the higher the number of members within a single cooperative, the greater the symmetry and level of concentration of results. For instance, for a scenario with PV sources and 40 cooperative members, the criterion specified in CASE_1A is satisfied when storage capacity is increased by around 209% on average.
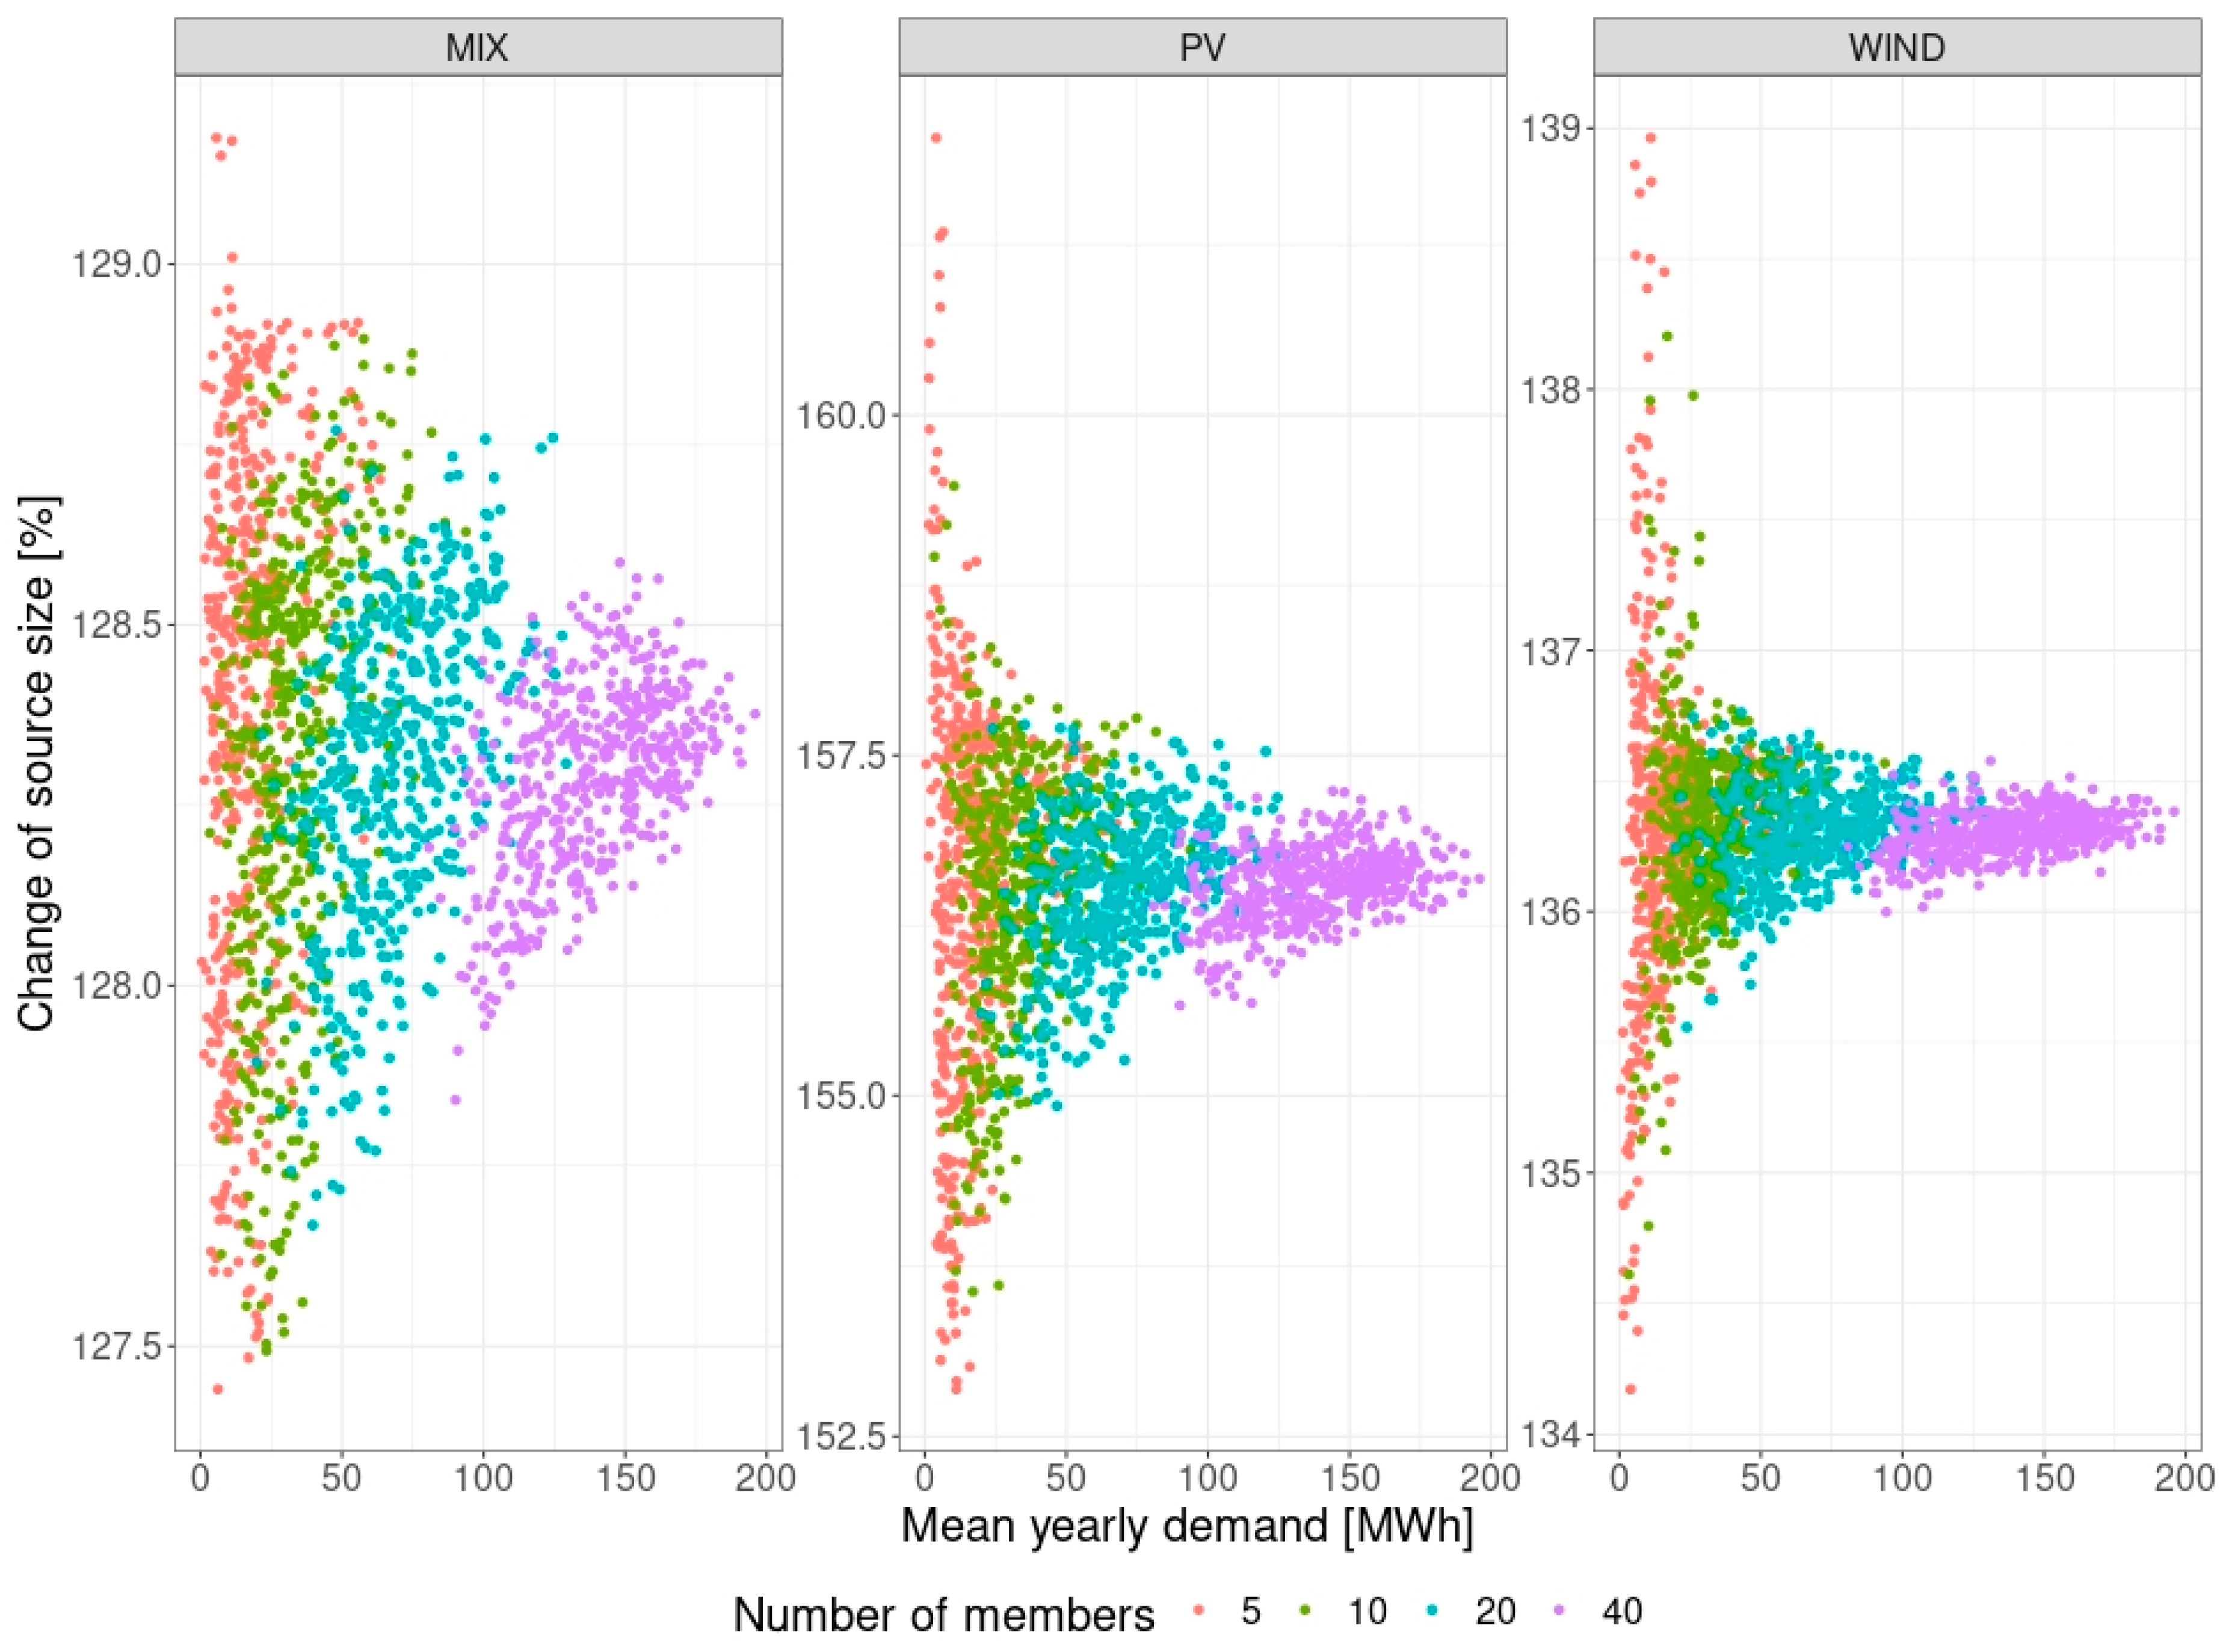
The simulation also determined the characteristics of the change of source size [%] as a function of mean yearly demand [MWh], for CASE_1A vs. CASE_0, which is shown in Figure 4, while the quantiles of the distribution are shown in Table 5. We should point out that the higher the number of cooperative members, the greater the concentration and symmetry of results. For instance, for a scenario with PV sources and 40 cooperative members, the criterion specified in CASE_1A is satisfied when the capacity of the generating source is increased by around 56% on average.
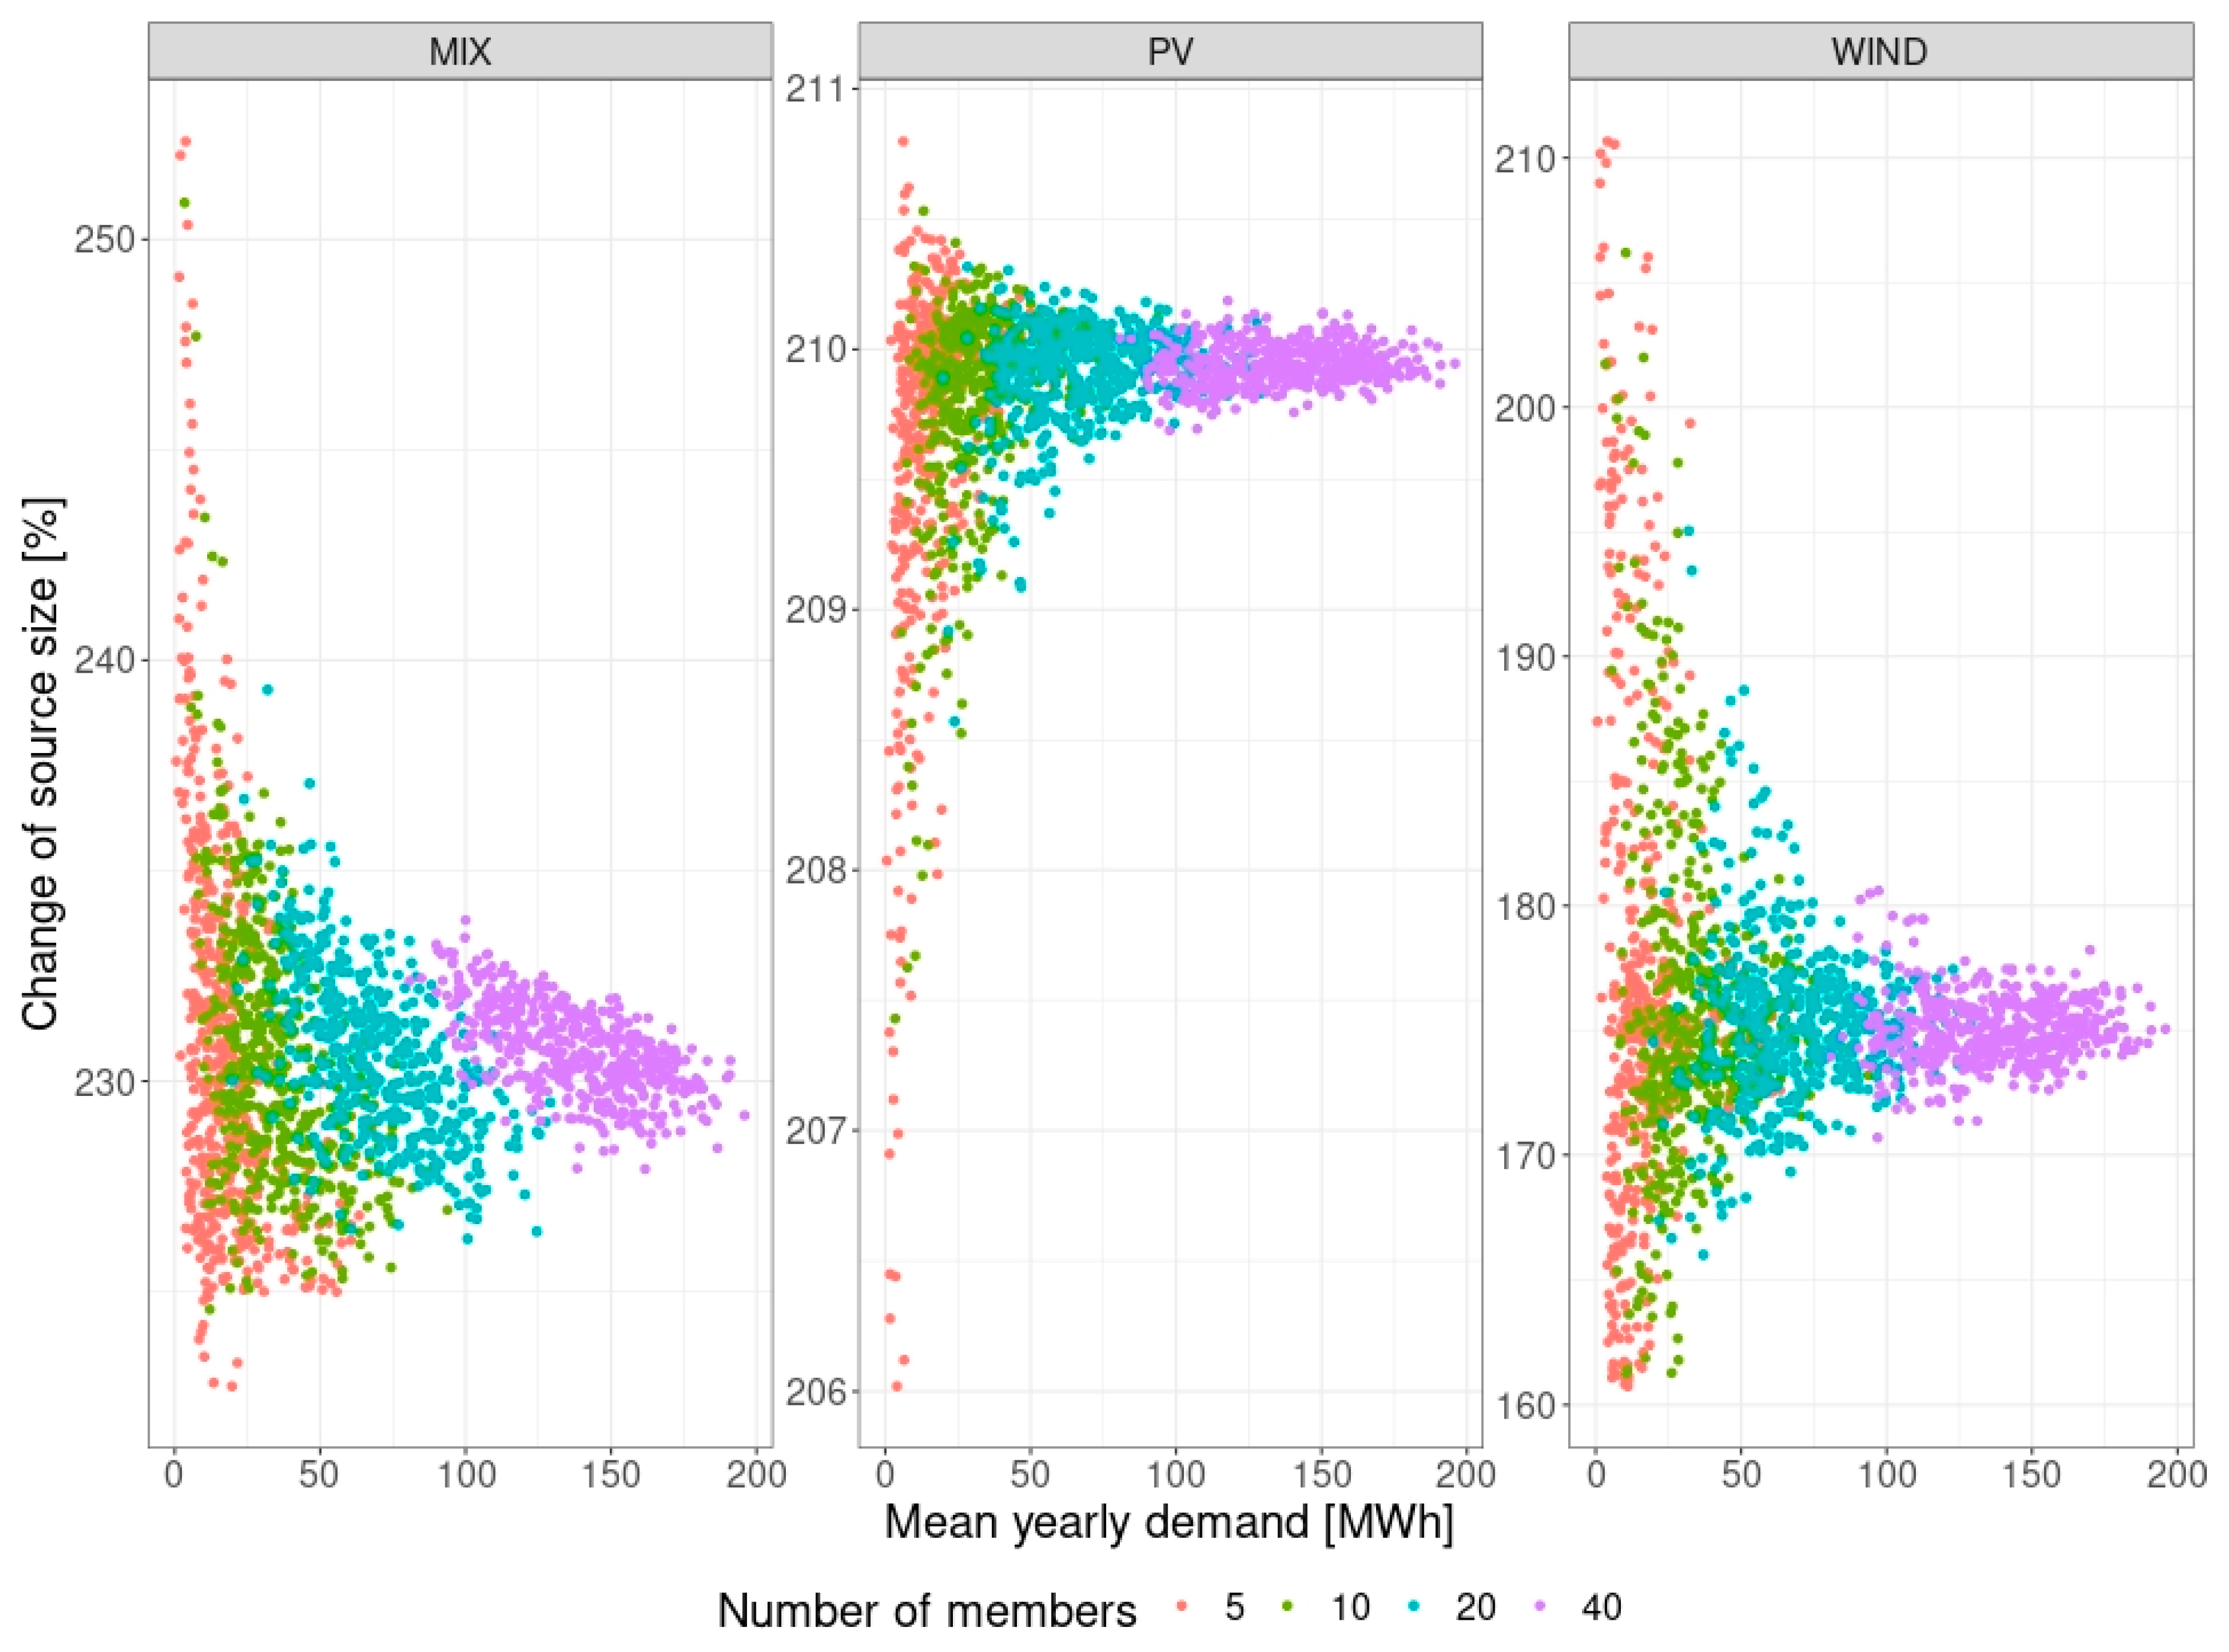
  • for the PV scenario, meeting the criterion defined in CASE_1B relative to the baseline (CASE_0) requires an increase in the source capacity from 46.904 kW to 96.169 kW (by 105%), which is also linked to a 92% increase in storage capacity from 16.16 MWh (virtual grid storage) to 30.984 MWh (hydrogen storage). In order to confirm the relationship and examine it at a general level, a simulation was carried out for energy cooperatives of different sizes with a random selection of participants. The analysis of the results, including the relationship of the change of energy storage capacity [%] as a function of mean yearly demand [MWh] for CASE_1B vs. CASE_0, is shown in Figure 5 along with the distribution of quantiles shown in Table 6. The results confirm that different degrees of concentration and symmetry were achieved depending on the number of participants, and that the result show clear disproportions depending on the type of generating source. An increase in storage capacity is evident for the scenario with PV sources, where it is around 152% on average for a cooperative with 40 members. We should emphasize that if we compare these values to the results for scenarios with wind and hybrid sources, respectively, the results will be more than two times and six times lower. For a 40 members’ cooperative with a mix of generating sources, the capacity reduction is around 75%, or around 35–40% if only wind sources are used.
Figure 5. A change in storage capacity as a function of average energy demand for CASE_1B vs. CASE_0.
Applsci 14 09753 g005
Table 6. Quantiles of distribution—the relationship of the change of energy storage capacity [%] as a function of mean yearly demand [MWh] for CASE_1B vs. CASE_0.
src\Quantileq.0%q.10%q.20%q.30%q.40%q.50%q.60%q.70%q.80%q.90%q.100%
mix19.7223.9824.9025.3925.7526.0626.3926.7627.2428.0644.62
pv147.69149.29149.78150.22150.54150.85151.20151.67152.41153.90169.77
wind34.9256.3058.2160.4262.5964.0665.3466.8668.4770.9081.46
The results presented are complemented by the change of source size [%] as a function of mean yearly demand [MWh], for CASE_1A vs. CASE_0, which is shown in Figure 6, while the quantiles of the distribution are shown in Table 7. Regardless of the type of generating source used, satisfying the CASE_1A criterion requires a significant increase in its capacity. For a cooperative of 40 members, the percentage change in source capacity for the mix, PV, and wind scenarios is 230%, 210%, and 175%, respectively.
  • Increasing the capacity of a generating source (CASE 1B/CASE1A) effectively reduces the hydrogen storage capacity regardless of the type of source (PV/WIND). For the variant with PV sources, a reduction in hydrogen storage capacity from 26.77 MWh to 19.019 MWh (by 29%) is possible if we increase the source capacity from 69.873 kW to 92.016 kW (by 32%). Similar calculations for the variant with wind sources indicate that it is possible to reduce the storage capacity from 12.713 MWh to 2.89 MWh (by 77%) thanks to oversizing the source capacity from 53.238 kW to 81.005 kW (by 52%). For the hybrid scenario combining both generation technologies, a reduction in storage capacity from 12.101 MWh to 1.326 MWh (by 89%) becomes possible if we increase the total capacity from 47.751 kW to 91.565 kW (by 92%).
The results obtained for cooperatives EC2–EC4 are presented in a similar manner in Table 8.
The results of the analyses for other structures of cooperatives EC2–EC4 allow us to draw conclusions directionally consistent with those for EC1. The technical feasibility, for any scenario and type of a generating source, to substitute a grid storage with a physical hydrogen storage is confirmed. The most beneficial generation-storage structure considering the balance of source capacity and storage capacity occurs in the MIX scenario, which assumes the presence of both types of generating source. For the case that assumes minimizing the storage capacity, it is necessary to increase the total capacity of the sources around twice to be able to obtain around a four-fold reduction in storage capacity.

5. Conclusions, Limitations and Future Research

5.1. Conclusions

The transformation of the power sector is geared towards the decentralization of the power generation sector and a complete shift from the use of fossil fuels to renewable energy. These changes are increasingly taking the form of a revolution rather than evolution, forcing us to search for often unconventional solutions to help build energy independence. Its elements include the need to store energy as efficiently as possible and for as long as possible. The research the results of which are presented in the paper were focused on analyzing and evaluating the feasibility of storing energy in quasi-island systems with the use of a hydrogen-based power-to-power chain.
The results clearly indicate, both for the four sample energy cooperatives and for randomly selected communities of different sizes, that it is technically feasible to select such a capacity of generating sources (in PV, wind, and mixed scenarios) along with the capacity of hydrogen storage that will guarantee energy self-sufficiency of a given energy community throughout the year. The process takes into account storage efficiency. Commercial application of the results would provide an effective equivalent to the current model of supporting prosumers that use the distribution grid as an “energy storage”. Particularly interesting seem to be the optimization results indicating, for the hybrid generation scenario, a clear potential to reduce hydrogen storage capacity by several times compared to the “conventional” scenario, while increasing the capacity of generating sources. This is also interesting in terms of increasing the use of cable pooling, i.e., the presence of both PV and wind generation on a single power connection. Increasing the capacity of generation sources, at the cost of reducing storage capacity, significantly affects the profitability of such an investment—the latter and the costs associated with it were not analyzed as part of the study. The environmental aspects of the search for the optimum energy independence scenario for local energy communities and the impact on the external environment, including the grid operator in particular, are also worth highlighting. The stochastic nature of the operation of renewables through the use of hydrogen storage will effectively buffer generation, improve grid security, power balance and power spreads. This will enable a better use of the grid and should realistically result in a higher number of positively considered connection conditions for renewables, which will certainly have a positive environmental impact.
To summarize the key and new research achievements of the authors, it is important to point out the following:
  • It has been proved technically feasible to build quasi-island energy independence at the local level using hydrogen storage and the efficiency of the power-to-power chain.
  • Algorithms have been developed to optimize generation capacity, source types and storage capacity to build independence for energy communities of different sizes and with different levels and profiles of energy consumption.

5.2. Limitations and Future Research

To fully assess the viability of operating a self-sufficient energy cooperative based on hydrogen storage, it is also required to take into account financial aspects, which are not covered by this paper, including both the amount of capital expenditures and operating costs. Analyzing the Levelized Cost of Electricity and Levelized Cost of Hydrogen would be of great value in this context, but it will be covered by separate research due to its complexity.

Author Contributions

Conceptualisation, J.J., M.K. and M.S.; methodology, M.K.; formal analysis, J.J., M.K. and M.S.; investigation, J.J., M.K. and M.S.; resources, M.S.; writing—original draft preparation, J.J., M.K. and M.S.; writing—review and editing, J.J.; visualisation, M.K.; supervision, J.J. and M.S. All authors have read and agreed to the published version of the manuscript.

Funding

This research received no external funding.

Data Availability Statement

The data presented in this study are available on request from the corresponding author.

Conflicts of Interest

Author Maciej Sołtysik was employed by the company Weglokoks Energia Sp. z o.o. The remaining authors declare that the research was conducted in the absence of any commercial or financial relationships that could be construed as a potential conflict of interest.

References

  1. European Commission. A Hydrogen Strategy for a Climate-Neutral Europe. Available online: https://knowledge4policy.ec.europa.eu/publication/communication-com2020301-hydrogen-strategy-climate-neutral-europe_en (accessed on 26 June 2023).
  2. REPowerEU Plan. Available online: https://ec.europa.eu/commission/presscorner/detail/en/IP_22_6657 (accessed on 26 June 2023).
  3. Ghiani, E.; Giordano, A.; Nieddu, A.; Rosetti, L.; Pilo, F. Planning of a Smart Local Energy Community: The Case of Berchidda Municipality (Italy). Energies 2019, 12, 4629. [Google Scholar] [CrossRef]
  4. Directive (EU) 2018/2001 of the European Parliament and of the Council of 11 December 2018 on the Promotion of the Use of Energy from Renewable Sources; European Union: Maastricht, The Netherlands, 2018; (OJ L 328, 21.12.2018).
  5. Directive (EU) 2019/944 of the European Parliament and of the Council of 5 June 2019 on Common Rules for the Internal Market for Electricity and Amending Directive 2012/27/EU; European Union: Maastricht, The Netherlands, 2019; (OJ L 158, 14.6.2019).
  6. Clean Energy for All Europeans Package. Available online: https://ec.europa.eu/energy/topics/energy-strategy/clean-energy-all-europeans_en (accessed on 2 September 2024).
  7. Pinto, J. The Key Tenets of a Hydrogen Strategy: An Analysis and Comparison of the Hydrogen Strategies of the EU, Germany and Spain. Glob. Energy Law Sustain. 2023, 4, 72–95. [Google Scholar] [CrossRef]
  8. Communication from the Commission to the European Parliament, the Council, the European Economic and Social Committee and the Committee of the Regions: A Hydrogen Strategy for a Climate-Neutral Europe. Available online: https://eur-lex.europa.eu/legal-content/EN/TXT/PDF/?uri=CELEX:52020DC0301&from=IT (accessed on 27 June 2023).
  9. Circular Economy Action Plan. Available online: https://ec.europa.eu/commission/presscorner/detail/en/ip_20_420 (accessed on 27 June 2023).
  10. Komorowska, A.; Olczak, P.; Hanc, E.; Kamiński, J. An Analysis of the Competitiveness of Hydrogen Storage and Li-Ion Batteries Based on Price Arbitrage in the Day-Ahead Market. Int. J. Hydrogen Energy 2022, 47, 28556–28572. [Google Scholar] [CrossRef]
  11. Thango, B.A.; Bokoro, P.N. Battery Energy Storage for Photovoltaic Application in South Africa: A Review. Energies 2022, 15, 5962. [Google Scholar] [CrossRef]
  12. Report on a European Strategy for Hydrogen—Report A9-0116/2021. Available online: https://www.europarl.europa.eu/doceo/document/A-9-2021-0116_EN.html (accessed on 25 June 2023).
  13. Stecuła, K.; Olczak, P.; Kamiński, P.; Matuszewska, D.; Duong Duc, H. Towards Sustainable Transport: Techno-Economic Analysis of Investing in Hydrogen Buses in Public Transport in the Selected City of Poland. Energies 2022, 15, 9456. [Google Scholar] [CrossRef]
  14. Vivanco-Martín, B.; Iranzo, A. Analysis of the European Strategy for Hydrogen: A Comprehensive Review. Energies 2023, 16, 3866. [Google Scholar] [CrossRef]
  15. Tatarewicz, I.; Lewarski, M.; Skwierz, S.; Krupin, V.; Jeszke, R.; Pyrka, M.; Szczepański, K.; Sekuła, M. The Role of BECCS in Achieving Climate Neutrality in the European Union. Energies 2021, 14, 7842. [Google Scholar] [CrossRef]
  16. European Court of Auditors. The EU’s Industrial Policy on Renewable Hydrogen: Legal Framework Has Been Mostly Adopted: Time for a Reality Check; Special Report No … (European Court of Auditors. Online); Publications Office LU: Luxembourg, 2024. [Google Scholar]
  17. Frieden, F.; Leker, J. Future Costs of Hydrogen: A Quantitative Review. Sustain. Energy Fuels 2024, 8, 1806–1822. [Google Scholar] [CrossRef]
  18. Mojiri, A.; Wang, Y.; Rahbari, A.; Pye, J.; Coventry, J. Current and Future Cost of Large-Scale Green Hydrogen Generation. SSRN J. 2023. [Google Scholar] [CrossRef]
  19. MarketsandMarkets. Hydrogen Generation Market by Technology (SMR, ATR, POX, Coal Gasification, Electrolysis) Application (Refinery, Ammonia, Methanol, Transportation, Power Generation) Source (Blue, Green, Gray) Generation & Delivery Mode, Region—Global Forecast to 2028. 2023. Available online: https://mckinseywell.com/products/hydrogen-generation-market-by-technology-smr-atr-pox-coal-gasification-electrolysis-application-refinery-ammonia-methanol-transportation-power-generation-source-blue-green-gray-generation-mode-region-global-forecast-to-2028 (accessed on 2 September 2024).
  20. Moran, C.; Deane, P.; Yousefian, S.; Monaghan, R.F.D. The Hydrogen Storage Challenge: Does Storage Method and Size Affect the Cost and Operational Flexibility of Hydrogen Supply Chains? Int. J. Hydrogen Energy 2024, 52, 1090–1100. [Google Scholar] [CrossRef]
  21. DiChristopher, T. Hydrogen Technology Faces Efficiency Disadvantage in Power Storage Race; S&P Global Market Intelligence: New York, NY, USA, 2021; Available online: https://www.spglobal.com/marketintelligence/en/news-insights/latest-news-headlines/hydrogen-technology-faces-efficiency-disadvantage-in-power-storage-race-65162028 (accessed on 2 September 2024).
  22. Mahmoud Morsi Ali, D. Hydrogen Energy Storage. In Energy Storage Devices; Taha Demirkan, M., Attia, A., Eds.; IntechOpen: London, UK, 2019; ISBN 978-1-78985-693-4. [Google Scholar]
  23. Abánades, A. Perspectives on Hydrogen. Energies 2022, 16, 437. [Google Scholar] [CrossRef]
  24. Koneczn, A.R.; Cader, J. Hydrogen in the Strategies of the European Union Member States. Gospod. Surowcami Miner. Miner. Resour. Manag. 2023, 37, 53–74. [Google Scholar] [CrossRef]
  25. Komorowska, A.; Benalcazar, P.; Kamiński, J. Evaluating the Competitiveness and Uncertainty of Offshore Wind-to-Hydrogen Production: A Case Study of Poland. Int. J. Hydrogen Energy 2023, 48, 14577–14590. [Google Scholar] [CrossRef]
  26. Abdin, Z.; Zafaranloo, A.; Rafiee, A.; Mérida, W.; Lipiński, W.; Khalilpour, K.R. Hydrogen as an Energy Vector. Renew. Sustain. Energy Rev. 2020, 120, 109620. [Google Scholar] [CrossRef]
  27. Benalcazar, P.; Komorowska, A. Prospects of Green Hydrogen in Poland: A Techno-Economic Analysis Using a Monte Carlo Approach. Int. J. Hydrogen Energy 2022, 47, 5779–5796. [Google Scholar] [CrossRef]
  28. Keiner, D.; Thoma, C.; Bogdanov, D.; Breyer, C. Seasonal Hydrogen Storage for Residential On- and off-Grid Solar Photovoltaics Prosumer Applications: Revolutionary Solution or Niche Market for the Energy Transition until 2050? Appl. Energy 2023, 340, 121009. [Google Scholar] [CrossRef]
  29. Möller, M.C.; Krauter, S. Hybrid Energy System Model in Matlab/Simulink Based on Solar Energy, Lithium-Ion Battery and Hydrogen. Energies 2022, 15, 2201. [Google Scholar] [CrossRef]
  30. Knosala, K.; Kotzur, L.; Röben, F.T.C.; Stenzel, P.; Blum, L.; Robinius, M.; Stolten, D. Hybrid Hydrogen Home Storage for Decentralized Energy Autonomy. Int. J. Hydrogen Energy 2021, 46, 21748–21763. [Google Scholar] [CrossRef]
  31. European Commission European Green Deal. Available online: https://ec.europa.eu/stories/european-green-deal/ (accessed on 12 April 2024).
  32. European Clean Hydrogen Alliance. Available online: https://single-market-economy.ec.europa.eu/industry/strategy/industrial-alliances/european-clean-hydrogen-alliance_en (accessed on 27 June 2023).
  33. InvestEU and Recovery. Available online: https://investeu.europa.eu/about-investeu/investeu-and-recovery_en (accessed on 22 June 2023).
  34. Bezdek, R.H. The Hydrogen Economy and Jobs of the Future. Renew. Energy Environ. Sustain. 2019, 4, 1. [Google Scholar] [CrossRef]
  35. Effects of a Transition to a Hydrogen Economy on Employment in the United States Report to Congress; US Department of Energy: Washington, DC, USA, 2008; p. 173.
  36. European Commission. Directorate General for Energy; Guidehouse; Tractebel Impac. In Hydrogen Generation in Europe: Overview of Costs and Key Benefits; Publications Office: Luxemburg, 2020. [Google Scholar]
  37. Wierling, A.; Schwanitz, V.; Zeiß, J.; Bout, C.; Candelise, C.; Gilcrease, W.; Gregg, J. Statistical Evidence on the Role of Energy Cooperatives for the Energy Transition in European Countries. Sustainability 2018, 10, 3339. [Google Scholar] [CrossRef]
  38. Klagge, B.; Meister, T. Energy Cooperatives in Germany—An Example of Successful Alternative Economies? Local Environ. 2018, 23, 697–716. [Google Scholar] [CrossRef]
  39. Rønne, A.; Gerhardt Nielsen, F. Consumer (Co-)Ownership in Renewables in Denmark. In Energy Transition; Lowitzsch, J., Ed.; Springer International Publishing: Cham, Switzerland, 2019; pp. 223–244. ISBN 978-3-319-93517-1. [Google Scholar]
  40. Jasiński, J.; Kozakiewicz, M.; Sołtysik, M. Determinants of Energy Cooperatives’ Development in Rural Areas—Evidence from Poland. Energies 2021, 14, 319. [Google Scholar] [CrossRef]
  41. Zarębski, P.; Krupin, V.; Zwęglińska-Gałecka, D. Renewable Energy Generation Gaps in Poland: The Role of Regional Innovation Systems and Knowledge Transfer. Energies 2021, 14, 2935. [Google Scholar] [CrossRef]
  42. Sołtysik, M.; Kozakiewicz, M.; Jasiński, J. Profitability of Prosumers According to Various Business Models—An Analysis in the Light of the COVID-19 Effect. Energies 2021, 14, 8488. [Google Scholar] [CrossRef]
  43. Jasiński, J.; Kozakiewicz, M.; Sołtysik, M. The Effectiveness of Energy Cooperatives Operating on the Capacity Market. Energies 2021, 14, 3226. [Google Scholar] [CrossRef]
  44. Sołtysik, M.; Kozakiewicz, M.; Jasiński, J. Improvement of Operating Efficiency of Energy Cooperatives with the Use of “Crypto-Coin Mining”. Energies 2022, 15, 8061. [Google Scholar] [CrossRef]
  45. Ustawa z Dnia 20 Lutego 2015 r. o Odnawialnych Źródłach Energii (Act of February 20, 2015 on Renewable Energy Sources) (Dz.U. 2020 Poz. 261). 2015. Available online: https://isap.sejm.gov.pl/isap.nsf/DocDetails.xsp?id=wdu20150000478 (accessed on 2 September 2024).
  46. Gradziuk, P.; Gradziuk, B. Economic Profitability of Investment in a Photovoltaic Plant in South-East Poland. Annals PAAAE 2019, XXI, 124–133. [Google Scholar] [CrossRef]
  47. Bohnerth, J.C. Energy Cooperatives in Denmark, Germany and Sweden—A Transaction Cost Approach; Department of Earth Sciences, Uppsala University: Uppsala, Sweden, 2015. [Google Scholar]
  48. Wagemans, D.; Scholl, C.; Vasseur, V. Facilitating the Energy Transition—The Governance Role of Local Renewable Energy Cooperatives. Energies 2019, 12, 4171. [Google Scholar] [CrossRef]
  49. Sifakis, N.; Savvakis, N.; Daras, T.; Tsoutsos, T. Analysis of the Energy Consumption Behavior of European RES Cooperative Members. Energies 2019, 12, 970. [Google Scholar] [CrossRef]
  50. Covenant of Mayors—Europe Citizen Cooperatives. Available online: https://eu-mayors.ec.europa.eu/en/node/46 (accessed on 23 September 2024).
  51. Lode, M.L.; Heuninckx, S.; Te Boveldt, G.; Macharis, C.; Coosemans, T. Designing Successful Energy Communities: A Comparison of Seven Pilots in Europe Applying the Multi-Actor Multi-Criteria Analysis. Energy Res. Soc. Sci. 2022, 90, 102671. [Google Scholar] [CrossRef]
  52. Mucha-Kuś, K.; Sołtysik, M.; Zamasz, K.; Szczepańska-Woszczyna, K. Coopetitive Nature of Energy Communities—The Energy Transition Context. Energies 2021, 14, 931. [Google Scholar] [CrossRef]
  53. Hoppe, T.; Coenen, F.H.J.M.; Bekendam, M.T. Renewable Energy Cooperatives as a Stimulating Factor in Household Energy Savings. Energies 2019, 12, 1188. [Google Scholar] [CrossRef]
  54. Koltunov, M.; Pezzutto, S.; Bisello, A.; Lettner, G.; Hiesl, A.; Van Sark, W.; Louwen, A.; Wilczynski, E. Mapping of Energy Communities in Europe: Status Quo and Review of Existing Classifications. Sustainability 2023, 15, 8201. [Google Scholar] [CrossRef]
  55. ResCoop European Federation of Energy Communities—The Network of 2.250 Energy Communities from Across Europe. Available online: https://www.rescoop.eu/ (accessed on 22 September 2024).
  56. Williams, H.P. Model Building in Mathematical Programming, 5th ed.; John Wiley & Sons Ltd.: Chichester, UK, 2013; ISBN 978-1-118-44333-0. [Google Scholar]
  57. GLPK (GNU Linear Programming Kit). Available online: https://www.gnu.org/software/glpk/ (accessed on 18 September 2024).
  58. COIN-OR/CBC. Available online: https://projects.coin-or.org/Cbc (accessed on 18 May 2024).
  59. Chmielniak, T.; Lepszy, S.; Mońka, P. Energetyka wodorowa—Podstawowe problemy. (Hydrogen energy—Main problems). Polityka Energetyczna/Energy Policy J. 2017, 20, 55–66. [Google Scholar]
  60. Escamilla, A.; Sánchez, D.; García-Rodríguez, L. Assessment of Power-to-Power Renewable Energy Storage Based on the Smart Integration of Hydrogen and Micro Gas Turbine Technologies. Int. J. Hydrogen Energy 2022, 47, 17505–17525. [Google Scholar] [CrossRef]
Figure 1. Aggregated data visualization for EC_1, EC_2, EC_3, EC_4, depending on the RES sources adopted. Based on the data from Table 2.
Applsci 14 09753 g001
Figure 2. Visualization based on the data of Table 3.
Applsci 14 09753 g002
Figure 3. A change in storage capacity as a function of average energy demand for CASE_1A vs. CASE_0 for randomly selected cooperatives.
Applsci 14 09753 g003
Figure 4. Variation of generating-source capacity as a function of average energy demand.
Applsci 14 09753 g004
Figure 6. A change in generating source capacity as a function of average energy demand for CASE_1A vs. CASE_0.
Applsci 14 09753 g006
Table 2. Scenario-based characteristics of the selection of the type and capacity of generating sources and the storage capacity in EC1–EC4.
EC1
PMYDMIXPVWIND
PVWINDMSCPVWINDMSCPVWINDMSC
MWhkWkWMWhkWkWMWhkWkWMWh
111.5653.3579.6591.85615.52804.176013.6562.095
212.6744.7379.4681.94216.64304.239015.1662.293
39.0672.1767.9671.44412.13703.389010.6261.666
EC2
PMYDMIXPVWIND
PVWINDMSCPVWINDMSCPVWINDMSC
MWhkWkWMWhkWkWMWhkWkWMWh
17.2782.1136.0791.1689.77202.62808.5941.318
217.3707.86811.9242.50522.95005.133021.1173.467
314.8875.83111.1672.81219.36404.665018.2913.589
EC3
PMYDMIXPVWIND
PVWINDMSCPVWINDMSCPVWINDMSC
MWhkWkWMWhkWkWMWhkWkWMWh
19.8834.4776.7841.42513.05802.920012.0151.973
218.2455.29715.2392.92724.49706.588021.5433.305
310.3693.0108.6601.66413.92203.744012.2431.878
EC4
PMYDMIXPVWIND
PVWINDMSCPVWINDMSCPVWINDMSC
MWhkWkWMWhkWkWMWhkWkWMWh
15.2891.9773.9510.8106.94601.76906.3290.957
21.7970.8141.2330.2592.37400.53102.1850.359
30.9970.2890.8330.1601.33900.36001.1770.181
42.5920.7532.1650.4163.48000.93603.0610.470
54.7851.3893.9970.7686.42501.72805.6510.867
66.2942.4654.7221.1898.18801.97307.7341.518
76.3892.8944.3860.9218.44101.88807.7671.275
85.8892.4244.1850.8457.73001.86707.0691.084
91.9970.9041.3710.2882.63800.59002.4270.398
103.1971.2522.3980.6044.15901.00203.9280.771
P—Prosument Id, MYD—Mean Yearly Demand, MSC—Maximum Storage Capacity.
Table 3. Scenario-based characteristics of the selection of the type and capacity of generating sources and the storage capacity in EC1.
CASEMIXPVWIND
PVWINDMSCPVWINDMSCPVWINDMSC
kWMWhkWMWhkWMWh
09.97027.3445.16744.288011.759039.4126.013
1A11.85535.89612.10169.873026.770053.23812.713
1B25.3366.2351.32692.016019.019081.0052.890
Table 4. Quantiles of distribution—the relationship of the change of energy storage capacity [%] as a function of mean yearly demand [MWh] for CASE_1A vs. CASE_0.
src\Quantileq.0%q.10%q.20%q.30%q.40%q.50%q.60%q.70%q.80%q.90%q.100%
mix169.16171.77172.14172.53173.03173.75174.58175.76177.80180.52185.11
pv206.90208.21208.56208.71208.80208.87208.95209.08209.26209.63213.02
wind176.52177.09177.16177.22177.28177.35177.41177.50177.77178.51181.31
Table 5. Quantiles of distribution—the relationship of the change of source size [%] as a function of mean yearly demand [MWh] for CASE_1A vs. CASE_0.
q.0%q.10%q.20%q.30%q.40%q.50%q.60%q.70%q.80%q.90%q.100%
mix127.44127.97128.12128.21128.28128.34128.39128.47128.54128.66129.18
pv152.85155.47156.06156.30156.47156.60156.72156.89157.11157.48162.04
wind134.17136.00136.15136.23136.28136.32136.36136.41136.48136.59138.96
Table 7. Quantiles of distribution—the relationship of the change of source size [%] as a function of mean yearly demand [MWh] for CASE_1A vs. CASE_0.
src\Quantileq.0%q.10%q.20%q.30%q.40%q.50%q.60%q.70%q.80%q.90%q.100%
mix222.77227.31228.47229.27229.98230.45231.06231.64232.53234.02252.33
pv206.02209.49209.76209.85209.90209.94209.97210.01210.05210.11210.80
wind160.75170.84172.77173.70174.43174.99175.57176.36177.46182.56210.66
Table 8. Scenario-based characteristics of the selection of the type and capacity of generating sources and the storage capacity in EC2–EC4.
EC2
CASEMIXPVWIND
PVWINDMSCPVWINDMSCPVWINDMSC
kWMWhkWMWhkWMWh
016.67228.0566.02551.965012.329047.7968.236
1A18.24639.21213.93181.049028.073065.23716.117
1B49.26254.8281.607108.983018.642080.7795.271
EC3
CASEMIXPVWIND
PVWINDMSCPVWINDMSCPVWINDMSC
kWMWhkWMWhkWMWh
013.26830.1596.00051.446013.243045.7697.150
1A16.12539.77413.89481.939030.311061.87014.876
1B32.65470.6311.560106.841021.385090.6923.810
EC4
CASEMIXPVWIND
PVWINDMSCPVWINDMSCPVWINDMSC
kWMWhkWMWhkWMWh
015.66028.5585.92651.593012.548047.1577.697
1A17.44939.15113.3580.539028.562064.17415.223
1B44.37158.6151.413108.113019.304083.9944.318
Disclaimer/Publisher’s Note: The statements, opinions and data contained in all publications are solely those of the individual author(s) and contributor(s) and not of MDPI and/or the editor(s). MDPI and/or the editor(s) disclaim responsibility for any injury to people or property resulting from any ideas, methods, instructions or products referred to in the content.

