4.1. Aerodynamic Loads on the Pantograph
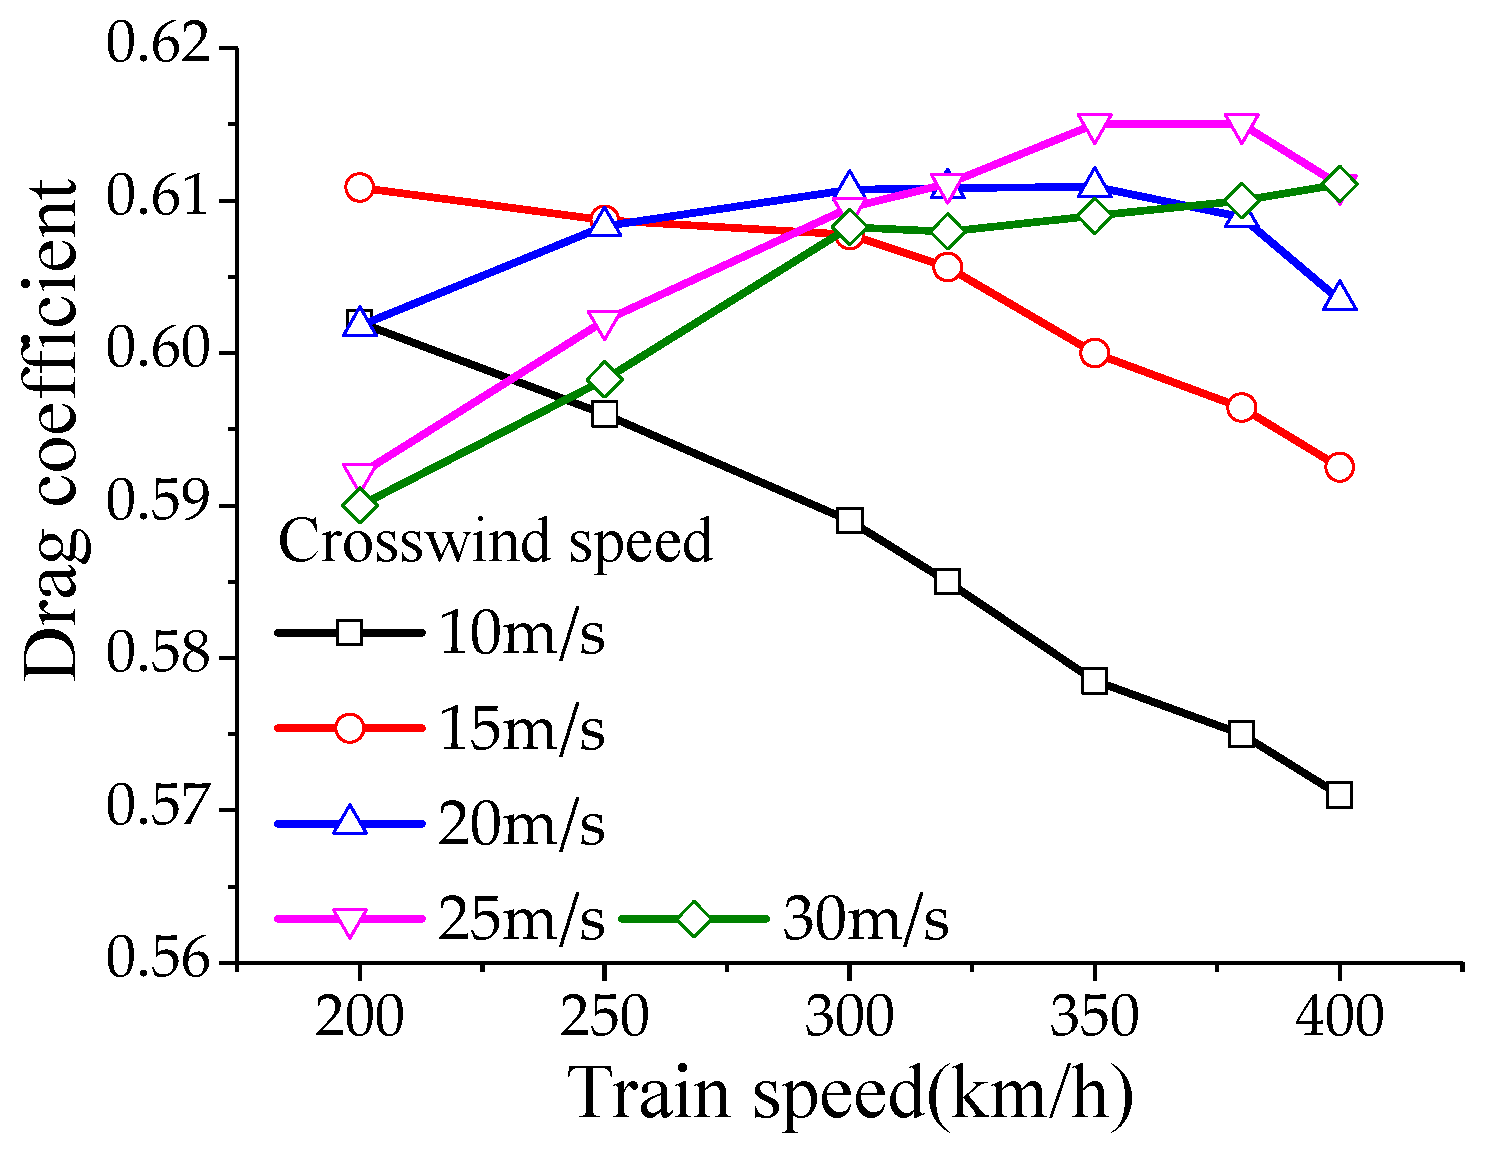
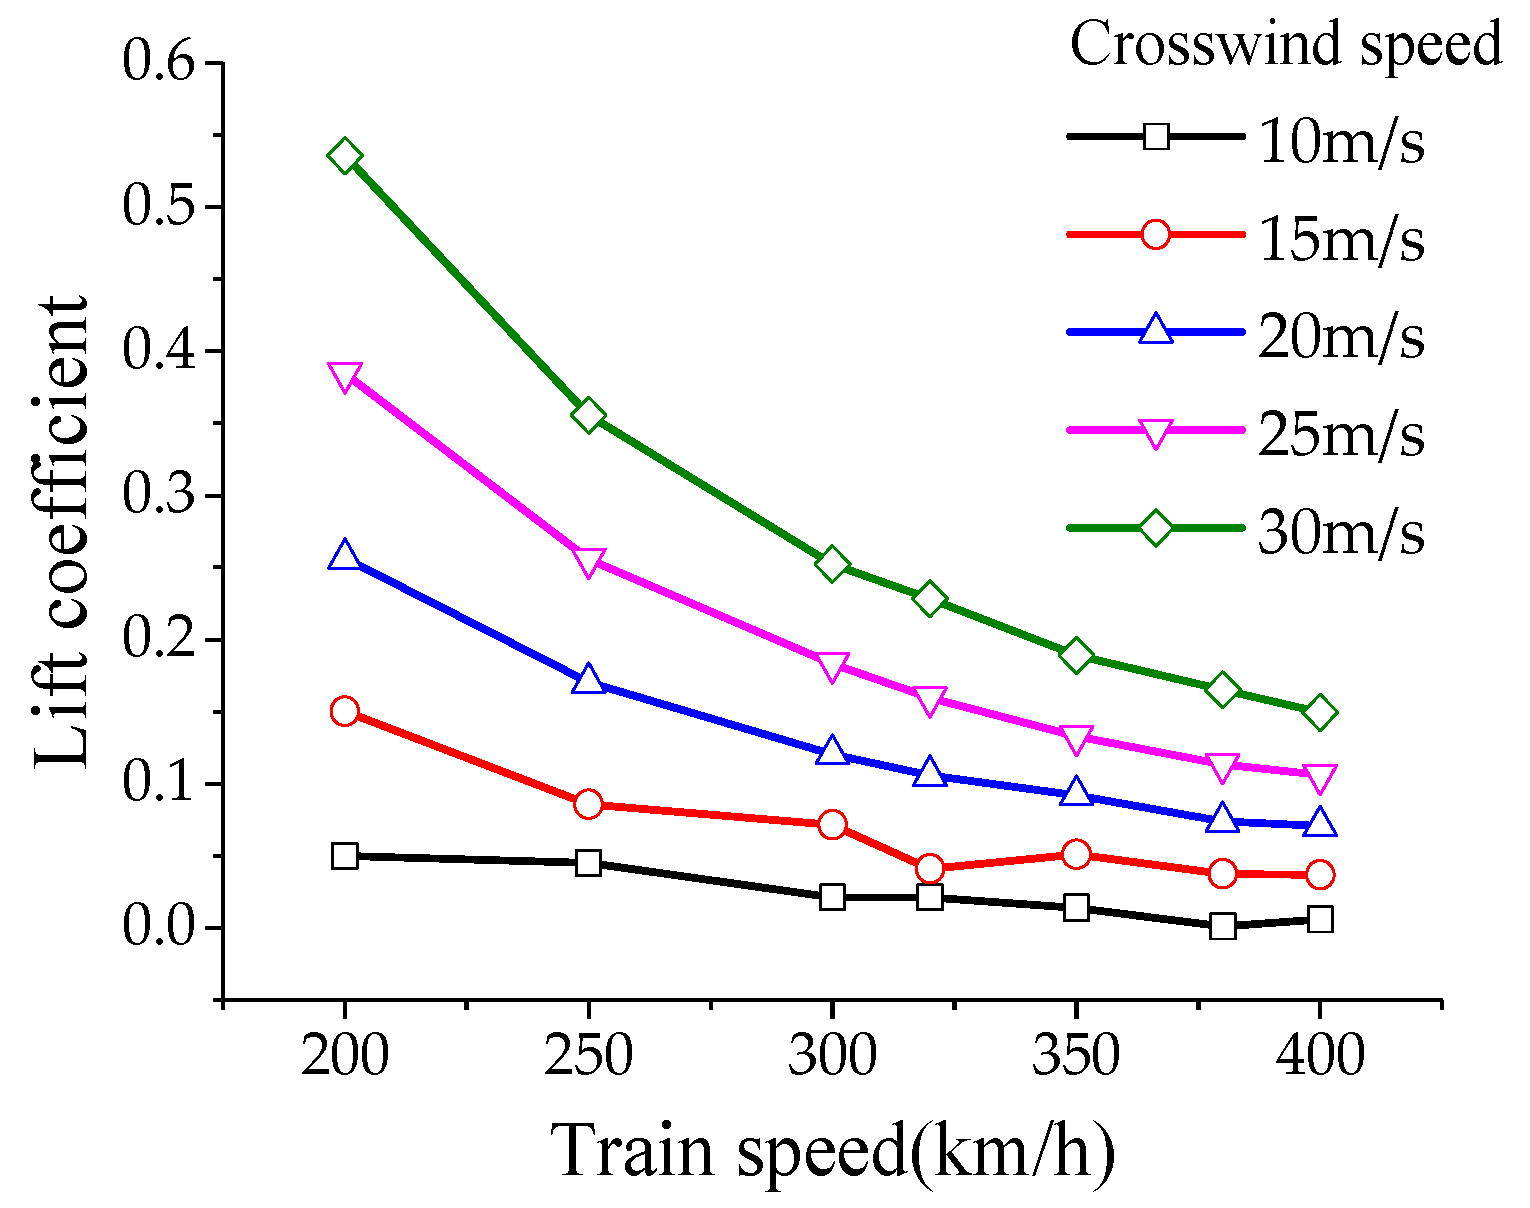
To analyze the aerodynamic lift experienced by the pantograph, the calculation conditions for the aerodynamic loads on the pantograph were as follows: the operating speed of the high-speed train ranges from 200 km/h to 400 km/h (in increments of 50 km/h), with crosswind speeds of 10, 15, 20, 25, and 30 m/s, and crosswind angles ranging from 10° to 90° (in increments of 10°). According to the results of the numerical simulations, under the influence of crosswind, the drag coefficient of the pantograph varies non-monotonically with increasing train speed, reaching its maximum value at a speed of 350 m/s and then decreasing. The lift and lateral force coefficients decrease monotonically with increasing train speed. The drag coefficient of the pantograph varies non-monotonically with increasing crosswind speed, reaching its maximum value at a crosswind speed of 25 m/s and then decreasing. The lift and lateral force coefficients increase monotonically with increasing crosswind speed. The drag, lift, and lateral force coefficients increase monotonically with increasing crosswind angle, with the maximum drag coefficient occurring at a crosswind speed of 30 m/s and a crosswind angle of 90°, as shown in
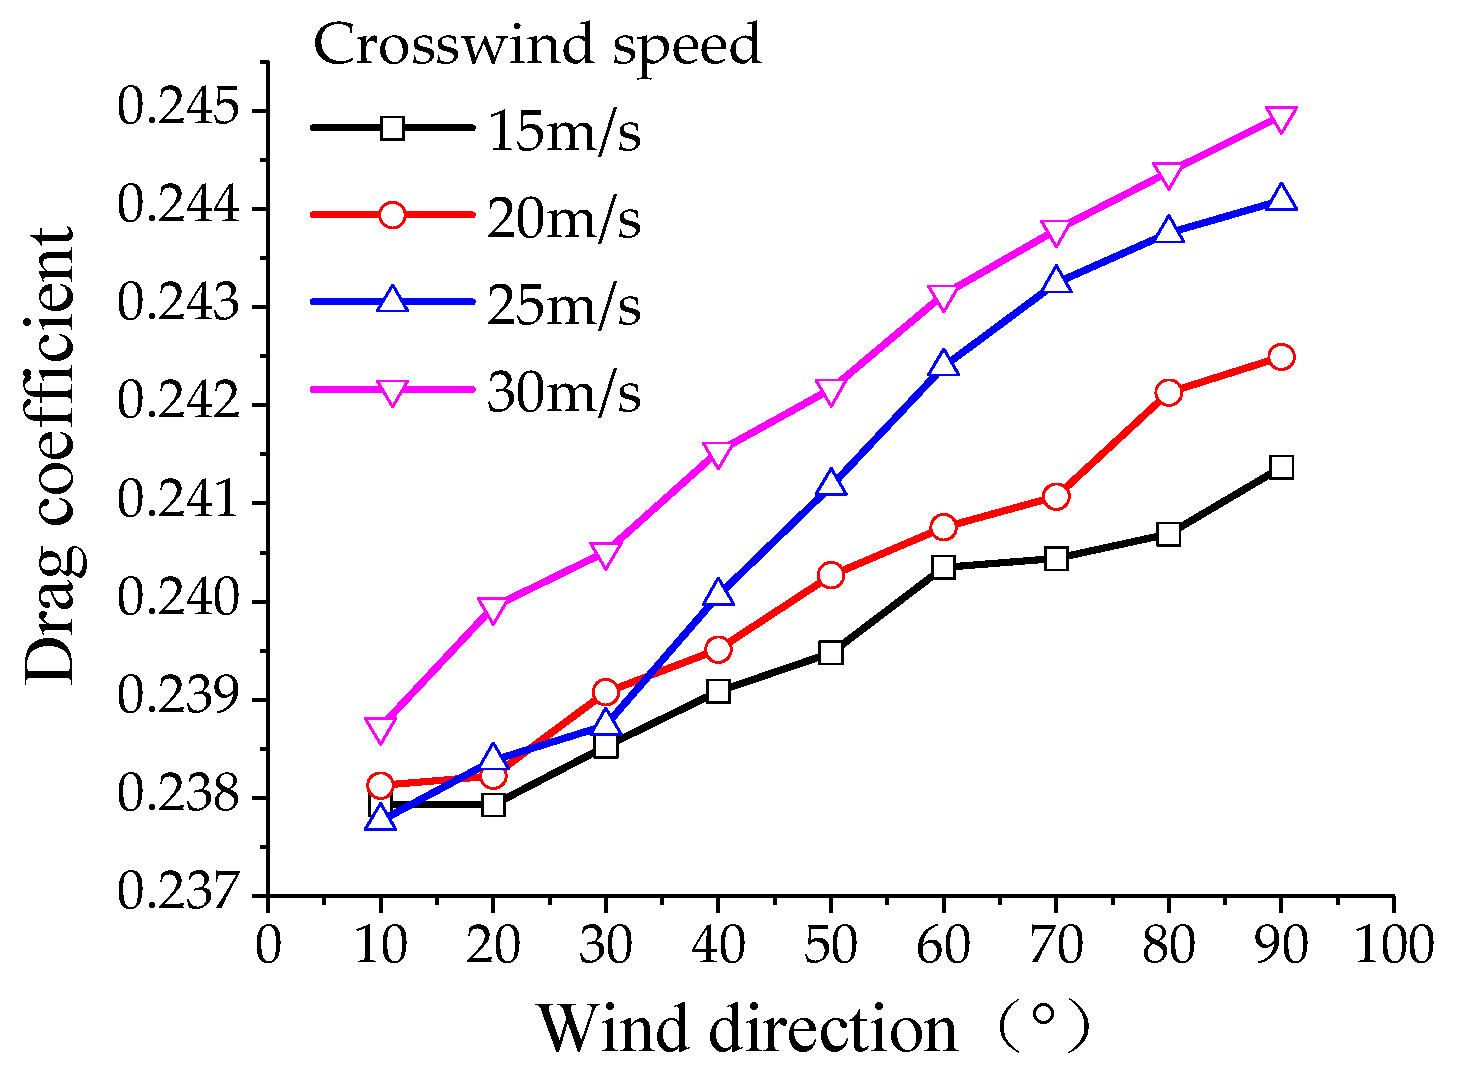
Figure 11,
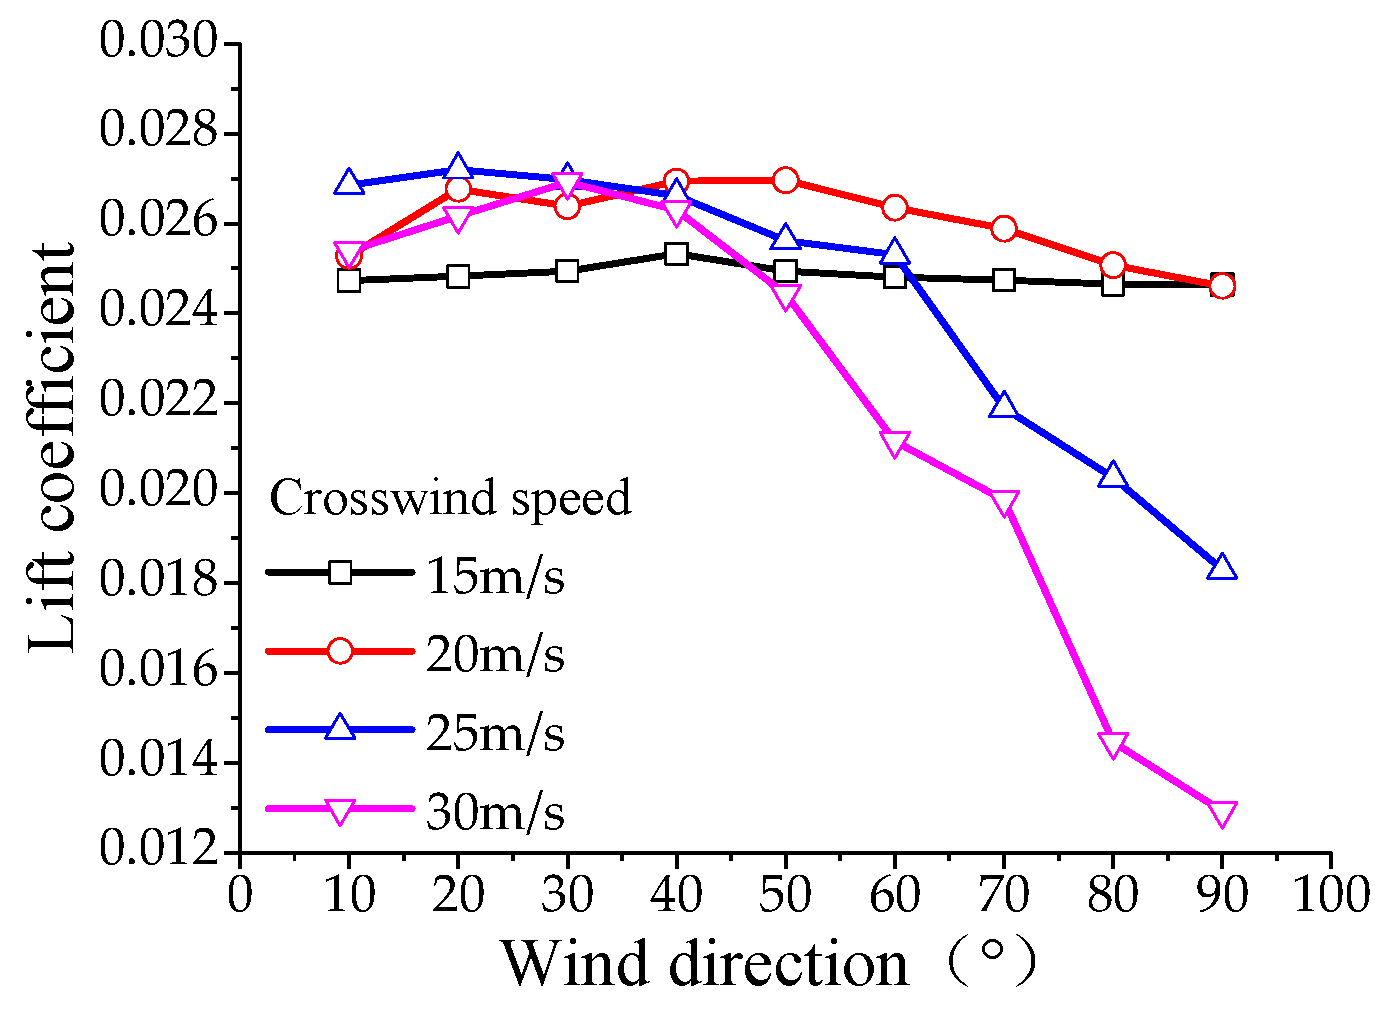
Figure 12 and
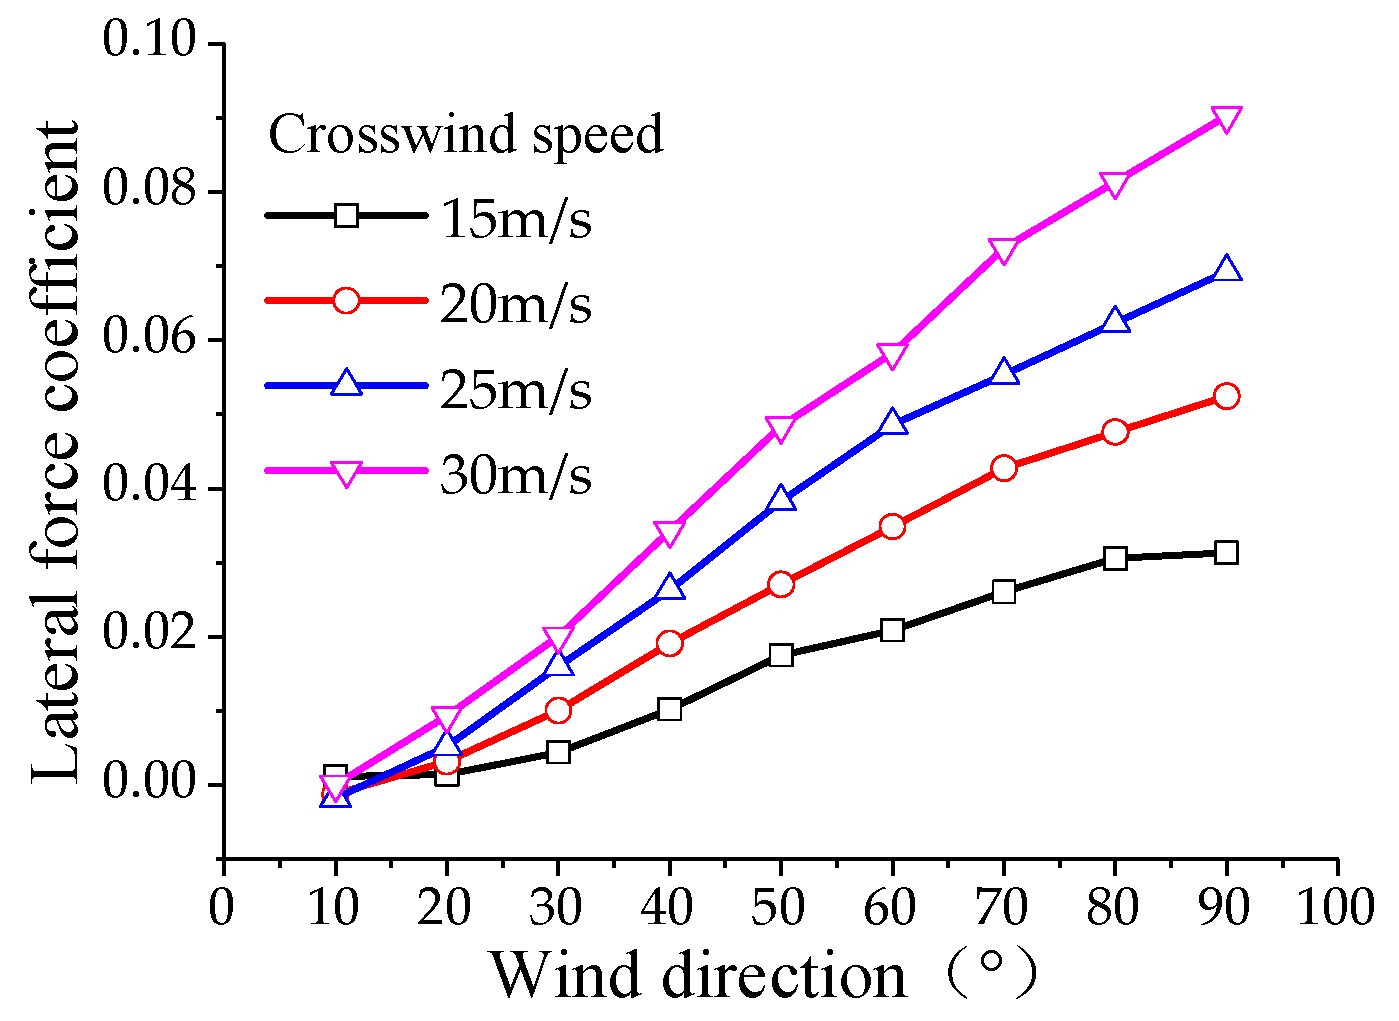
Figure 13.
Figure 11 shows the drag coefficient variation with train speed. The drag coefficient increases non-linearly, peaking at around 350 km/h and then decreasing. This behavior is due to the complex interaction between aerodynamic forces and the pantograph structure, where certain speeds maximize aerodynamic resistance.
Figure 12 depicts the variation in the lift coefficient with train speed. The lift coefficient decreases steadily as the train speed increases, indicating that the aerodynamic lift acting on the pantograph becomes less pronounced at higher speeds, which helps maintain stable contact with the overhead line.
Figure 13 presents the lateral force coefficient’s response to changes in train speed and crosswind speed. As both factors increase, the lateral force coefficient also increases, highlighting the destabilizing effect of crosswinds on the pantograph, particularly at higher speeds.
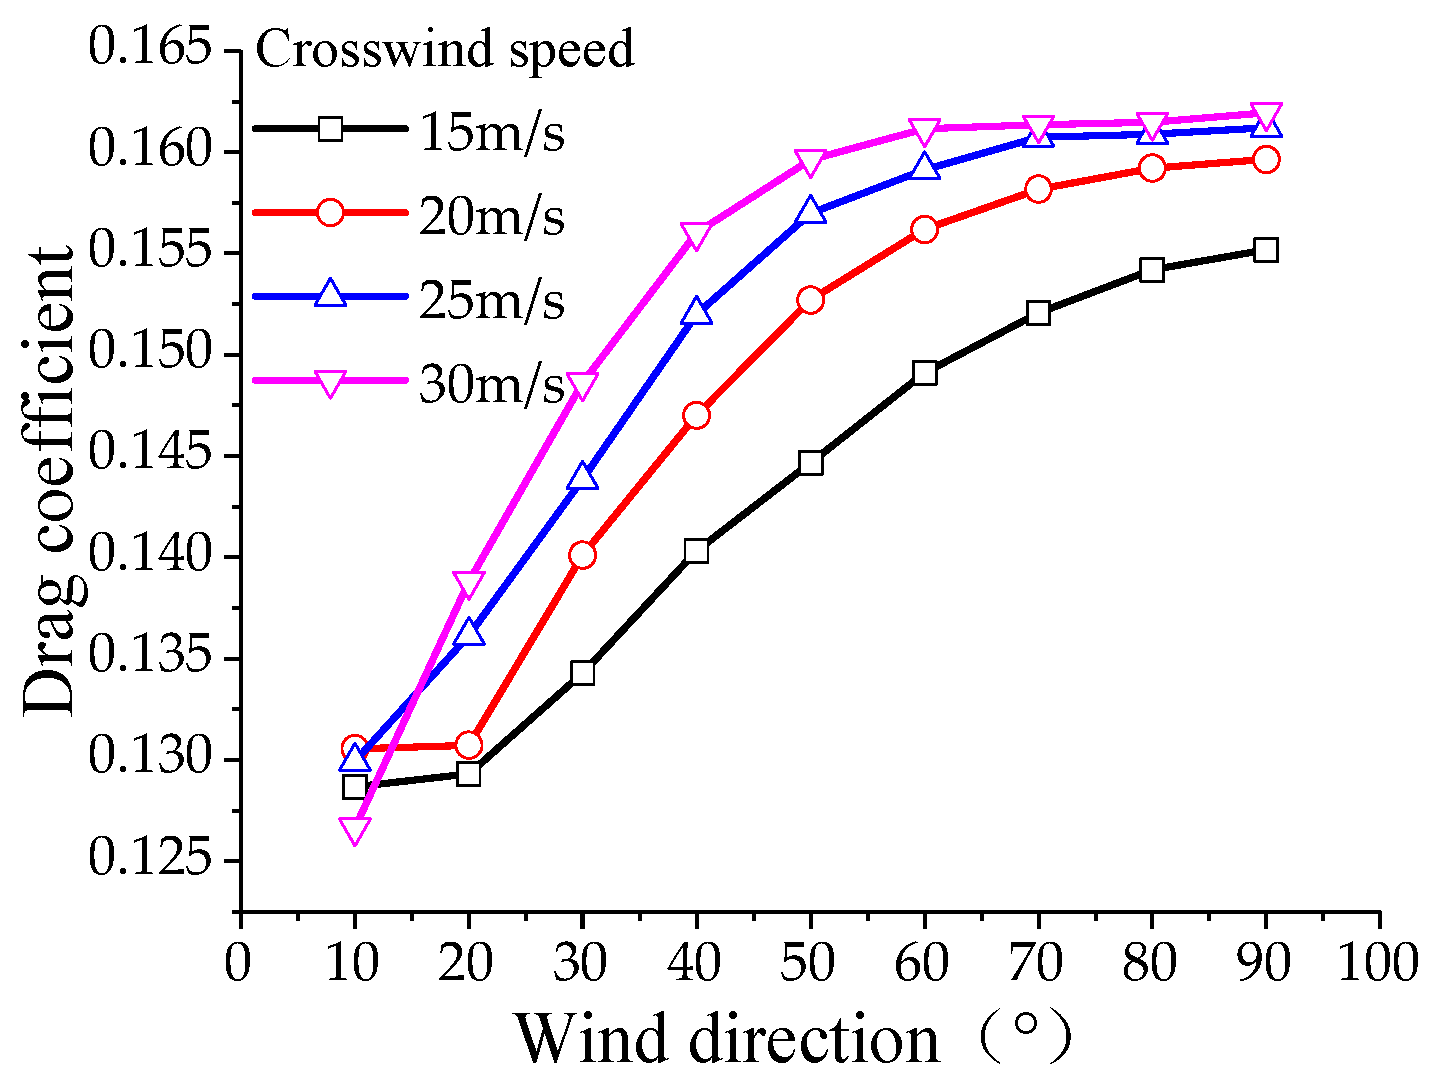
Figure 14 shows that the drag coefficient seems to generally decrease as the train speed increases for most crosswind conditions (especially at higher speeds). The fitting lines for crosswind speeds show different trends, where some lines have positive slopes (e.g., 15 m/s and 30 m/s crosswinds) and others have negative slopes (e.g., 10 m/s, 20 m/s, and 25 m/s crosswinds). The confidence bands (shaded regions) around the linear fits suggest the certainty in the model’s estimates. Wider confidence bands at lower and higher speeds, particularly for 30 m/s and 15 m/s, indicate higher uncertainty. The 95% prediction bands suggest expected variability in new data points, showing the drag coefficient fluctuates more in certain speed intervals (lower for faster speeds).
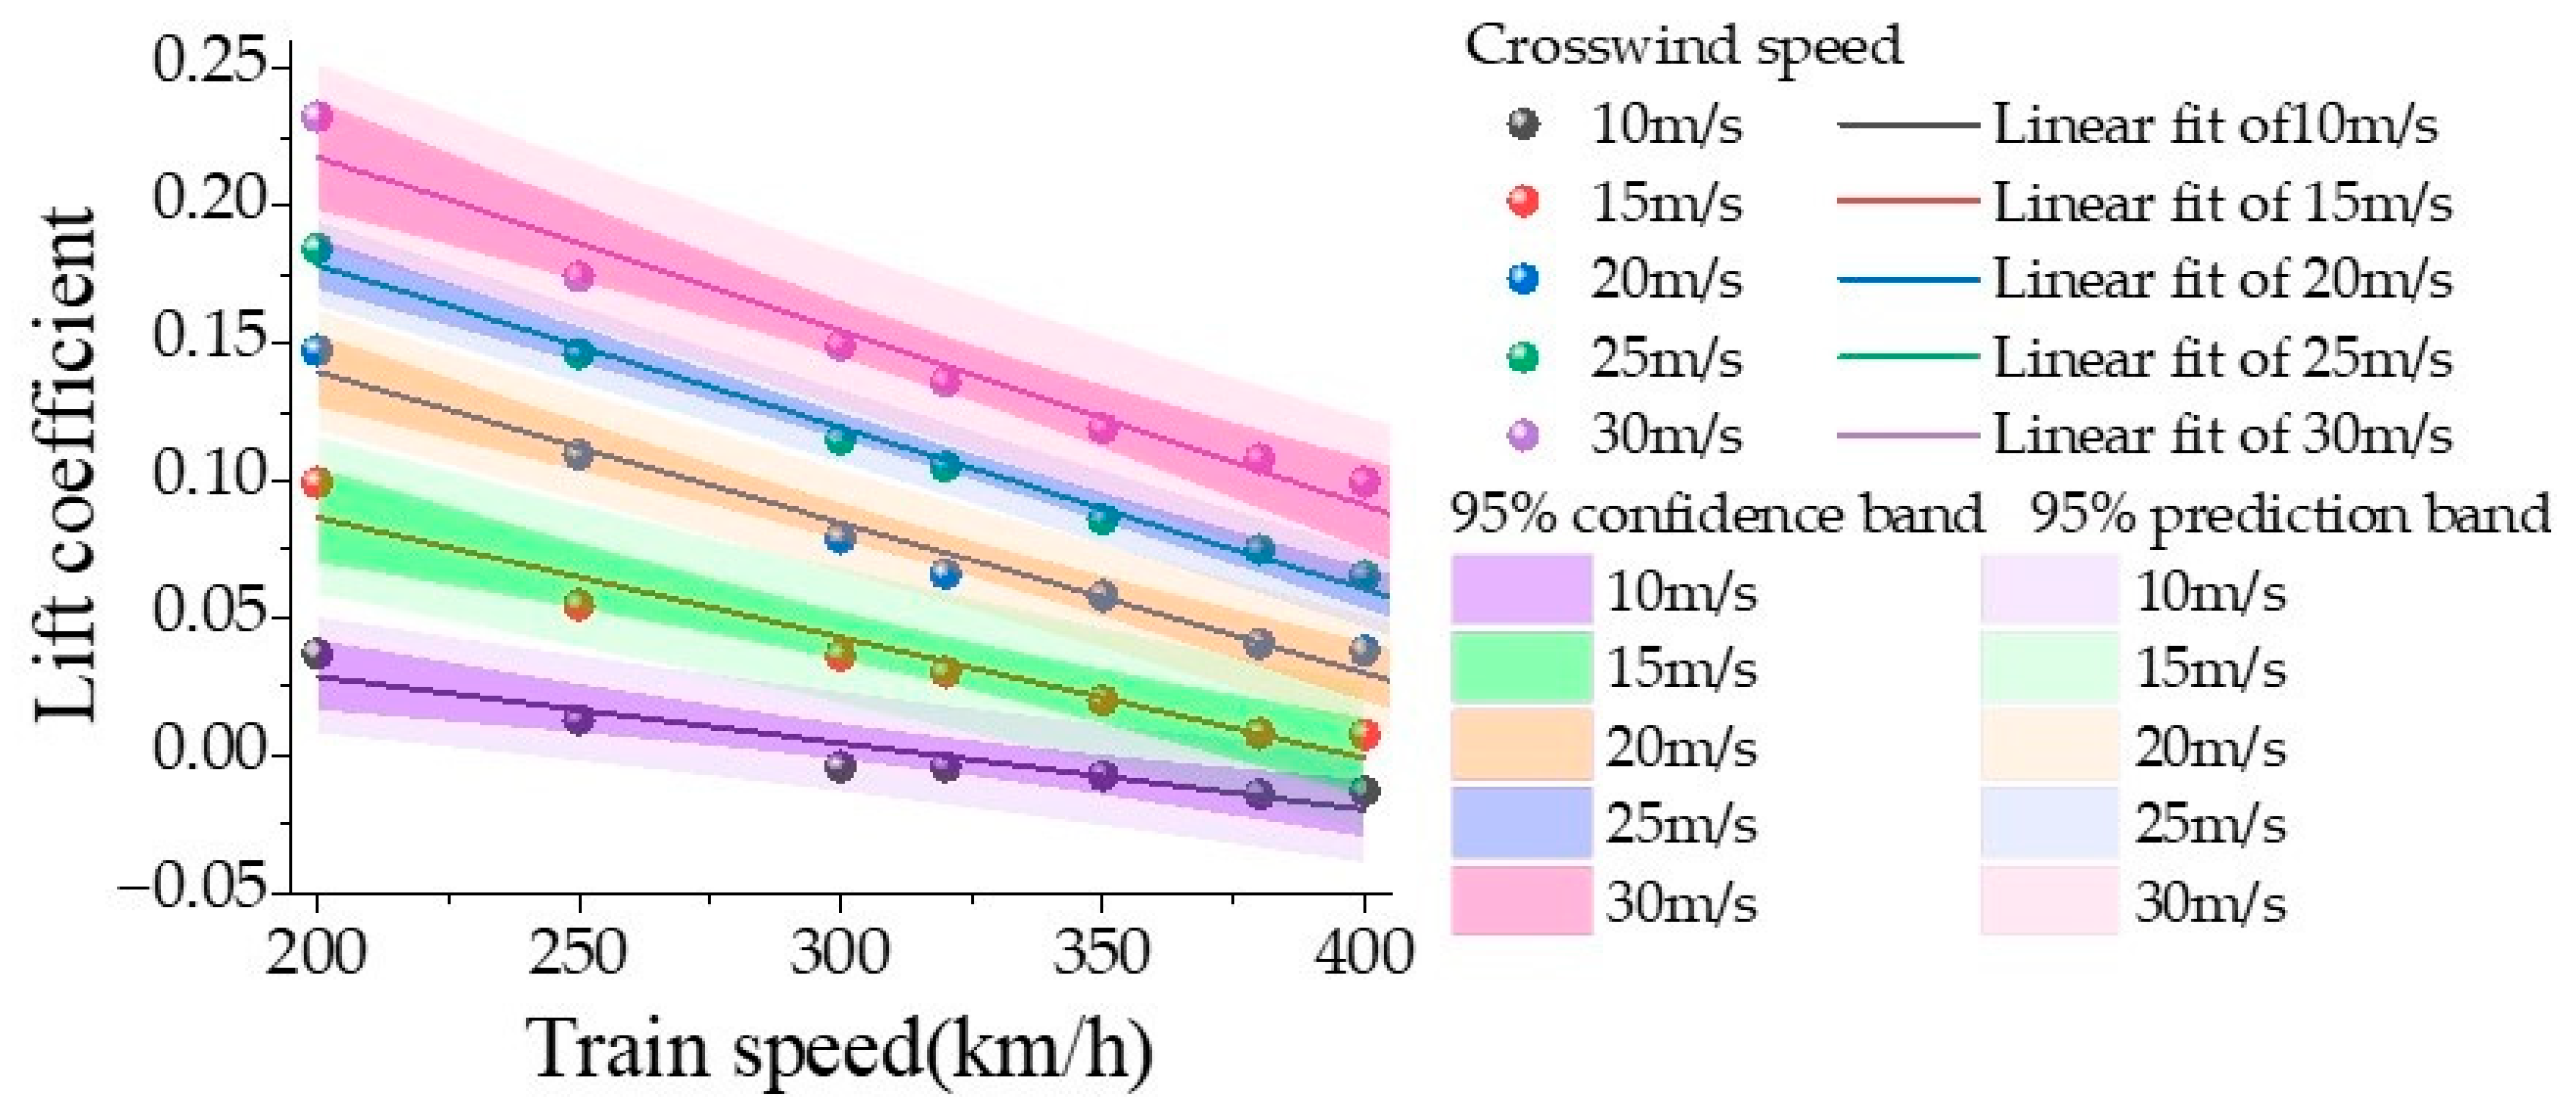
Figure 15 shows the lift coefficient generally decreases with increasing train speed across all crosswind speeds (10 m/s to 30 m/s). The linear fits for the various crosswind speeds follow almost parallel paths, indicating a consistent trend across wind conditions. Confidence intervals (shaded regions) are tighter for lower crosswind speeds (10 m/s and 15 m/s), indicating a higher certainty in the model’s fit for these conditions. In contrast, for higher crosswind speeds (25 m/s and 30 m/s), the confidence and prediction intervals are wider, showing greater uncertainty and variability at these higher wind speeds.
Figure 16 illustrates the lateral force coefficient tends to decrease as the train speed increases, which is consistent across all crosswind speeds. There is a clear separation between the different crosswind speeds, with higher crosswind speeds (e.g., 30 m/s) showing larger lateral force coefficients. The confidence intervals (shaded regions) show relatively narrow bands for lower wind speeds (10 m/s, 15 m/s, 20 m/s), suggesting a reliable model fit. The prediction bands show that variability is relatively low, even for higher wind speeds. Notably, the confidence bands for 30 m/s are wide, reflecting uncertainty in the lateral force coefficient at high crosswind speeds.
Based on the numerical simulation, a comprehensive relationship equation for the aerodynamic forces and moment coefficients of the pantograph with respect to the train speed, crosswind speed, and wind direction angle is proposed. Taking the aerodynamic drag of the pantograph as an example, the aerodynamic drag
Fx is related to the pantograph’s operating speed (i.e., train speed)
, crosswind speed
, air density
, dynamic viscosity coefficient
, characteristic size of the pantograph
, and surface roughness of the pantograph
, and can be expressed by the following equation:
Based on
, therefore, as follows:
The drag coefficient of the pantograph is given by
where
, thus can derive, as follows:
Since the geometric dimensions of the pantograph remain constant, and
is a constant, the drag coefficient of the pantograph is only related to
and
. Expressing
in the form of
, where
and
represent the train speed and crosswind speed, respectively, and their ratio is dimensionless, defined as the wind speed to train speed ratio
,
. Thus, we have the following:
From the above equation, it is evident that the drag coefficient of the pantograph is only related to the wind speed to train speed ratio and the cosine of the crosswind angle cos θ. Based on the variation patterns of the aerodynamic force and moment coefficients of the pantograph, a functional form can be obtained, thus providing the specific expression of the drag coefficient. By fitting the data, the values of the coefficients in the equation can be determined, leading to the final comprehensive relationship between the drag coefficient and the train speed, crosswind speed, and wind direction angle.
Let
, substituting it into Equation (7), we can obtain the specific expression of the drag coefficient, as follows:
In the above equation, a, b, c, m, and n are undetermined coefficients, which are solved through data fitting to obtain
,
,
,
, and
, thereby obtaining the drag coefficient, as follows:
When the wind direction angle θ = 90°, the drag coefficient is ; when the wind direction angle θ = 0°, the drag coefficient is . The above equation considers the special conditions when the wind direction is 0° and 90°. For situations without crosswind (), a separate treatment is required. Similarly, the comprehensive relationship equations for the lift coefficient, lateral force coefficient, and aerodynamic coefficient with respect to vehicle speed, crosswind speed, and wind direction angle can be obtained.
Sideways force coefficient:
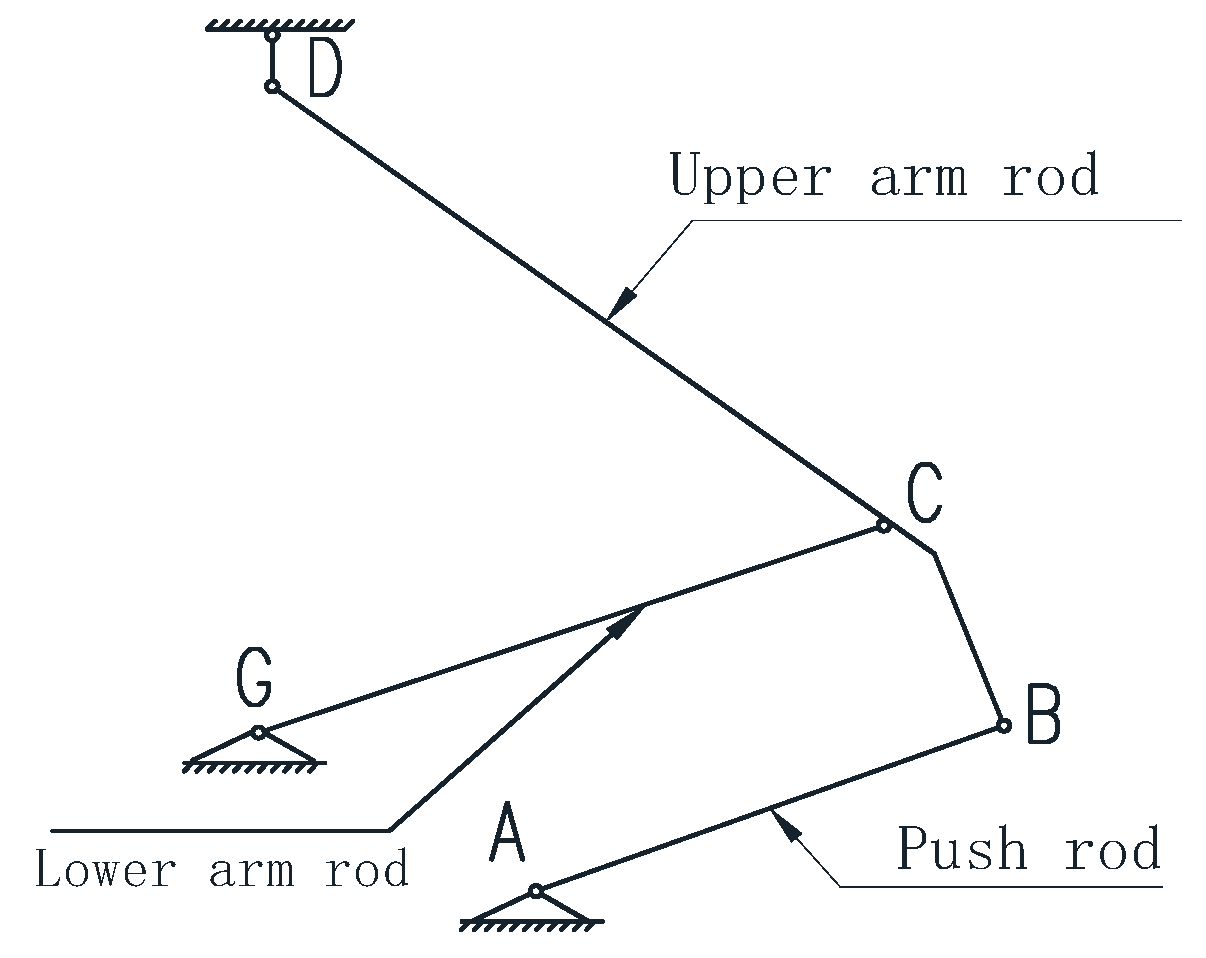
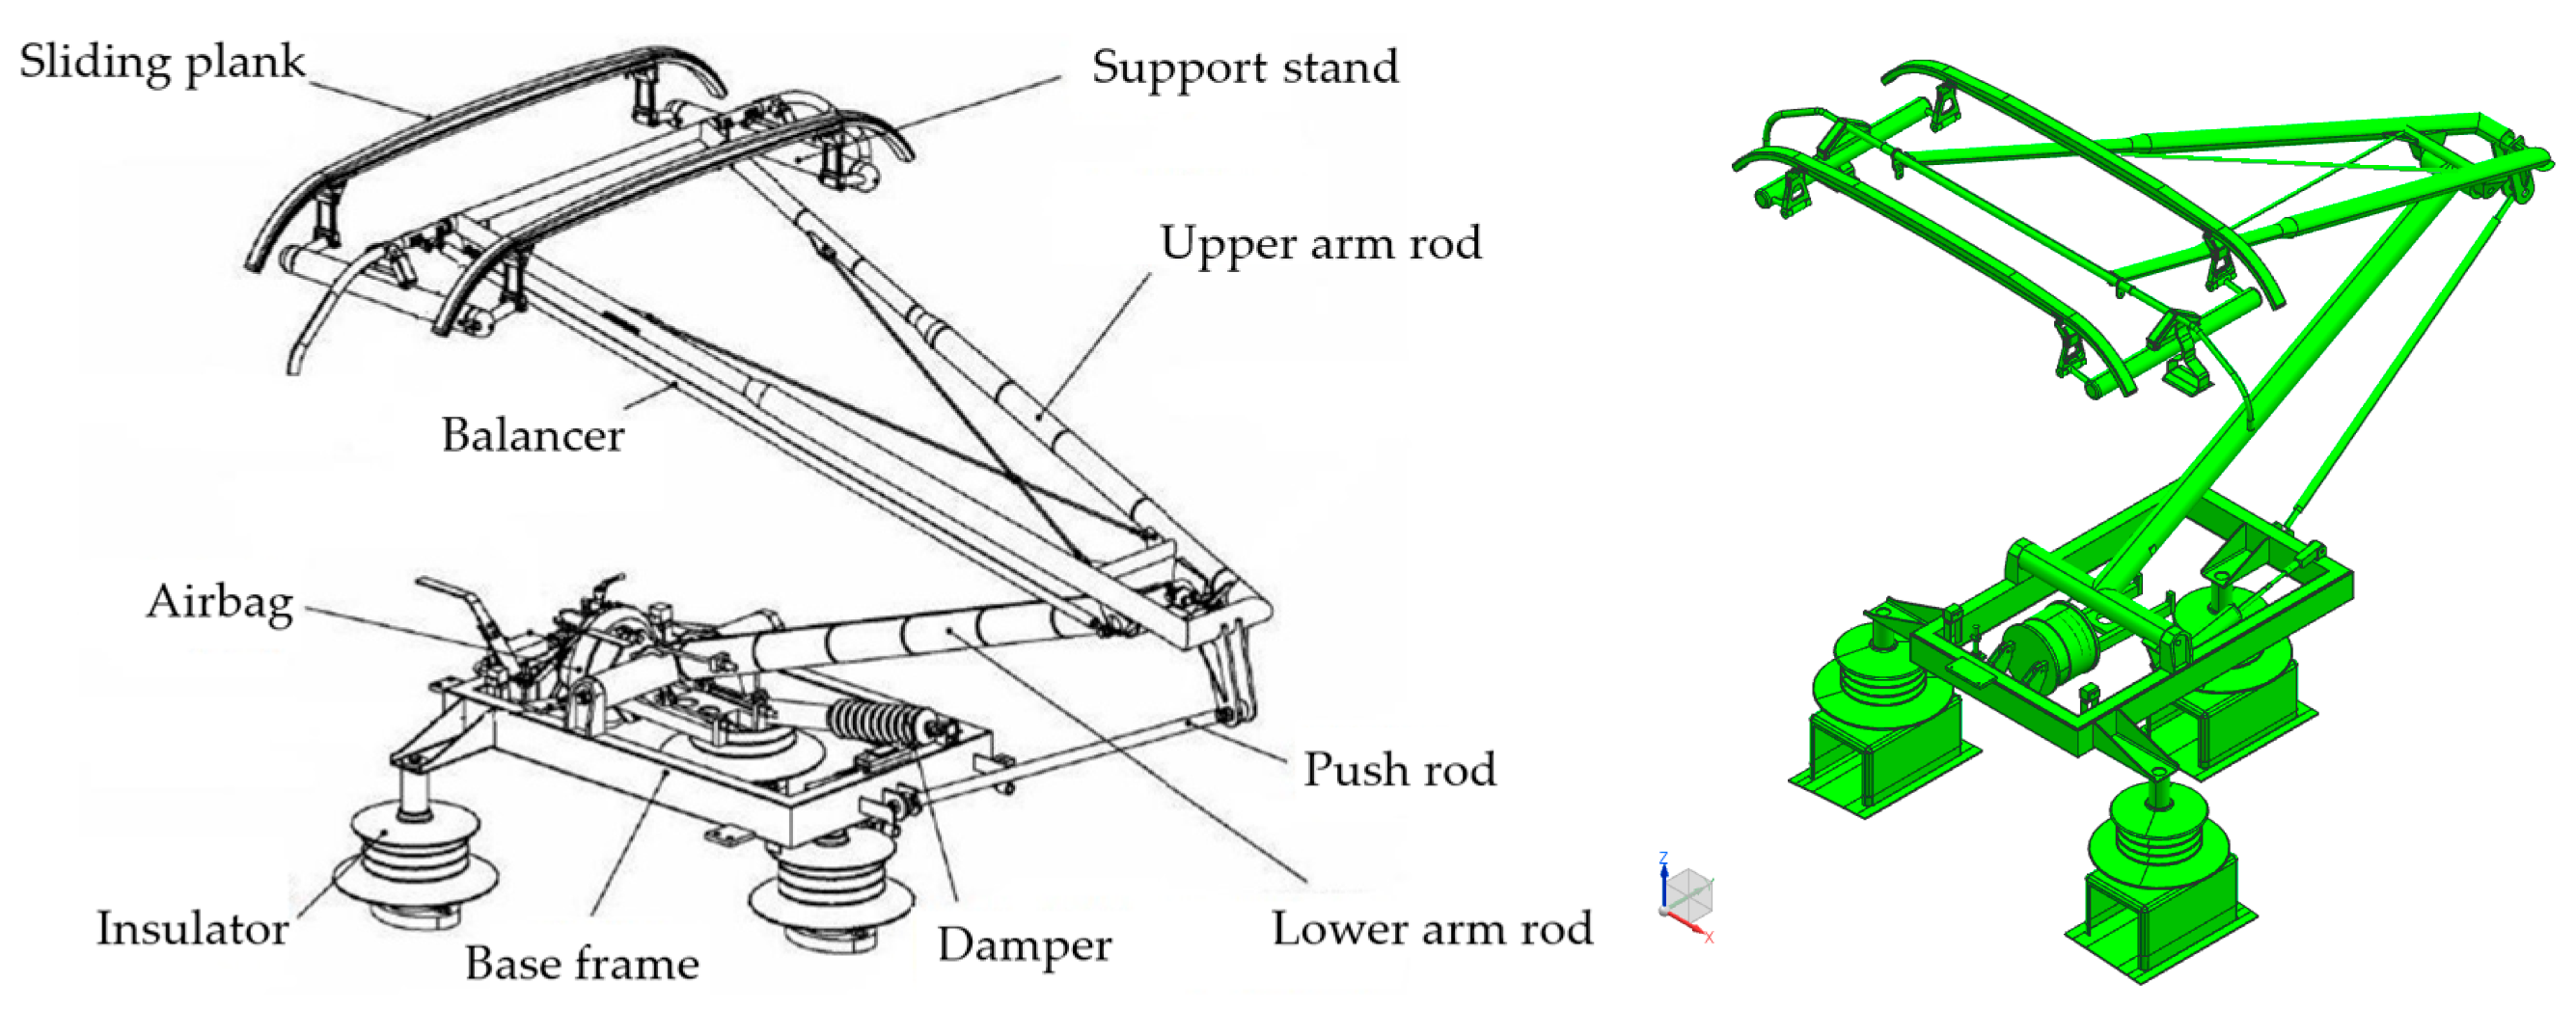
To analyze the aerodynamic lift forces acting on the components of the high-speed train pantograph, aerodynamic loads for the head, upper framework, and lower arm were obtained through numerical simulations. The variation patterns of aerodynamic loads for the head are shown in
Figure 17,
Figure 18 and
Figure 19, for the upper framework in
Figure 20,
Figure 21 and
Figure 22, and for the lower arm in
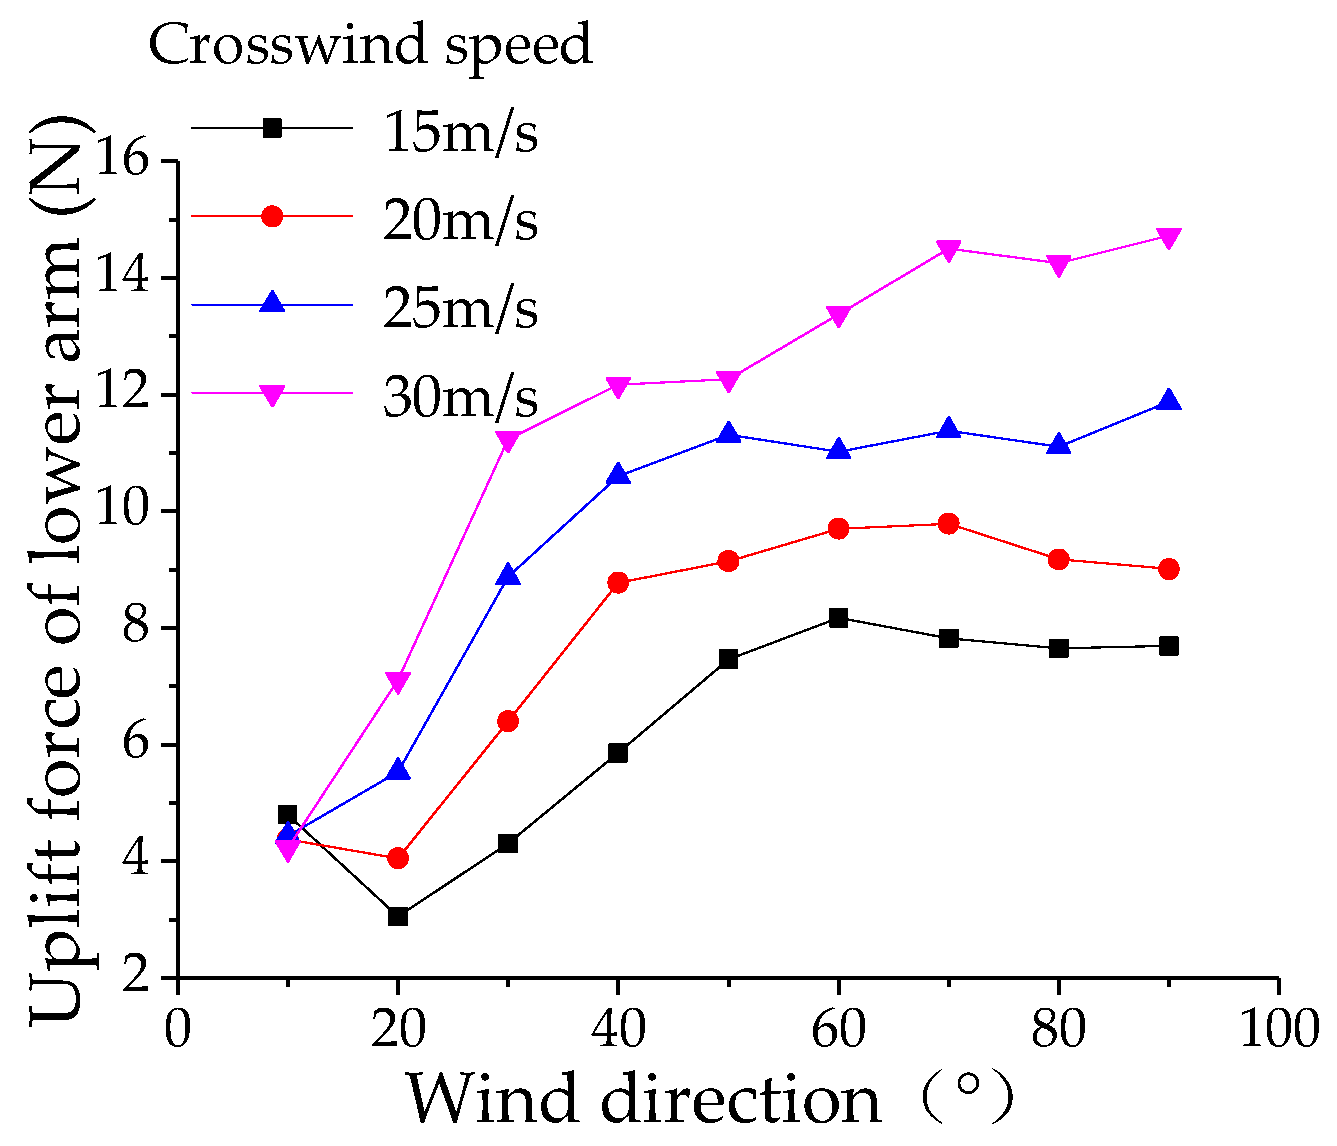
Figure 23,
Figure 24 and
Figure 25. Under the influence of crosswinds, with increasing wind speed and wind direction angle, the resistance, lateral force coefficients, overturning moment, and lateral moment coefficients of the head, upper framework, and lower arm exhibit consistent trends with those of the pantograph, but with values lower than those experienced by the pantograph under corresponding crosswind speeds and angles. Among these components, the head exhibits the highest resistance coefficient, indicating a clear direction for reducing drag on a per-component basis. Compared to the pantograph, the lift coefficient patterns for the head, upper framework, and lower arm show significant changes. Therefore, in the design and optimization process of the pantograph, special attention should be paid to the lift forces acting on the head, upper framework, and lower arm to prevent excessive aerodynamic lift from causing catenary accidents and excessive pitching moments from enhancing longitudinal section vibrations of the pantograph, thereby affecting the stability of current collection from the overhead lines.
4.2. Aerodynamic Lift of the Main Components of the Pantograph
Analysis of the aerodynamic lift of the main components of the pantograph reveals the variation in the aerodynamic lift with the operating speed, crosswind speed, and wind direction angle of the pantograph.
Figure 17,
Figure 18,
Figure 19,
Figure 20,
Figure 21,
Figure 22,
Figure 23,
Figure 24 and
Figure 25 depict the variation in aerodynamic lift of the bow collector, upper frame, and lower arm with the wind direction angle, where the operating speed of the pantograph is 97.22 m/s and the wind direction angle ranges from 10° to 90°.
Figure 26 illustrates the variation in the aerodynamic lift of the bow collector with the vehicle speed and crosswind speed at a wind direction angle of 90°. The aerodynamic lift of the bow collector gradually decreases with an increase in the wind direction angle. When the wind direction angle reaches 60° and the crosswind speed is 30 m/s, the aerodynamic lift of the bow collector sharply decreases and becomes lower than that for the crosswind speeds of 15, 20, and 25 m/s. This indicates that the conditions of maximum crosswind speed and wind direction angle do not necessarily result in the maximum aerodynamic lift.
Figure 17.
Curve of variation in bow head drag coefficient.
Figure 17.
Curve of variation in bow head drag coefficient.
Figure 17 shows the variation in the drag coefficient with wind direction angle. As the wind direction angle increases, the drag coefficient rises due to the increased surface area exposed to the crosswind, leading to higher aerodynamic resistance.
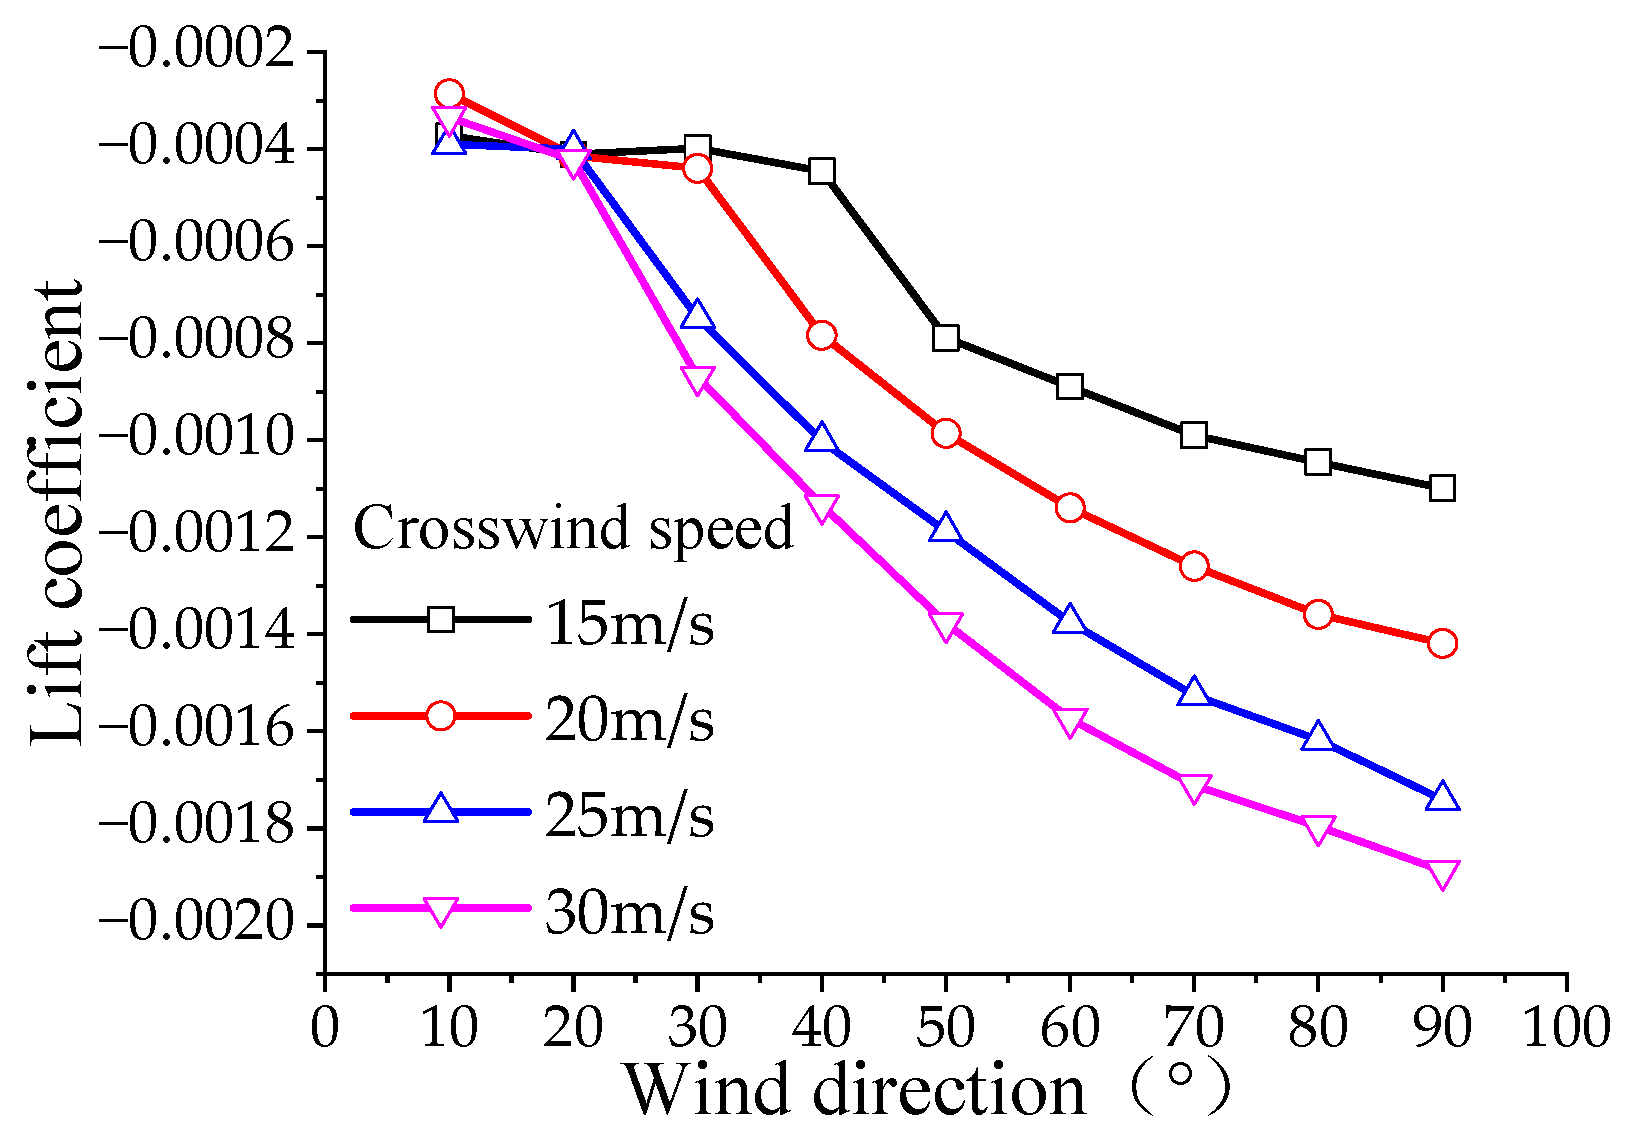
Figure 18.
Curve of variation in bow head lift coefficient.
Figure 18.
Curve of variation in bow head lift coefficient.
Figure 18 illustrates the lift coefficient’s behavior with changing wind direction. The lift coefficient decreases as the wind direction angle increases because the crosswind reduces the vertical upward force acting on the bow head. At higher angles, the airflow around the bow head becomes less efficient at generating lift.
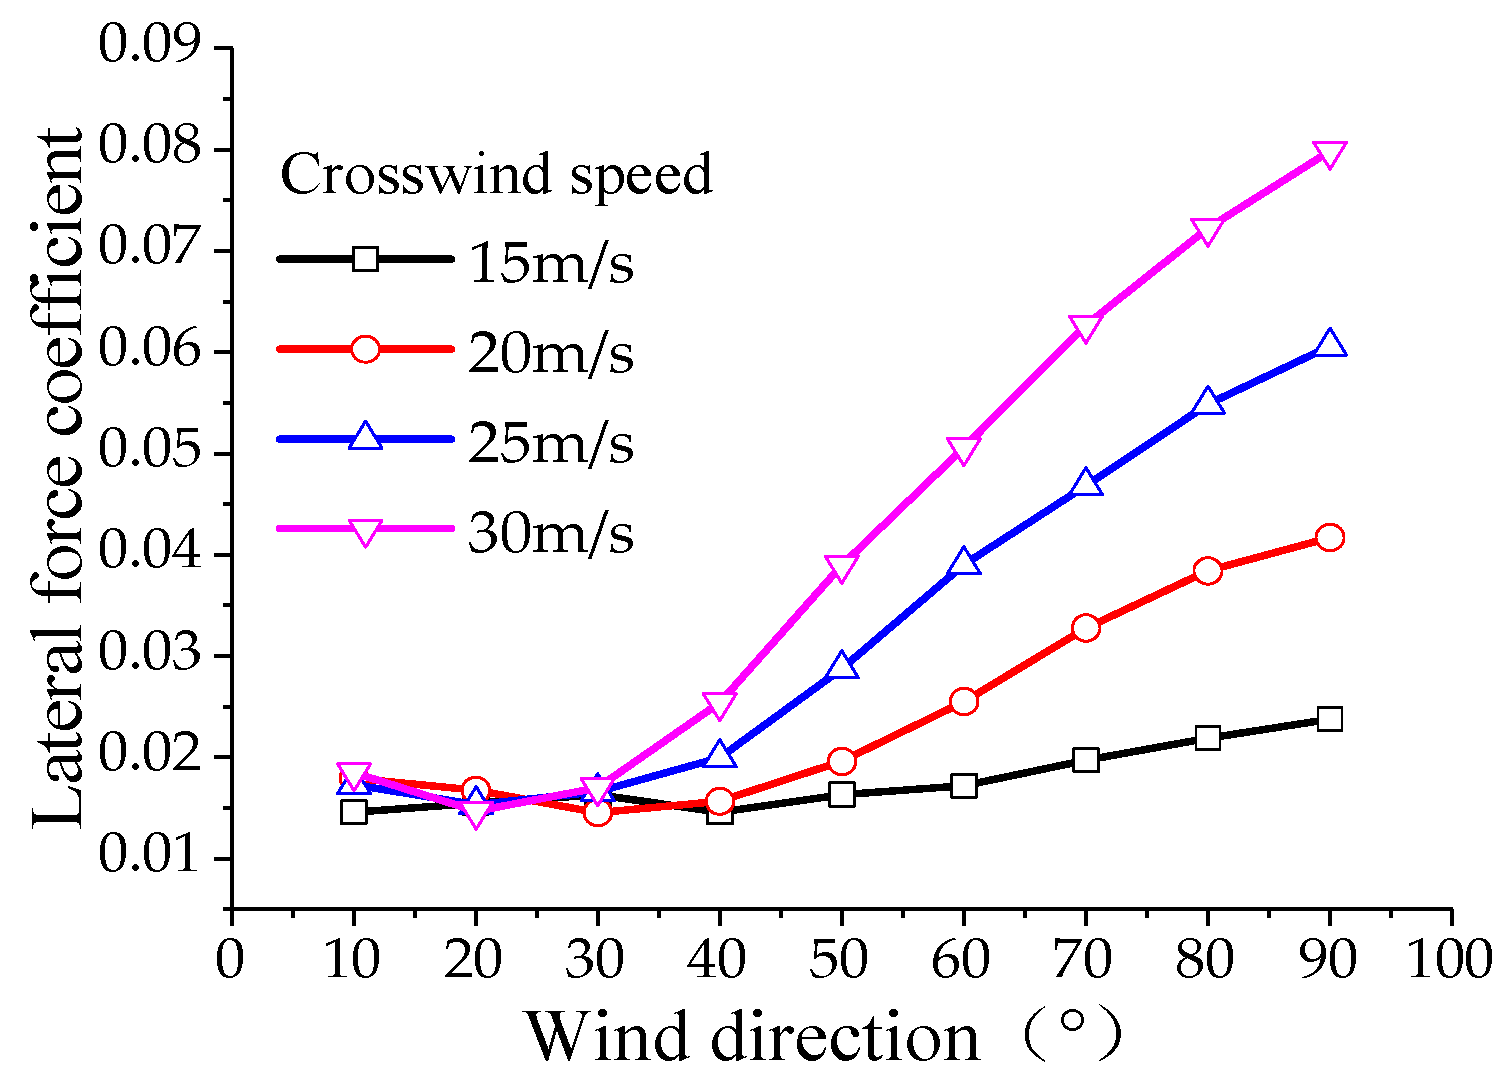
Figure 19 shows the lateral force coefficient increasing with wind direction. The increase occurs because, as the wind angle widens, a larger portion of the wind force is directed horizontally, generating greater lateral force, which could affect the stability of the pantograph.
Figure 19.
Curve of variation in bow head lateral force coefficient.
Figure 19.
Curve of variation in bow head lateral force coefficient.
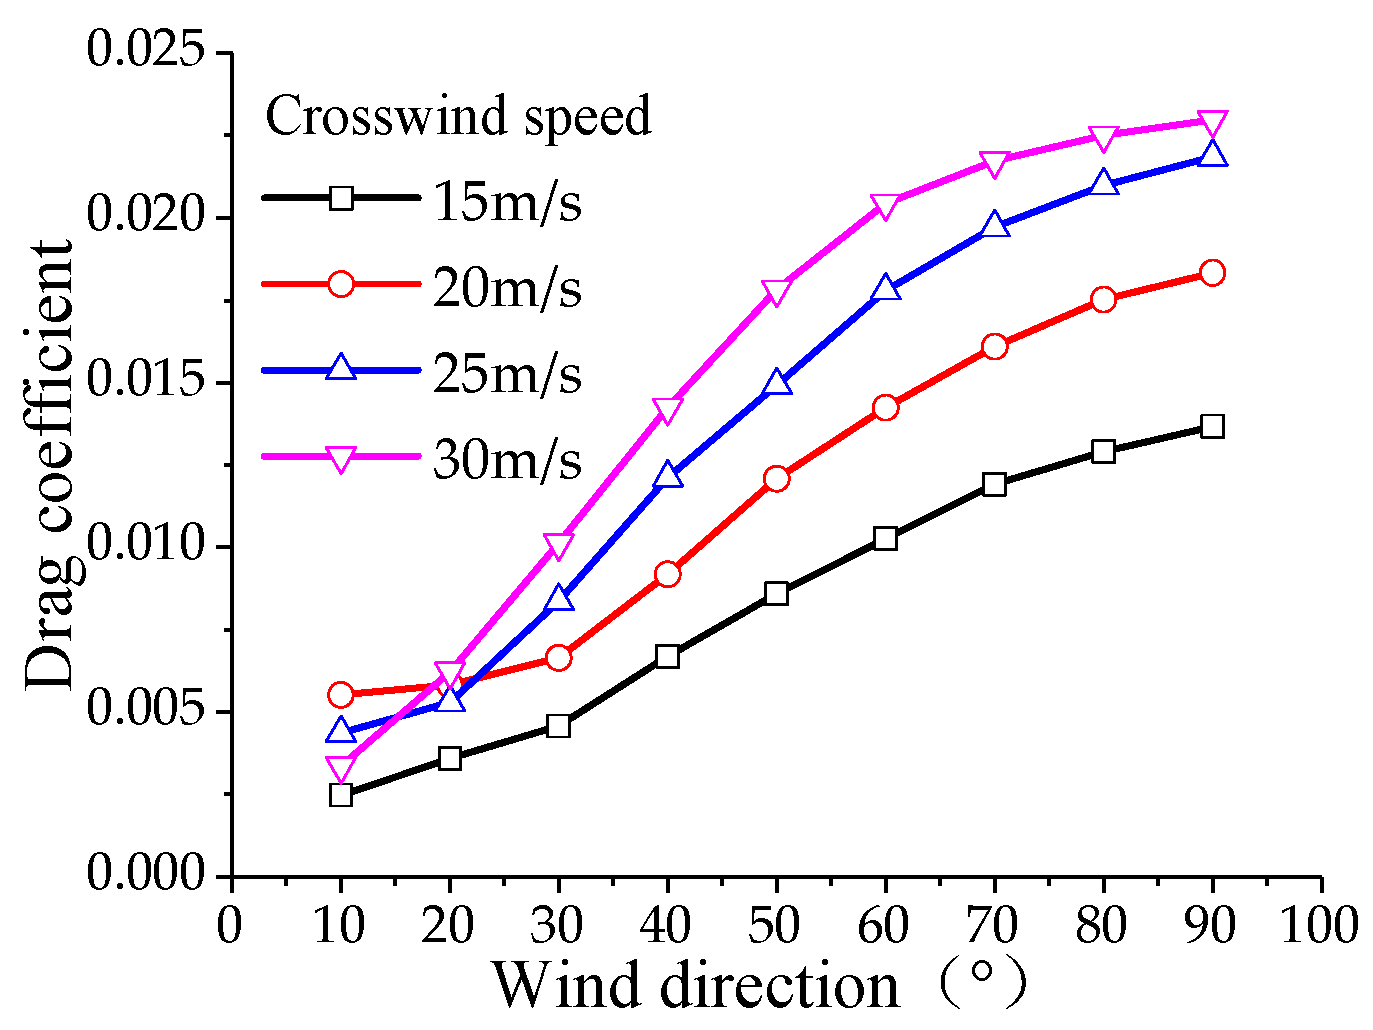
Figure 20 demonstrates how the drag coefficient for the upper frame increases with wind direction. Although similar to the bow head, the magnitude of drag is smaller due to the upper frame’s smaller frontal area and different geometry, which results in less aerodynamic drag.
Figure 21 presents the lift coefficient for the upper frame, which decreases with the increasing wind direction angle. This reduction in lift is primarily due to the weakening of the vertical airflow component acting on the upper frame at higher wind angles.
Figure 20.
Curve of variation in upper frame drag coefficient.
Figure 20.
Curve of variation in upper frame drag coefficient.
Figure 21.
Curve of variation in upper frame lift coefficient.
Figure 21.
Curve of variation in upper frame lift coefficient.
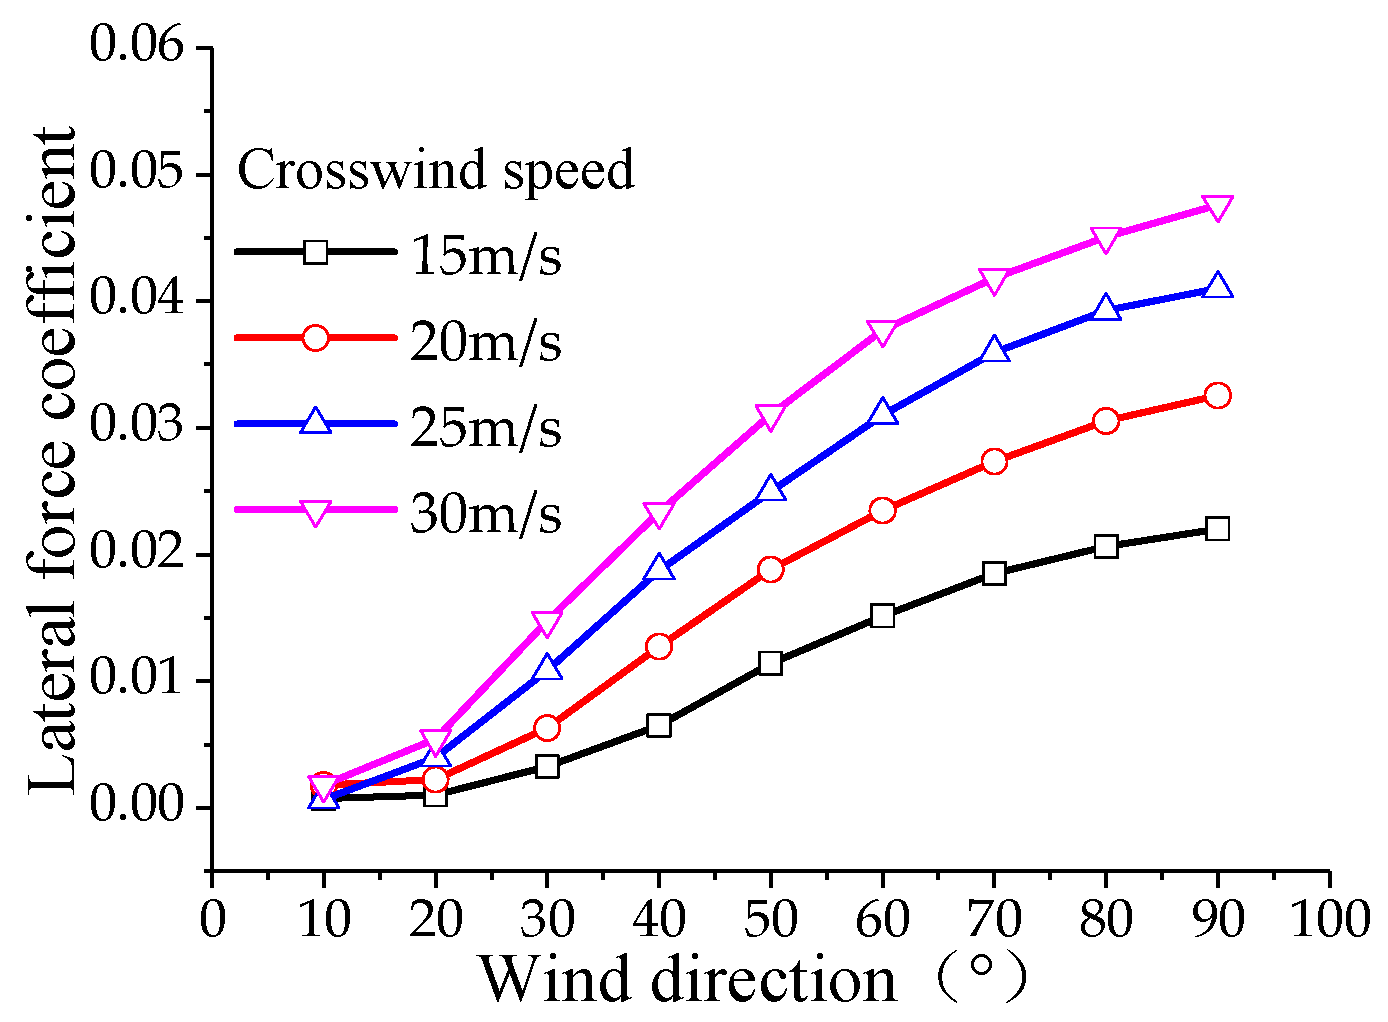
Figure 22.
Curve of variation in upper frame lateral force coefficient.
Figure 22.
Curve of variation in upper frame lateral force coefficient.
Figure 22 highlights the lateral force coefficient’s increase with wind direction angle. Like the bow head, the upper frame also experiences higher lateral forces at greater wind angles due to the shift of wind pressure from vertical to horizontal components. However, the upper frame generates less lateral force than the bow head due to its smaller surface area.
Figure 23.
Curve of variation in lower arm rod drag coefficient.
Figure 23.
Curve of variation in lower arm rod drag coefficient.
Figure 23 shows the drag coefficient for the lower arm rod increasing with wind direction angle, though at a lower rate than the bow head or upper frame. This is because the lower arm rod is smaller and positioned lower, leading to less aerodynamic interaction with the crosswind.
Figure 24.
Curve of variation in lower arm rod Lift coefficient.
Figure 24.
Curve of variation in lower arm rod Lift coefficient.
Figure 24 illustrates the lift coefficient for the lower arm rod, which decreases with wind direction angle. The lower arm rod plays a minimal role in generating lift, as its design is more focused on structural support rather than aerodynamic efficiency.
Figure 25.
Curve of variation in lower arm rod lateral force coefficient.
Figure 25.
Curve of variation in lower arm rod lateral force coefficient.
Figure 25 shows the lateral force coefficient increasing with wind direction angle, but remaining the smallest among all the pantograph components. This is because the lower arm rod, positioned low on the pantograph, encounters less wind exposure, resulting in reduced lateral forces.
Figure 26.
Aerodynamic lift of the bow section.
Figure 26.
Aerodynamic lift of the bow section.
Figure 26 illustrates how the aerodynamic lift of the bow section changes with the crosswind speed and wind direction angle. The lift decreases significantly at wind angles of 60° and above, particularly at higher crosswind speeds (30 m/s), because, at these angles, the airflow’s vertical component diminishes, reducing the bow section’s ability to generate lift. The sharp drop in lift at high angles suggests a critical threshold where the bow section can no longer maintain efficient aerodynamic performance.
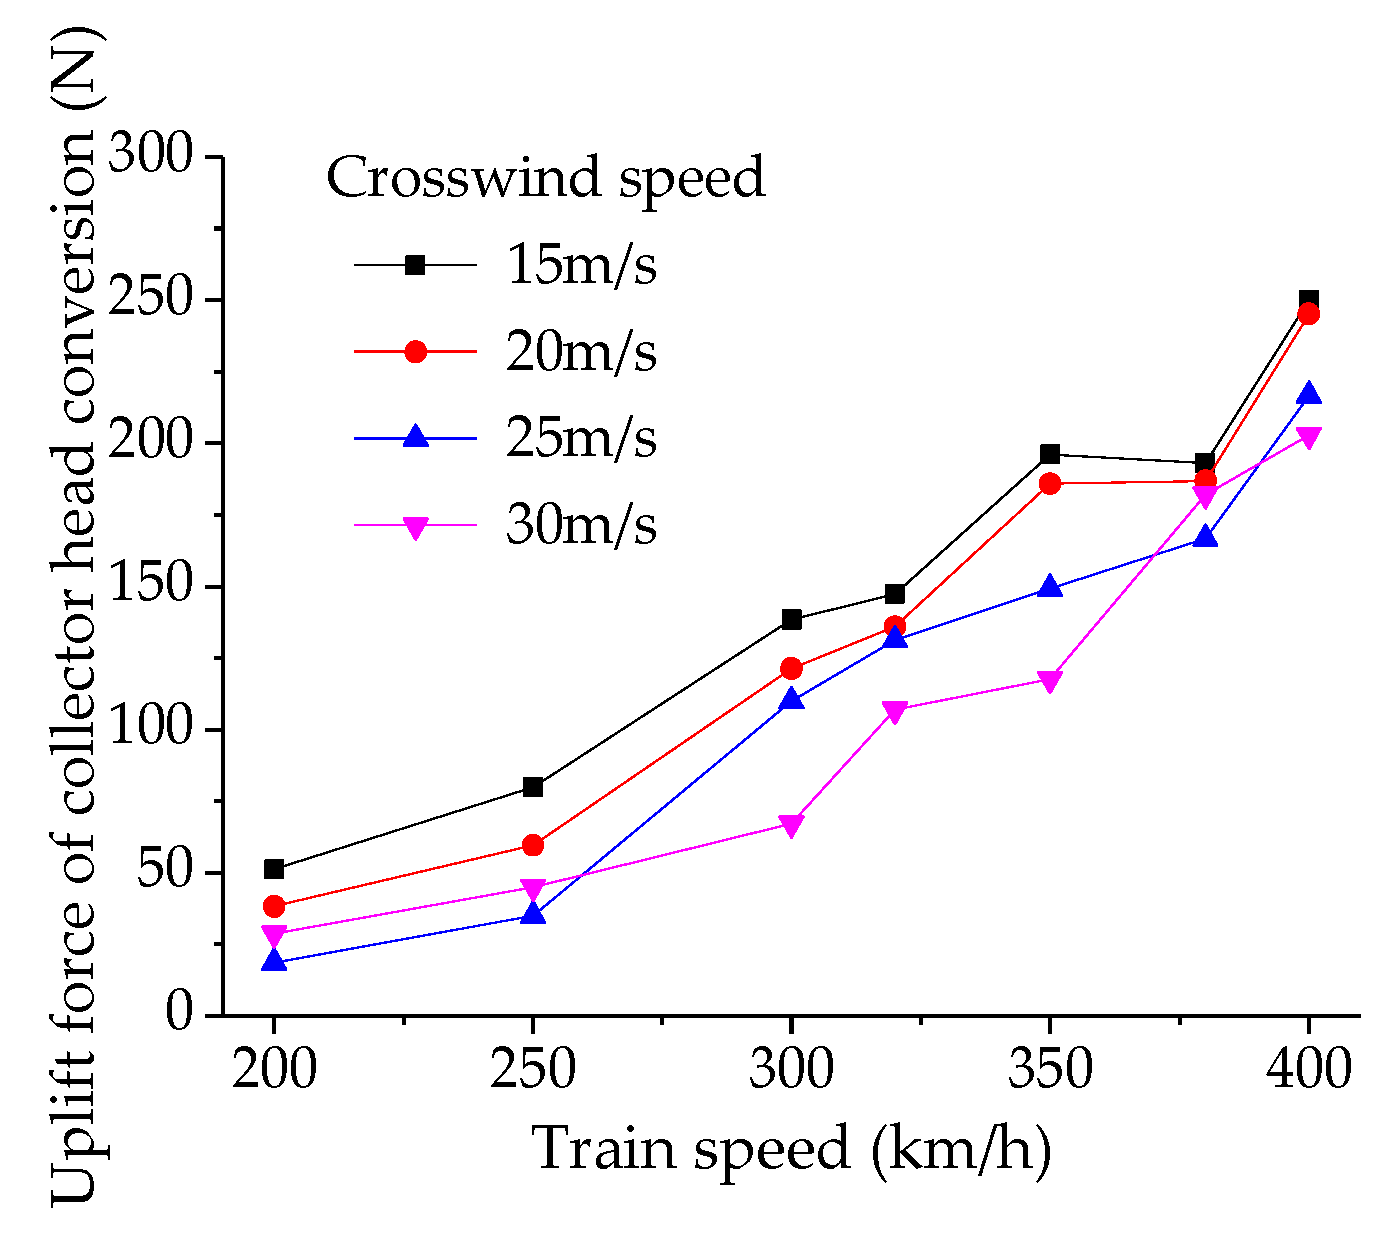
Figure 27,
Figure 28 and
Figure 29 illustrate the variation in the aerodynamic lift of the bow collector, upper frame, and lower arm with the operating speed of the pantograph. The operating speed ranges from 200 km/h to 400 km/h, crosswind speeds range from 15 m/s to 30 m/s, and the wind direction angle is 90°. The aerodynamic lift of the bow collector increases with the operating speed of the pantograph. Under conditions where the wind direction angle is 90°, the aerodynamic lift of the bow collector reaches its maximum value when the pantograph operating speed is 400 km/h at crosswind speeds of 15 m/s and 20 m/s. The aerodynamic lift of the upper frame decreases linearly with an increase in the operating speed of the pantograph, with little influence from the crosswind speed. As the crosswind speed increases, the influence of the operating speed of the pantograph on the aerodynamic lift of the lower arm gradually decreases, highlighting the importance of considering the aerodynamic lift of the bow collector.
Figure 27.
Aerodynamic lift of the upper framework.
Figure 27.
Aerodynamic lift of the upper framework.
Figure 27 shows that the aerodynamic lift of the bow section increases with the pantograph’s operating speed. This is because higher speeds intensify the airflow around the bow section, leading to greater upward aerodynamic forces. At 400 km/h, the lift reaches its maximum, indicating that the bow section is highly sensitive to increases in train speed.
Figure 28.
Aerodynamic lift of the lower arm rod.
Figure 28.
Aerodynamic lift of the lower arm rod.
Figure 28 demonstrates that the aerodynamic lift of the upper frame decreases linearly as operating speed increases. This is due to the negative lift forces acting on the upper frame, which become more pronounced at higher speeds as the airflow around the frame stabilizes.
Figure 29.
Aerodynamic lift of the bowhead.
Figure 29.
Aerodynamic lift of the bowhead.
Figure 29 presents the aerodynamic lift of the lower arm rod, which decreases as the crosswind speed increases. The lower arm rod experiences less aerodynamic lift compared to the bow head and upper frame, and its contribution to the overall lift diminishes further as the crosswind disrupts airflow patterns around the pantograph.
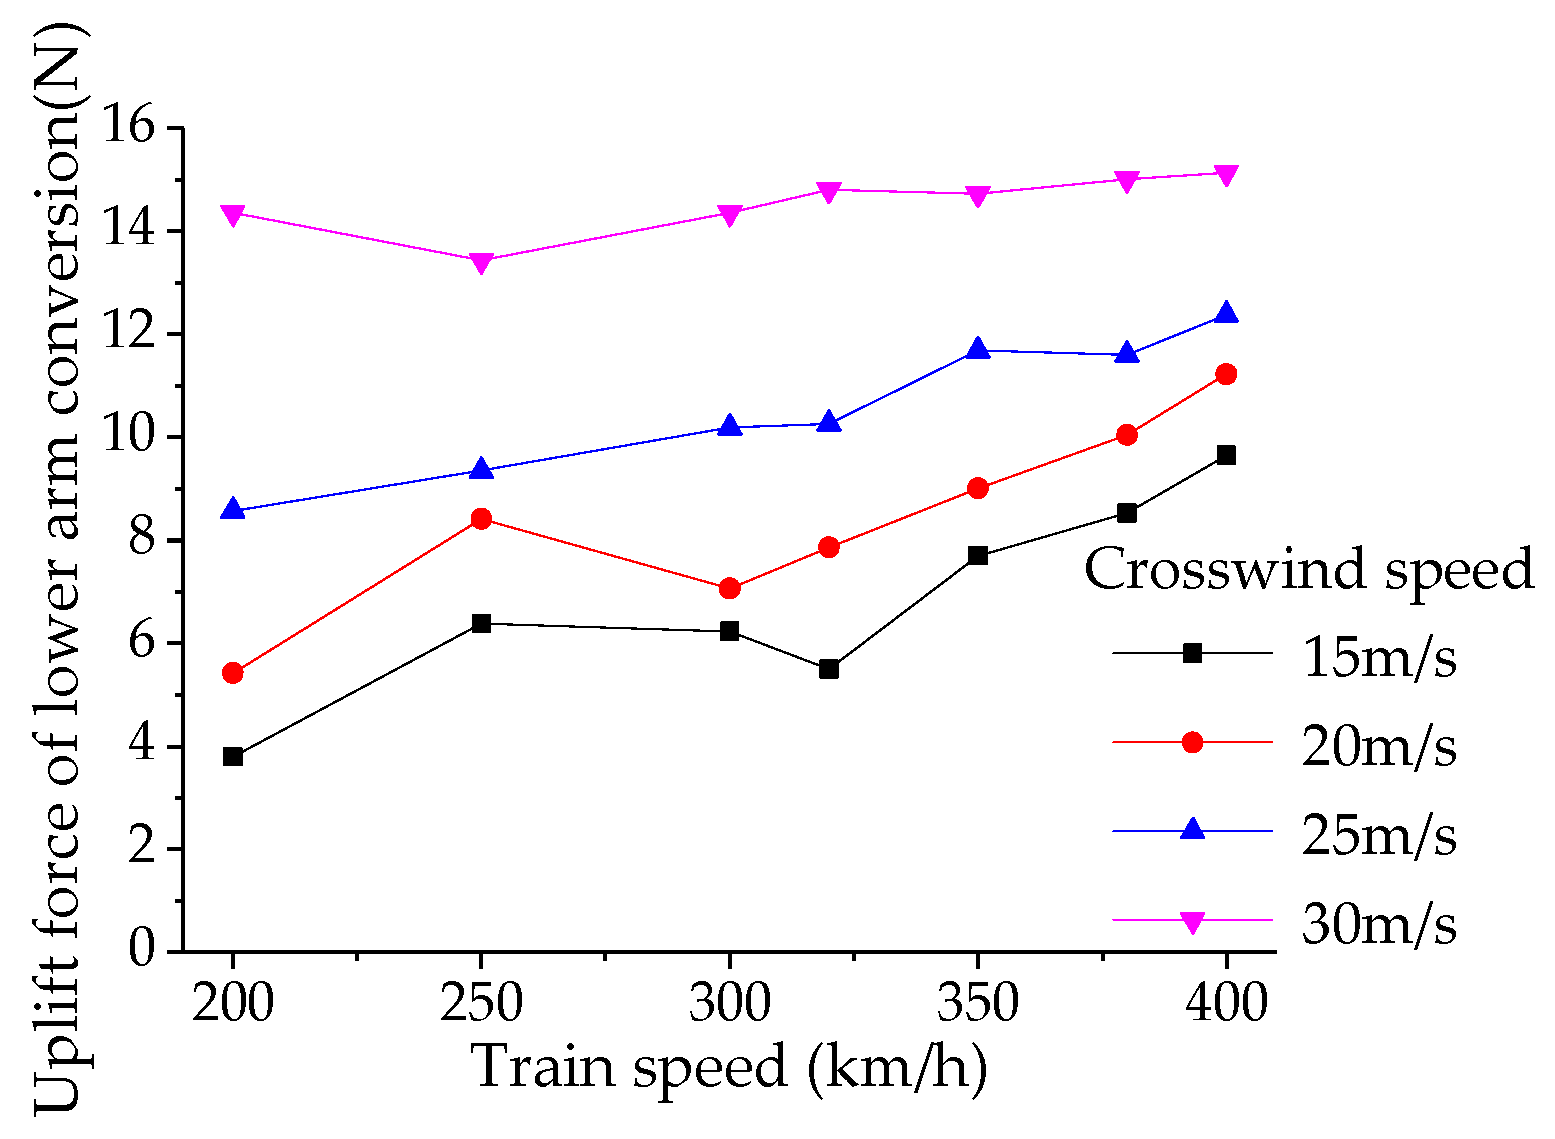
Figure 30,
Figure 31 and
Figure 32 show the variation in the aerodynamic lift of the bow collector, upper frame, and lower arm with the operating speed of the pantograph, where the operating speed ranges from 200 km/h to 400 km/h, the crosswind speed ranges from 15 m/s to 30 m/s, and the wind direction angle is 90°. The aerodynamic lift of the bow collector increases with the operating speed of the pantograph, reaching its maximum value when the pantograph operating speed is 400 km/h at crosswind speeds of 15 m/s and 20 m/s in conditions where the wind direction angle is 90°. The aerodynamic lift of the upper frame decreases linearly with an increase in the operating speed of the pantograph, with little influence from the crosswind speed. As the crosswind speed increases, the influence of the operating speed of the pantograph on the aerodynamic lift of the lower arm gradually decreases, highlighting the importance of considering the aerodynamic lift of the bow collector.
Figure 30 shows that the aerodynamic lift of the upper frame decreases as the pantograph speed increases. This is because higher train speeds stabilize the airflow around the upper frame, reducing any upward lift forces.
Figure 31.
Lift of the lower arm rod.
Figure 31.
Lift of the lower arm rod.
Figure 31 demonstrates that the aerodynamic lift of the lower arm decreases with increasing crosswind speed, as higher crosswinds reduce the vertical aerodynamic forces acting on the lower arm.
Figure 32.
Lift force of the bowhead.
Figure 32.
Lift force of the bowhead.
Figure 32 shows that the aerodynamic lift of the bow head increases with pantograph speed. At higher speeds, the bow head generates stronger lift forces due to the intensified airflow, especially at a wind direction angle of 90°, where the effect of speed is most significant.
From the analysis of the aerodynamic lift of the main components of the pantograph, it can be observed that the aerodynamic lift of the bow collector head is the largest, while the absolute value of the aerodynamic lift of the lower arm is the smallest. Additionally, the aerodynamic lift of the upper arm is consistently negative, which conforms to the flow characteristics of the pantograph’s collector head, upper arm, and lower arm in the unsteady external flow field. The running speed of the pantograph significantly affects the collector head and upper frame, while the crosswind speed has a greater impact on the lower arm and minimal effect on the aerodynamic lift of the upper frame. The combined influence of the running speed and crosswind speed, with a certain yaw angle (or crosswind direction angle), acts on the main components of the pantograph, determining the variation in the aerodynamic forces and torques based on the flow characteristics of each component, thereby determining the distribution of aerodynamic lift.
4.3. Analysis of Pantograph Aerodynamic Lift
The pantograph, composed of various components, forms a structurally complex three-dimensional geometry. Under aerodynamic forces, each component of the pantograph generates vertical constraint forces, known as the pantograph aerodynamic lift.
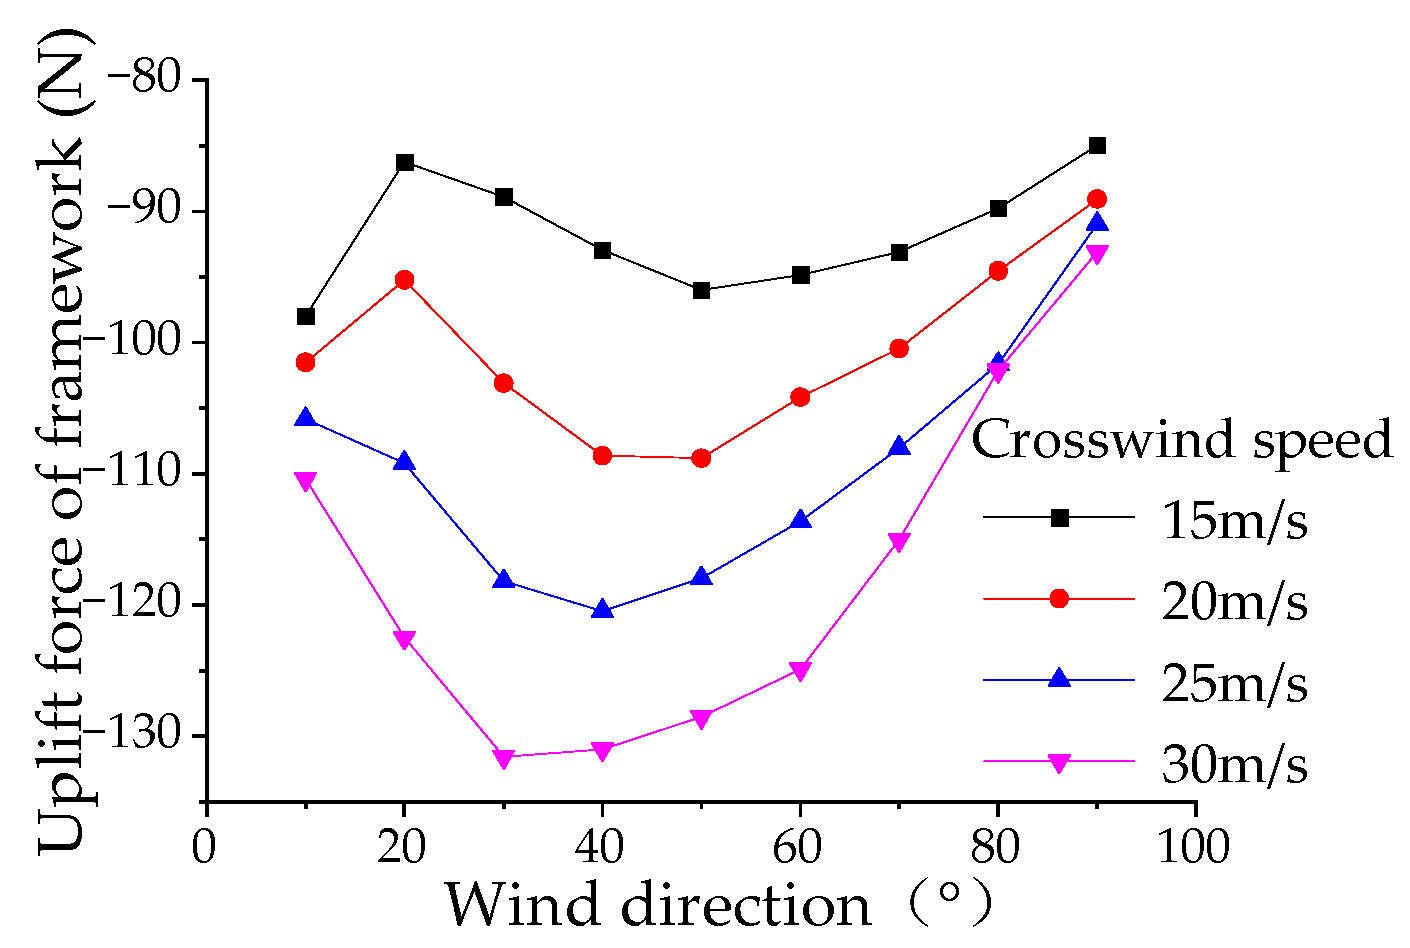
Figure 33,
Figure 34 and
Figure 35 illustrate the variation in the pantograph aerodynamic lift with wind direction, train operating speed, and crosswind speed, with wind direction ranging from 10° to 90°, train speed (vehicle speed) from 200 km/h to 400 km/h, and crosswind speed from 15 m/s to 30 m/s. When the train speed is 350 km/h, the pantograph aerodynamic lift decreases with the increasing wind direction angle. Within the range of wind direction angles from 10° to 50°, there is a rapid decrease in lift when the wind direction angle reaches 50° under a crosswind speed of 30 m/s. The slopes of the curves increase with increasing crosswind speed, and the variation pattern of pantograph lift changes significantly when the wind direction angle reaches 50°. The minimum aerodynamic lift occurs in the condition with a wind direction angle of 90° and a crosswind speed of 30 m/s. The aerodynamic lift of the pantograph generally increases with the train speed. In conditions with crosswind speeds of 15 m/s, 20 m/s, and 25 m/s, there is a significant inflection point in pantograph aerodynamic lift when the train speed reaches 380 km/h, while this phenomenon is not observed in conditions with a crosswind speed of 30 m/s.
Figure 33 indicates that the pantograph lift force decreases sharply with increasing wind direction angle, especially between 10° and 50°. This occurs because, at higher wind angles, the vertical component of the crosswind reduces the upward aerodynamic forces acting on the pantograph, leading to a drop in lift.
Figure 34.
Lift force of the lower arm rod.
Figure 34.
Lift force of the lower arm rod.
Figure 34 shows that pantograph lift force increases with train speed. As train speed rises, the airflow over the pantograph becomes stronger, generating higher aerodynamic lift forces.
Figure 35.
Pantograph lift force.
Figure 35.
Pantograph lift force.
Figure 35 shows that the pantograph lift force decreases significantly with increasing crosswind speed. At high crosswind speeds (30 m/s), the lift force reaches its minimum, as the crosswind disrupts the pantograph’s ability to generate upward lift, reducing contact stability with the overhead lines.
Figure 36 demonstrates that pantograph lift force peaks at high vehicle speeds, especially around 380 km/h. This is because faster speeds increase the dynamic pressure on the pantograph, resulting in greater lift forces.
Figure 37 shows that the pantograph lift force decreases as crosswind speed increases. High crosswinds reduce the vertical lift forces acting on the pantograph, potentially causing performance issues such as insufficient contact with the overhead lines.
Figure 36.
Pantograph lift force (vehicle speed).
Figure 36.
Pantograph lift force (vehicle speed).
Figure 37.
Pantograph lift force (crosswind).
Figure 37.
Pantograph lift force (crosswind).
The aerodynamic uplift force of the pantograph gradually decreases with the increase in crosswind speed. In operating conditions where the pantograph speeds are 200, 250, 300, 320, 350, 380, and 400 km/h, the aerodynamic uplift force of the pantograph decreases by 96.7%, 93.9%, 81.4%, 41.1%, 31.5%, 24.0%, and 35.9%, respectively, with the increase in crosswind speed. It can be observed that as the pantograph operating speed increases, the influence of crosswind speed gradually decreases.

