Featured Application
The research on the protective properties of oleaster oil against oxidative stress and cytotoxicity induced by silica nanoparticles (SiNPs) in albino Wistar rats has substantial practical implications in the fields of toxicology and therapeutic interventions. This work has a specific application in the development of natural antioxidant therapies to mitigate the adverse effects of nanoparticle exposure in humans and animals. The potential for inadvertent or chronic exposure is high due to the increasing use of nanoparticles in a variety of industries. This research indicates that oleaster oil, which is abundant in bioactive compounds with antioxidant properties, has the potential to be used as a therapeutic agent or dietary supplement to protect against oxidative damage and organ toxicity resulting from nanoparticle exposure. In occupational health, where workers are at a higher risk of nanoparticle exposure, or in clinical contexts to treat patients experiencing nanoparticle-induced toxicity, such applications could be particularly valuable.
Abstract
Nanoparticles have found widespread application in a variety of fields, despite growing worry about their possible hazardous effects on both the environment and human health. In recent years, research efforts have focused on plants and vegetable oils, which have been identified as abundant sources of many bioactive compounds. Many of these substances are known to participate in antioxidant processes. As a result, the current study was designed to investigate the antioxidant and protective properties of oleaster oil against cytotoxicity and oxidative stress induced by silica nanoparticles (SiNPs) in albino Wistar rats. Forty male rats were randomly assigned to four equally sized cohorts: a control group, SiNP-treated group (at a dose of 50 mg/kg), SiNP-treated group supplemented with oleaster oil (at a dose of 2 mL/kg), and those receiving only 2 mL/kg of oleaster oil. The findings demonstrated that SiNPs initiated an oxidative stress environment, as evidenced by higher lipid peroxidation levels and changes in antioxidant defense mechanisms. Antioxidant enzymes were significantly reduced, including glutathione levels between the control and SiNP-exposure treatments (36.01%, 36.59%, 60%), glutathione-S-transferase (29.74%, 29.90%, 13.49%), catalase (24.14%, 28.19%, 30.85%), and tissue superoxide dismutase (11.90%, 37.78%, 37.79%) in the liver, kidney, and heart, respectively. Furthermore, histological investigations revealed significant liver, kidney, and heart damage, as indicated by pathological alterations such as vascular dilatation and congestion, inflammatory cellular infiltration, and hepatocellular dysfunction. Encouragingly, the administration of oleaster oil significantly ameliorated a majority of these detrimental effects. These data suggest a potential protective effect of oleaster oil against the adverse histological effects induced by SiNP injection.
1. Introduction
The proliferation of nanotechnology has led to a surge in the production of goods containing nanoscale materials. These nanomaterials, measuring between 1 nm and 100 nm, exhibit unique physical, chemical, and biological properties that distinguish them from their larger counterparts. Their widespread use spans diverse sectors, including textiles, electronics, cosmetics, biomedicine, and pharmaceuticals [1,2,3,4].
One such innovation is the emergence of silica nanoparticles (SiNPs), characterized by their distinctive physicochemical attributes. SiNPs find applications in an array of fields, ranging from construction and microelectronics to cosmetics, consumer products, agriculture, industrial manufacturing, food production, and biomedical and pharmaceutical domains [5,6,7]. However, it is worth noting that studies have pointed to potential hazards associated with the use of SiNPs, with indications of cytotoxicity, hepatotoxicity, genotoxicity, and immunotoxicity [8]. In addition, Human health effects associated with silica exposure, especially crystalline silica (0.5–10 µm), have been widely studied. Occupational exposure to crystalline silica induces silicosis in workers (a fibrotic lung disease) and is also associated with lung cancer, emphysema, and pulmonary tuberculosis [9].
The mechanisms underlying nanoparticle toxicity are multifaceted, with oxidative stress being a prominent contributor. Oxidative stress arises from an imbalance between the production of reactive oxygen species (ROS) and the biological system’s capacity to neutralize these harmful intermediates [10,11,12]. Within this context, SiNPs have been implicated in causing cellular damage through ROS-mediated actions [13]. Existing research predominantly aligns with the idea that oxidative stress and ROS production are recurrently observed in the context of nanoparticle toxicity [14,15], although a comprehensive understanding of nanoparticle interactions with biological systems and their potential toxicity remains incomplete.
Recent scientific investigations have turned their attention to plants and vegetable oils as abundant sources of various substances, many of which operate through antioxidant mechanisms [16]. These substances play crucial roles in quenching ROS, preventing lipid peroxidation, and bolstering cellular antioxidant defenses [17,18]. Vegetable oils and plants are currently the focus of scientific research because they are abundant sources of many different chemicals, many of which function through antioxidant mechanisms. These compounds are essential for quenching ROS, stopping lipid peroxidation, and boosting cellular antioxidant defenses [17,18,19,20].
The Oleaceae family, which is distinguished by its abundance of olein, includes the wild olive tree, also known scientifically as Olea europaea oleaster. Mediterranean flora includes olives produced by olive trees [21]. While information about the oil extracted from wild olive trees remains limited, particularly regarding its composition when compared to oil derived from cultivated olive trees, certain studies have indicated that oleaster oil boasts higher levels of antioxidants and oleic acid, underscoring its substantial phytochemical potential.
Oleaster oil contains higher levels of oleic acid and antioxidants than oil from other olive cultivars according to recent research [22]. The nutritional advantages of olives are derived from their abundance of molecules that possess antioxidant and anti-inflammatory properties, including polyunsaturated fatty acids (PUFAs), monounsaturated fatty acids like oleic acid, and phenolic compounds [23]. Olive oil is distinguished from other oils that are high in monounsaturated fats (MUFAs) by its unique composition, which comprises phenolic compounds, hydrocarbons, chlorophylls, and carotenoids. These components are recognized for their robust antioxidant properties. The phenolic profile of olive oil is of particular significance, as it significantly influences the oil’s quality, affecting both its sensory attributes and nutritional value [24]. The species contains phenolic compounds that have significant physiological functions, primarily through their direct and indirect antioxidant activity [25]. The oil’s ability to neutralize oxidative damage is improved by their presence, which contributes to the overall health benefits.
In light of these factors, the main goal of this study was to determine whether SiNPs may be hazardous to adult male rats and determine whether oleaster oil may have a protective effect against this toxicity. This study aimed to advance our knowledge of the complex interactions between biological systems, nanomaterials, and the function of natural compounds like olive oil in reducing possible risks.
2. Materials and Methods
2.1. Plant Material and Oil Quality Index Determination
Oleaster fruits (Olea europaea L.) were harvested at full maturity in December 2021 in Ain Zitouna, which is located in Houari Boumédiène city (36°24′58″ N, 7°17′10″ E), Guelma, Algeria. The plant samples were taken and deposited at the Laboratory of LBEE, University of 8 May 1945 Guelma. The species was identified by a botanical expert using a local botanical guide (Guide illustré de la flore algérienne). The oil extraction process followed a traditional method involving crushing, malaxation, and the application of pressure to the paste to obtain the oil. Oleaster fruits liberated from leaves were washed, crushed using millstones, and malaxed into a paste containing solid matter (core debris, epidermis, cell walls, etc.).
In order to reproduce the conditions of traditional extraction by pressure, the malaxated paste was pressed with a mechanical press for 30 min with a decrease in pressure 5 min before the end followed by a new application of pressure to extract the maximum liquid containing the oil. This liquid was kept in a separator funnel, allowing sedimentation of solid impurities and water to recover the oil on the surface. The extracted oil was centrifuged at 3000 rpm for 10 to 15 min to purify the product [26].
Following the analytical procedures outlined in the European Union Commission Regulations, several key parameters were calculated, including free acidity (FA), saponification value (SV), peroxide index (PI), iodine index (II), refractive index (RI), and spectrophotometric indices at 232 and 270 nm (K232 and K270).
2.2. Volatile Organic Compound Analysis
The volatile organic compounds (VOCs) in oleaster oil samples were analyzed using solid-phase microextraction and gas chromatography–mass spectrometry (SPME–GC/MS). The extraction, as per Genovese et al. (2019) [27], involved adding three grams of oil sample to a 15 mL dark vial with 10 μL of isobutyl acetate as an internal standard (560 ppm in hexane). The vial was closed with a polytetrafluoroethylene (PTFE) septum. The fiber was exposed in the headspace of the sample for 30 min at 40 °C after 10 min at 40 °C for equilibration. The SPME device (Supelco Co., Bellefonte, PA, USA) was equipped with a 50/30 μm-thick divinylbenzene–carboxen–polydimethylsiloxane (DVB–CAR–PDMS) fiber coated with a 2 cm-length stationary phase.
VOCs were desorbed in the GC injector port at 250 °C in split mode (4:1). The GC system included a Zebron ZB-WAX capillary column (60 m × 0.25 mm i.d. ×0.25 μm film thickness 100% polyethylene glycol; Phenomenex, Torrance, CA, USA), and was set at 40 °C for 4 min, followed by an increase of 3.5 °C min−1 up to 240 °C, then held for 3 min at maximum temperature [28]. Helium was used as a carrier gas (1.4 mL min−1). Mass spectra were recorded at 70 eV, and identification of VOCs was carried out by comparing retention times and mass spectra with standard reference compounds (Sigma-Aldrich, St. Louis, MO, USA) analyzed under the same conditions and by comparing mass spectra with those of the NIST database. Quantitative data were obtained by normalizing peak areas of identified VOCs with respect to the area of the internal standard peak using MSD ChemStation 5975 TAD Data Analysis software v.E.02.00.493 (Agilent Technologies, Palo Alto, CA, USA). Analyses were performed in triplicate. The fiber was conditioned at 270 °C for 1 h before analysis, and a blank test was conducted before each test.
2.3. Estimation of Total Polyphenol Content
The method described by Li et al. (2007) [29]. was used to determine the total polyphenol content in oleaster oil using Folin–Ciocâlteu reagent. In summary, 200 µL of the oil was mixed with 1 mL of Folin–Ciocâlteu reagent. After 4 min, 800 µL of a saturated Na2CO3 solution was added, and the absorbance of the reaction mixture was measured at 765 nm after 2 h. The results are expressed as milligrams of gallic acid equivalent per gram of the extract.
2.4. Estimation of Flavonoid Content
The total flavonoid content in oleaster oil was determined using the method described by Branz (2012) [30]. In brief, 2 mL of oleaster oil was mixed with 1 mL of aluminum trichloride (AlCl3) solution (2% in methanol). The absorbance was measured at 430 nm after a 10 min incubation period. Quercetin was used as the reference compound to create a standard curve. The results are expressed as milligrams of quercetin equivalent (mg QE) per kilogram of dry mass.
2.5. DPPH Radical Scavenging Activity
The DPPH (1,1-diphenyl-2-picrylhydrazyl) radical scavenging activity of oleaster oil was assessed following the method described by Mansouri et al. (2005) [31].
To conduct the assay, appropriate dilution series of the extract ranging from 0 to 2 mg/mL were prepared in methanol. Then, 25 μL of each dilution was combined with 975 μL of a 6 × 10⁻⁵ M methanolic solution of DPPH, followed by thorough vortexing. The resulting mixture was vigorously shaken and allowed to stand in the dark at room temperature for 30 min.
Subsequently, the decrease in absorbance of the solution was measured spectrophotometrically at 517 nm compared to a methanol control. All measurements were performed in triplicate and averaged. The DPPH radical scavenging activity was calculated using the following equation: % Scavenging activity = [(A0 − A1)/A0] × 100
Here, A1 represents the absorbance of the test or standard, and A0 represents the absorbance of the control.
2.6. Silica Nanoparticle Preparation and Characterization
Silica nanoparticles (SiNPs) with an amorphous structure, a size of 150 nm, and a specific surface area of 200 m2/g were procured from Sigma-Aldrich (CAS number: 7631-86-9). Solutions of SiNPs were prepared following the procedure outlined by Canesi et al. (2010) [32]. The SiNPs were dispersed in deionized water, and the solutions were sonicated for 15 min at 100 W using a Sonics Vibra-Cell sonicator (Sonics & Materials, Inc., Newtown, CT, USA) placed in an ice bath before the experiment. This process is commonly used to ensure the uniform dispersion of nanoparticles in a liquid medium, which is essential for various experimental applications.
X-ray diffraction (XRD) was used to determine the chemical composition and crystal structure and estimate the crystallite size of the investigated SiNPs.
2.7. Animals and Experimental Design
Experimental Design
Twenty-eight adult male albino Wistar rats, each aged 12 weeks old and weighing 220–260 g, were obtained from the Pasteur Institute in Algiers. These rats were individually housed in plastic cages with bedding, and they had continuous access to a basal diet and tap water. The animals were kept under fixed housing conditions (12 h light/dark cycles), temperature (20–25 °C), and humidity 40%. After a two-week adaptation period, the rats were divided into four equal groups, each consisting of seven rats.
The first group, serving as the control group (C), received distilled water by gavage. The volume of SiNPs injected intraperitoneally into the rats was dependent on the weight of the rats. Rats in the second group were subjected to an intraperitoneal injection of 50 mg/kg of SiNPs (represents 1/5 of the median lethal dose LD50 = 262.45 mg/kg) [33,34]. The third group received 50 mg/kg of SiNPs [34] intraperitoneally and were simultaneously treated with gavage with 2 mL/kg of oleaster oil (SiNPs + oleaster oil). The last group received 2 mL/kg of oleaster oil [35].
Following five weeks of treatment, under anesthesia, the rats were euthanized and dissected. The liver, kidneys, and heart were removed, cleaned in isotonic saline, and allowed to dry. Fragments of each tissue sample were preserved for the assay of various parameters, including malondialdehyde (MDA), superoxide dismutase (SOD), reduced glutathione (GSH), glutathione S-transferase (GST), and catalase (CAT).
For histological analysis, a second tissue fragment from each of the three organs was fixed in 10% neutral buffered formalin.
2.8. Antioxidant and Lipid Peroxidation Analyses
2.8.1. Tissue Preparation
To homogenize roughly 1 g of liver, kidney, and heart tissues, a cooled phosphate-buffered saline solution (PBS, pH 7.4) was used. The resultant homogenates were used to assess protein content, MDA, GST, SOD, and GSH levels in the generated supernatant after centrifugation at 10,000 rpm for 15 min at 4 °C.
2.8.2. Lipid Peroxidation Estimation
Malondialdehyde, which is a terminal product of lipid peroxidation, was quantified to assess the degree of lipid peroxidation in liver, heart, and kidney homogenates. The method used for this measurement is based on thiobarbituric acid (TBA) reactivity and was originally described by Ohkawa et al. (1979) [36]. In brief, the process involved the following steps. A mixture was prepared by combining 0.5 mL of 20% trichloroacetic acid, 0.5 mL of the tissue homogenate, and 1 mL of a 0.675% TBA solution in tubes. This mixture was heated for 15 min at 100 °C. After the tubes were allowed to cool to room temperature, they were then centrifuged at 3000 rpm for 10 min. Then, 4 mL of n-butanol was added to the resulting supernatant. The optical density of the supernatant was measured at 532 nm. The MDA concentration is expressed as nmol/mg protein.
2.8.3. Estimation of Reduced Glutathione
The glutathione levels were determined using the method developed by Wekbeker and Cory (1988) [37]. This method is based on the measurement of the optical absorbance of 2-nitro-5-mercapturic acid, which is produced when the sulfhydryl (-SH) groups of glutathione reduce 5,5-dithio-bis-2-nitrobenzoic acid (DTNB).
The tissue homogenate (0.8 mL) was combined with 0.2 mL of a 0.25% salicylic acid solution. The mixture was thoroughly mixed and then subjected to centrifugation at 1000× g for 5 min. Then, 0.025 mL of 0.01 M 5,5′-dithio-bis-2-nitrobenzoic acid (DTNB) and 0.025 mL of Tris–EDTA buffer (pH 7.4) were added to 0.5 mL of the resulting supernatant. The absorbance of the solution was measured at 412 nm after 5 min at ambient temperature. The content of glutathione is expressed in terms of nanomoles per milligram of protein.
2.8.4. Estimation of Catalase
The enzymatic activity of catalase was determined using the technique described by Aebi (1983) [38]. This method is based on the principle that hydrogen peroxide (H2O2) is decomposed in the presence of an enzyme source, in this case catalase.
The tissue homogenate (50 μL) was mixed with 2.95 mL of a hydrogen peroxide (H2O2) solution at a concentration of 19 mmol/mL. The H2O2 solution was prepared in a potassium phosphate buffer at pH 7.4 (0.1 M). The change in absorbance was monitored for 1 minute at 15-second intervals, and the measurement was taken at a wavelength of 240 nm. The molar extinction coefficient (ε = 0.043 mM−1cm−1) was used to calculate the enzymatic activity of catalase. The results are expressed as micromoles of H2O2 decomposed per minute per milligram of protein (μmol/min/mg protein).
2.8.5. Assay of Glutathione S-Transferase Activity
Glutathione S-transferase plays a crucial role in catalyzing the conjugation reaction with glutathione during the initial step of mercapturic acid synthesis. The activity of GST was determined following the method established by Habig (1974) [39].
The reaction mixture consisted of the following components: 0.05 mL of 1-chloro-2,4-dinitrobenzene (CDNB) at a concentration of 20 mM, 0.83 mL of phosphate buffer (0.1 M, pH 6.5), 0.02 mL of the tissue homogenate, and 0.1 mL of reduced glutathione at a concentration of 0.3 mg GSH/mL in 0.1 M phosphate buffer at pH 7.4.
The change in color during the reaction was monitored by measuring the absorbance at 340 nm at 30-second intervals for 5 min. The enzyme activity of GST is expressed in micromoles of conjugate formed per minute per milligram of protein (μmol/min/mg protein).
2.8.6. Estimation of Superoxide Dismutase
The estimation of superoxide dismutase enzyme activity was conducted using the method described by Asada et al. (1974) [40]. In this assay, the substrate employed is nitro blue tetrazolium chloride (NBT), which reacts with superoxide anions generated when riboflavin is exposed to light in the presence of methionine as an electron donor. This reaction produces formazan, a blue complex. SOD in the sample acts on the superoxide anions generated by riboflavin, reducing the net superoxide anions in the substrate. Consequently, this leads to a reduction in the production of formazan, resulting in a decreased intensity of the blue color formed. The decrease in formazan formation is directly proportional to the amount of SOD in the sample.
2.8.7. Protein Determination
Using bovine serum albumin as a reference, the Bradford technique was used to calculate the protein concentration in the tissues’ homogenates [41].
2.9. Histological Studies
The tissues retrieved through dissection were rinsed with isotonic saline (NaCl 0.9%). Subsequently, they were treated with a graded ethanol series and promptly fixed in Bowin solution for 24 h. After fixation, the tissues were embedded in paraffin. To prepare the tissue sections for microscopic examination, the paraffin-embedded tissues were sliced into 5-micrometer sections following the method described by Houlot (1984) [42]. Hematoxylin and eosin (H&E) staining was used to provide contrast and reveal tissue structures. The stained sections were observed and imaged using optical microscopy (Leica DM1000 LED, Leica Microsystems, Wetzlar, Germany) at magnifications of 100× and 400×.
2.10. Statistical Analysis
Statistical analyses were carried out with R 4.0.2 (R Core Team, 2021, Vienna, Austria). Data were analyzed by one-way analysis of variance (ANOVA), followed by Tukey pairwise tests. Data are presented as means with the corresponding standard error (SE). The minimum threshold of significance was set at p < 0.05.
3. Results
3.1. Quality Index Determination
The physicochemical properties of vegetable oils serve as key indicators of their purity and can help identify cases of fraud. The results of the parameters of free acidity, saponification value, peroxide index, iodine index, refractive index, and spectrophotometric indices at 232 and 270 nm (K232 and K270) were: free acidity (2.42%), saponification value (141.65 mg KOH/g), peroxide index (4.5 meqO2/kg), iodine index (90.09 g of iodine/100 g of oil), refractive index (1.470), spectrophotometric index at 232 nm (K232) of 0.96, and spectrophotometric index at 270 nm (K270) of 0.118. When comparing these results to established standards and guidelines, the free acidity (2.42%) and peroxide index (4.5 meqO2/kg) are notably higher than the International Olive Council (IOC) standards, which recommend levels below 0.80 for both parameters. These high values may indicate some quality concerns or potential issues with the oil. The iodine index of 90.09 falls within the range recommended for virgin olive oils according to the Food Codex (1989), which suggests a range of 75 to 94 g of iodine/100 g of oil. The refractive index of 1.470 is a significant criterion for assessing oil purity, and it correlates with the iodine index. This value is within an acceptable range. The specific absorbance at 232 nm (K232) is in compliance with the limits established by the IOC (2018) for extra-virgin olive oil (EVOO), where K232 should be less than 2.5. However, the specific extinction coefficient at 270 nm (K270) is lower than the limit set by the COI (2018) for EVOO, which states that K270 should be less than 0.22. The values of 0.96 for K232 and 0.118 for K270 suggest that the oil is not in line with these specific standards, possibly indicating variations in its composition.
3.2. Volatile Organic Compound Analysis
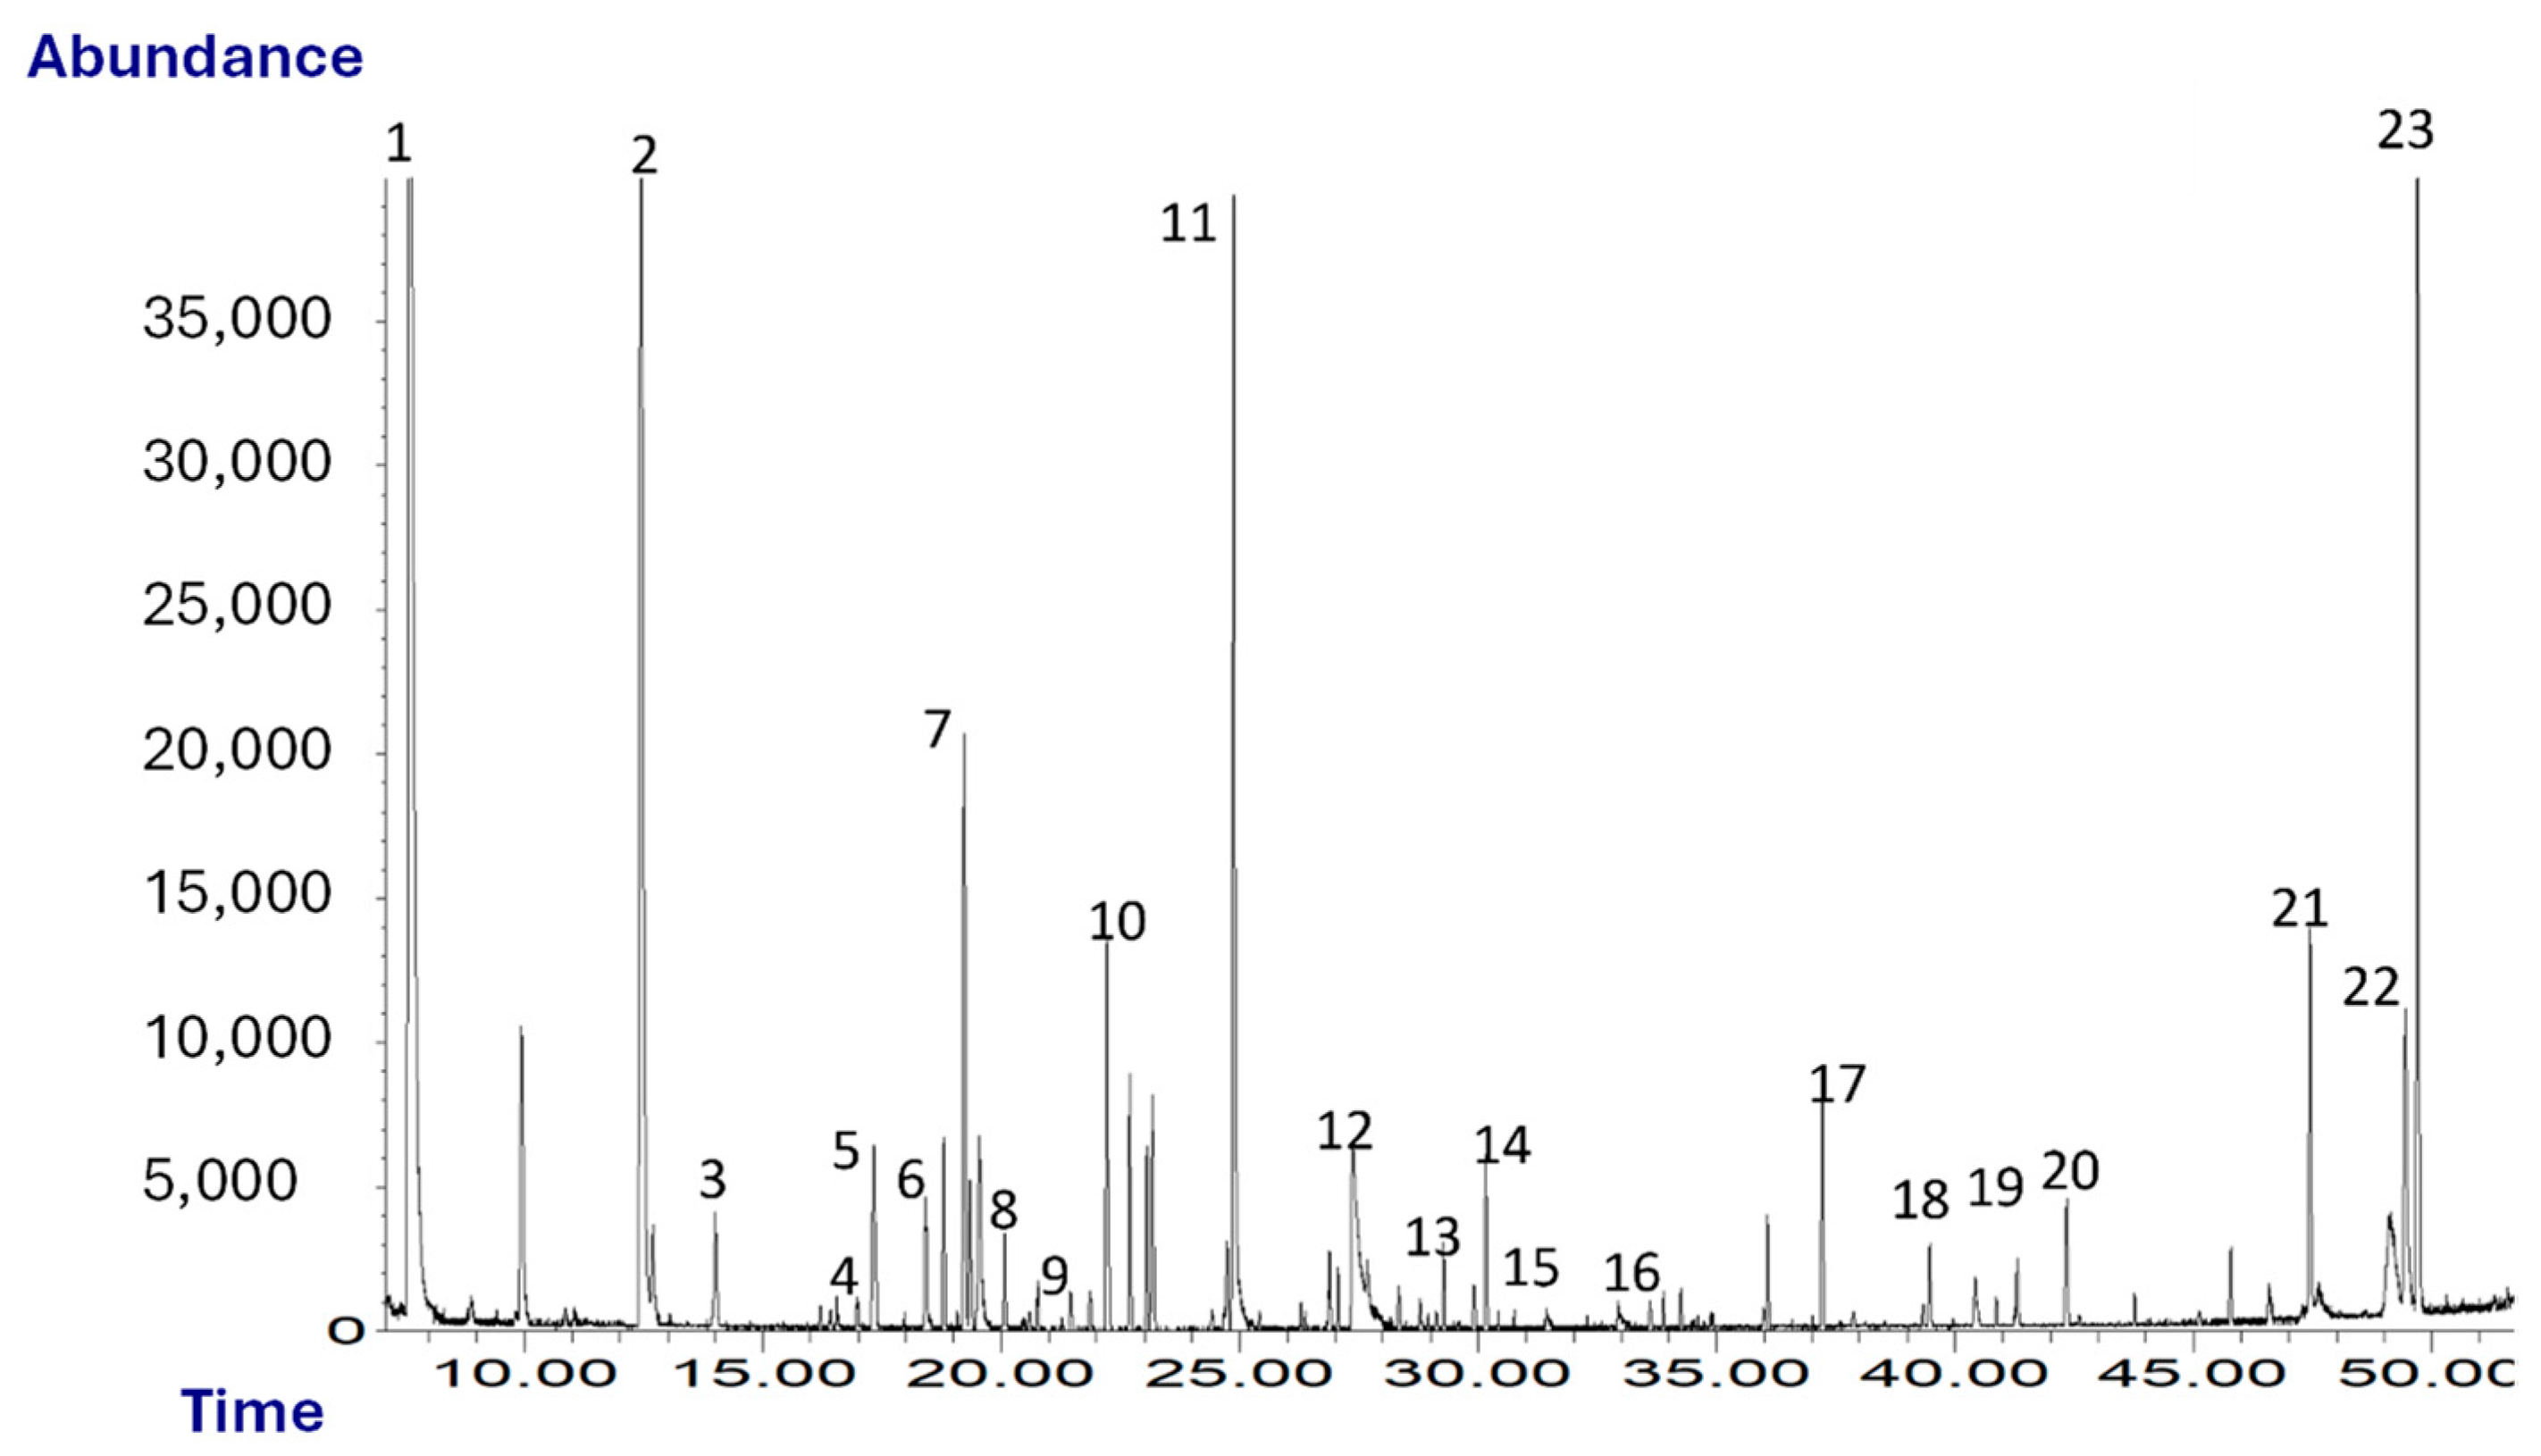
Figure 1 shows a typical chromatogram obtained from the SPME-GC/MS analysis of oleaster oil. A total of 23 volatile compounds were identified and quantified.
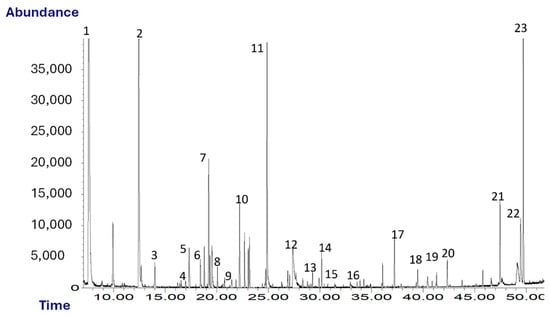
Figure 1.
Chromatogram (TIC) of oleaster oil. Peaks: 1, ethanol; 2, hexanal; 3, isoamylacetate; 4, D-limonene; 5, 1-pentanol; 6, 2-pentylfuran; 7, β-cis-ocimene; 8, hexylacetate; 9, cis-3-hexenylacetate; 10, trans-2-heptenal; 11, nonanal; 12, acetic acid; 13, benzaldehyde; 14, trans-2-nonenal; 15, β-linalool; 16, 2-butyrolactone; 17, α-farnesene; 18, butanoic acid; 19, guaiacol; 20, 2-phenylethanol; 21, m-cresol; 22, nonanoic acid; 23, p-vinylguaiacol.
As shown in Table 1, among the chemical classes identified there are, in decreasing order of abundance, alcohols, aldehydes, aromatic compounds and volatile phenols, terpenes and esters. VOCs such as α-, hexyl acetate, cis-3-hexenyl acetate, β-cis-ocimene, hexanal and trans-2-heptenal, etc., give the oil a herbaceous and fruity odor. Some of them may arise as a consequence of the breakdown of polyunsaturated fatty acids via a sequence of enzymatic reactions known as the lipoxygenase pathway (LOX), which takes place during the extraction of oil. These compounds are also typical of high-quality virgin olive oils [43].

Table 1.
Volatile compounds (μg kg−1) quantified in oleaster oil.
Terpenes are responsible for floral and spicy notes. Monoterpenes and sesquiterpenes, such as β-cis-ocimene, α-farnesene, and limonene, have been identified in virgin olive oils, and there appears to be a correlation between their presence/abundance and the cultivation area of olive groves [44].
3.3. Total Polyphenol and Flavonoid Content
The content of total polyphenols in oleaster oil, as determined by the Folin–Ciocâlteu colorimetric method, was found to be 314 ± 2.56 mg GAE (gallic acid equivalent) per gram of oil. This measurement was derived using the linear regression equation based on gallic acid, and the results are presented as GAE (y = 0.0065x + 0.0205, r2 = 0.998). Furthermore, using the aluminum chloride technique, the flavonoid content in the oil was quantified at 46.95 ± 0.34 mg QE (quercetin equivalent) per kilogram of oil. This determination was made using the linear regression equation associated with quercetin, and the results are expressed as QE (y = 0.0047x + 0.0033, r2 = 0.996).
3.4. DPPH Radical Scavenging Activity
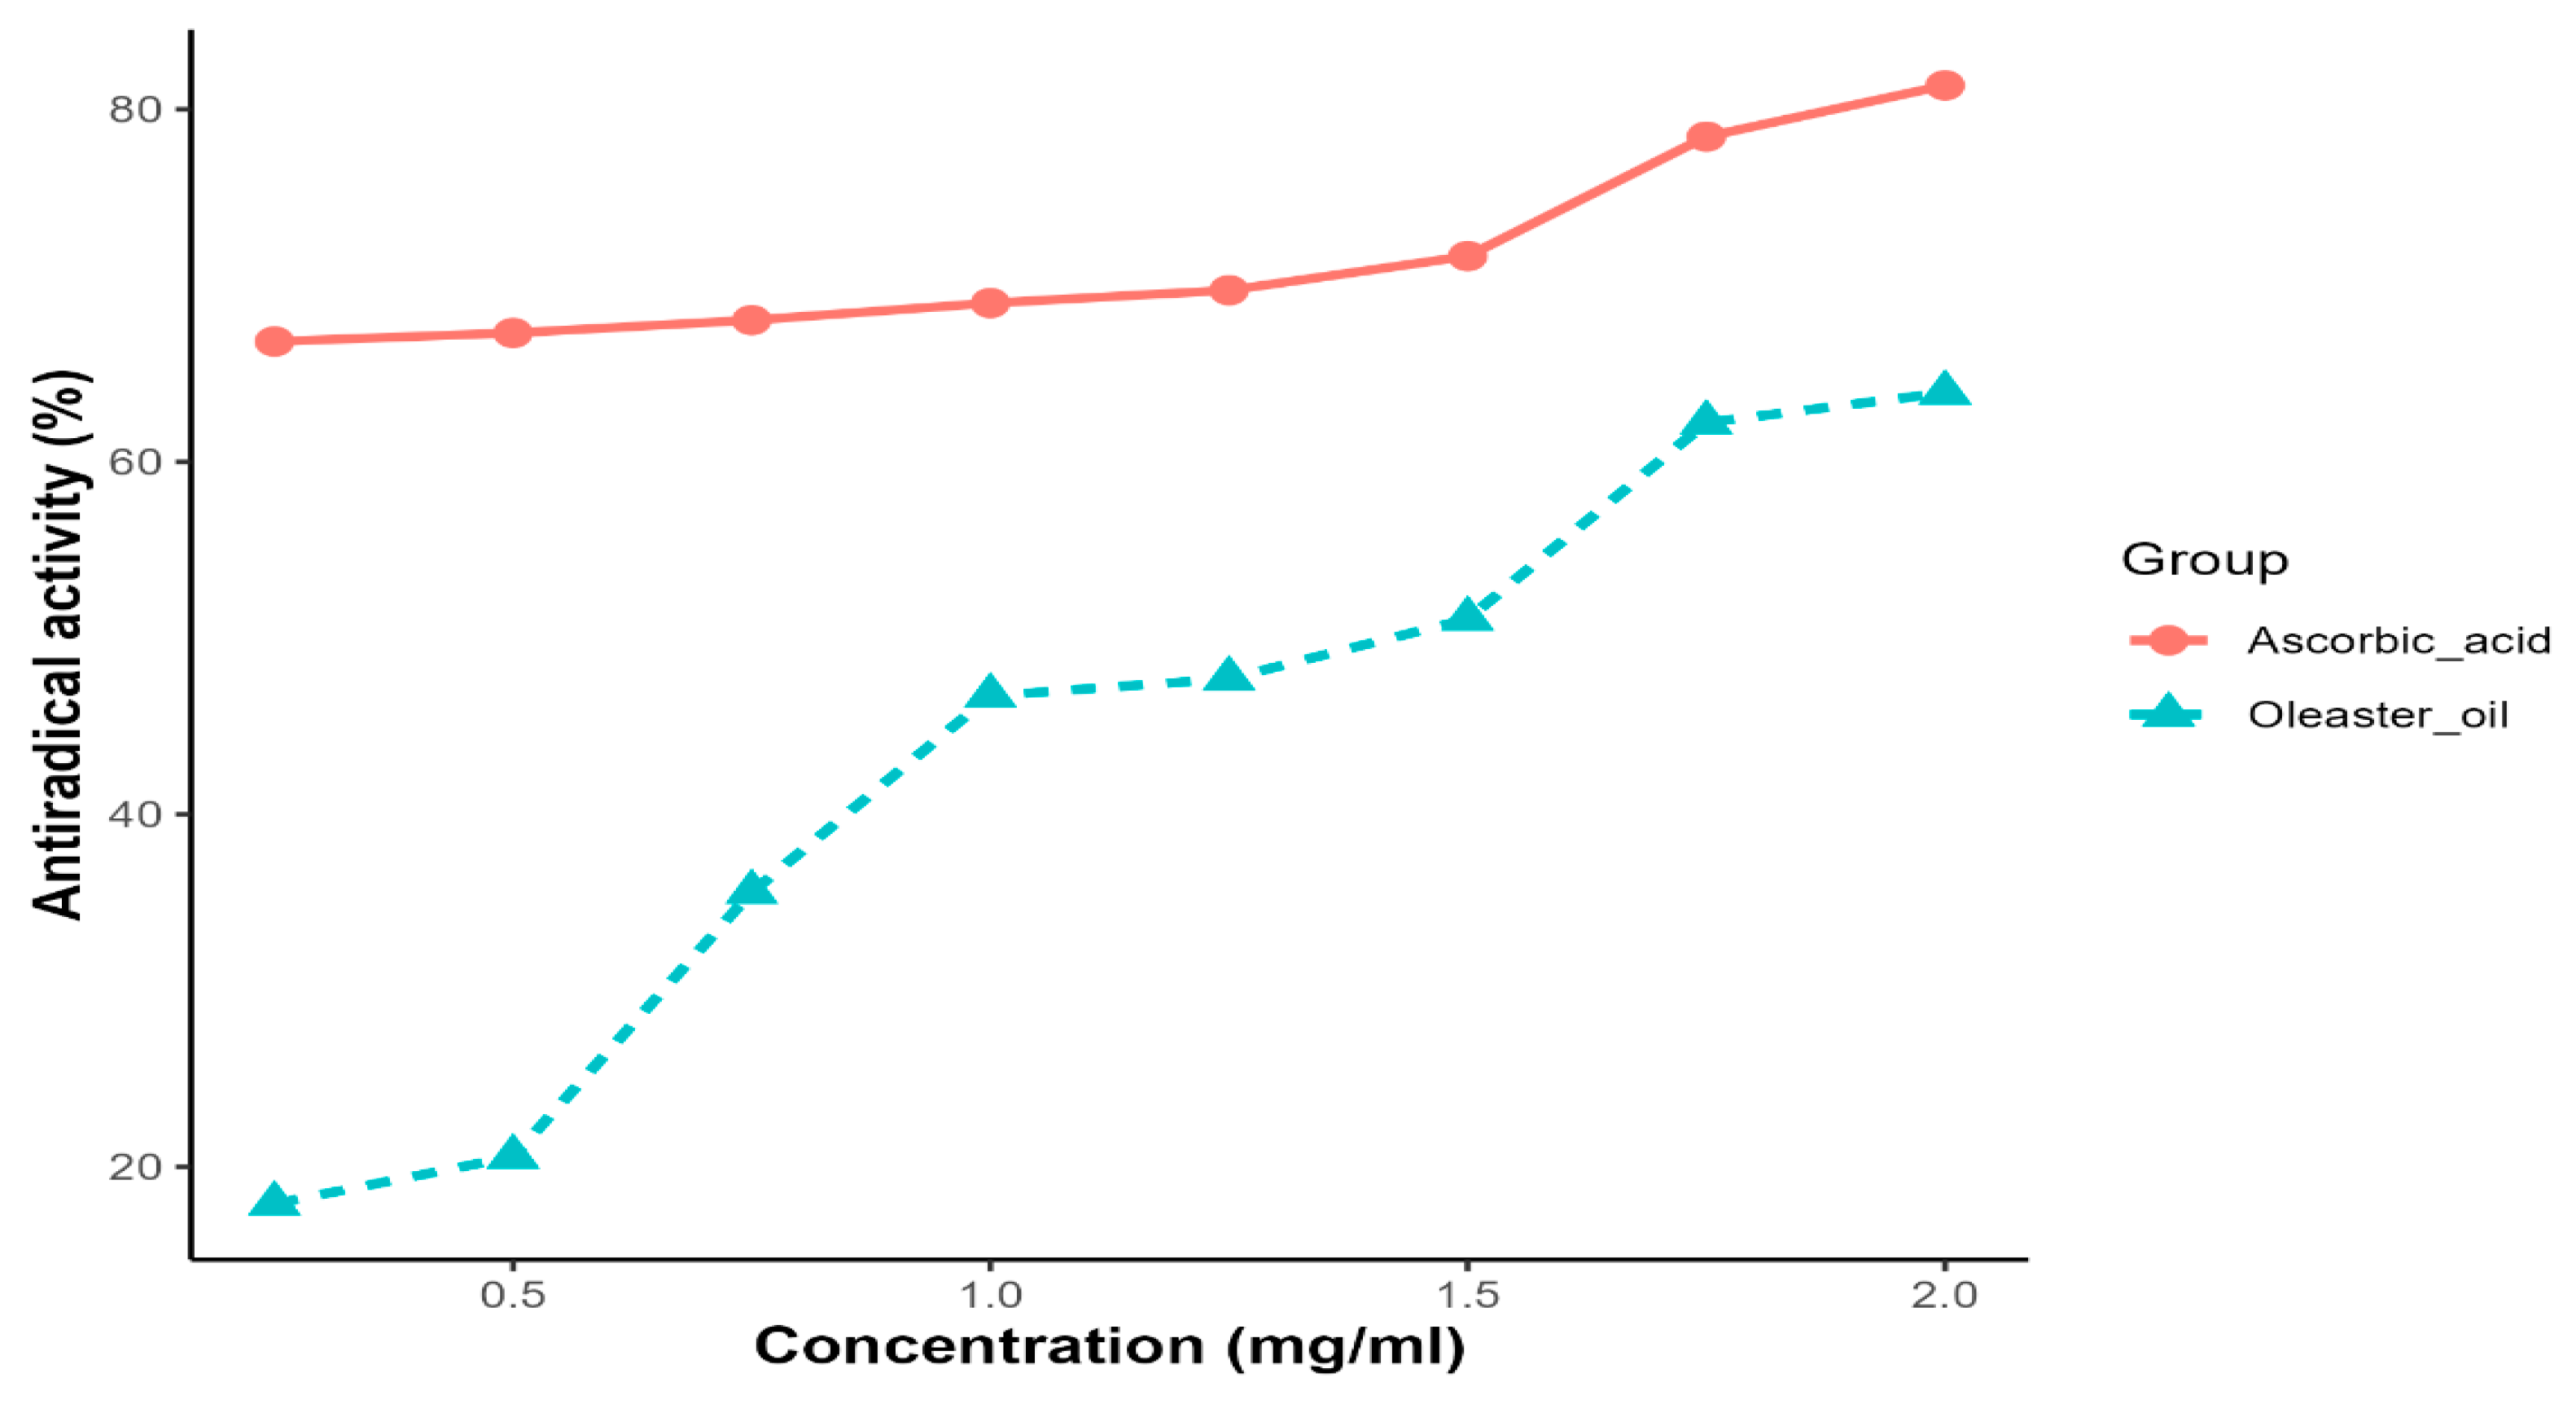
Oleaster oil exhibited a concentration-dependent ability to scavenge DPPH radicals. As a reference for radical scavengers, ascorbic acid was used. At a concentration of 2 mg/mL, the scavenging activity of oleaster oil and ascorbic acid on DPPH radicals was 63.92% and 81.72%, respectively. The IC50 (inhibitory concentration of 50%) value, which represents the amount of the antioxidant required to eliminate 50% of the DPPH radicals in the test solution, is a key indicator of DPPH scavenging activity. A lower EC50 value is associated with stronger DPPH radical scavenging activity. In the case of oleaster oil, the EC50 value for DPPH radical scavenging activity was determined to be 1.37 mg/mL (Figure 2).
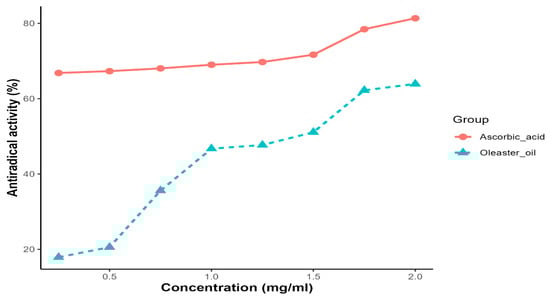
Figure 2.
DPPH radical scavenging activity as a function of the extract of oleaster oil.
3.5. Silica Nanoparticle Characterization
The examined SiNPs’ size, crystalline structure, and chemical makeup were all ascertained using XRD patterns (Figure S1). According to the results, all of the specified peaks were visible without changing from their initial positions, and a notable broad peak with low intensity appeared at 2 thetas of 21° of the SiNP amorphous phase. Furthermore, the XRD patterns showed no diffraction peaks corresponding to the contaminants, indicating high purity of SiNPs.
3.6. Lipid Peroxidation Estimation
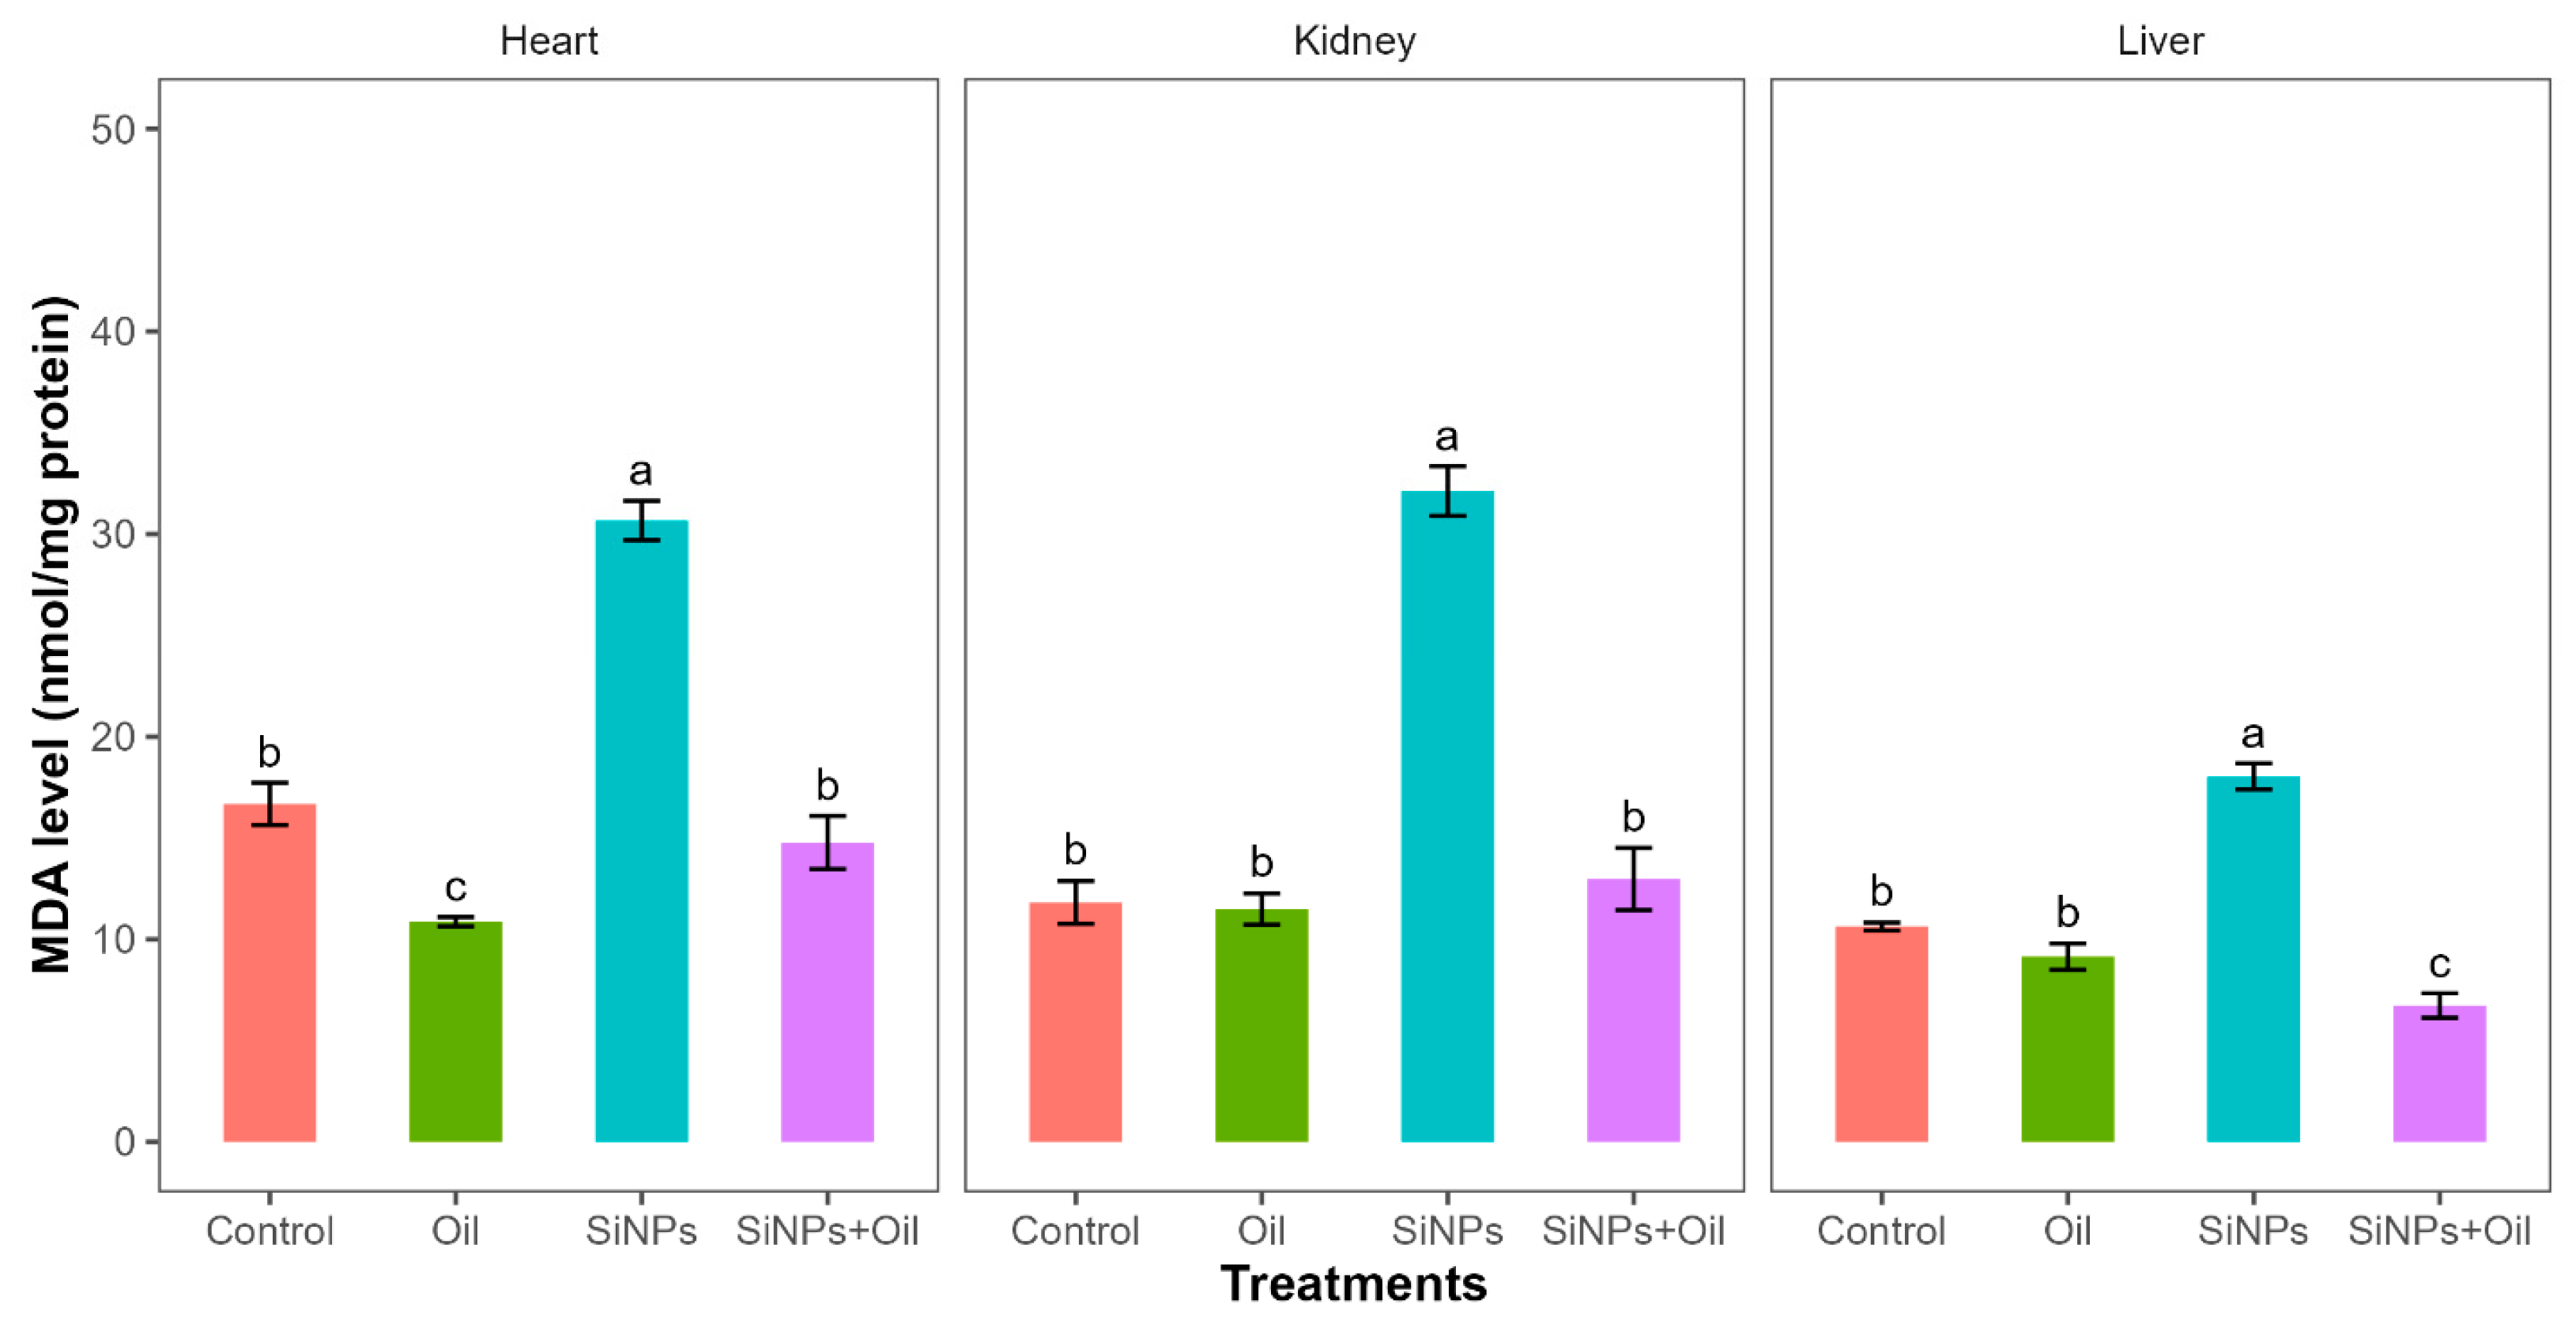
Malondialdehyde assays showed highly significant differences between the control, liver, kidney, and heart (F3, 24 = 77.64, df = 3, p < 0.0001; F3, 24 = 72.09, df = 3, p < 0.0001; F3, 24 = 77.98, df = 3, p < 0.0001, respectively). MDA levels in the control group and the different nanoparticle (SiNP)-exposed groups for liver, kidney, and heart showed statistically significant differences (Table S1, Figure 3). Notably, there was a significant difference between rats injected with SiNPs and treated with oil and rats injected with SiNPs and not treated.

Figure 3.
MDA levels with different treatments in the three organs: liver, kidney, and heart. Error bars represent the standard error. Matching letters above the bars denote no significant difference at p ≤ 0.05 following Tukey’s post hoc test (see Supplementary Material).
The MDA level was lower in the treatment where the rats were injected with nanoparticles and treated with oil in the three organs compared to those injected with SiNPs and not treated. Interestingly, there was no significant difference in MDA level between rats injected with SiNPs and treated with oil and the control group in kidney and heart. There was no significant difference between the control group and the groups treated with oil in the three organs.
3.7. Reduced Glutathione Activity
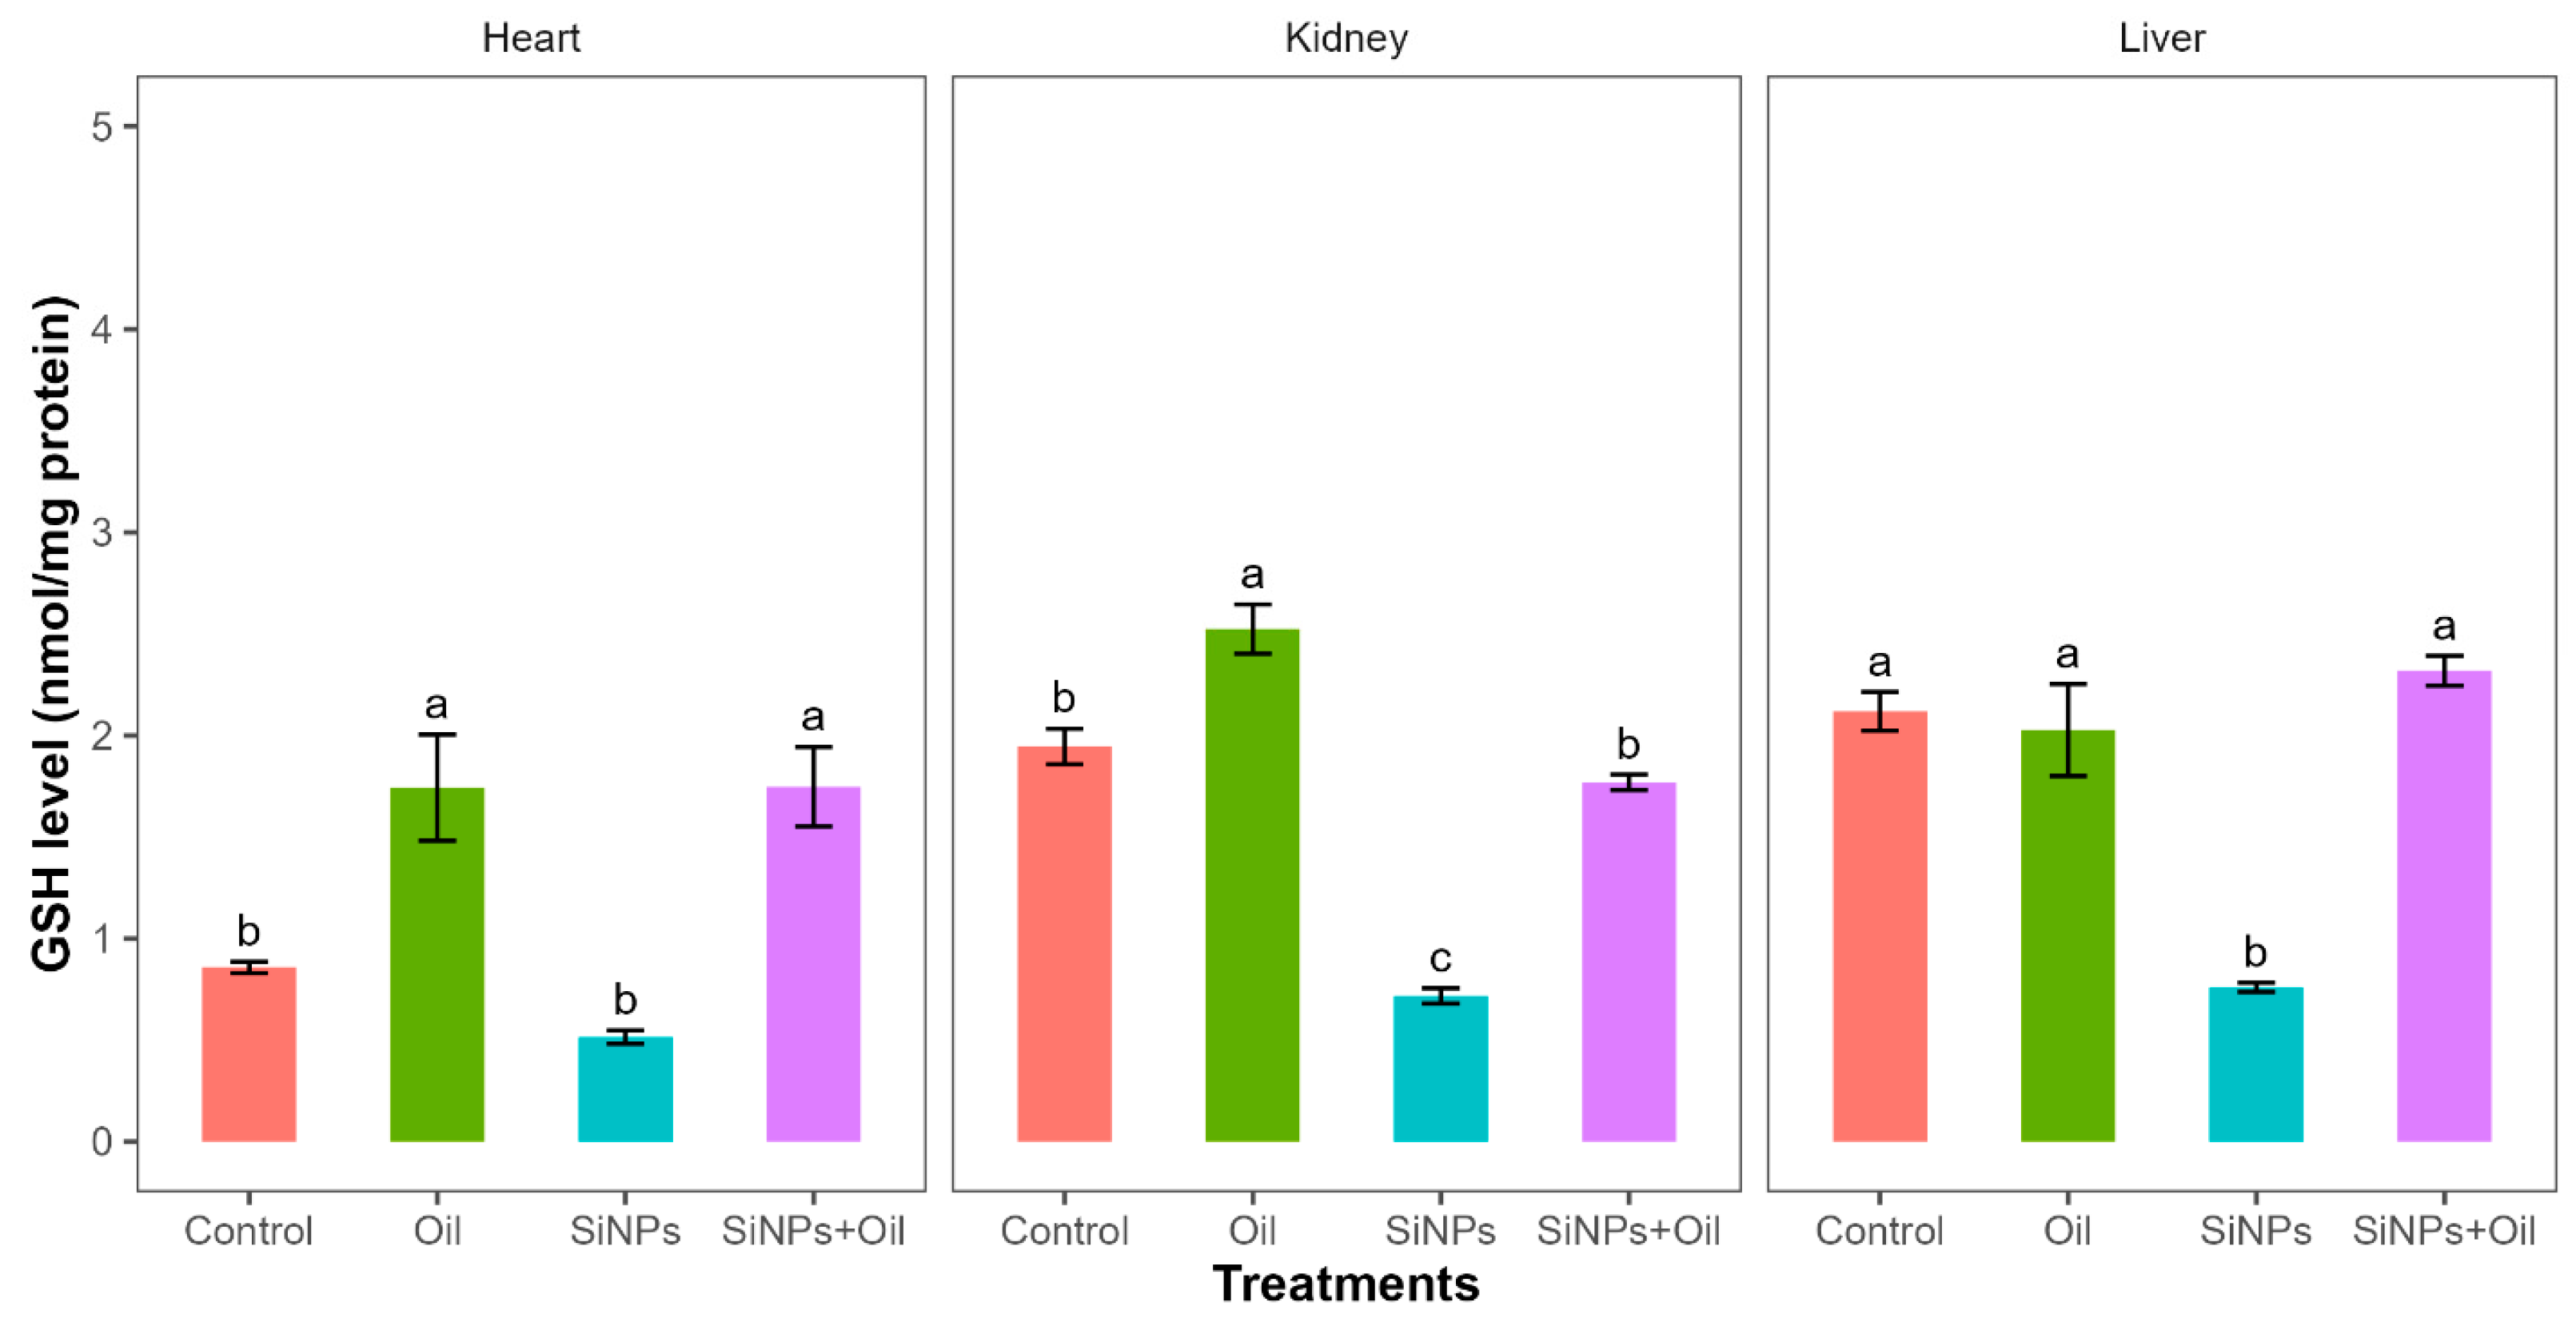
Reductions in glutathione activity showed highly significant differences among the four treatments in liver, kidney, and heart (F3, 24 = 30.14, df = 3, p < 0.0001; F3, 24 = 89.51, df = 3, p < 0.0001; F3, 24 = 14.49, df = 3, p < 0.0001, respectively). GHS levels between the control group and the different SiNP-exposed groups showed statistically significant differences in liver and kidney, but not heart (Table S2, Figure 4). The assessment of all pairwise combinations using the Tukey contrast test (Table S2) revealed that there was a significant difference between rats injected with SiNPs and treated with oil and the rats injected with SiNPs and not treated. The GSH level was higher in the treatment where the rats injected with nanoparticle and treated with oil in the three organs compared to those injected with SiNPs and not treated. In the liver and kidney, there was no significant change in GSH levels between rats injected with SiNPs and treated with oil and the control group. There was no significant difference in GSH between the control group and the groups treated with oil in liver, but there were significant differences in kidney and heart.

Figure 4.
GHS activity with different treatments in the three organs: liver, kidney, and heart. Error bars represent the standard error. Matching letters above the bars denote no significant difference at p ≤ 0.05 following Tukey’s post hoc test (see Supplementary Material).
3.8. Glutathione S-Transferase
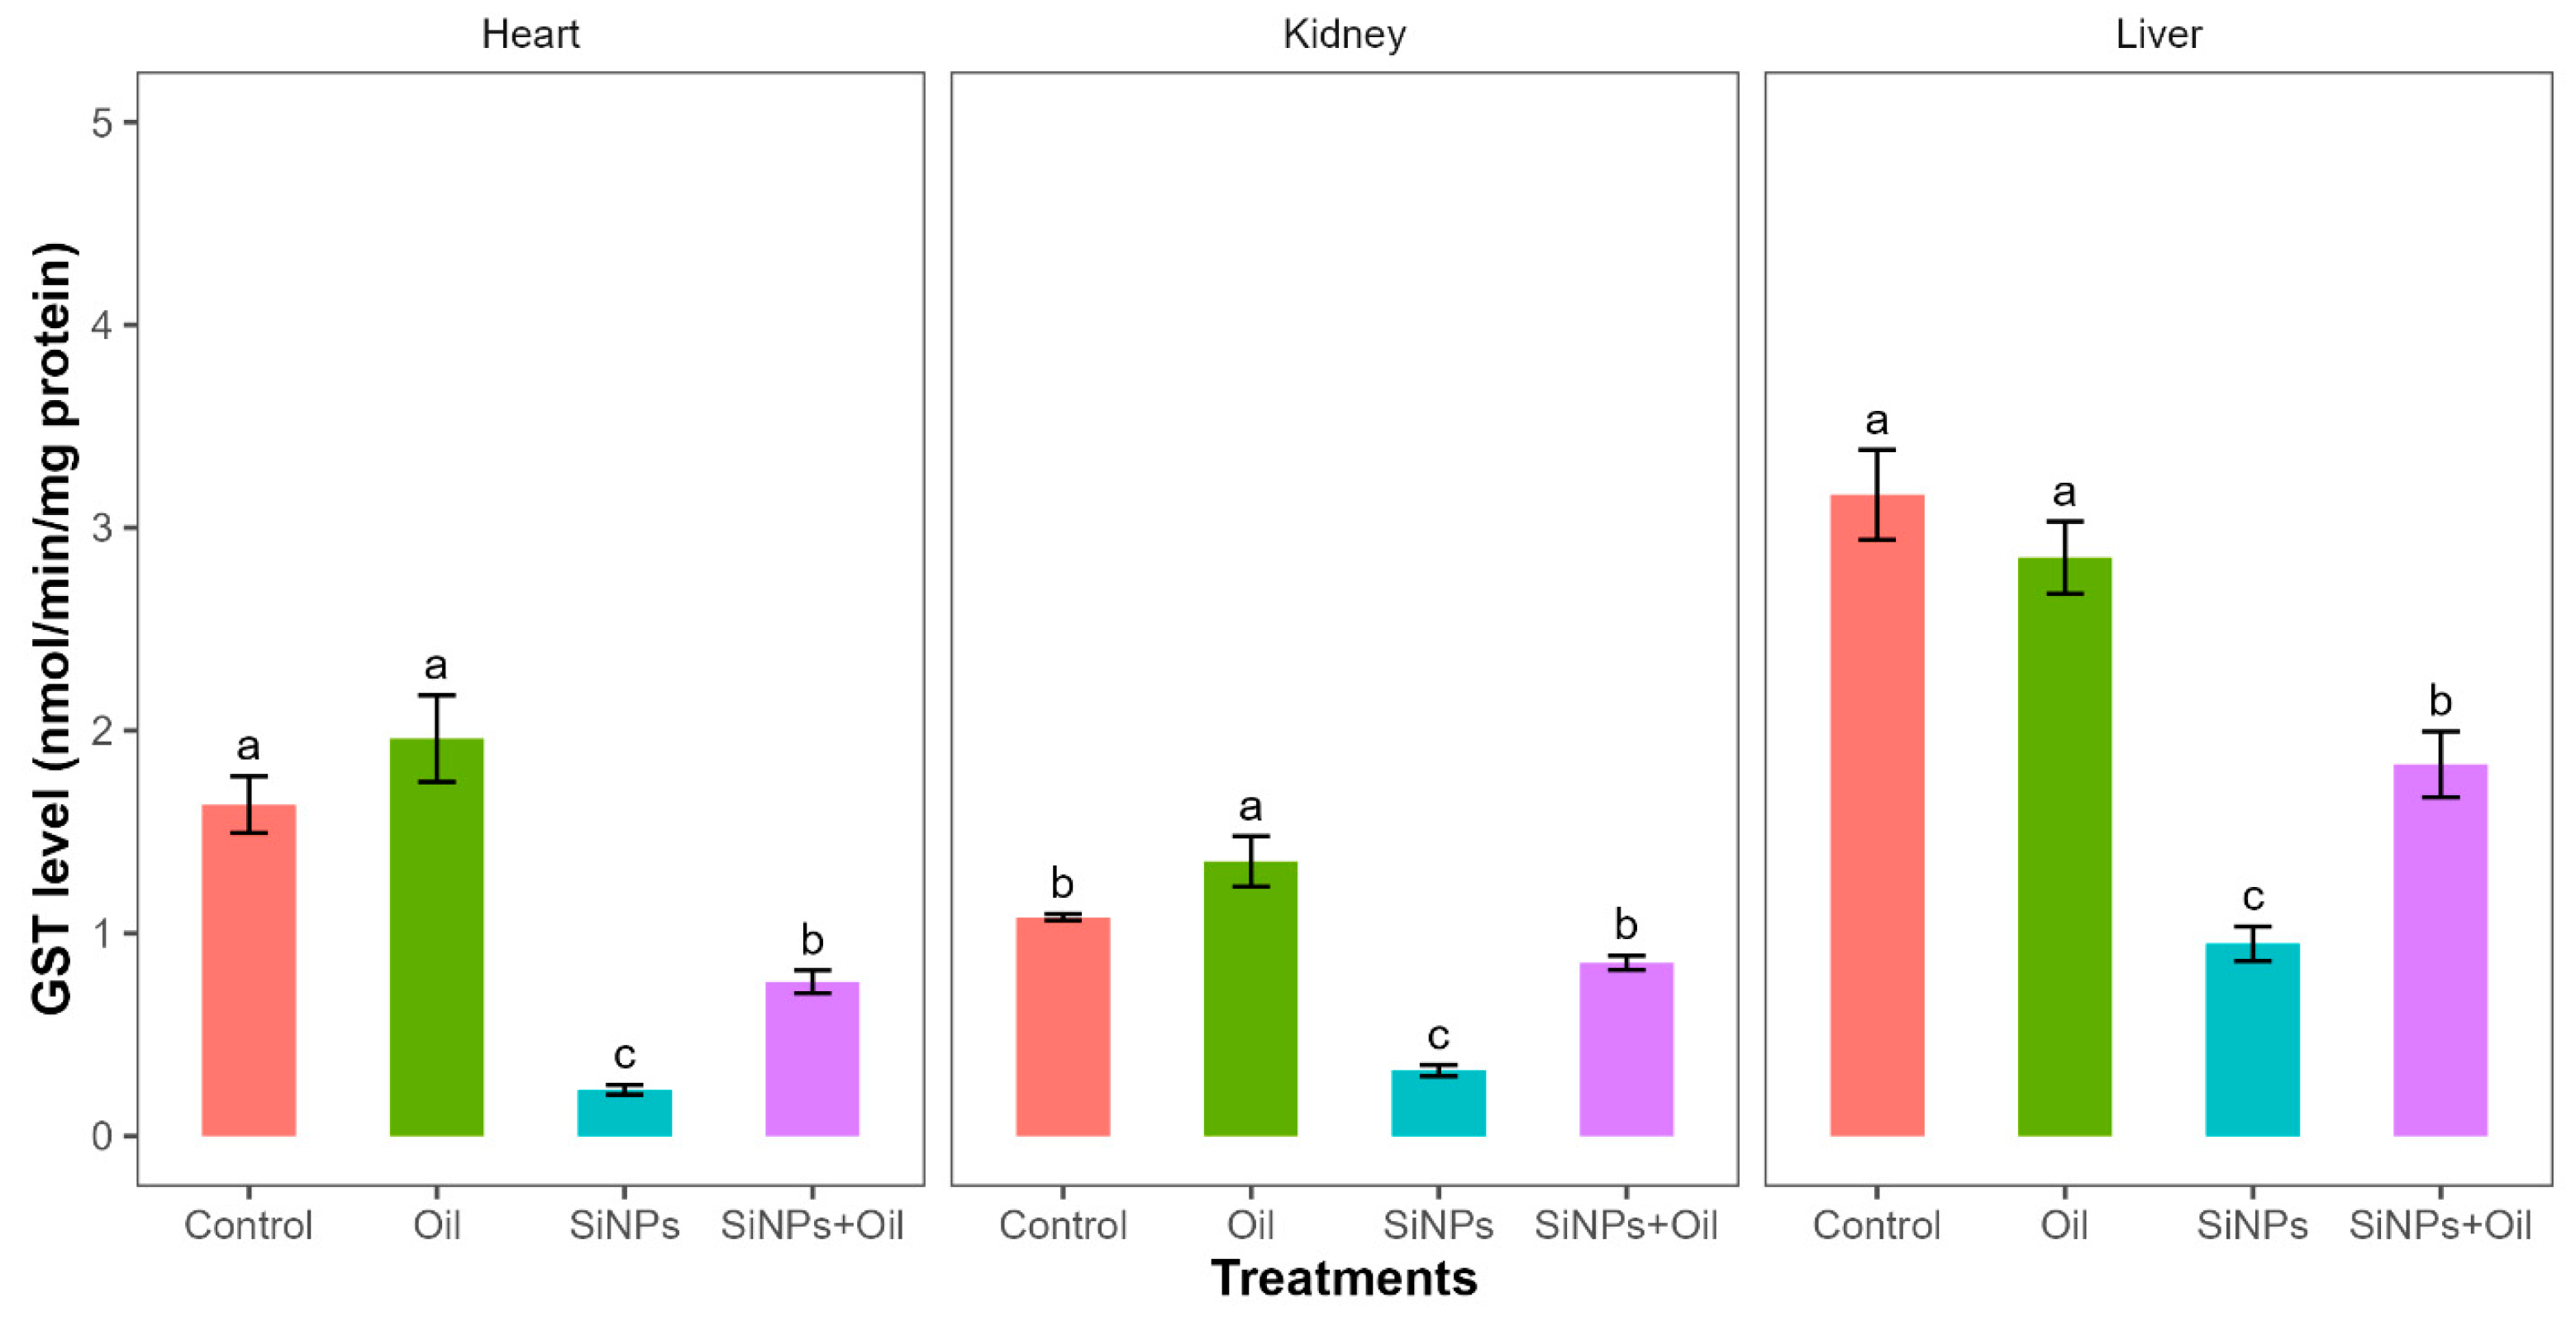
Glutathione S-transferase activity differed significantly between the four treatments in liver, kidney, and heart (F3, 24 = 35.52, df = 3, p < 0.0001; F3, 24 = 43.21, df = 3, p < 0.0001; F3, 24 = 36.69, df = 3, p < 0.0001, respectively). GST levels between the control group and the different SiNP-exposed groups in liver, kidney, and heart showed statistically significant differences (Table S3, Figure 5). Subsequent Tukey tests for pairwise comparisons of GST levels (Table S3) showed that there was a significant difference between rats injected with SiNPs and treated with oil and the rats injected with SiNPs and not treated in the three organs. The GST level was higher in the treatment where the rats injected with nanoparticle and treated with oil in the three organs compared to those injected with SiNPs and not treated. Additionally, in the kidney, there was no significant change in GST levels between rats injected with SiNPs and treated with oil and the control group. There was no significant difference in GST between the control group and the groups treated with oil in liver and heart, but there was a significant difference in kidney.
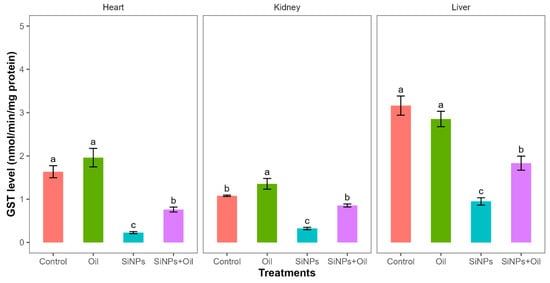
Figure 5.
GST levels with different treatments in the three organs: liver, kidney, and heart. Error bars represent the standard error. Matching letters above the bars denote no significant difference at p ≤ 0.05 following Tukey’s post hoc test (see Supplementary Material).
3.9. Superoxide Dismutase
Superoxide dismutase levels showed highly significant differences among the four treatments in liver, kidney, and heart (F3, 24 = 31.4, df = 3, p < 0.0001; F3, 24 = 17.93, df = 3, p < 0.0001; F3, 24 = 16.97, df = 3, p < 0.0001, respectively). SOD levels in the control group and the different SiNP-exposed groups in liver, kidney, and heart showed statistically significant differences (Table S4, Figure 6). Subsequent Tukey tests for pairwise comparisons of GST levels (Table S4) showed that there was a significant difference between rats injected with SiNPs and treated with oil and the rats injected with SiNPs and not treated in the three organs. SOD levels were higher in rats injected with nanoparticles and treated with oil in the three organs compared to those injected with SiNPs and not treated. There was no significant difference in SOD between the control group and the groups treated with oil in any organ.
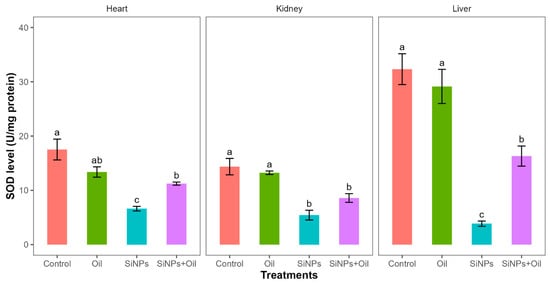
Figure 6.
SOD levels in different treatments in the three organs: liver, kidney, and heart. Error bars represent the standard error. Matching letters above the bars denote no significant difference at p ≤ 0.05 following Tukey’s post hoc test (see Supplementary Material).
3.10. Catalase Enzyme Activity
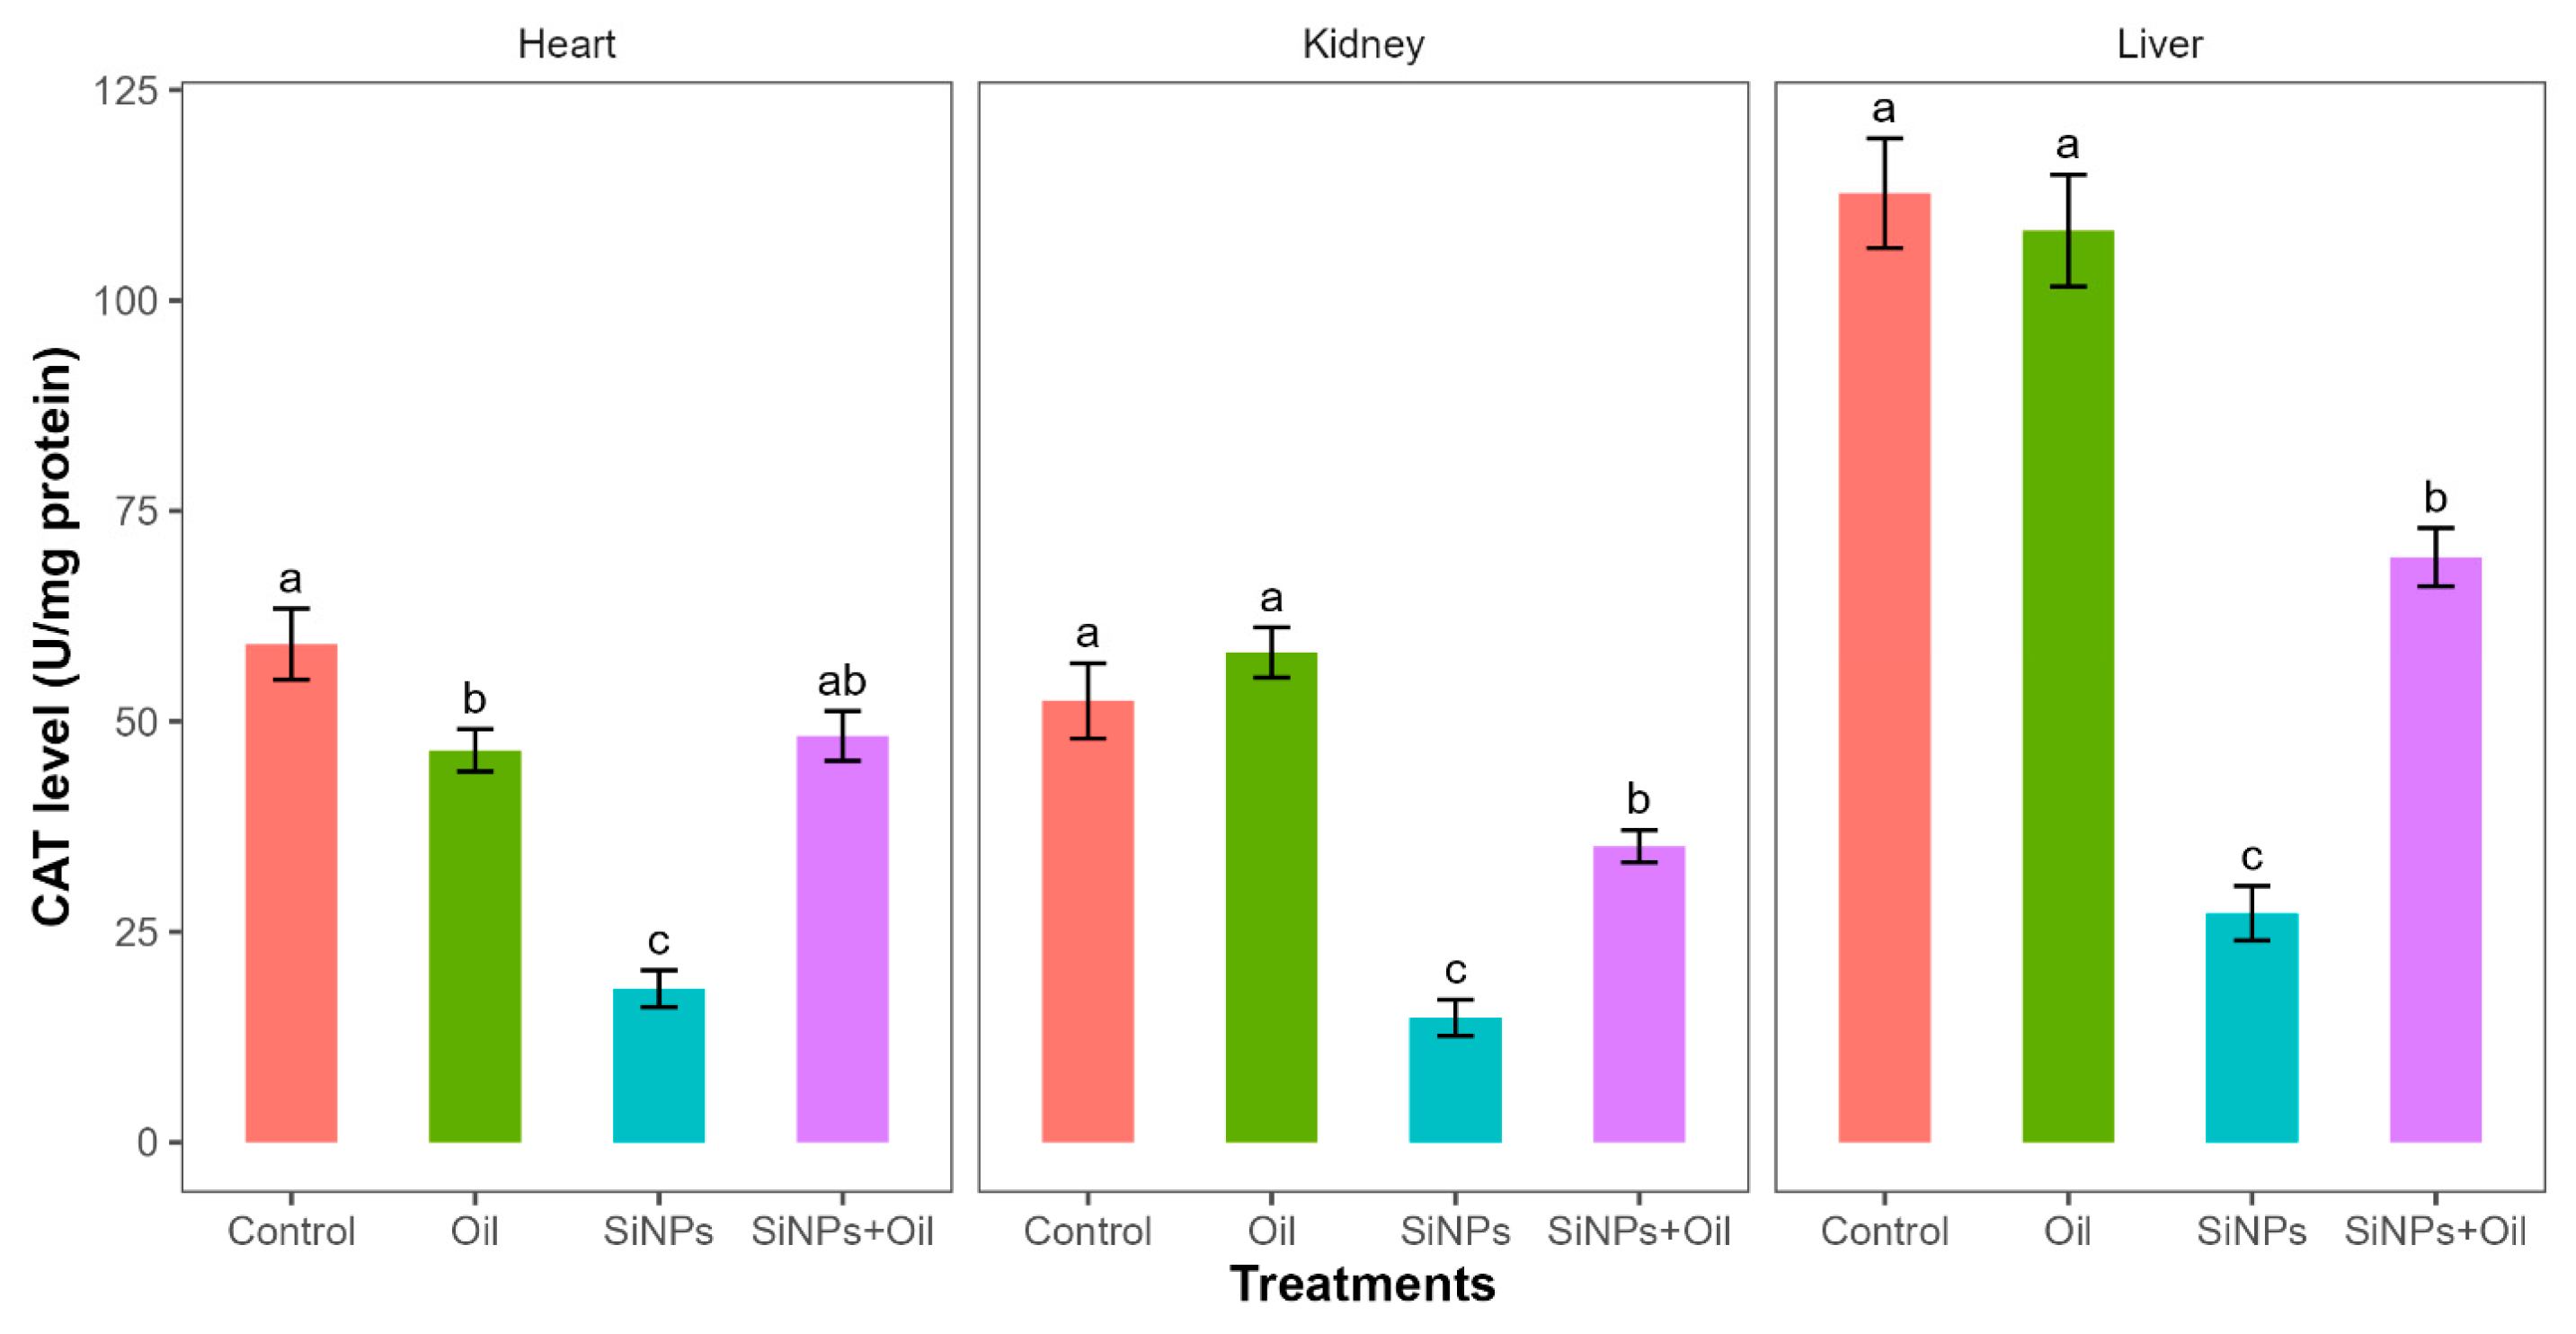
Catalase levels showed highly significant differences among the four treatments in liver, kidney, and heart (F3, 24 = 58.35, df = 3, p < 0.0001; F3, 24 = 41.03, df = 3, p < 0.0001; F3, 24 = 32.23, df = 3, p < 0.0001, respectively). CAT levels differed significantly between the control group and the different SiNP-exposed groups in liver, kidney, and heart (Table S5, Figure 7). Tukey post hoc analysis (Table S5) of CAT levels indicated that there was a significant difference between rats injected with SiNPs and treated with oil and rats injected with SiNPs and not treated in the three organs.
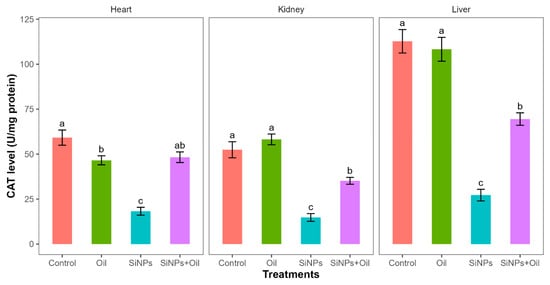
Figure 7.
The CAT level in different treatments in the three organs: liver, kidney, and heart. Error bars represent the standard error. Matching letters above the bars denote no significant difference at p ≤ 0.05 following Tukey’s post hoc tests (see Supplementary Material).
CAT levels were higher in rats injected with nanoparticles and treated with oil in the three organs compared to those injected with SiNPs and not treated.
Furthermore, there was no significant difference in CAT levels between rats injected with SiNPs and treated with oil and the control group in the heart. There was no significant difference in CAT between the control group and the groups treated with oil in liver and kidney, but there was a significant difference in heart.
3.11. Histological Section Examination
3.11.1. Liver
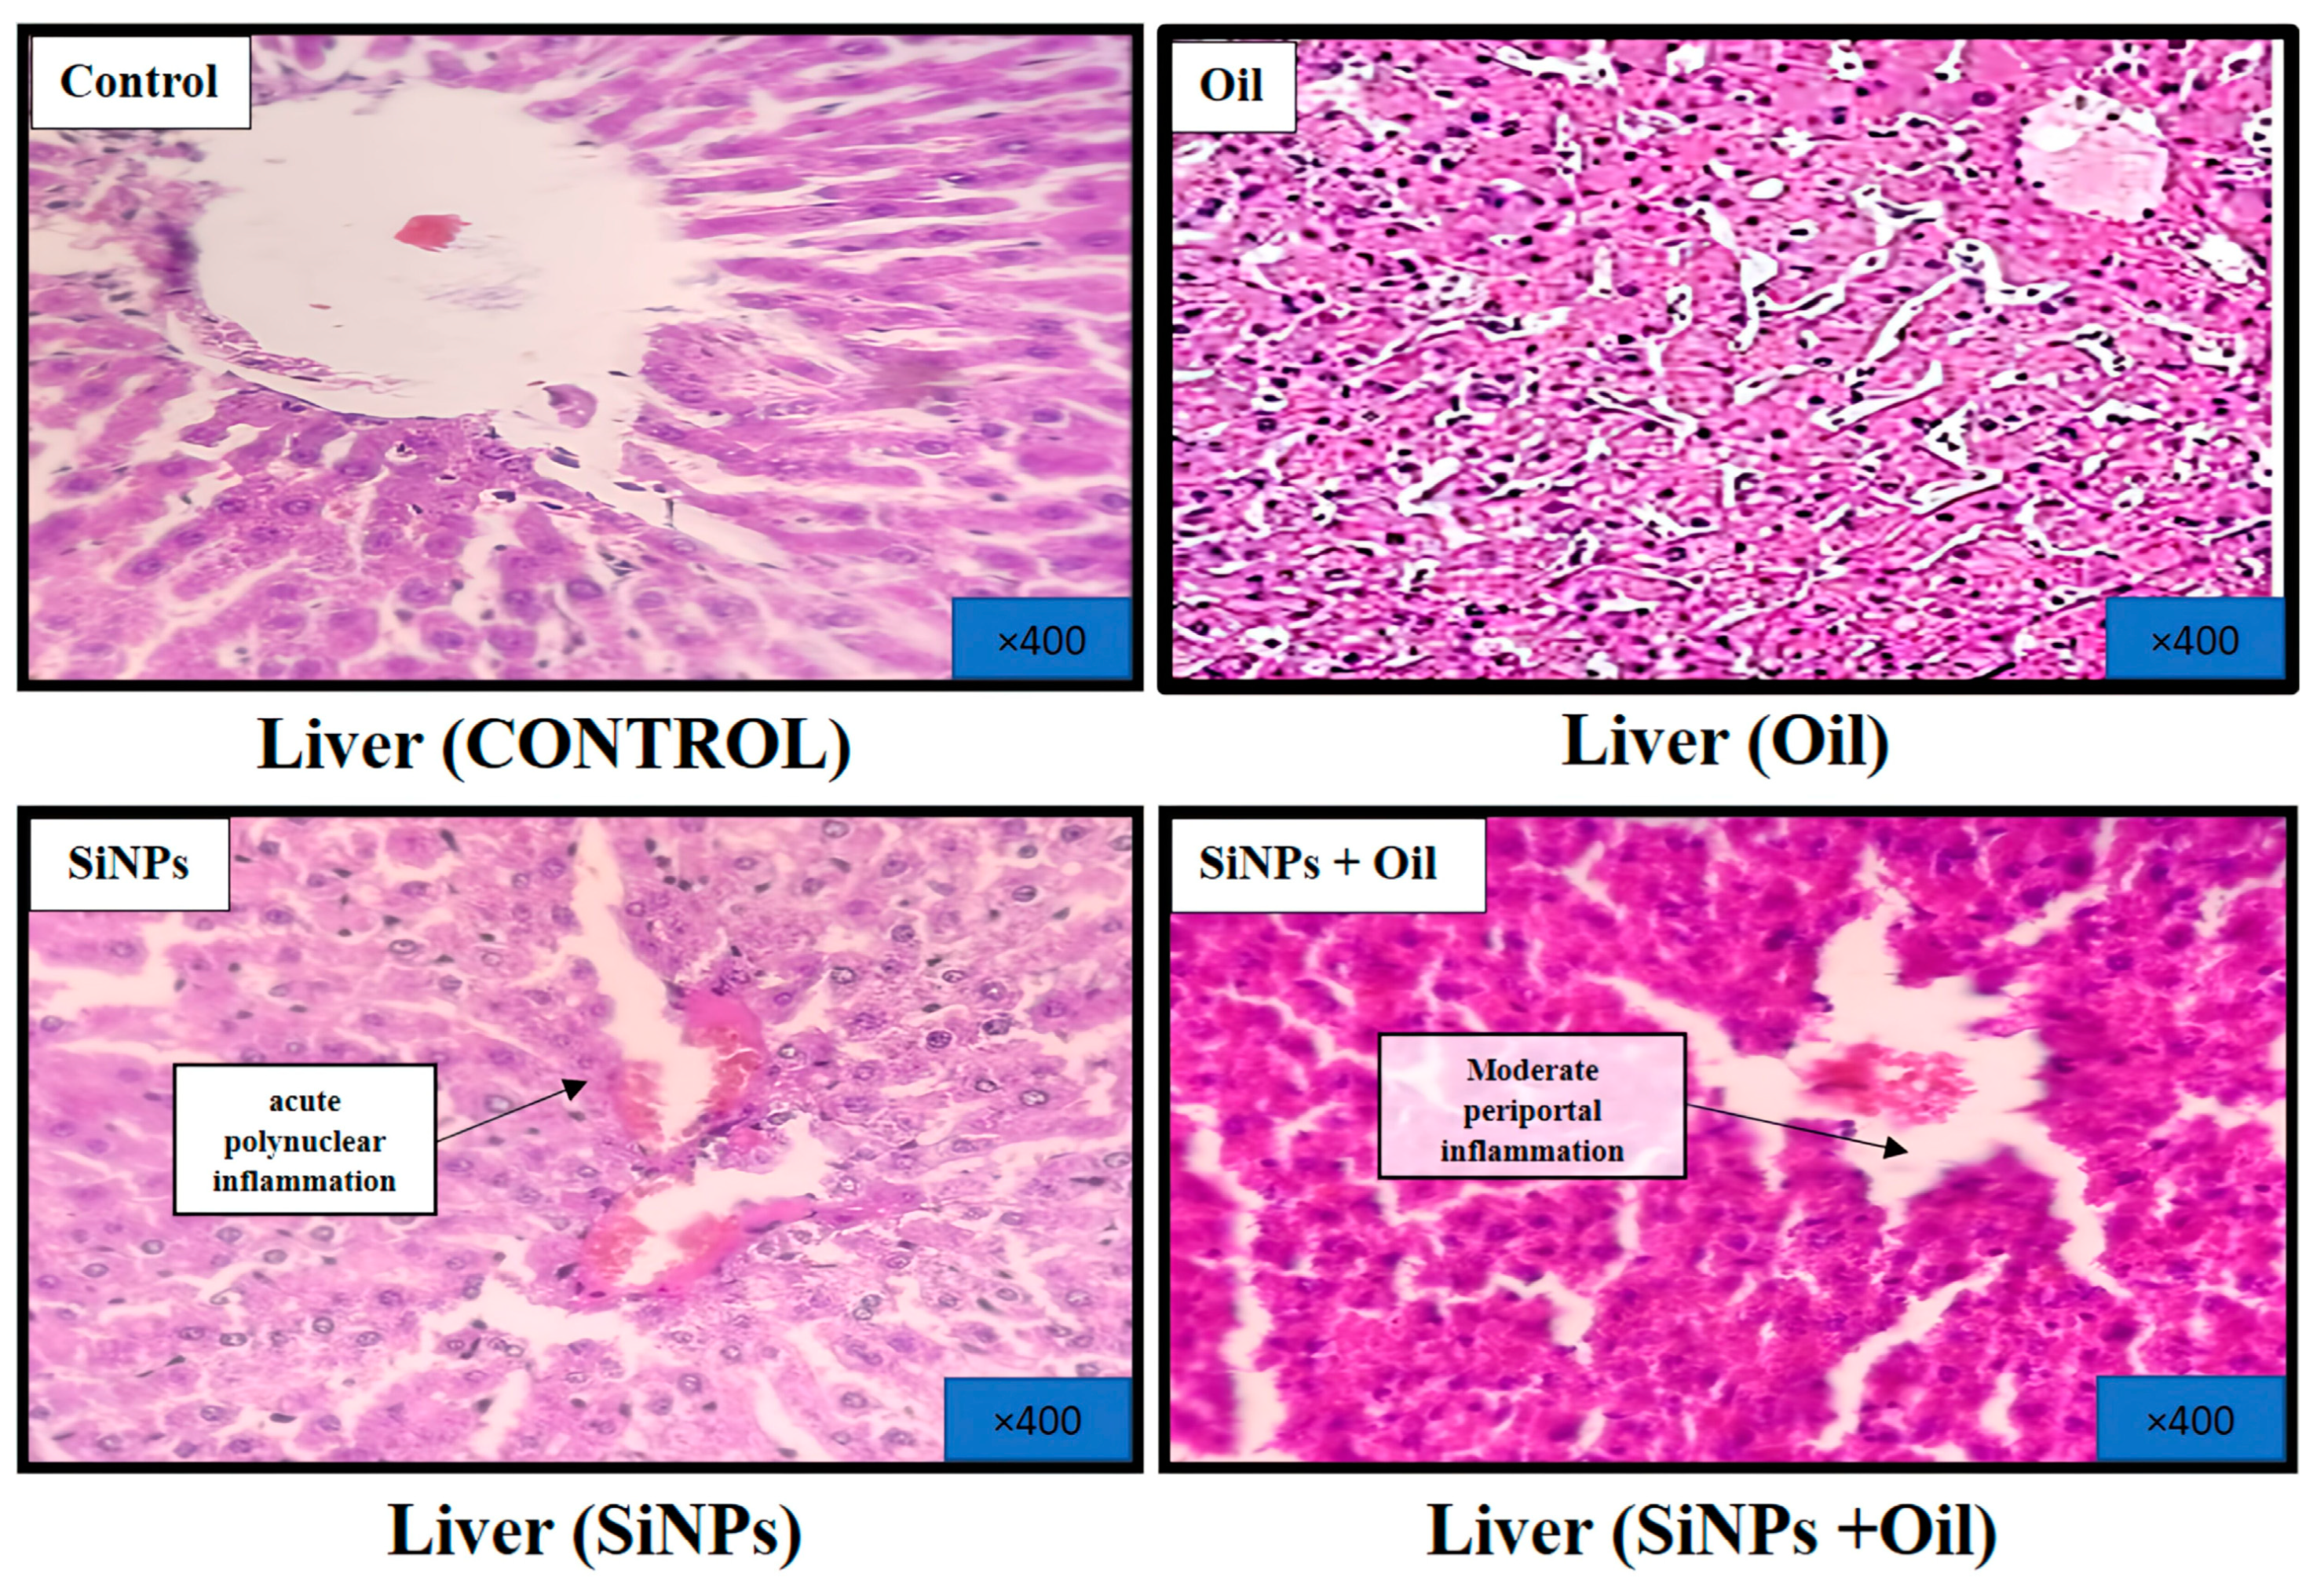
At the conclusion of the experiment, a histological analysis of the livers was performed after staining with hematoxylin and eosin. The results revealed distinct findings. Livers from the healthy control group exhibited a regular histological structure characterized by typical liver cells with well-preserved cytoplasm, nuclei, and central veins (Figure 8). In the oil-treated group, no significant histological changes were observed in comparison to the healthy control group (Figure 8). In contrast, the livers of the SiNP-injected group displayed notable pathological changes. These changes included vascular dilatation, congestion, inflammatory cell infiltration, and hepatocyte cell injury (Figure 8). Interestingly, oleaster oil supplementation visibly reduced these histological changes in the SiNP-injected group, as evident in Figure 8.
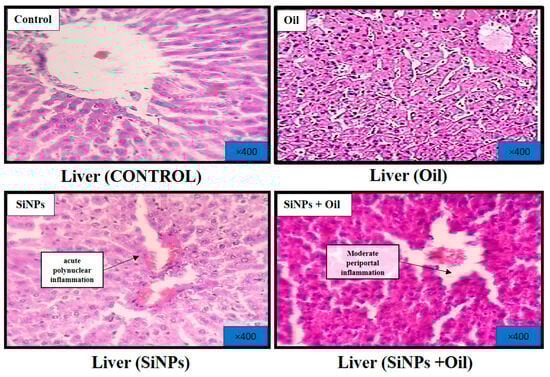
Figure 8.
Effect of oleaster oil on histopathologic damage in the liver after 5 weeks of treatment. Control group (C), (SiNPs) silica group. (SiNPs + Oleaster oil) Silica group treated with oleaster oil, and (O) Oleaster oil group.
3.11.2. Heart
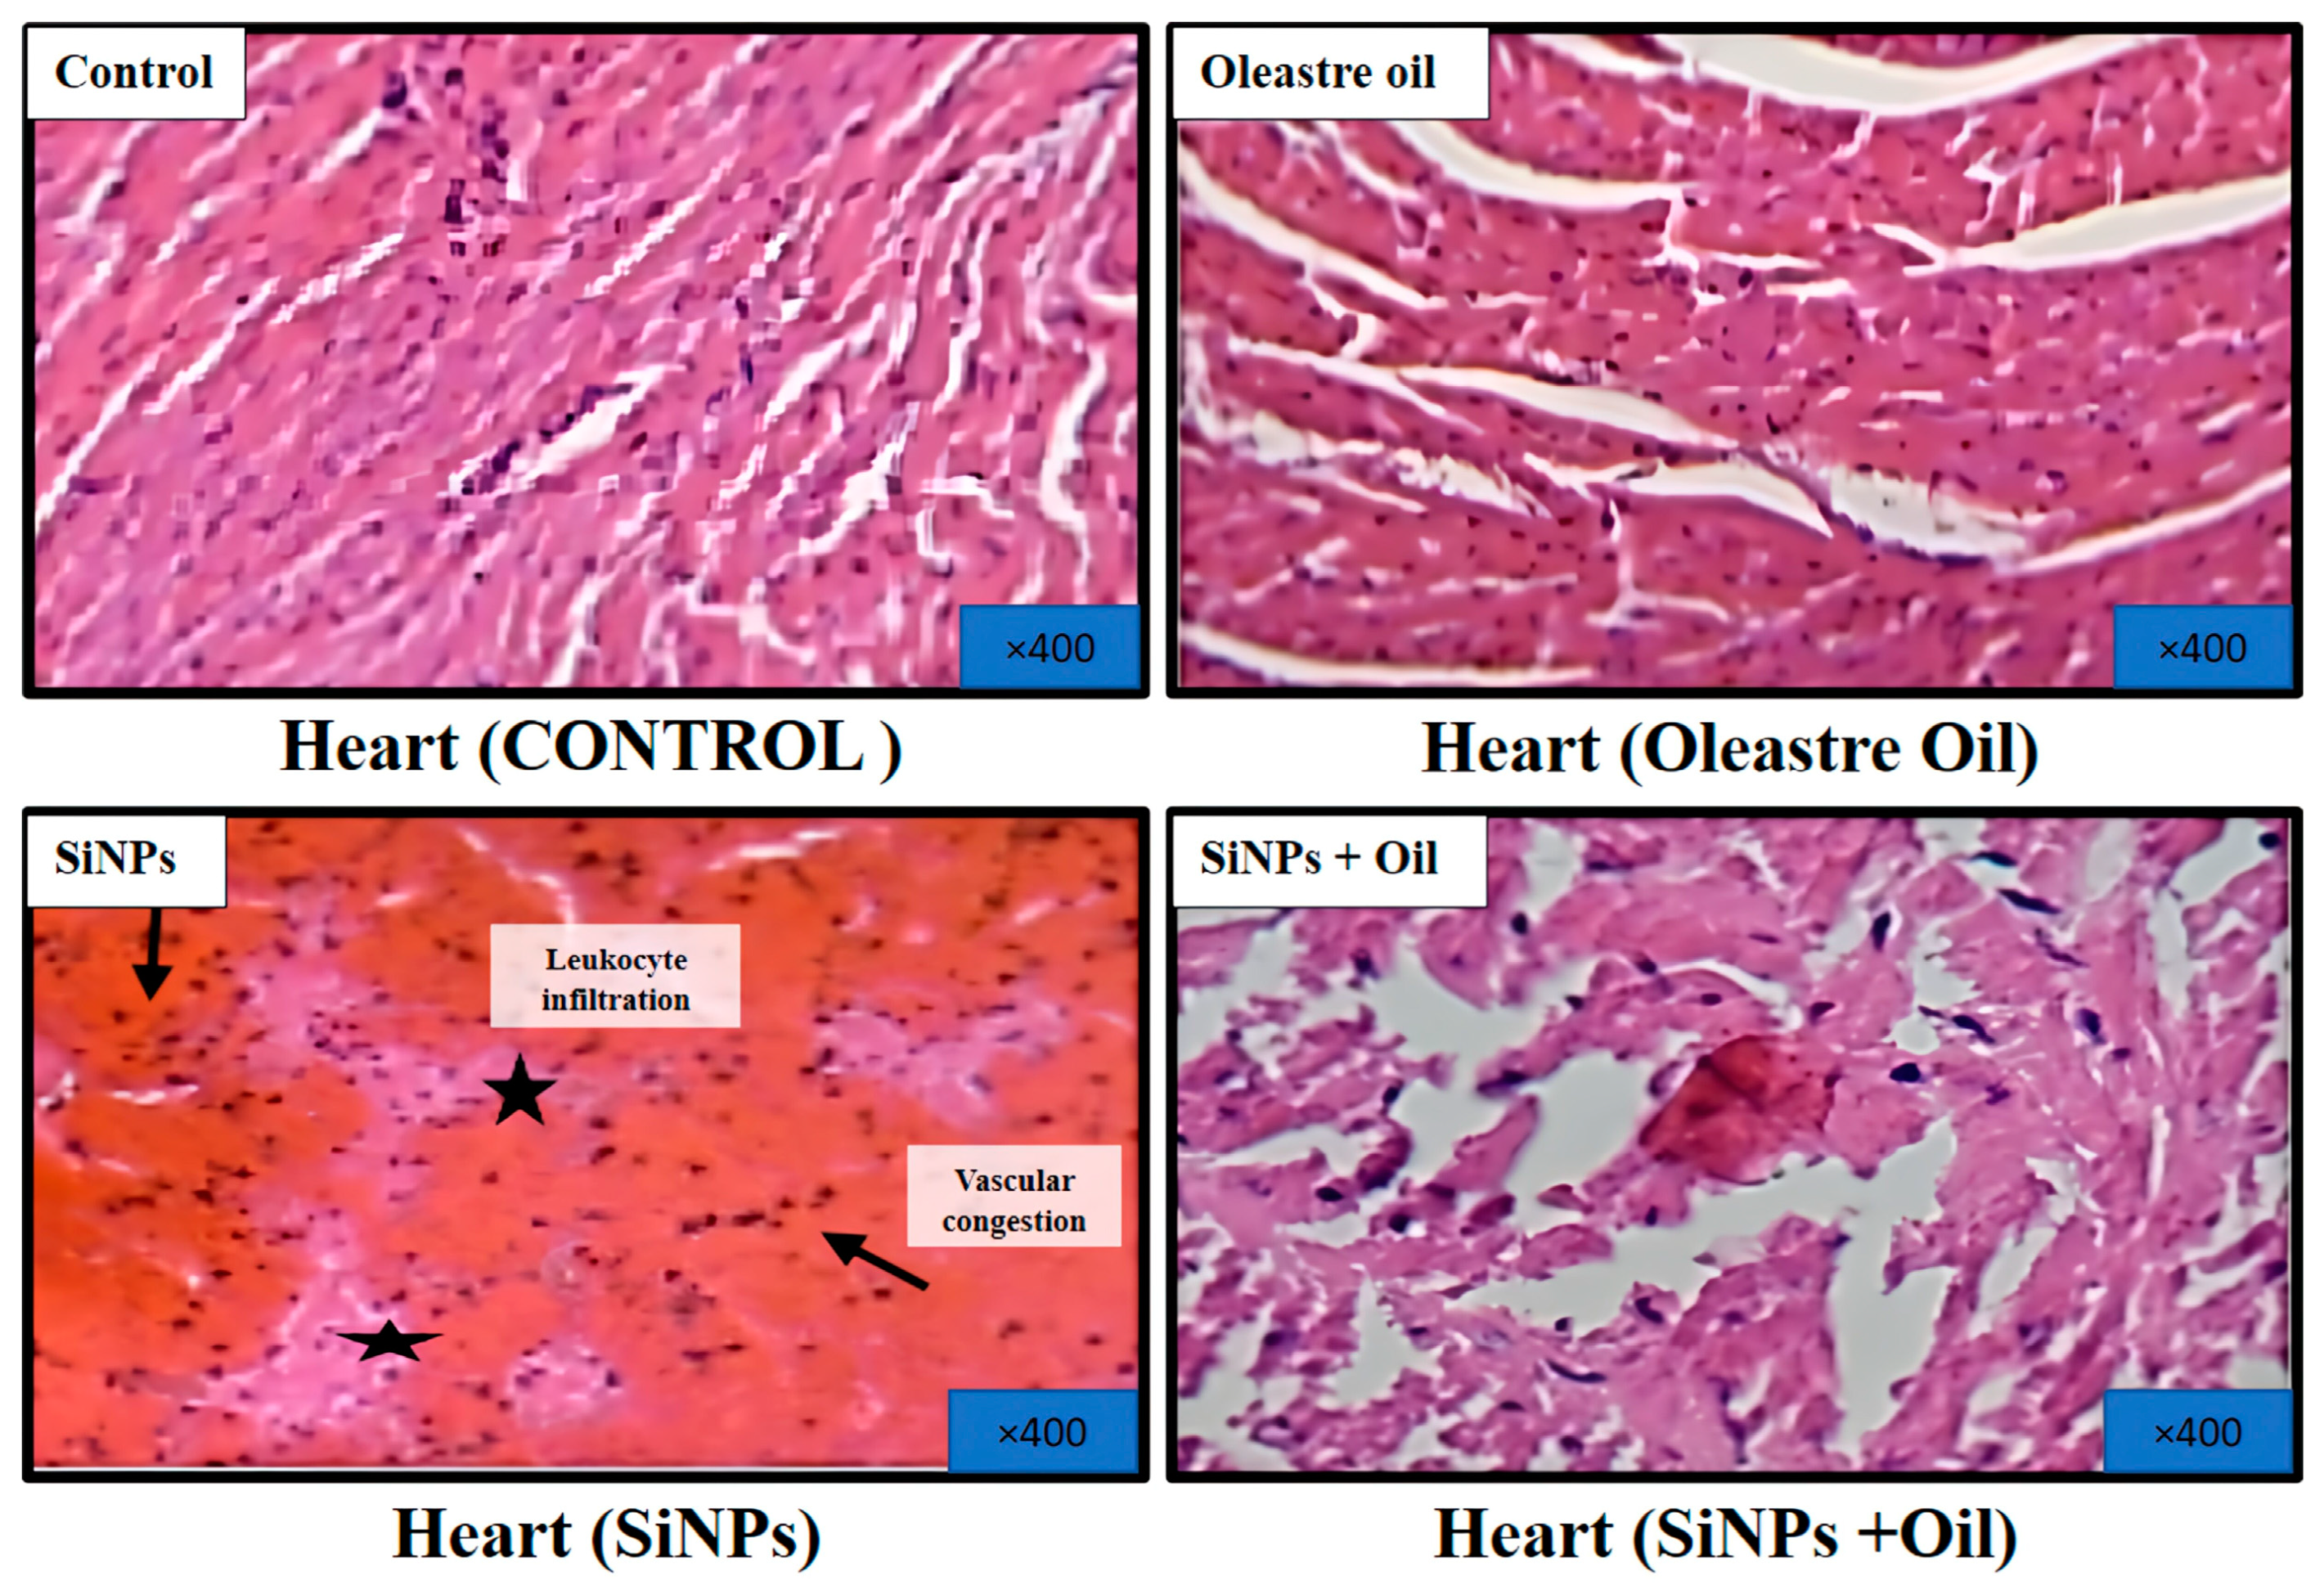
Microscopic examination of hematoxylin and eosin-stained sections of the hearts from healthy control rats and rats treated with oleaster oil revealed normal histological structure of the heart muscle, as depicted in Figure 9. Conversely, rats that received SiNPs displayed evident vascular congestion and leukocyte infiltration, as illustrated in Figure 9. Notably, the administration of oleaster oil in SiNP-injected rats visibly mitigated these histological alterations, as shown in Figure 9.
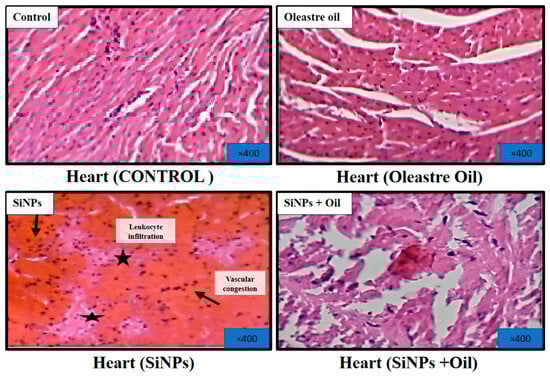
Figure 9.
Effect of oleaster oil on histopathologic damage in the heart after 5 weeks of treatment. Control group (C), (SiNPs) silica group. (SiNPs + Oleaster oil) Silica group treated with oleaster oil, and (O) Oleaster oil group.
3.11.3. Kidney
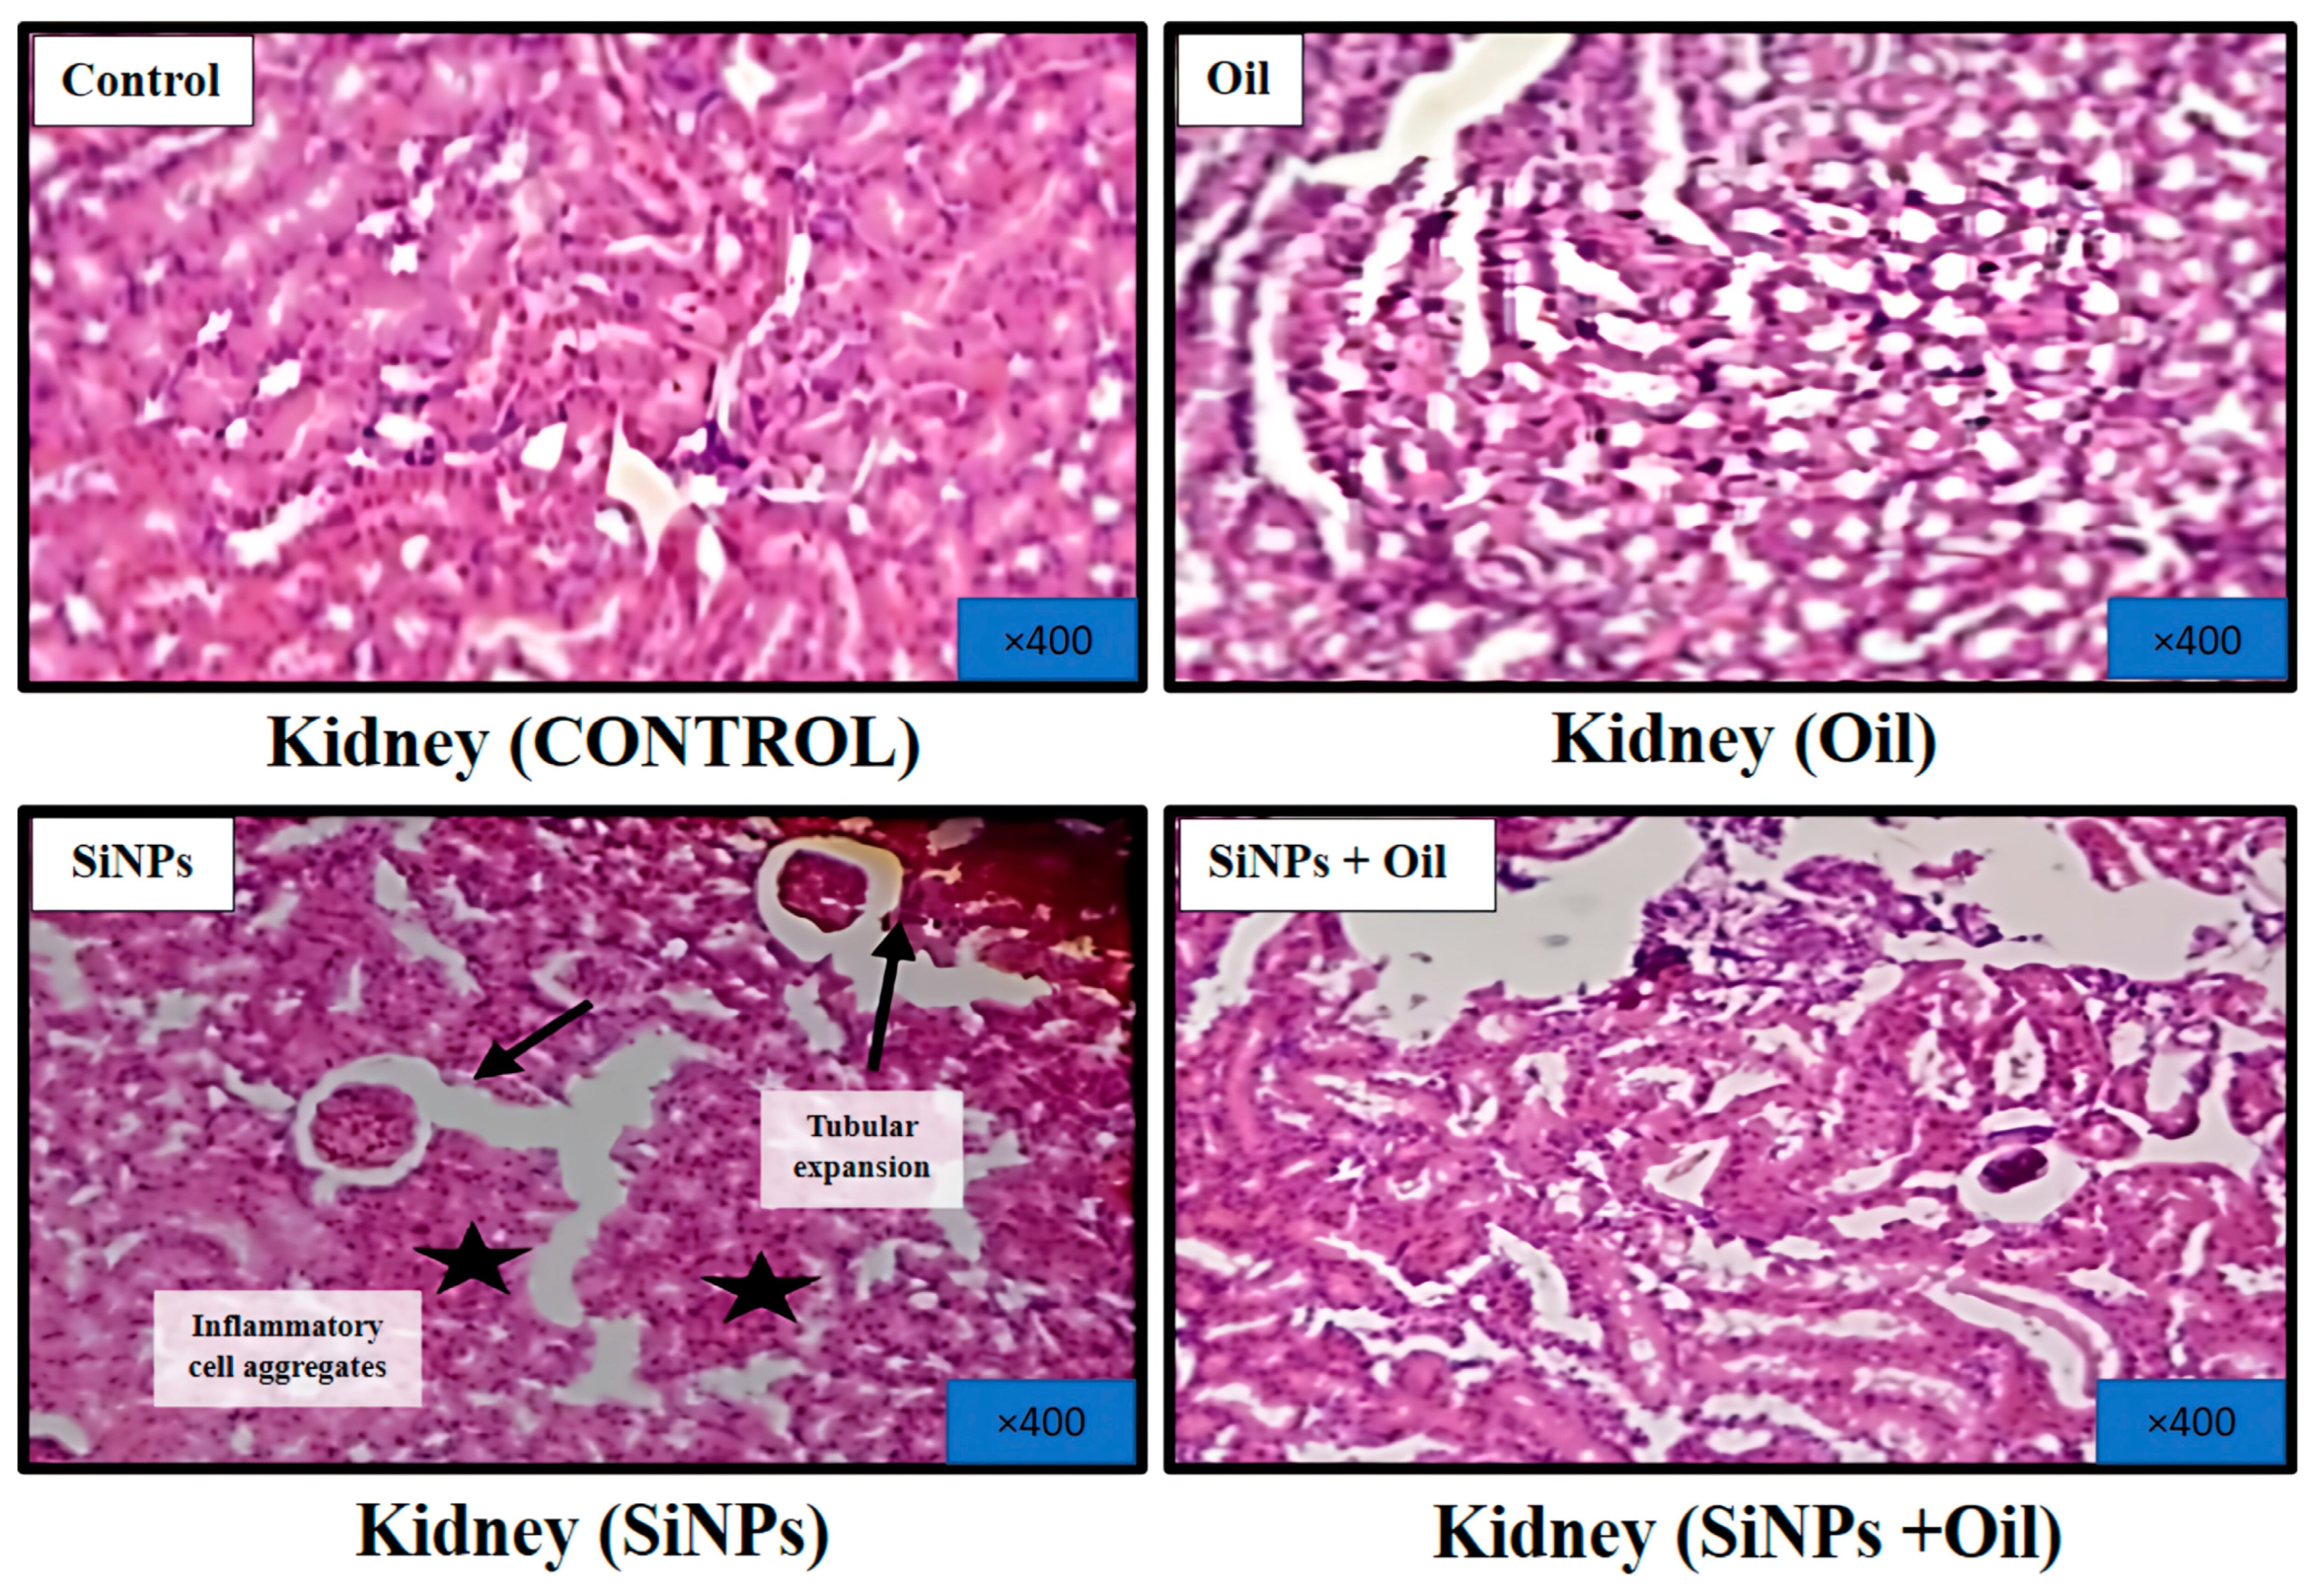
Figure 10 shows microscopic views of the kidney of a healthy control rat treated with oleaster oil, which exhibited a normal renal parenchyma with well-defined glomeruli and renal tubules. Figure 10 shows that in the kidneys injected with SiNPs, there were obvious symptoms of tubular dilatation, glomerular atrophy, and infiltration of inflammatory cells. Surprisingly, delivery of oleaster oil to rats injected with SiNPs significantly reduced these histological changes, as shown in Figure 10.
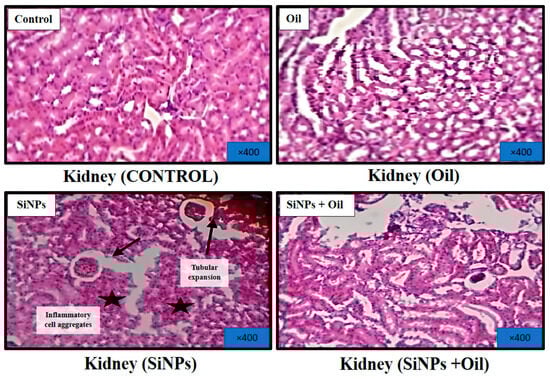
Figure 10.
Effect of oleaster oil on histopathologic damage in the kidney after 5 weeks of treatment. Control group (C), (SiNPs) silica group. (SiNPs + Oleaster oil) Silica group treated with oleaster oil, and (O) Oleaster oil group.
4. Discussion
In the current study, the effect of silica nanoparticles was evaluated with experiments to assess the antioxidant and protective effects of oleaster oil against silica nanoparticle-induced toxicity in Wistar rats. Polyphenols are well-recognized antioxidant compounds, and their presence in olive oil is associated with a range of beneficial properties, including improved stability, enhanced nutritional value, and enhanced sensory characteristics [45]. According to the classification proposed by Montedoro et al. (1992) [46], which categorizes olive varieties based on their phenolic compound content, our olive oil belongs to the category of varieties with an average polyphenol content (less than 500 mg EAG/kg). Furthermore, several factors can influence polyphenol content, such as the olive variety, degree of ripeness, soil quality, the extraction process used, and storage conditions for the oil [47]. According to several authors, flavonoids are typically found in limited quantities in virgin oils [48]. These secondary metabolites possess the capability to scavenge free radicals, disrupt the catalytic lipid peroxidation reaction [49], and inhibit LDL oxidation [50]. These compounds, alongside other minor constituents in the oil, contribute to the sensory and organoleptic properties of the oil, as well as play a role in preventing oil self-oxidation.
In addition, the qualitative and quantitative variations in total polyphenol and flavonoid content between different oils can be attributed to several factors, including climatic and environmental conditions, genetic heritage, harvesting period, plant development stage, and extraction methods. It is important to note that the quantification method used can also influence the estimation of total polyphenol and flavonoid content [51].
In our study, the results regarding oleaster oil’s antioxidant activity against the DPPH radical demonstrated a significant inhibitory effect (63.92%). This substantial level of activity can be attributed to the oil’s high concentration of secondary metabolites, such as polyphenols and flavonoids, which are recognized for their antioxidant properties. Oleaster oil’s antioxidant and protective properties are attributed to its extensive mixture of fatty acids and minor bioactive compounds. Its primary fatty acids, in particular oleic, linoleic, and α-linolenic acids, are known to contribute to cell integrity, delay the aging process, and provide anti-inflammatory benefits [52,53]. The antioxidant activity of the oil is augmented by its minor components, which include terpenes, sterols, phenolic compounds, and tocopherols. These compounds may mitigate the risks of cancer and aging-related diseases by reducing free radicals, protecting cellular structures, and preventing lipid oxidation [54]. Oleaster oil is beneficial for both antioxidant defense and overall health when consumed regularly.
These antioxidants primarily exert their effects through the redox properties of their hydroxyl groups and the structural arrangement of various functional groups in their composition. This enables them to actively scavenge free radicals, function as reducing agents, deactivate singlet oxygen, chelate metals, and act as hydrogen donors. The formation of reactive oxygen species, such as superoxide and hydrogen peroxide, following exposure to xenobiotics leads to an imbalance between the body’s antioxidant defense mechanisms and oxidative stress [45,51,52,53,54,55]. Recently, oxidative stress has frequently been reported as a toxic mechanism underlying silica nanoparticle-induced apoptosis and inflammation in various cell types, including macrophages, embryonic kidney cells, and epithelial cells [10,11,12,56,57].
However, MDA, GSH, GST, GPX, and SOD in species exposed to toxic substances are regarded as reliable biomarkers and can serve as essential diagnostic tools for evaluating xenobiotic exposure and its effects. According to Valko et al. (2005) [58], MDA is the most abundant aldehyde resulting from lipid peroxidation. This aldehyde can be considered a significant indicator of lipid peroxidation [59]. Malondialdehyde has been shown to induce cross-linking and polymerization of membrane components and may contribute to mutagenic and genotoxic effects. These effects result from the impairment of antioxidant defense mechanisms, including detoxification and scavenging enzymes, as well as increased lipid peroxidation following the interaction between reactive oxygen species and cell membranes [60]. Our findings supported previous studies indicating that treatment with SiNPs significantly triggered oxidative stress and induced an increase in MDA [61]. Our results demonstrated a significant increase in MDA levels in liver, kidney, and heart tissues following the injection of SiNPs. This increase may result from elevated levels of reactive oxygen species, which can attack polyunsaturated fatty acids in the cell membrane, leading to lipid peroxidation [62]. The rise in reactive oxygen species could be attributed to either an increase in their production or a reduction in their elimination, potentially due to the depletion of antioxidant scavenging systems, as previously reported [63]. Glutathione is the major non-enzymatic antioxidant in animal cells. It is the most abundant sulfur-containing reducing compound in the intracellular compartment and is involved in metabolism, transport processes, and cell protection against the toxic effects of both endogenous and exogenous compounds, including reactive oxygen species and heavy metals [64]. GSH plays a pivotal role in the detoxification of free radicals and heavy metals. Our results indicated a significant reduction in GSH levels in the studied organs (liver, kidney, and heart) following exposure to SiNPs. Several other studies conducted on these nanoparticles have also reported a decrease in this parameter in the liver and kidney cells of male rats in vivo [65].
Regarding glutathione S-transferase, an enzyme responsible for catalyzing the conjugation of glutathione (which possesses a nucleophilic -SH group) with a wide variety of compounds (carrying electrophilic groups) and also involved in the transport and removal of reactive compounds while performing other antioxidant functions, GST activity has been extensively used as a stress biomarker [66]. This enzyme plays a crucial role in the detoxification of xenobiotics, demonstrating a high capacity to reduce lipid peroxides [67,68] and protect against harmful metabolites generated after the degradation of macromolecules following exposure to oxidative stress [69].
Our results indicate a decrease in GST activity following the injection of SiNPs. This decrease can be attributed to the significant role of GST in catalyzing the conjugation of electrophilic substrates with glutathione to protect the cell against the effects of xenobiotics [70]. Our findings are consistent with those of Munteanu et al. (2010) [71], who conducted their research on MRC-5 cells. These authors suggested that these cells were capable of coping with oxidative stress induced by SiO2 nanoparticles. Furthermore, our results unequivocally demonstrated a decrease in superoxide dismutase enzyme activity in the livers, kidneys, and hearts of SiNP-injected rats compared to the healthy control rats. The reduction in SOD activity, a key component of cellular antioxidant defenses, results from the conversion of superoxide anion into oxygen and hydrogen peroxide, which is a potentially toxic compound.
Catalase represents the second stage of the enzymatic defense system. It functions to convert hydrogen peroxide, previously produced by superoxide dismutases, into water. CAT plays a crucial role in protecting the body against oxidative stress damage. Its primary function involves the transformation of hydrogen peroxide (H2O2) into water and molecular oxygen. According to our results, we observed a highly significant decrease in CAT activity in the livers, kidneys, and hearts of SiNP-injected rats compared to healthy control rats. This decrease is concurrent with the overproduction of superoxide anion (O2−) and hydrogen peroxide (H2O2), which may be responsible for the oxidation of major cellular components, including lipids, proteins, and DNA, ultimately leading to their inactivation and degradation [72]. These findings suggest that silica nanoparticles indirectly induced an increase in H2O2, contributing to oxidative stress.
Indeed, the reduction in CAT activities resulted in elevated H2O2 levels. This aligns with previous studies conducted on rats exposed to nanoparticles [73,74].
On the other hand, in rats injected with silica nanoparticles, we observed a decrease in MDA levels and an increase in SOD, CAT, GST, and Gpx activity after treatment with oleaster oil. Our findings are consistent with those of Salmalia et al. [75] and Lister et al. [76]. These results suggest that oleaster oil induces an antioxidant effect, likely attributable to the oil’s richness in bioactive compounds and antioxidants that inhibit lipid oxidation and counteract the detrimental effects of excessive free radical production. A study conducted by Bouarroudj et al. (2016) [77] demonstrated that this oil is particularly abundant in vitamin E, vitamin C, and polyphenols, which constitute an important family of antioxidants. Among these polyphenols are flavonoids, terpenoids, saponins, tannins, and alkaloids, all of which are excellent scavengers of reactive oxygen species.
This investigation assessed the antioxidant and protective properties of oleaster oil in the context of silica nanoparticle-induced toxicity in Wistar rats and illustrated its capacity to reduce oxidative stress. Nevertheless, the absence of a dose–response evaluation for oleaster oil and the absence of automated quantification in histological analysis are both potential limitations. Future research should concentrate on bypassing these constraints by integrating quantitative methods for histological analysis, such as automated scoring systems and image analysis software, which could provide more objective and reproducible data. Additionally, the expansion of the investigation to encompass a variety of oleaster oil dosages and the extension of the experimentation period would facilitate an improved understanding of its protective properties over time. Furthermore, further insights into the mechanistic basis of oleaster oil’s protective effects could be gained by investigating the molecular pathways that underlie the observed antioxidant activities.
5. Conclusions
This study investigated the relationship between nanoparticles, oxidative stress, and the potential therapeutic benefits of oleaster oil in albino Wistar rats. The research revealed that silica nanoparticles (SiNPs) induce an oxidative stress environment, leading to elevated lipid peroxidation levels and disruptions in antioxidant defense mechanisms. The study also revealed that oleaster oil can alleviate many of the negative effects of SiNPs, indicating its protective powers against cytotoxicity and oxidative stress. This is due to its intrinsic antioxidant qualities, which help reduce oxidative stress and minimize the negative effects of SiNP exposure. The findings could influence strategies for protecting human health and the environment in the face of nanoparticle applications.
Oleaster oil, which is derived from the Olea europaea L. plant, has the potential to be used in a variety of biomedical and industrial applications. This is due to its abundance of bioactive components, which include polyphenols, flavonoids, and essential fatty acids. It is a promising candidate for the treatment of oxidative stress-related diseases, including cardiovascular disorders, neurodegenerative conditions, and cancer, in the biomedical field due to its antioxidant properties. The development of therapeutic agents that reduce inflammation, delay aging, and protect cells from damage could be facilitated by its capacity to scavenge free radicals and inhibit lipid peroxidation. Furthermore, research indicates that oleaster oil may reduce the deleterious effects of environmental pollutants such as silica nanoparticles by enhancing antioxidant enzyme systems. The high polyphenolic content and stability of oleaster oil make it a valuable resource for the development of natural antioxidants, cosmetics, and food preservation in industrial applications. Its bioactive compounds, such as tocopherols and terpenes, have the potential to prolong the shelf life of products and prevent oxidation. The oil’s anti-inflammatory properties also indicate potential for application in cosmetic formulations. In addition, the increasing interest in sustainable and plant-based products could position oleaster oil as an environmentally favorable substitute for synthetic compounds in a variety of industries, such as pharmaceuticals and cosmetics, thereby increasing its overall industrial value.
For example, in the field of applied sciences, the potential to improve the efficacy of therapeutic interventions is illustrated by the combination of conventional CRC treatments with polyphenol-based nanoparticles. The efficacy of chemotherapy or radiotherapy can be enhanced by the delivery of polyphenols via nanoparticles, which could provide improved targeting and reduced adverse effects due to their natural anticancer properties [78]. Furthermore, the protective antioxidant properties of oleaster oil against oxidative stress induced by nanoparticles could be exploited to protect healthy tissues during the treatment protocol. This integrated approach demonstrates the potential for safer and more effective and targeted interventions in both cancer therapy and nanoparticle-induced toxicity management by incorporating bioactive compounds to enhance current therapeutic strategies.
Supplementary Materials
The following supporting information can be downloaded at https://www.mdpi.com/article/10.3390/app142110046/s1. Figure S1: XRD patterns of the investigated silica nanoparticles; Table S1: Summary statistics of pairwise comparisons from the Tukey test between different treatments and the control group, focusing on the MDA response level in the three organs (liver, kidney, heart) in Wistar rats; Table S2: Summary statistics of pairwise comparisons from the Tukey test between different treatments and the control group, focusing on the GSH response level in the three organs (liver, kidney, heart) in Wistar rats; Table S3: Summary statistics of pairwise comparisons from the Tukey test between different treatments and the control group, focusing on the GST activity response in the three organs (liver, kidney, heart) in Wistar rats; Table S4: Summary statistics of pairwise comparisons from the Tukey test between different treatments and the control group, focusing on the SOD activity response in the three organs (liver, kidney, heart) in Wistar rats; Table S5: Summary statistics of pairwise comparisons from the Tukey test between different treatments and the control group, focusing on the CAT activity response in the three organs (liver, kidney, heart) in Wistar rats.
Author Contributions
Conceptualization, M.H. (Malika Hamdiken) and Y.S.; methodology, M.H. (Malika Hamdiken), Y.S. and H.A.; software, R.Z.; validation, M.H. (Malika Hamdiken), A.B. (Andrea Balivo), P.D.P. and A.G.; formal analysis, R.Z. and M.H. (Malika Hamdiken); investigation, M.H. (Malika Hamdiken), Y.S., A.B. (Amina Bouzitouna), M.H. (Manel Hami), N.G., A.B. (Abdelghani Boudjahem) and H.A.; data curation, M.H. (Malika Hamdiken), Y.S., A.B. (Amina Bouzitouna), M.H. (Manel Hami), N.G., A.B. (Abdelghani Boudjahem) and H.A.; writing—original draft preparation, M.H. (Malika Hamdiken), Y.S. and R.Z.; writing—review and editing, M.H. (Malika Hamdiken), Y.S., A.B. (Amina Bouzitouna), M.H., N.G., A.B. (Abdelghani Boudjahem), H.A., R.Z., A.B. (Andrea Balivo), P.D.P. and A.G. All authors have read and agreed to the published version of the manuscript.
Funding
This work is part of Project PRFU-2022 (code D00L02UN240120220002) and was supported by the Algerian Ministry of Higher Education and Scientific Research and the Directorate General for Scientific Research and Technological Development (DGRSDT). The funders had no role in the study design, data collection and analysis, the decision to publish, or the preparation of the manuscript.
Institutional Review Board Statement
All protocols in this study were approved by the Committee on the Ethics of Animal Experiments of University 8 May 1945, Algeria, and were in compliance with the Scientific Council of the Faculty of SNV-STU and the Biology, Water, and Environment Research Laboratory at the University 8 May 1945 of Guelma. All animal experiments were conducted according to directive 2010/63/EU.
Informed Consent Statement
Not applicable.
Data Availability Statement
The raw data supporting the conclusions of this article will be made available by the authors on request.
Acknowledgments
The authors would like to express their sincere gratitude to all colleagues who contributed in the lab work. We would like to express our gratitude to the anonymous reviewers for their valuable comments and suggestions.
Conflicts of Interest
The authors declare no conflicts of interest.
References
- Ju-Nam, Y.; Lead, J.R. Manufactured nanoparticles: An overview of their chemistry, interactions and potential environmental implications. Sci. Total Environ. 2008, 400, 396–414. [Google Scholar] [CrossRef] [PubMed]
- Athinarayanan, J.; Periasamy, V.S.; Alsaif, M.A.; Al-Warthan, A.A.; Alshatwi, A.A. Presence of nanosilica (E551) in commercial food products: TNF-mediated oxidative stress and altered cell cycle progression in human lung fibroblast cells. Cell Biol. Toxicol. 2014, 30, 89–100. [Google Scholar] [CrossRef] [PubMed]
- Hougaard, K.S.; Campagnolo, L.; Chavatte-Palmer, P.; Tarrade, A.; Rousseau-Ralliard, D.; Valentino, S.; Park, M.V.D.Z.; de Jong, W.H.; Wolterink, G.; Piersma, A.H.; et al. A perspective on the developmental toxicity of inhaled nanoparticles. Reprod. Toxicol. 2015, 56, 118–140. [Google Scholar] [CrossRef]
- Egbuna, C.; Parmar, V.K.; Jeevanandam, J.; Ezzat, S.M.; Patrick-Iwuanyanwu, K.C.; Adetunji, C.O.; Khan, J.; Onyeike, E.N.; Uche, C.Z.; Akram, M.; et al. Toxicity of Nanoparticles in Biomedical Application: Nanotoxicology. J. Toxicol. 2021, 30, 9954443. [Google Scholar] [CrossRef] [PubMed]
- Lin, W.; Huang, Y.-W.; Zhou, X.-D.; Ma, Y. In vitro toxicity of silica nanoparticles in human lung cancer cells. Toxicol. Appl. Pharmacol. 2006, 217, 252–259. [Google Scholar] [CrossRef]
- Nishimori, H.; Kondoh, M.; Isoda, K.; Tsunoda, S.-I.; Tsutsumi, Y.; Yagi, K. Silica nanoparticles as hepatotoxicants. Eur. J. Pharm. Biopharm. 2009, 72, 496–501. [Google Scholar] [CrossRef]
- Lu, X.; Liu, Y.; Kong, X.; Lobie, P.E.; Chen, C.; Zhu, T. Nanotoxicity: A Growing Need for Study in the Endocrine System. Small 2013, 9, 1654–1671. [Google Scholar] [CrossRef]
- Li, Z.; Mu, Y.; Peng, C.; Lavin, M.F.; Shao, H.; Du, Z. Understanding the mechanisms of silica nanoparticles for nanomedicine. WIREs Nanomed. Nanobiotechnol. 2021, 13, e1658. [Google Scholar] [CrossRef]
- Leung, C.C.; Yu, I.T.S.; Chen, W. Silicosis. Lancet 2012, 379, 2008–2018. [Google Scholar] [CrossRef]
- Eom, H.-J.; Choi, J. Oxidative stress of silica nanoparticles in human bronchial epithelial cell, Beas-2B. Toxicol. In Vitro 2009, 23, 1326–1332. [Google Scholar] [CrossRef]
- Park, E.-J.; Park, K. Oxidative stress and pro-inflammatory responses induced by silica nanoparticles in vivo and in vitro. Toxicol. Lett. 2009, 184, 18–25. [Google Scholar] [CrossRef] [PubMed]
- Wang, F.; Gao, F.; Lan, M.; Yuan, H.; Huang, Y.; Liu, J. Oxidative stress contributes to silica nanoparticle-induced cytotoxicity in human embryonic kidney cells. Toxicol. In Vitro 2009, 23, 808–815. [Google Scholar] [CrossRef] [PubMed]
- Murugadoss, S.; Lison, D.; Godderis, L.; Van Den Brule, S.; Mast, J.; Brassinne, F.; Sebaihi, N.; Hoet, P.H. Toxicology of silica nanoparticles: An update. Arch. Toxicol. 2017, 91, 2967–3010. [Google Scholar] [CrossRef] [PubMed]
- Nel, A.; Xia, T.; Madler, L.; Li, N. Toxic Potential of Materials at the Nanolevel. Science 2006, 311, 622–627. [Google Scholar] [CrossRef]
- Li, N.; Xia, T.; Nel, A.E. The role of oxidative stress in ambient particulate matter-induced lung diseases and its implications in the toxicity of engineered nanoparticles. Free. Radic. Biol. Med. 2008, 44, 1689–1699. [Google Scholar] [CrossRef]
- Wahnou, H.; Limami, Y.; Oudghiri, M. Flavonoids and Flavonoid-Based Nanoparticles for Osteoarthritis and Rheumatoid Arthritis Management. Biochem 2024, 4, 38–61. [Google Scholar] [CrossRef]
- Vellosa, J.; Khalil, N.; Formenton, V.; Ximenes, V.; Fonseca, L.; Furlan, M.; Brunetti, I.; Oliveira, O. Antioxidant activity of Maytenus ilicifolia root bark. Fitoterapia 2006, 77, 243–244. [Google Scholar] [CrossRef]
- Kumaran, A.; Karunakaran, R.J. Activity-guided isolation and identification of free radical-scavenging components from an aqueous extract of Coleus aromaticus. Food Chem. 2007, 100, 356–361. [Google Scholar] [CrossRef]
- Francenia Santos Sánchez, N.; Salas-Coronado, R.; Villanueva-Cañongo, C.; Hernández-Carlos, B. Antioxidant compounds and their antioxidant mechanism. Antioxidants 2019, 10, 1–29. [Google Scholar]
- Hasanuzzaman, M.; Bhuyan, M.B.; Zulfiqar, F.; Raza, A.; Mohsin, S.M.; Al Mahmud, J.; Fujita, M.; Fotopoulos, V. Reactive Oxygen Species and Antioxidant Defense in Plants under Abiotic Stress: Revisiting the Crucial Role of a Universal Defense Regulator. Antioxidants 2020, 9, 681. [Google Scholar] [CrossRef]
- Ozturk, M.; Dogan, Y.; Sakcali, M.S.; Doulis, A.; Karam, F. Ecophysiological responses of some maquis (Ceratonia siliqua L., Olea oleaster Hoffm. & Link, Pistacia lentiscus and Quercus coccifera L.) plant species to drought in the east Mediterranean ecosystem. Environ. Biol. 2010, 31, 233–245. [Google Scholar]
- Dabbou, S.; Dabbou, S.; Selvaggini, R.; Urbani, S.; Taticchi, A.; Servili, M.; Hammami, M. Comparison of the Chemical Composition and the Organoleptic Profile of Virgin Olive Oil from Two Wild and Two Cultivated Tunisian Olea europaea. Chem. Biodivers. 2011, 8, 189–202. [Google Scholar] [CrossRef] [PubMed]
- Scoditti, E.; Capurso, C.; Capurso, A.; Massaro, M. Vascular effects of the Mediterranean diet—Part II: Role of omega-3 fatty acids and olive oil polyphenols. Vasc. Pharmacol. 2014, 63, 127–134. [Google Scholar] [CrossRef] [PubMed]
- Peres, F.; Martins, L.L.; Mourato, M.; Vitorino, C.; Antunes, P.; Ferreira-Dias, S. Phenolic compounds of ‘Galega Vulgar’ and ‘Cobranc¸osa’ olive oils along early ripening stages. Food Chem. 2016, 211, 51–58. [Google Scholar] [CrossRef]
- Corona, G.; Spencer, J.; Dessì, M. Extra virgin olive oil phenolics: Absorption, metabolism, and biological activities in the GI tract. Toxicol. Ind. Health 2009, 25, 285–293. [Google Scholar] [CrossRef]
- Goldsmith, C.D.; Stathopoulos, C.E.; Golding, J.B.; Roach, P.D. Fate of the paorlic compounds during olive oil production with the traditional press method. Int. Food Res. J. 2014, 21, 101–109. [Google Scholar]
- Genovese, A.; Caporaso, N.; Leone, T.; Paduano, A.; Mena, C.; Perez-Jimenez, M.A.; Sacchi, R. Use of odorant series for extra virgin olive oil aroma characterisation. J. Sci. Food Agric. 2019, 99, 1215–1224. [Google Scholar] [CrossRef]
- Genovese, A.; Caporaso, N.; Villani, V.; Paduano, A.; Sacchi, R. Olive oil phenolic compounds affect the release of aroma compounds. Food Chem. 2015, 181, 284–294. [Google Scholar] [CrossRef]
- Li, H.-B.; Cheng, K.-W.; Wong, C.-C.; Fan, K.-W.; Chen, F.; Jiang, Y. Evaluation of antioxidant capacity and total phenolic content of different fractions of selected microalgae. Food Chem. 2007, 102, 771–776. [Google Scholar] [CrossRef]
- Lianda, R.L.P.; Sant’Ana, L.D.; Echevarria, A.; Castro, R.N. Antioxidant activity and phenolic composition of brazilian honeys and their extracts. J. Braz. Chem. Soc. 2012, 23, 618–627. [Google Scholar] [CrossRef]
- Mansouri, A.; Embarek, G.; Kokkalou, E.; Kefalas, P. Phenolic profile and antioxidant activity of the Algerian ripe date palm fruit (Phoenix dactylifera). Food Chem. 2005, 89, 411–420. [Google Scholar] [CrossRef]
- Canesi, L.; Ciacci, C.; Vallotto, D.; Gallo, G.; Marcomini, A.; Pojana, G. In vitro effects of suspensions of selected nanoparticles (C60 fullerene, TiO2, SiO2) on Mytilus hemocytes. Aquat. Toxicol. 2010, 96, 151–158. [Google Scholar] [CrossRef] [PubMed]
- Kim, J.S.; Yoon, T.-J.; Yu, K.N.; Kim, B.G.; Park, S.J.; Kim, H.W.; Lee, K.H.; Park, S.B.; Lee, J.-K.; Cho, M.H. Toxicity and Tissue Distribution of Magnetic Nanoparticles in Mice. Toxicol. Sci. 2006, 89, 338–347. [Google Scholar] [CrossRef] [PubMed]
- Kim, S.-H.; Lee, K.; Kwon, T.K.; Yun, H.-S.; Khang, D.; Kim, M.-S.; Lee, D.; Khang, D. The comparative immunotoxicity of mesoporous silica nanoparticles and colloidal silica nanoparticles in mice. Int. J. Nanomed. 2013, 8, 147–158. [Google Scholar] [CrossRef]
- Mokhtari, T.; Osman, H.-E.H.; El-Kenawy, A.E.-M.; Dashti, N. Ameliorative effect of virgin olive oil against nephrotoxicity following sub-chronic administration of ethephon in male rats. J. Tradit. Complement. Med. 2020, 10, 487–495. [Google Scholar] [CrossRef]
- Ohkawa, H.; Ohishi, N.; Yagi, K. Assay for lipid peroxides in animal tissues by thiobarbituric acid reaction. Anal. Biochem. 1979, 95, 351–358. [Google Scholar] [CrossRef]
- Weckbeker, G.; Cory, J.G. Ribonucleotide reductase activity and growth of Glutathoine-depleted mous leikemia L1210 cells in vitro. Cancer Lett. 1988, 40, 257–264. [Google Scholar] [CrossRef]
- Aebi, H. Catalase. In Methods of Enzymatic Analysis; Bergmeyer, H.U., Ed.; Academic Press: New York, NY, USA, 1983; Volume 3. [Google Scholar] [CrossRef]
- Habig, W.H.; Pabst, M.J.; Jakoby, W.B. Glutathione-S-transferase the first step in mercapturic acid formation. J. Biol. Chem. 1974, 249, 7130–7139. [Google Scholar] [CrossRef]
- Asada, K.; Takahashi, M.-A.; Nagate, M. Assay and Inhibitors of Spinach Superoxide Dismutase. Agric. Biol. Chem. 1974, 38, 471–473. [Google Scholar] [CrossRef]
- Bradford, M.M. A rapid and sensitive method for the quantitation of microgram quantities of protein utilizing the principle of protein-dye binding. Anal. Biochem. 1976, 72, 248–254. [Google Scholar] [CrossRef]
- Houlot, R. Techniques d’histopathologie et de Cytopathologie. Editions Maloine. 1984, pp. 225–227. Available online: https://www.sudoc.fr/000809764 (accessed on 3 April 2022).
- Genovese, A.; Caporaso, N.; Sacchi, R. Flavor Chemistry of Virgin Olive Oil: An Overview. Appl. Sci. 2021, 11, 1639. [Google Scholar] [CrossRef]
- Vichi, S.; Guadayol, J.M.; Caixach, J.; López-Tamames, E.; Buxaderas, S. Monoterpene and sesquiterpene hydrocarbons of virgin olive oil by headspace solid-phase microextraction coupled to gas chromatography/mass spectrometry. J. Chromatogr. A 2006, 1125, 117–123. [Google Scholar] [CrossRef] [PubMed]
- Servili, M.; Selvaggini, R.; Esposto, S.; Taticchi, A.; Montedoro, G.; Morozzi, G. Health and sensory properties of virgin olive oil hydrophilic phenols: Agronomic and technological aspects of production that affect their occurrence in the oil. J. Chromatogr. A 2004, 1054, 113–127. [Google Scholar] [CrossRef] [PubMed]
- Montedoro, G.; Servili, M.; Baldioli, M.; Miniati, E. Simple and Hydrolyzable Phenolic Compounds in Virgin Olive Oil; Note 2. Initial Characterization of the Hydrolyzable Fraction. J. Agric. Food Chem. 1992, 40, 1571–1576. [Google Scholar] [CrossRef]
- Ollivier, D.; Boubault, E.; Pinatel, C.; Souillol, S.; Guérère, M.; Artaud, J. Analyse de la fraction phénolique des huiles d’olive vierges. Ann. Falsif. Expert. Chim. Toxicol. 2004, 965, 169–196. [Google Scholar]
- Oliveraslopez, M.; Innocenti, M.; Giaccherini, C.; Ieri, F.; Romani, A.; Mulinacci, N. Study of the phenolic composition of spanish and italian monocultivar extra virgin olive oils: Distribution of lignans, secoiridoidic, simple phenols and flavonoids. Talanta 2007, 73, 726–732. [Google Scholar] [CrossRef]
- Angerosa, F.; Basti, C.; Vito, R. Virgin Olive Oil Volatile Compounds from Lipoxygenase Pathway and Characterization of Some Italian Cultivars. J. Agric. Food Chem. 1999, 47, 836–839. [Google Scholar] [CrossRef]
- Fito, P.; Chiralt, A. Vacuum impregnation of plant tissues. In Minimally Processed Fruits and Vegetables: Fundamental Aspects and Applications, 1st ed.; Alzamora, S.M., Tapia, M.S., Lopez-Malo, A., Eds.; Aspen Publication: Gaithersburg, MD, USA, 2000; pp. 189–204. Available online: https://www.researchgate.net/publication/313055326_Vacuum_impregnation_of_plant_tissues (accessed on 3 April 2022).
- Le Bras, M.; Clément, M.-V.; Pervaiz, S.; Brenner, C. Reactive oxygen species and the mitochondrial signaling pathway of cell death. Histol. Histopathol. 2005, 20, 205–219. [Google Scholar] [CrossRef]
- Caramia, G.; Gori, A.; Valli, E.; Cerretani, L. Virgin olive oil in preventive medicine: From legend to epigenetics. Eur. J. Lipid Sci. Technol. 2012, 114, 375–388. [Google Scholar] [CrossRef]
- Bendini, A.; Cerretani, L.; Carrasco-Pancorbo, A.; Gómez-Caravaca, A.M.; Segura-Carretero, A.; Fernández-Gutiérrez, A.; Lercker, G.; Simal-Gandara, J. Phenolic Molecules in Virgin Olive Oils: A Survey of Their Sensory Properties, Health Effects, Antioxidant Activity and Analytical Methods. An Overview of the Last Decade Alessandra. Molecules 2007, 12, 1679–1719. [Google Scholar] [CrossRef]
- Rice-Evans, C.A.; Miller, N.J.; Paganga, G. Structure-antioxidant activity relationships of flavonoids and phenolic acids. Free Radic. Biol. Med. 1999, 20, 933–956. [Google Scholar] [CrossRef] [PubMed]
- Rahman, A.N.A.; Mohamed, A.A.-R.; Mohammed, H.H.; Elseddawy, N.M.; Salem, G.A.; El-Ghareeb, W.R. The ameliorative role of geranium (Pelargonium graveolens) essential oil against hepato-renal toxicity, immunosuppression, and oxidative stress of profenofos in common carp, Cyprinus carpio (L.). Aquaculture 2020, 517, 734777. [Google Scholar] [CrossRef]
- Fritsch-Decker, S.; Marquardt, C.; Stoeger, T.; Diabaté, S.; Weiss, C. Revisiting the stress paradigm for silica nanoparticles: Decoupling of the anti-oxidative defense, pro-inflammatory response and cytotoxicity. Arch. Toxicol. 2018, 92, 2163–2174. [Google Scholar] [CrossRef] [PubMed]
- Kusaczuk, M.; Krętowski, R.; Naumowicz, M.; Stypułkowska, A.; Cechowska-Pasko, M. Silica nanoparticle-induced oxidative stress and mitochondrial damage is followed by activation of intrinsic apoptosis pathway in glioblastoma cells. Int. J. Nanomed. 2018, 13, 2279–2294. [Google Scholar] [CrossRef]
- Valko, M.; Rhodes, C.J.; Moncol, J.; Izakovic, M.; Mazur, M. Free radicals, metals and antioxidants in oxidative stress-induced cancer. Chem. Biol. Interact. 2005, 160, 1–40. [Google Scholar] [CrossRef]
- Bonnefont-Rousselot, D.; Thérond, P.; Beaudeux, J.L.; Peynet, J.; Legrand, A.; Delattre, J. Aging and oxidative stress. Which potential markers? Ann. Biol. Clin. 2001, 59, 453–459. [Google Scholar]
- Attig, H.; Dagnino, A.; Negri, A.; Jebali, J.; Boussetta, H.; Viarengo, A.; Dondero, F.; Banni, M. Uptake and biochemical responses of mussels Mytilus galloprovincialis exposed to sublethal nickel concentrations. Ecotoxicol. Environ. Saf. 2010, 73, 1712–1719. [Google Scholar] [CrossRef]
- Aouey, B.; Boukholda, K.; Ciobica, A.; Burlui, V.; Soulimani, R.; Chigr, F.; Fetoui, H. Renal Fibrosis and Oxidative Stress Induced by Silica Nanoparticles in Male Rats and Its Molecular Mechanisms. Iran. J. Pharm. Res. 2024, 23, e143703. [Google Scholar] [CrossRef]
- Su, L.; Wang, M.; Yin, S.-T.; Wang, H.-L.; Chen, L.; Sun, L.-G.; Ruan, D.-Y. The interaction of selenium and mercury in the accumulations and oxidative stress of rat tissues. Ecotoxicol. Environ. Saf. 2008, 70, 483–489. [Google Scholar] [CrossRef]
- Chen, X.; Guo, C.; Kong, J. Oxidative stress in neurodegenerative diseases. Neural. Regen. Res. 2012, 7, 376–385. [Google Scholar] [CrossRef]
- Dickinson, D.A.; Forman, H.J. Cellular glutathione and thiols metabolism. Biochem. Pharmacol. 2002, 64, 1019–1026. [Google Scholar] [CrossRef] [PubMed]
- Azouz, R.A.; Korany, R.M.S. Toxic Impacts of Amorphous Silica Nanoparticles on Liver and Kidney of Male Adult Rats: An In Vivo Study. Biol. Trace Element Res. 2021, 199, 2653–2662. [Google Scholar] [CrossRef] [PubMed]
- Fitzpatrick, P.J.; O’Halloran, J.; Sheehan, D.; Walsh, A.R. Assessment of a glutathione S-transferase and related proteins in the gill and digestive gland of Mytilus edulis (L.), as potential organic pollution biomarkers. Biomarkers 1997, 2, 51–56. [Google Scholar] [CrossRef] [PubMed]
- Griffith, O.W. Biologic and pharmacologic regulation of mammalian glutathione synthesis. Free. Radic. Biol. Med. 1999, 27, 922–935. [Google Scholar] [CrossRef] [PubMed]
- İşcan, M.; Ada, A.O.; Coban, T.; Kapucuoglu, N.; Aydin, A.; Isimer, A. Combined Effects of Cadmium and Nickel on Testicular Xenobiotic Metabolizing Enzymes in Rats. Biol. Trace Element Res. 2002, 89, 177–190. [Google Scholar] [CrossRef]
- Hayes, J.D.; Pulford, D.J. The Glut athione S-Transferase Supergene Family: Regulation of GST and the Contribution of the lsoenzymes to Cancer Chemoprotection and Drug Resistance. Crit. Rev. Biochem. Mol. Biol. 1995, 30, 445–520. [Google Scholar] [CrossRef]
- Ferrari, A.; Venturino, A.; de D’angelo, A.M.P. Effects of carbaryl and azinphos methyl on juvenile rainbow trout (Oncorhynchus mykiss) detoxifying enzymes. Pestic. Biochem. Physiol. 2007, 88, 134–142. [Google Scholar] [CrossRef]
- Munteanu, M.C.; Radu, M.; Hermenean, A.; Sima, C.; Dinu, D.; Costache, M.; Dinischiotu, A. Antioxidative response induced by SiO2 nanoparticles in MRC5 cell line. Rom. Biotechnol. Lett. 2010, 15, 5000–5007. [Google Scholar]
- Das, K.; Gupta, A.; Dhundasi, S.; Patil, A.; Das, S.; Ambekar, J. Effect of L-Ascorbic Acid on Nickel-Induced Alterations in Serum Lipid Profiles and Liver Histopathology in Rats. J. Basic Clin. Physiol. Pharmacol. 2001, 17, 29–44. [Google Scholar] [CrossRef]
- Li, A.; Han, L.; Han, C.C. Antioxidant and neuroprotective activities of essential oil, isolated from Chinese herb pairs of Angelica sinensis and Sophora flavescens. J. Appl. Pharm. Sci. 2012, 2, 01–04. [Google Scholar] [CrossRef]
- Niska, K.; Santos-Martinez, M.J.; Radomski, M.W.; Inkielewicz-Stepniak, I. Nanoparticles induce apoptosis by impairing the antioxidant defense and detoxification systems in the mouse hippocampal HT22 cell line: Protective effect of crocetin. Toxicol. In Vitro 2015, 29, 663–671. [Google Scholar] [CrossRef] [PubMed]
- Salmalia, R.Z.; Gayatri, S.W.; Zulfahmidah, Z.; Syamsu, R.F.; Rasfayanah, R. The Effects of Olive Oil (Olea europaea L.) on Cathallase Enzyme Levels in White Rats (Rattus norvegicus) Wistar Strain of Obese Male. Formosa J. Sci. Technol. 2024, 3, 1849–1858. [Google Scholar] [CrossRef]
- Lister, G.; Adinda, A.; Djohan, D.; Yuliansyah, J. The Effect of Extra Virgin Olive Oil on Reducing Malondialdehyde Levels and Liver Histopathology in Male Rattus Norvegicus with Hypercholesterolemia. Poltekita J. Ilmu Kesehat. 2024, 17, 1672–1682. [Google Scholar] [CrossRef]
- Bouarroudj, K.; Tamendjari, A.; Larbat, R. Quality, composition and antioxidant activity of Algerian wild olive (Olea europaea L. subsp. Oleaster) oil. Ind. Crops Prod. 2016, 83, 484–491. [Google Scholar] [CrossRef]
- Wahnou, H.; Liagre, B.; Sol, V.; El Attar, H.; Attar, R.; Oudghiri, M.; Duval, R.E.; Limami, Y. Polyphenol-Based Nanoparticles: A Promising Frontier for Enhanced Colorectal Cancer Treatment. Cancers 2023, 15, 3826. [Google Scholar] [CrossRef]

Disclaimer/Publisher’s Note: The statements, opinions and data contained in all publications are solely those of the individual author(s) and contributor(s) and not of MDPI and/or the editor(s). MDPI and/or the editor(s) disclaim responsibility for any injury to people or property resulting from any ideas, methods, instructions or products referred to in the content. |
© 2024 by the authors. Licensee MDPI, Basel, Switzerland. This article is an open access article distributed under the terms and conditions of the Creative Commons Attribution (CC BY) license (https://creativecommons.org/licenses/by/4.0/).