Article

An Analysis Comparing the Taguchi Method for Optimizing the Process Parameters of AA5083/Silicon Carbide and AA5083/Coal Composites That Are Fabricated via Friction Stir Processing

by
Oritonda Muribwathoho
1,*,
Velaphi Msomi
2 and
Sipokazi Mabuwa
3
1
Department of Mechanical and Mechatronics Engineering, Cape Peninsula University of Technology, Cape Town 7535, South Africa
2
Department of Mechanical Engineering, College of Science, University of South Africa, Roodepoort 1709, South Africa
3
Mechanical Engineering Department, Durban University of Technology, P.O. Box 1334, Durban 4000, South Africa
*
Author to whom correspondence should be addressed.
Appl. Sci. 2024, 14(20), 9616; https://doi.org/10.3390/app14209616
Submission received: 15 September 2024 / Revised: 11 October 2024 / Accepted: 17 October 2024 / Published: 21 October 2024

Abstract

:
Aluminium metal matrix composites are widely used in automotive, aerospace, marine, and structural engineering due to their high strength-to-weight ratio and superior mechanical properties. Optimizing friction stir process parameters is critical to enhancing the performance of these materials. This study investigates the effects of FSP parameters such as rotational speed, tilt angle, and traverse speed, on the mechanical properties of AA5083/Silicon carbide and AA5083/Coal composites. Using a Taguchi L9 design of experiments, signal-to-noise ratio, and analysis of variance, this study identifies the optimal process settings for maximizing ultimate tensile strength, microhardness, and elongation. From the results, the study revealed that for AA5083/Silicon carbide composites, rotational speed was the most significant factor affecting tensile strength, while for AA5083/Coal composites, tilt angle played a more critical role. Rotational speed consistently influenced microhardness and elongation for both materials. The signal-to-noise ratio analysis indicates that optimal FSP parameters vary depending on the reinforcement material used. This study highlights the importance of tailoring FSP settings to specific reinforcements to achieve optimal mechanical properties. These findings contribute to the advancement of friction stir processing techniques for fabricating high-performance aluminium metal matrix composites, particularly for applications in industries requiring strong, lightweight, and corrosion-resistant materials.

1. Introduction

One of the most important areas of interest in materials science and engineering has been the development of new generation materials with unique and tailored properties. Metal matrix composites (MMCs) represent the most innovative avenue of research in the field of materials engineering, with the potential to significantly improve aluminium alloy mechanical properties by the incorporation of high-modulus, high-strength ceramic particles into aluminium matrices [1,2]. When compared to traditional structural materials, aluminium-based MMCs have higher specific strength and stiffness, which makes them perfect for several uses in the automotive, aerospace, marine, and recreational sectors [3,4]. Exceptional properties that set them apart from traditional materials include high elastic modulus, outstanding resistance to corrosion, increased fatigue strength, better low coefficient of thermal expansion, and resistance to wear [5,6]. AA5083-based composites are ideal for applications demanding lightweight, high-strength materials with excellent formability and corrosion resistance. These properties make them suitable for a diverse range of industries, including construction, marine, automotive, and aerospace [7,8].
To fabricate composites and enhance mechanical properties, friction stir processing (FSP), a novel solid-state method, uses the principles of friction stir welding (FSW) by utilizing a rotating tool to modify surface properties and enhance mechanical performance without melting the base material [9,10]. FSP causes microstructural change, densification, and homogeneity all at the same time by subjecting the material in the stir zone/nugget zone to plastic deformation, mixing, and heat exposure [11]. FSP also encourages shearing and even dispersion of particles inside the matrix [12]. Thus far, metal matrix composites have been successfully fabricated using FSP.
Specific parameter combinations are used in FSP techniques, and each one affects how the processed surface behaves. Depending on the materials used, the desired composite properties, and the equipment available, different process parameters, such as tool geometry, tool rotation speed, traverse speed, preheating temperature, and applied pressure, will apply. Out of all the process parameters that impact FSP, it has been noted that the tool rotation speed and traverse speed [13] have an impact on the even distribution of the reinforcing particles, grain refinery, and heat production during the composites’ fabrication, while the tool tilt angle has a major impact on the dispersion of reinforcing particles.
In the stir zone, parameters such tool travel speed, plunge depth, tool rotation rate, and tool angle determine temperatures and microstructure properties [14]. Material flow and temperature distribution behaviour are greatly influenced by tool geometry and welding parameters, which can alter microstructure [15]. Grain size can be refined with lower heat input, but plasticization or softening of the material requires higher heat input. High traverse speeds and low rotating speeds can result in smaller grain sizes, but vice versa because defects may increase [16]. Therefore, it is essential to maximize both traverse and rotational speeds in order to produce a stir zone with fewer defects and smaller grain size. A summary of some of the most important processing parameters is given below.
Rotation speed (rpm): Another significant element that controls the flow and dispersion of the workpiece material is the rotational speed. As the rotation speed of the tool increases, a higher dissolution of soluble particles is likely to occur while the insoluble particles are likely to fragment further [17]. Increasing the speed at which the tool rotates can improve the size of the grain and increase the stir zone’s temperature considerably. It is important to note that the microstructural evolution of the material can be affected by the direction in which the tool rotates [18].
Traverse speed (mm/min): Traverse speed is responsible for moving the material from the front end of the workpiece to the end. The grain size in the FSPed zone of the material being processed may increase when the tool traverse speed is decreased. As a result, it barely affects how much the tool wears. Research also indicates that increasing the traversal speed can enhance the surface composite microhardness of the FSPed zone by increasing the dispersion of the reinforcement particles [19].
Tilt angle (deg): The tilt angle of the FSP tool ensures that the substance that has been stirred stays in the tool shoulder and is propelled to the back of the tool shoulder. The processing temperature may rise when the tool tilt angle is increased [20]. Higher tilt angles can result in larger grain and particle sizes, while lower tilt angles may cause defects in the processed zone [21].
Optimizing AMMCs’ microstructure and properties to meet the demanding needs of many sectors is crucial to achieving all their full potential. Approaches to optimization issues range from traditional to unconventional [22]. Conventional optimization techniques can be widely divided into two categories: mathematical search techniques (e.g., linear programming, nonlinear programming, dynamic programming) and experimental techniques such as statistical design of experiments (e.g., response surface design approach, or Taguchi method). Non-conventional metaheuristic search methods, like genetic algorithms, tabu search, and simulated annealing, have become more and more popular among scholars in recent years. While alternative optimization methods like mathematical search techniques, RSM, and metaheuristic methods offer their own advantages, they also have limitations that can hinder their practical application in optimizing processes like FSP. The Taguchi method’s efficiency, robustness, and simplicity make it a particularly attractive choice in such scenarios.
The Taguchi method is a robust engineering approach, pioneered by Genichi Taguchi, which aims to enhance product and process quality through structured experimentation. By employing experimental design called orthogonal array design, signal-to-noise ratio, and analysis of variance, this method optimizes factor settings and minimizes variability, resulting in improved product performance and manufacturing efficiency [23,24]. Researchers have used the different design of experiments and FSP in order to determine optimum process parameters for aluminium metal matrix composites utilizing different grades and reinforcements [25,26,27,28,29,30,31,32,33,34,35].
The novelty of this research lies in its comprehensive comparison of AA5083/Silicon carbide and AA5083/Coal composites using identical FSP parameters. Previous studies have often focused on individual reinforcements, but this research addresses a gap by examining multiple reinforcements under identical conditions. Employing a Taguchi L9 design to optimize process parameters for both composites, the study focuses on ultimate tensile strength, microhardness, and percentage elongation. The results will contribute to a deeper understanding of how different reinforcements respond to FSP, guiding the development of more cost-effective and high-performance aluminium metal matrix composites. By acknowledging and addressing the limitations of prior studies, this research offers a more comprehensive and rigorous analysis, making it a valuable contribution to the field of FSP and composite materials fabrication.

2. Material and Methods

2.1. Material and Composite Fabrication

Reinforcement and a base material are needed to create AMMCs. A 6 mm thick AA5083 aluminium alloy plate was chosen for its excellent mechanical properties and corrosion resistance. The dimensions of the AA5083 plates were 250 mm long and 55 mm wide. Table 1 presents the mechanical properties of the alloy. The alloy’s composition is primarily magnesium (4.03%), zinc (0.01%), titanium (0.02%), chromium (0.05%), silicon (0.15%), manganese (0.69%), iron (0.16%), and copper (0.02%), as presented in Table 2. The composite materials were fabricated using silicon carbide (SiC) and coal as reinforcements, with 5% volume percentages. AMMCs composites were made using silicon carbide and coal as reinforcements, separately.

2.2. Experimental Design Using Taguchi Method

The software utilized for constructing the design matrix and analyzing the results was MINITAB 18. The three parameters (rotational speed, traverse speed, and tilt angle) taken into account for this study are included in Table 3 together with the relevant levels for each. The selected parameters were chosen based on their established influence on the microstructure and mechanical properties of composites during FSP [13]. Among FSP parameters, tool rotation speed and traverse speed significantly impact the even distribution of reinforcing particles, grain refinement, and heat generation during composite fabrication. Conversely, tool tilt angle primarily influences the dispersion of reinforcing particles. The parameter levels were determined by considering existing literature and conducting preliminary experiments to establish ranges that effectively balance processing time and mechanical performance [37,38,39,40].
From the software, a Taguchi L9 factorial design was employed to reduce the number of experimental runs. Using a complete factorial experiment design would have needed 27 experiments; however, the Taguchi approach avoided 18 FSP runs. As a result, expenses and time were greatly reduced. The design matrix, shown in Table 4, includes three processing parameters at three distinct levels, resulting in a total of nine experiments for each composite type.

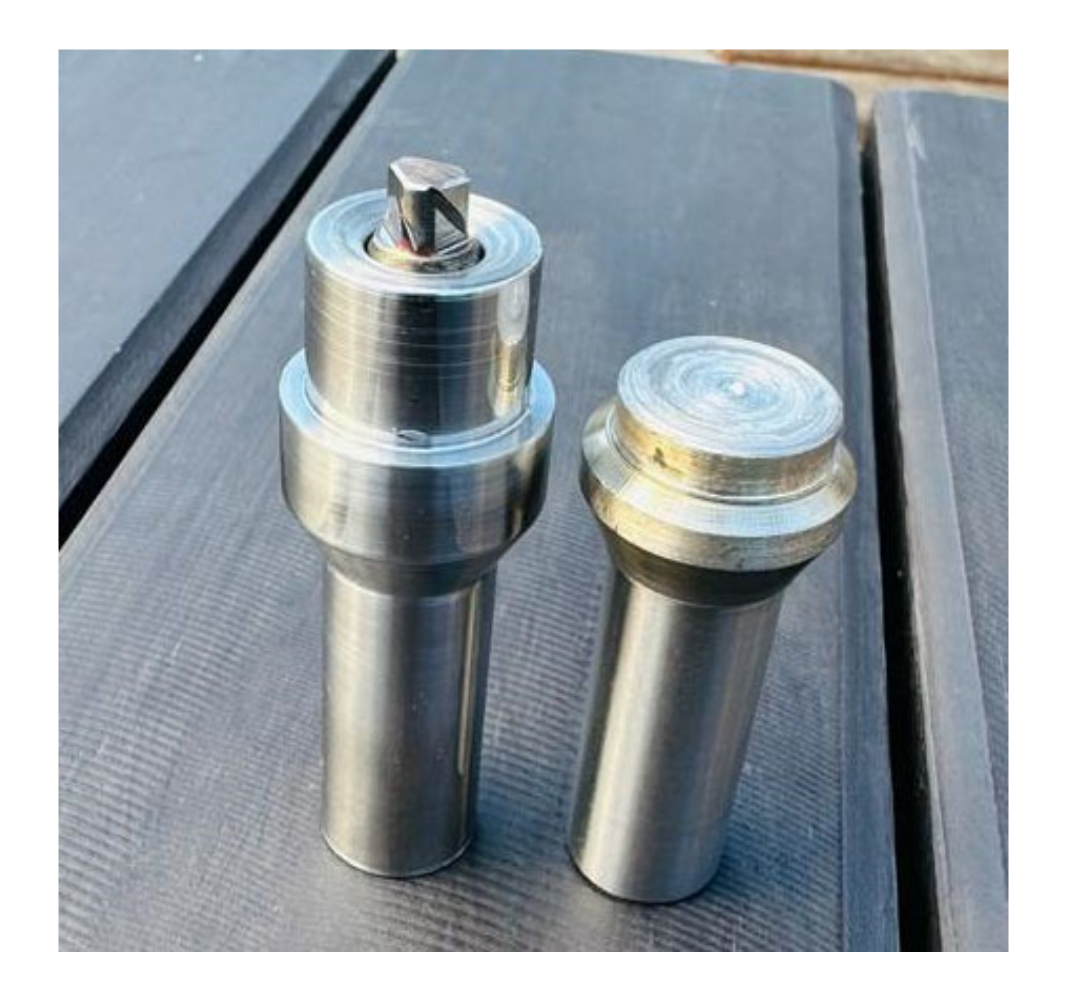
2.3. Composite Fabrication Process

In the composite fabrication process, two AA5083 plates were initially joined using Friction Stir Welding (FSW), as illustrated in Figure 1a. Following this, the weld joint was drilled repeatedly to create small holes measuring 2.5 mm in diameter and 4 mm deep, with a spacing of 15 mm between the holes, as shown in Figure 1b; reinforcing particles were then introduced into these holes. To prevent the scattering of particles during subsequent Friction Stir Processing (FSP), the holes were sealed using a pin-less FSP tool, with this step depicted in Figure 1c. The final pass of FSP was carried out at room temperature, and the process is illustrated in Figure 1d. Figure 2 shows the tools, both with pin and pin-less configurations, utilized in the fabrication of the composite materials. A high-speed steel tool (AISI 4140) with a shoulder diameter of 20 mm, a triangular pin measuring 5.8 mm, and a probe diameter of 7 mm was employed for both the FSW and FSP procedures.

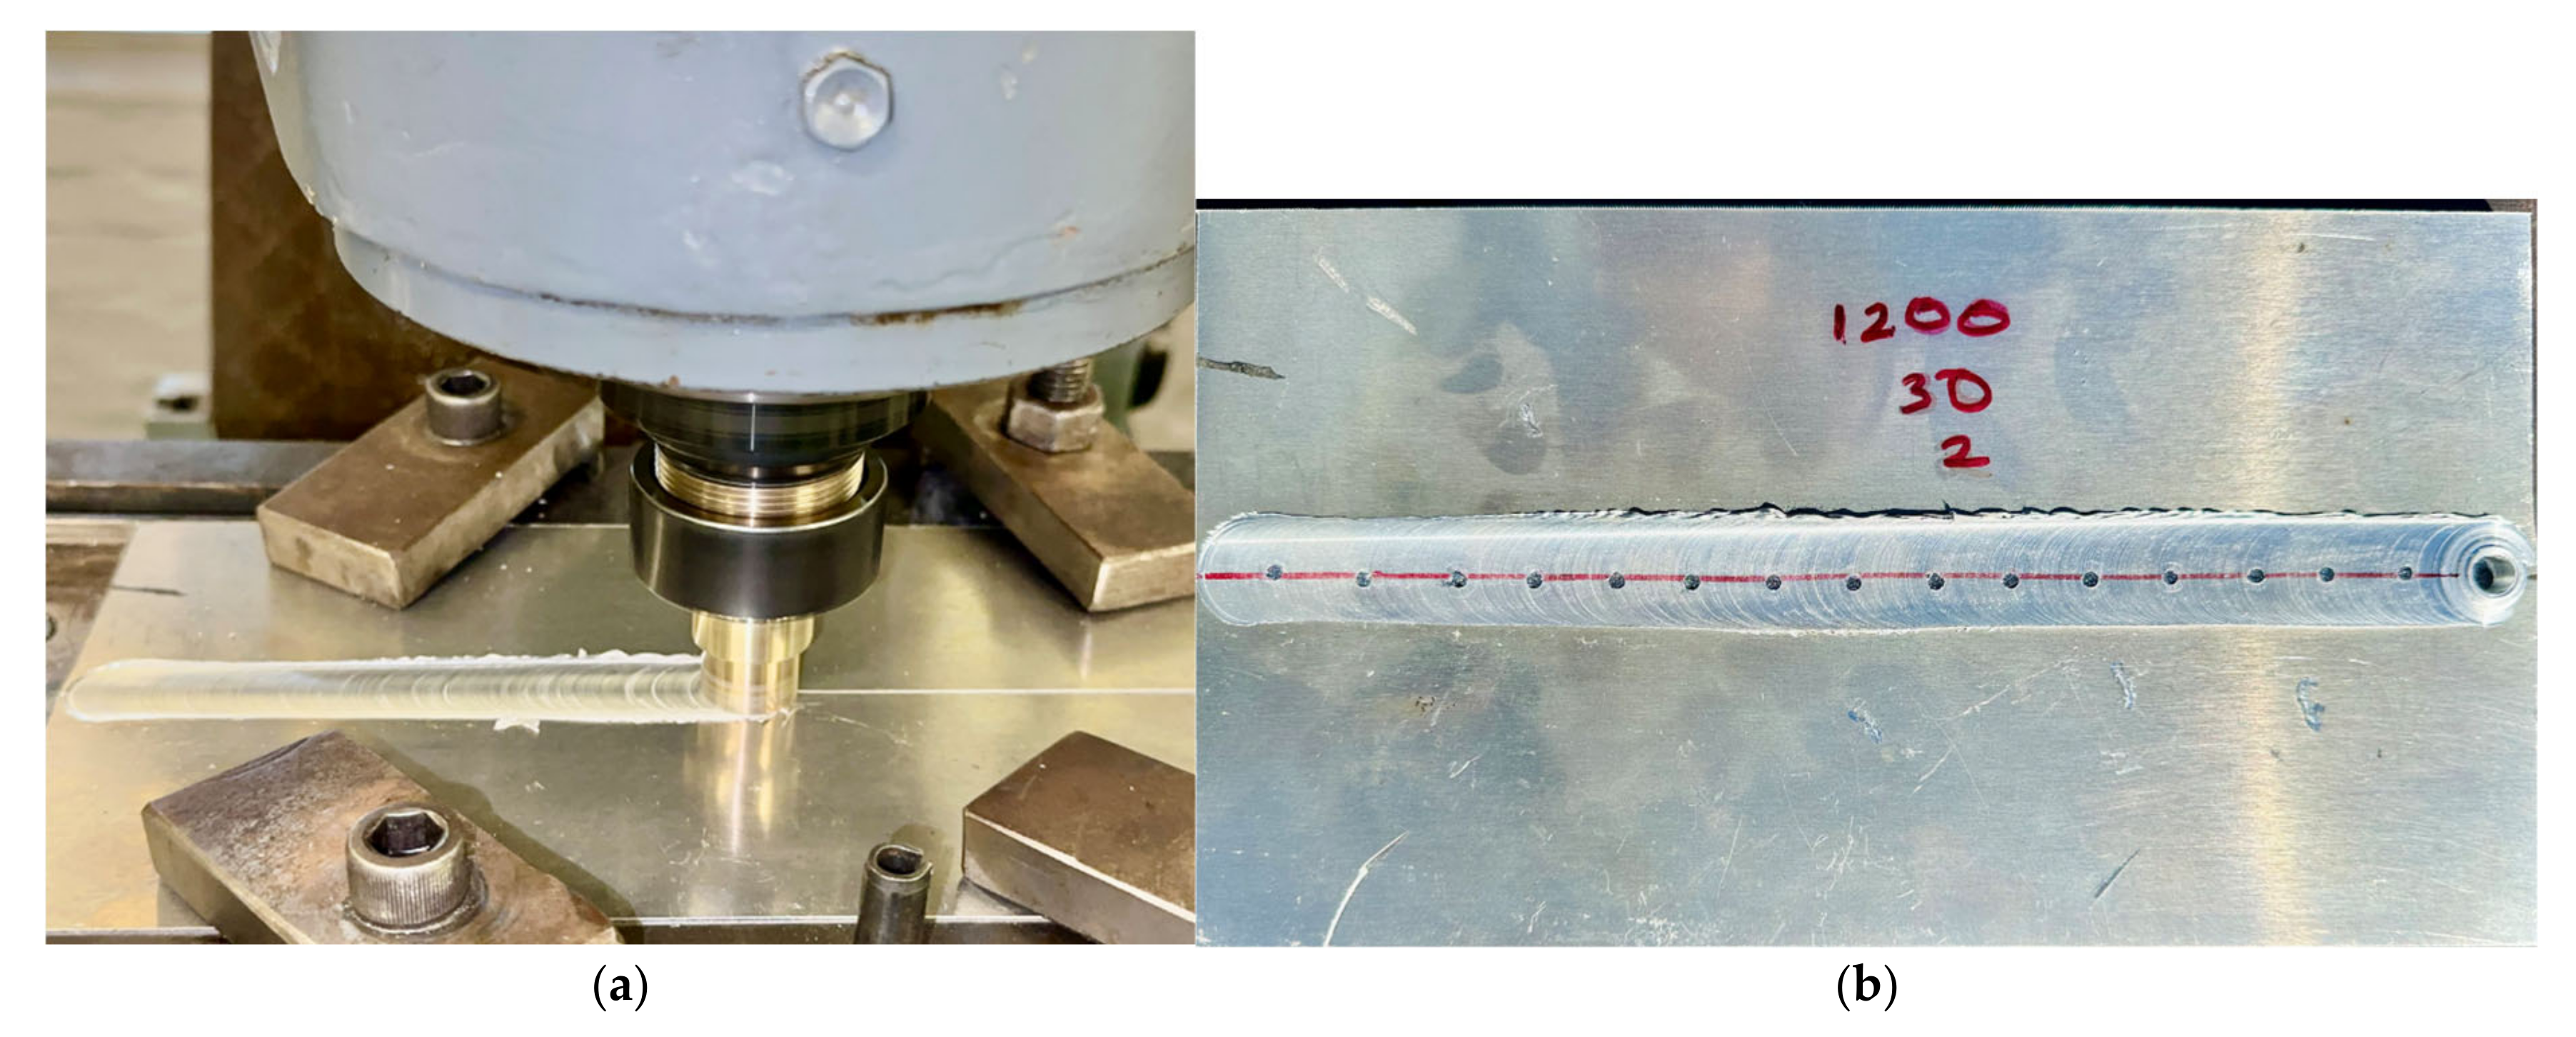
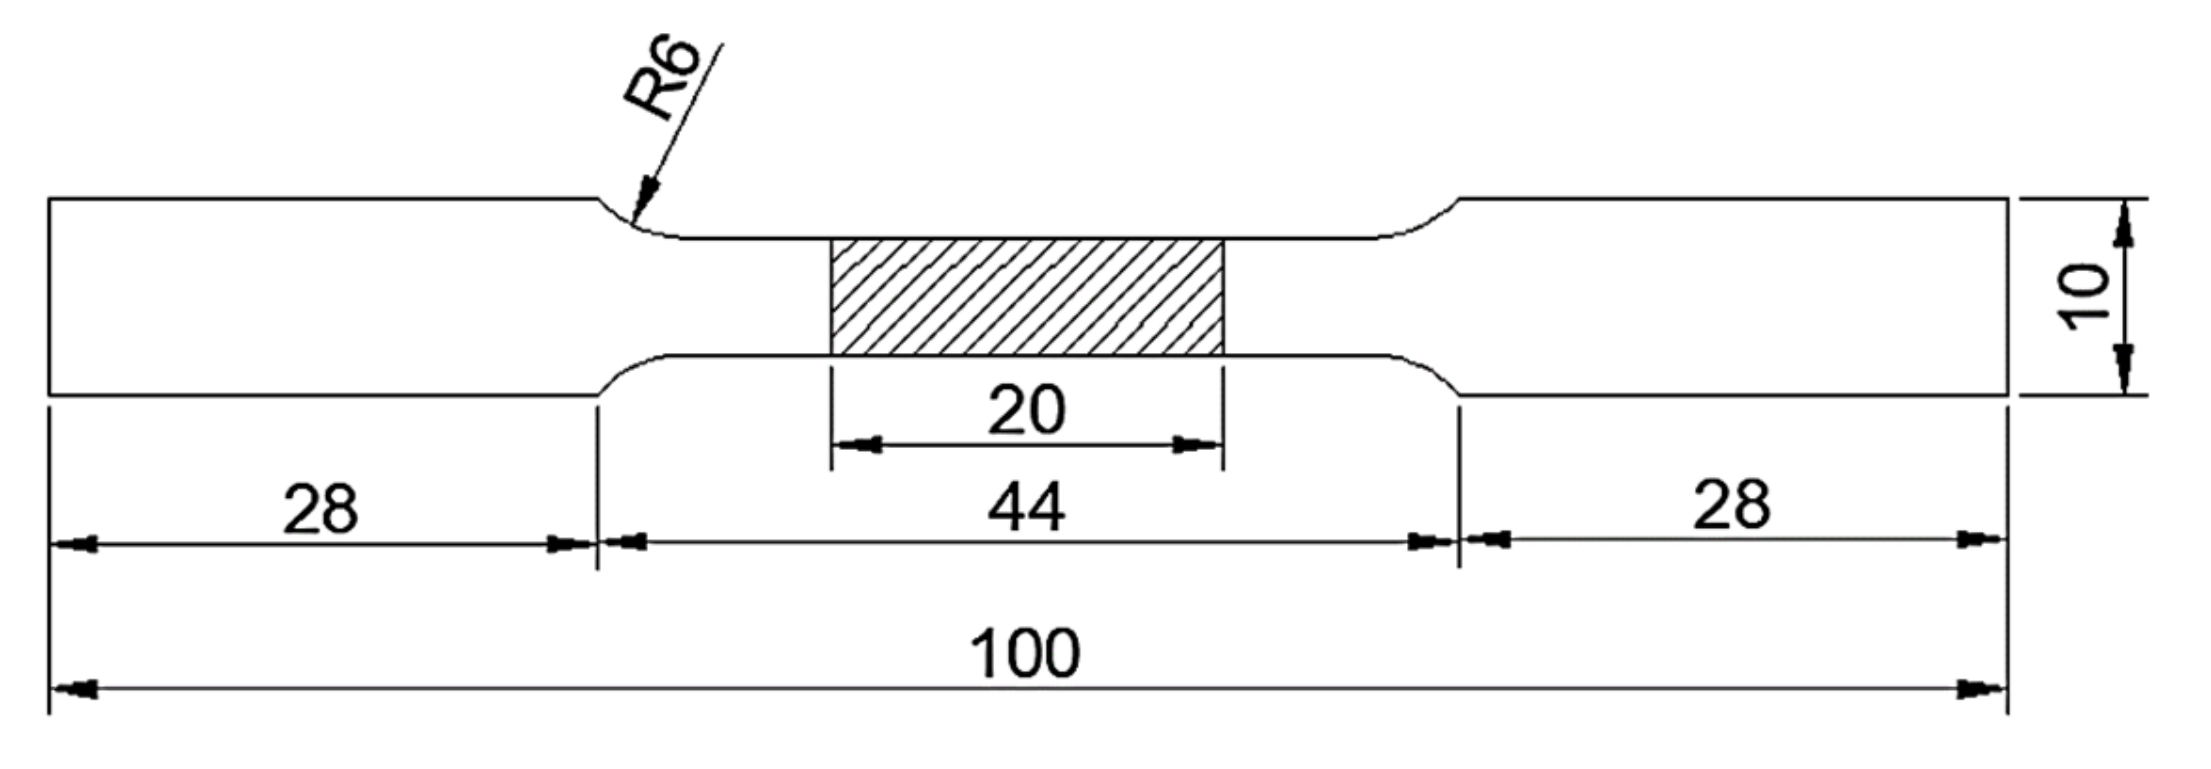
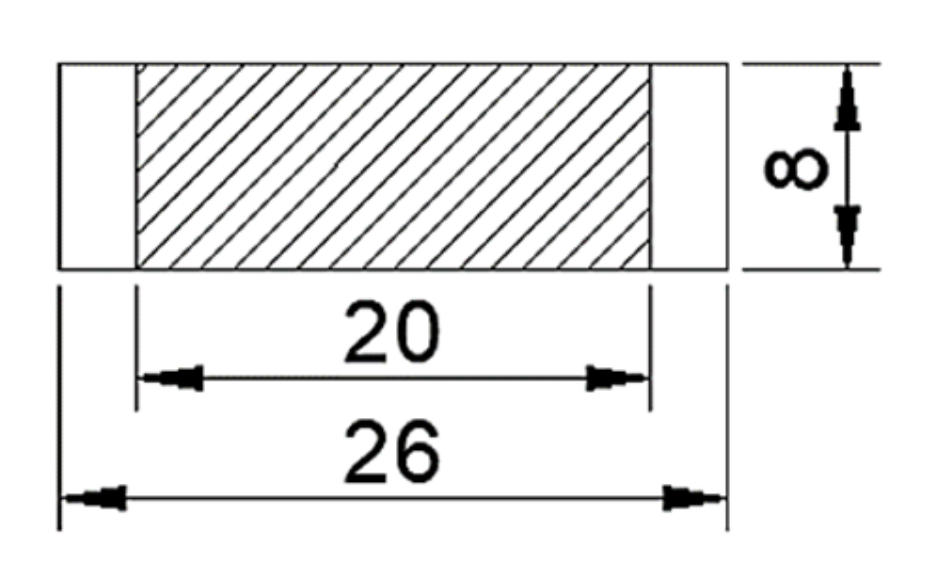
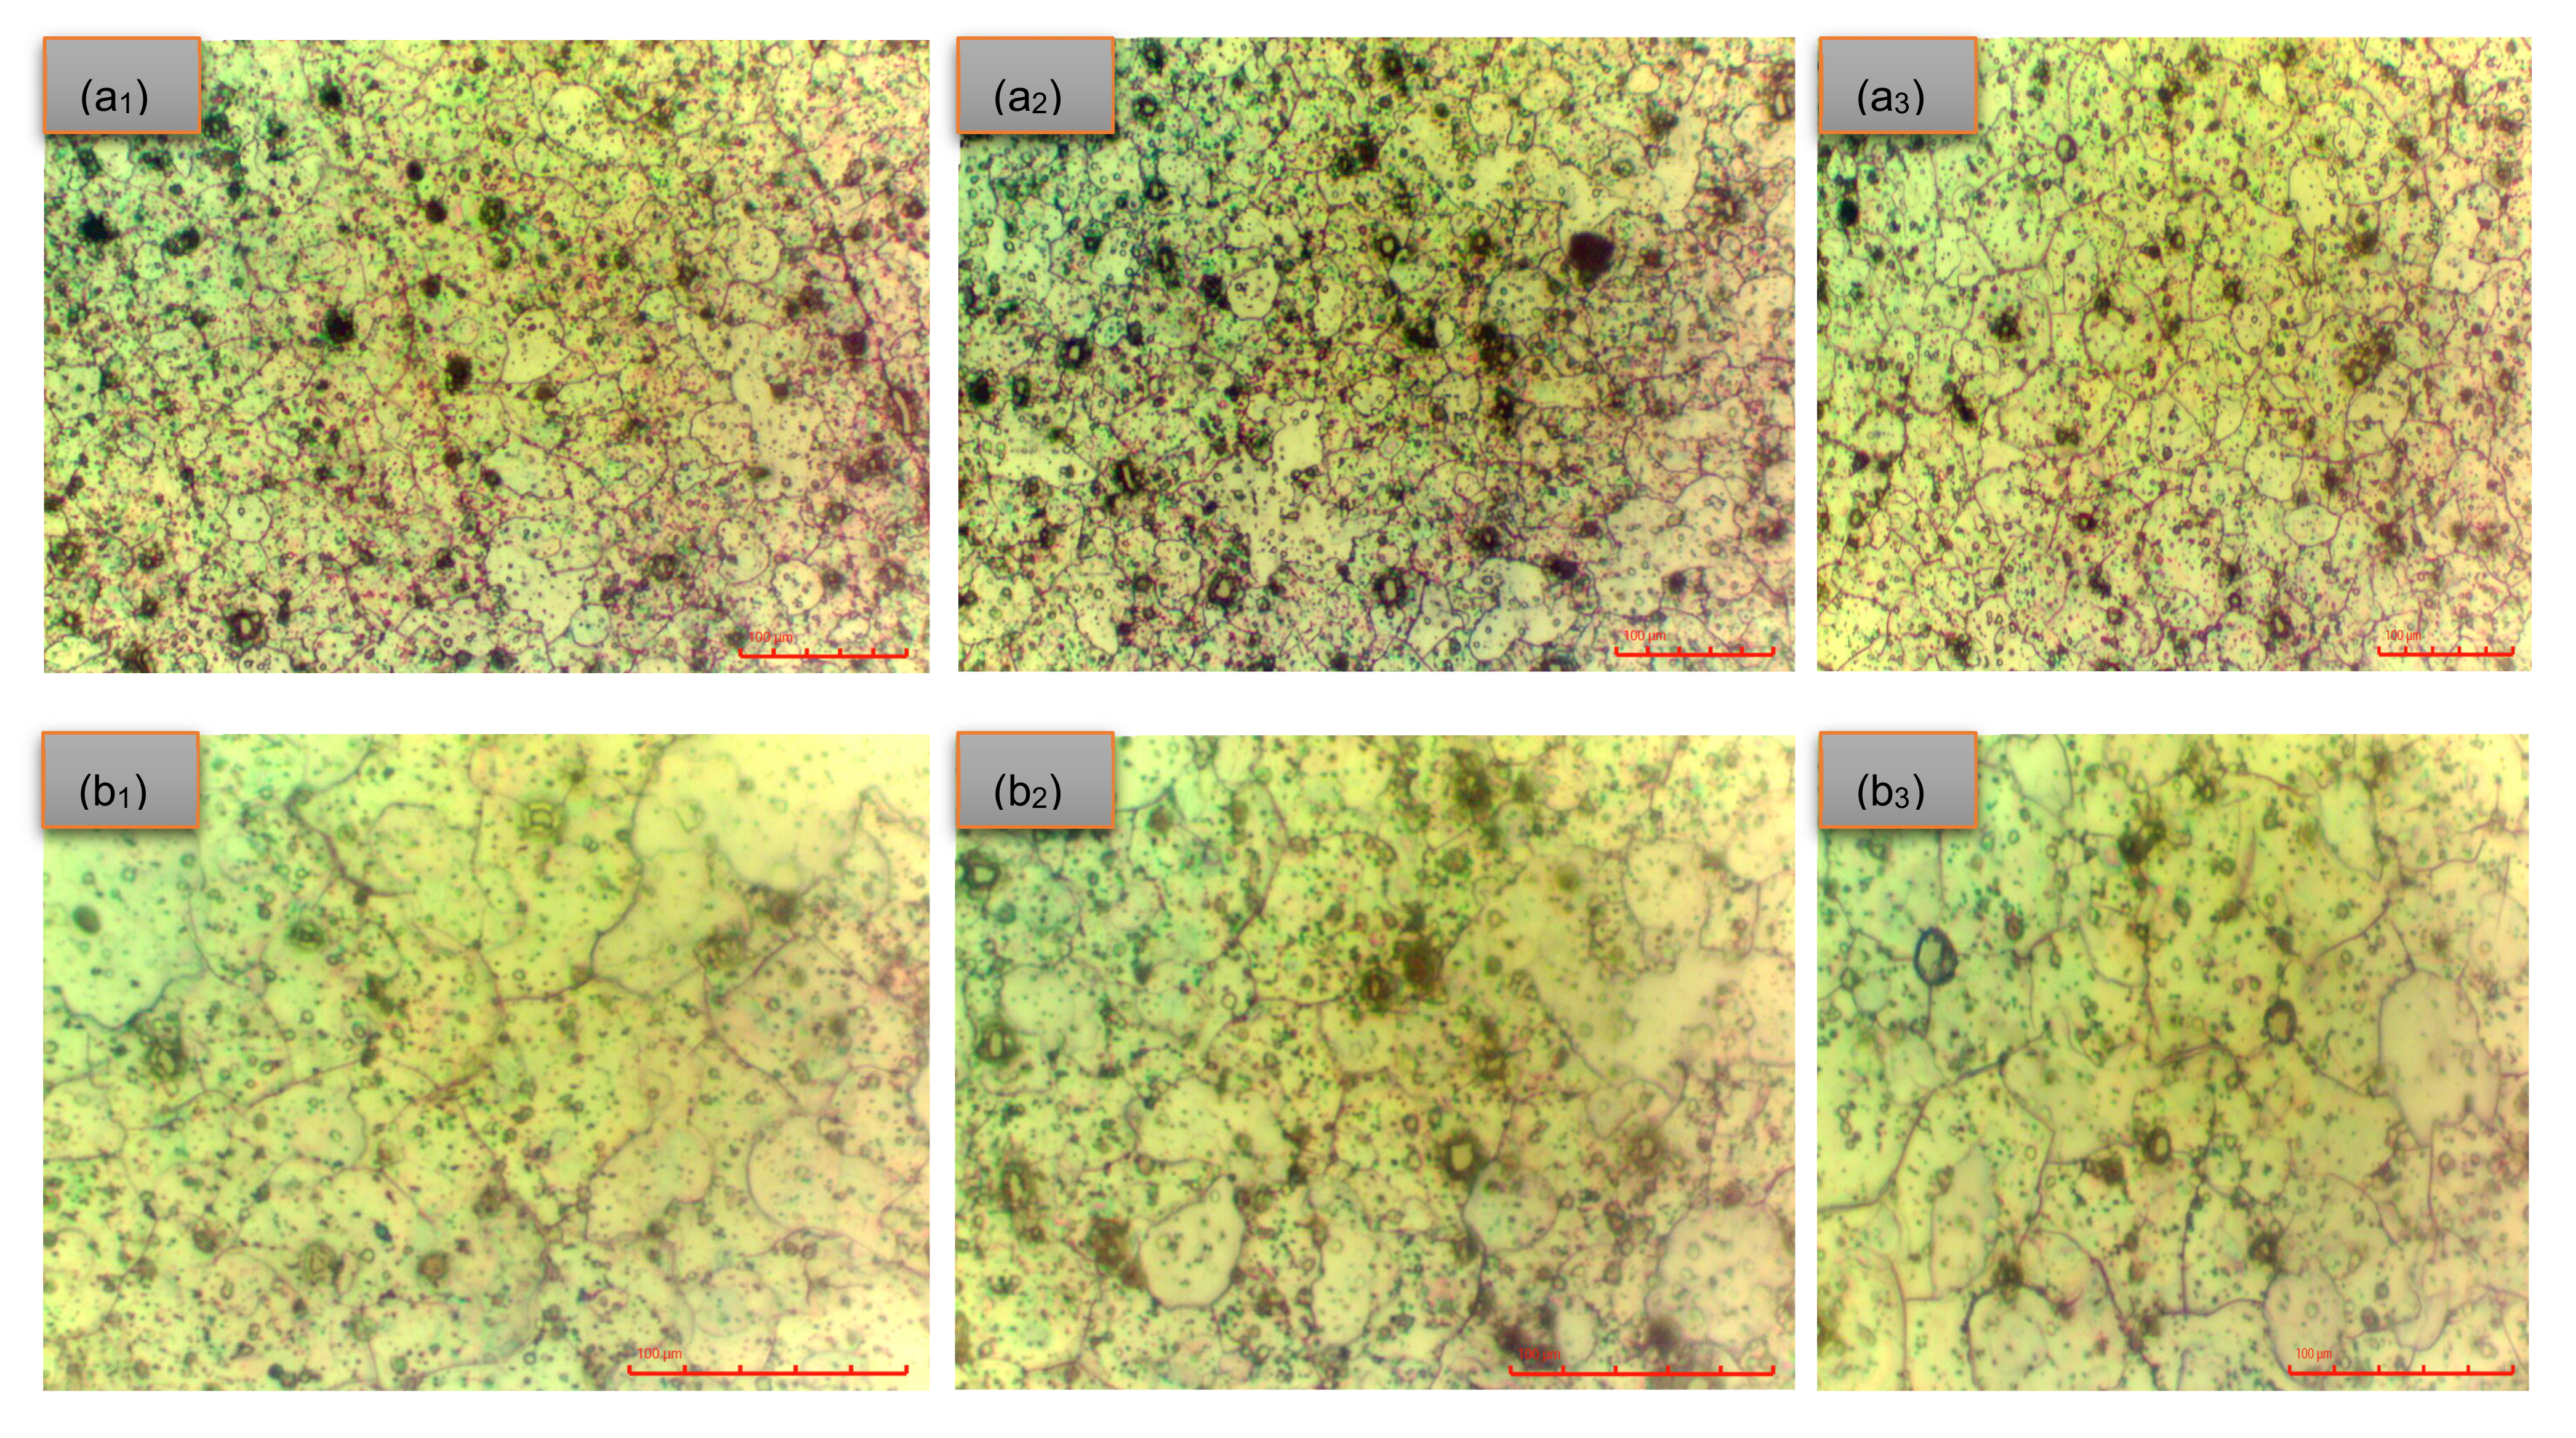
2.4. Output Results Preparation

Waterjet technology was used to cut the produced AMMCs joints (AA5083/Coal and AA5083/Silicon carbide) perpendicular to the processing direction in order to get specimens for the hardness and tensile testing. Tensile specimens were cut for tensile strength testing and generated in compliance with ASTM E8M-04 standards [41], while hardness specimens were cut for Vickers microhardness testing in line with ASTM E384 standards [42]. Figure 3 and Figure 4 show the cut tensile and hardness specimens.

3. Results and Discussions

Table 5 shows a summary of mechanical properties for different parameters for the AA5083/Silicon carbide and AA5083/Coal composites, respectively. From the results, the AA5083/Silicon Carbide and AA5083/Coal composites generally exhibit comparable mechanical properties to the base AA5083 material in terms of ultimate tensile strength and hardness. In terms of the UTS, while slightly lower than the base material, both composites maintain respectable UTS values. In terms of ductility, reinforcement particles hinder plastic deformation, leading to a significant decrease in ductility compared to the base material. And finally, for the hardness the addition of reinforcements increases the hardness of both composite types.
The highest hardness of both composite types is generally higher than the base material. This is due to the presence of hard reinforcement particles, which strengthen the matrix and increase its resistance to indentation. It is important to note that specific mechanical properties will depend on various factors, such as the volume fraction of reinforcements, the size and distribution of reinforcement particles, and the processing parameters used.
It should be noted that, since two different reinforcements (silicon carbide and coal) were used to optimize the AMMC fabrication parameters, the data analysis for the fabricated AA5083/Silicon carbide composite will be provided first, and then the analysis for the created AA5083/Coal composite will be shown in the next section.

3.1. Signal-to-Noise Ratio Analysis

The ultimate tensile strength, percentage elongation, and microhardness of the fabricated AA5083/Silicon carbide and AA5083/Coal composite joints were assessed using the Taguchi methods to find their optimal parameters. Taguchi’s approach, a single-response optimization strategy, uses the signal-to-noise ratio to evaluate each parameter’s effect on response factors. To optimize the response, the S/N ratio in this investigation was determined using the ‘larger-the-better’ criteria. The impact of each control factor on the response, the means, and S/N ratios were computed. The following formula can be used to compute the “larger-the-better” criteria [43]:
S N = 10 log 1 n i 1 3 1 y 2
where n is the number of experimental repeats and y is the response factor. The desirable output value is represented by ‘Signal (S)’, while the undesired value is represented by ‘Noise (N)’.
The S/N ratio for parameter combinations of the AA5083/Silicon carbide composite is shown in Table 6, while the S/N ratio for parameter combinations of the AA5083/Coal composite is shown in Table 7.

3.2. Analysis of Variance

3.2.1. Analysis of Variance Experimental Data for AA5083/Silicon Carbide Composite

  • Ranking of Contributing Factors
Analysing the factors that influence each response factor of the fabricated composite joints is essential. Utilizing the delta ranking approach, MINITAB software Version 18 displays the most significant factors influencing the response factor of the fabricated AA5083/Silicon carbide composite joint. Table 8, Table 9 and Table 10 show that the fabricated AA5083/Silicon carbide composite joint’s ultimate tensile strength, percentage elongation, and microhardness are significantly impacted by rotational speed (rank 1), traverse speed (rank 2), and tilt angle (rank 3). Based on the results, it can be observed that parameters for maximizing ultimate tensile strength and percentage elongation in AA5083/Silicon carbide composite joints are traversal speed at level 1, rotational speed at level 2, and tilt angle at level 3, as seen in Table 8 and Table 9. The best parameters for optimum microhardness are traversal speed at level 2, and rotational speed at level 2, and tilt angle at level 3 (See Table 10).
2.
Percentage of Contribution Factors
Analysing the percentage contributions and F-values of the factors is crucial to gaining a clearer understanding of individual parameters on the output responses. The percentage contributions by S/N ratio analysis of variance for microhardness, elongation percentage, and ultimate tensile strength are displayed in Table 11, Table 12 and Table 13. Based on the results, the most significant factor influencing ultimate tensile strength was determined to be rotational speed, which accounted for 57.55% of the output response. Though less significant, tilt angle nonetheless made 12.58% of the total contribution (see Table 11). Discrepancies were seen between the percentage contribution in Table 11 and rankings in Table 8. A more comprehensive statistical analysis, including confidence intervals and replicate experiments, could enhance the reliability and interpretability of the findings. Therefore, carefully considering research objectives and data characteristics is crucial when selecting between these methods to ensure accurate and reliable results. It was discovered that rotational speed and traverse speed, with percentage contributions of 60.36% and 16.62%, respectively, were significant parameters for percentage elongation (see Table 12). These results are consistent with the ranks that were shown in Table 9. Research by Salehi et al. [13], Chanakyan et al. [26], Syed et al. [35], and Puviyarasan et al. [44] also showed a similar pattern, identifying tool rotational speed as the main factor influencing ultimate tensile strength. Furthermore, it was shown that rotational speed and traverse speed were important factors in microhardness with percentage contributions of 48.17% and 27.40%, respectively (see Table 13). These results are consistent with the ranks that were shown in Table 10. Research by Chanakyan et al. [26], Syed et al. [35], and Butola et al. [45] also showed a similar pattern, identifying tool rotational speed as the main factor influencing microhardness. For percentage elongation and microhardness, the percentage contributions and F-values match the ranks as well.

3.2.2. Analysis of Variance Experimental Data for AA5083/Coal Composite

  • Ranking of Contributing Factors
An analysis of the factors affecting each response element of the fabricated AA5083/Coal composite joint was also carried out. The results shows that the resulting tensile strength of the fabricated AA5083/Coal composite joint is influenced by the tilt angle (rank 1), traverse speed (rank 2), and rotation speed (rank 3), as seen in Table 14. The percentage elongation and microhardness of the fabricated AA5083/Coal composite joint are influenced by the rotation speed (rank 1), tilt angle (rank 2), and traverse speed (rank 3), as indicated by Table 15 and Table 16. Based on the results, it can be observed that parameters for maximizing ultimate tensile strength, percentage elongation, and tilt angle in AA5083/Coal composite joints are traversal speed at level 3, rotational speed at level 2, and tilt angle at level 3 as seen in Table 14, Table 15 and Table 16.
2.
Percentage of Contribution Factors
The percentage contributions by S/N ratio analysis of variance for microhardness, elongation percentage, and ultimate tensile strength are displayed in Table 17, Table 18 and Table 19. Based on the results, the most significant factors influencing ultimate tensile strength are tilt angle and traverse speed, which accounted for 27.0% and 19.3% respectively, of the output response (see Table 17). These results are consistent with the ranks that were shown in Table 14. It was discovered that rotational speed and tilt angle, with percentage contributions of 34.4% and 30.0%, respectively, were significant parameters for percentage elongation (see Table 18). These results are consistent with the ranks that were shown in Table 15. The most significant factor influencing microhardness was determined to be rotational speed, which accounted for 44.89% of the output response. Though less significant, tilt angle nonetheless made 9.131% of the total (see Table 19). These results are consistent with the ranks that were shown in Table 16. Research by Chanakyan et al. [26], Syed et al. [35], and Butola et al. [45] also showed a similar pattern, identifying tool rotational speed as the main factor influencing microhardness. The percentage contributions for ultimate tensile strength, percentage elongation, and microhardness match the rankings and the F-values.
The optimized parameter micrographs for the AA5083/SiC and AA5083/Coal composite joints, captured at 50× and 100× magnifications, are presented in Figure 5a and Figure 5b, respectively. Figure 5(a1,b1) correspond to the optimal parameters of 900 rpm, 30 mm/min, and a 2° tilt angle for AA5083/SiC. Figure 5(a2,b2) depicts 900 rpm, 45 mm/min, and a 2° tilt angle for AA5083/SiC. Figure 5(a3,b3) shows 900 rpm, 60 mm/min, and a 2° tilt angle for AA5083/Coal. The microstructural images reveal the distribution of the reinforcement particles (SiC or Coal) within the AA5083 matrix, showing how different FSP parameters influence particle dispersion and bonding in the composites. These details explain the variations in mechanical properties based on the reinforcement material and processing conditions. The microstructural results show incomplete bonding between the reinforcement particles and the matrix, which can impact mechanical properties such as hardness, tensile strength, and ductility. As a result, it can be concluded that when it comes to the microstructure, proper bonding and uniform particle dispersion result in better mechanical performance, while incomplete bonding or uneven distribution can lead to reduced strength and ductility.

4. Conclusions

To improve FSP parameters for AMMC joint fabrication, a Taguchi L9 factorial design was employed. The process of optimizing the parameters involved fabricating AMMCs with two distinct reinforcements, namely silicon and coal. The fabricated composites were AA5083/Silicon carbide composite and AA5083/Coal composite. Mechanical properties such as hardness, tensile strength, and percent elongation were evaluated after the composites were fabricated.
The Taguchi approach based on the S/N ratio demonstrated that:
  • The highest UTS and the percentage elongation for the AA5083/Silicon carbide composites fabrication process can be achieved if the rotation speed has been set to level 2 on the control panel, the traverse speed at level 1, and the tilt angle was at level 3. The best parameters for optimum microhardness are tilt angle at level 3, traversal speed at level 2, and rotational speed at level 2.
  • At the second level of rotational speed, the third level of traversal speed, and the third level of tilt angle, for the the AA5083/Coal composite joints had the best FSP parameters to enhance the ultimate tensile strength, percentage elongation, and micro hardness.
The Taguchi approach based on the ANOVA demonstrated that:
  • According to an ANOVA study, rotating speed has a larger impact on percentage elongation and microhardness for AA5083/Silicon carbide and AA5083/Coal composite joints. The ultimate tensile strength of AA5083/Silicon carbide is more affected by rotating speed, whereas the ultimate tensile strength of AA5083/Coal is more affected by tilt angle. The results indicate that the two different reinforcements have varying effects on the process parameters, suggesting that customized optimization strategies may be required based on the type of reinforcement used. These differences in ranking order are significant because they highlight the distinct material behaviors of the reinforcements during FSP. Harder reinforcements like SiC rely more on heat generation and plastic deformation for effective distribution and bonding, which is why rotational speed is dominant. In contrast, softer reinforcements like coal benefit more from controlled material flow and uniform particle dispersion, making tilt angle a critical factor.
Based on the results the conclusion was drawn that:
  • The best processing parameters for fabricating AA5083/Coal composite were a tilt angle of 2 degrees, a traverse speed of 60 mm/min, and a rotation speed of 900 rpm.
  • The best processing parameters used when fabricating AA5083/Silicon carbide composite that yielded maximum microhardness were at a rotational speed of 900 rpm, traversal speed of 45 mm/min, and tilt angle of 2 degrees; the best combination of parameters to attain the maximum ultimate tensile strength and percentage elongation of the composite was achieved at a rotational speed of 900 rpm, traverse speed of 30 mm/min, and tilt angle of 2 degrees.

5. Limitation of Current Study

While this study offers valuable insights into FSP parameter optimization for AA5083-based composites, it has certain limitations. The focus on only two composite combinations may not fully capture the diverse range of materials that can be processed using FSP. The choice between S/N ratio and ANOVA can significantly influence the ranking order of factors, particularly in the presence of non-linear relationships and interaction effects. A more comprehensive statistical analysis, including confidence intervals and replicate experiments, could enhance the reliability and interpretability of the findings. Therefore, carefully considering the research objectives and data characteristics is crucial when selecting between these methods to ensure accurate and reliable results. These limitations highlight the need for further research to explore the broader applicability of the findings and address the challenges associated with FSP parameter optimization for AMCs.

6. Future Study

This study highlights the need for further research to delve deeper into the complexities of FSP in aluminium-based composites. Expanding the experimental design beyond the Taguchi L9 design and investigating additional factors such as tool geometry, process atmosphere, and thermal cycling could provide a more comprehensive understanding of the process. Moreover, conducting confirmation tests to validate the effectiveness of identified optimal parameter levels is essential. These research avenues hold the potential to significantly enhance the knowledge and application of FSP in this field.

Author Contributions

Conceptualization, V.M.; methodology, S.M.; software, O.M.; validation, O.M., V.M. and S.M.; formal analysis, S.M.; investigation, O.M.; resources, V.M.; data curation, S.M. and O.M.; writing—original draft, O.M.; writing—review and editing, S.M. and V.M.; visualization, O.M.; supervision, V.M. and S.M.; project administration, V.M. All authors have read and agreed to the published version of the manuscript.

Funding

This research received no external funding.

Institutional Review Board Statement

Not applicable.

Informed Consent Statement

Not applicable.

Data Availability Statement

The original contributions presented in the study are included in the article, further inquiries can be directed to the corresponding author.

Acknowledgments

The authors would also like to acknowledge the financial support provided by the CPUT through the Vice Chancellor’s Prestigious Bursary award.

Conflicts of Interest

The authors declare no conflict of interest.

Nomenclature

AAAluminium Alloy
AlAluminium
AISIAmerican Iron and Steel Institute.
AMMCsAluminium Metal Matrix Composite
ASTMAmerican Society for Testing and Materials
ANOVAAnalysis of Variance
FSWFriction Stir Welding
FSPFriction Stir Processing
S/N ratioSignal to Noise ratio

References

  1. Clyne, T.W.; Withers, P.J. An Introduction to Metal Matrix Composites; Cambridge University Press: Cambridge, UK, 1993. [Google Scholar]
  2. Rohatgi, P.K.; Asthana, R.; Das, S. Solidification, structures, and properties of cast metal-ceramic particle composites. Int. Met. Rev. 1986, 31, 115–139. [Google Scholar] [CrossRef]
  3. Zhang, W.W.; Hu, Y.; Wang, Z.; Yang, C.; Zhang, G.Q.; Prashanth, K.G.; Suryanarayana, C. A novel high-strength Al-based nanocomposite reinforced with Ti-based metallic glass nanoparticles produced by powder metallurgy. Mater. Sci. Eng. A 2018, 734, 34–41. [Google Scholar] [CrossRef]
  4. Jeyasimman, D.; Sivasankaran, S.; Sivaprasad, K.; Narayanasamy, R.; Kambali, R.S. An investigation of the synthesis, consolidation and mechanical behaviour of Al 6061 nanocomposites reinforced by TiC via mechanical alloying. Mater. Des. 2014, 57, 394–404. [Google Scholar] [CrossRef]
  5. Scudino, S.; Liu, G.; Prashanth, K.G.; Bartusch, B.; Surreddi, K.B.; Murty, B.S.; Eckert, J. Mechanical properties of Al-based metal matrix composites reinforced with Zr-based glassy particles produced by powder metallurgy. Acta Mater. 2009, 57, 2029–2039. [Google Scholar] [CrossRef]
  6. Kumar, K.R.; Kiran, K.; Sreebalaji, V.S. Micro structural characteristics and mechanical behaviour of aluminium matrix composites reinforced with titanium carbide. J. Alloys Compd. 2017, 723, 795–801. [Google Scholar] [CrossRef]
  7. Shanavas, S.; Edwin Raja Dhas, J.; Murugan, N. Weldability of marine grade AA 5052 aluminum alloy by underwater friction stir welding. Int. J. Adv. Manuf. Technol. 2018, 95, 4535–4546. [Google Scholar] [CrossRef]
  8. Abioye, T.E.; Mustar, N.; Zuhailawati, H.; Suhaina, I. Prediction of the tensile strength of aluminium alloy 5052-H32 fibre laser weldments using regression analysis. Int. J. Adv. Manuf. Technol. 2019, 102, 1951–1962. [Google Scholar] [CrossRef]
  9. Dolatkhah, A.; Golbabaei, P.; Givi, M.B.; Molaiekiya, F. Investigating effects of process parameters on microstructural and mechanical properties of Al5052/SiC metal matrix composite fabricated via friction stir processing. Mater. Des. 2012, 37, 458–464. [Google Scholar] [CrossRef]
  10. Saini, N.; Dwivedi, D.K.; Jain, P.K.; Singh, H. Surface modification of cast Al-17% Si alloys using friction stir processing. Procedia Eng. 2015, 100, 1522–1531. [Google Scholar] [CrossRef]
  11. Zykova, A.P.; Tarasov, S.Y.; Chumaevskiy, A.V.; Kolubaev, E.A. A review of friction stir processing of structural metallic materials: Process, properties, and methods. Metals 2020, 10, 772. [Google Scholar] [CrossRef]
  12. Gangil, N.; Siddiquee, A.N.; Maheshwari, S. Aluminium based in-situ composite fabrication through friction stir processing: A review. J. Alloys Compd. 2017, 715, 91–104. [Google Scholar] [CrossRef]
  13. Salehi, M.; Saadatmand, M.; Mohandesi, J.A. Optimization of process parameters for producing AA6061/SiC nanocomposites by friction stir processing. Trans. Nonferrous Met. Soc. China 2012, 22, 1055–1063. [Google Scholar] [CrossRef]
  14. Pashazadeh, H.; Teimournezhad, J.; Masoumi, A. Numerical investigation on the mechanical, thermal, metallurgical and material flow characteristics in friction stir welding of copper sheets with experimental verification. Mater. Des. 2014, 55, 619–632. [Google Scholar] [CrossRef]
  15. Sidhu, M.S.; Chatha, S.S. Friction stir welding–process and its variables: A review. Int. J. Emerg. Technol. Adv. Eng. 2012, 2, 275–279. [Google Scholar]
  16. Carlone, P.; Palazzo, G.S. Influence of process parameters on microstructure and mechanical properties in AA2024-T3 friction stir welding. Metallogr. Microstruct. Anal. 2013, 2, 213–222. [Google Scholar] [CrossRef]
  17. Pasebani, S.; Charit, I.; Mishra, R.S. Effect of tool rotation rate on constituent particles in a friction stir processed 2024Al alloy. Mater. Lett. 2015, 160, 64–67. [Google Scholar] [CrossRef]
  18. Nascimento, F.; Santos, T.; Vilaça, P.; Miranda, R.M.; Quintino, L. Microstructural modification and ductility enhancement of surfaces modified by FSP in aluminium alloys. Mater. Sci. Eng. A 2009, 506, 16–22. [Google Scholar] [CrossRef]
  19. Molla Ramezani, N.; Davoodi, B.; Aberoumand, M.; Rezaee Hajideh, M. Assessment of tool wear and mechanical properties of Al 7075 nanocomposite in friction stir processing (FSP). J. Braz. Soc. Mech. Sci. Eng. 2019, 41, 182. [Google Scholar] [CrossRef]
  20. Abbasi, M.; Bagheri, B.; Keivani, R. Thermal analysis of friction stir welding process and investigation into affective parameters using simulation. J. Mech. Sci. Technol. 2015, 29, 861–866. [Google Scholar] [CrossRef]
  21. Vigneshkumar, M.; Padmanaban, G.; Balasubramanian, V. Influence of tool tilt angle on the formation of friction stir processing zone in cast magnesium alloy ZK60/SiCp surface composites. Metallogr. Microstruct. Anal. 2019, 8, 58–66. [Google Scholar] [CrossRef]
  22. Mukherjee, I.; Ray, P.K. A review of optimization techniques in metal cutting processes. Comput. Ind. Eng. 2006, 50, 15–34. [Google Scholar] [CrossRef]
  23. Montgomery, D.C. Design and Analysis of Experiments; John Wiley & Sons: Hoboken, NJ, USA, 2017. [Google Scholar]
  24. Ross, P.J. Taguchi Techniques for Quality Engineering: Loss Function, Orthogonal Experiments, Parameter and Tolerance Design; McGraw-Hill: New York, NY, USA, 1988. [Google Scholar]
  25. Saravanakumar, S.; Prakash, K.B.; Dinesh, D.; Kumar, P.M.; Fouad, Y.; Soudagar, M.E.M.; Ali, M.M.; Bashir, M.N. Optimizing friction stir processing parameters for aluminium alloy 2024 reinforced with SiC particles: A taguchi approach of investigation. J. Mater. Res. Technol. 2024, 30, 4847–4855. [Google Scholar] [CrossRef]
  26. Chanakyan, C.; Sivasankar, S.; Meignanamoorthy, M.; Ravichandran, M.; Mohanavel, V.; Alfarraj, S.; Almoallim, H.S.; Manikandan, V.; Isaac JoshuaRamesh Lalvani, J. Optimization of FSP process parameters on AA5052 employing the S/N ratio and ANOVA method. Adv. Mater. Sci. Eng. 2021, 2021, 6450251. [Google Scholar] [CrossRef]
  27. Bauri, R.; Yadav, D.; Kumar, C.S.; Ram, G.J. Optimized process parameters for fabricating metal particles reinforced 5083 Al composite by friction stir processing. Data Brief 2015, 5, 309–313. [Google Scholar] [CrossRef]
  28. Rahman, M.Z.; Khan, Z.A.; Siddiquee, A.N.; Abidi, M.H.; Aboudaif, M.K.; Al-Ahmari, A. Mechanical and microstructural characterization of Ti-SiC reinforced AA5083 surface composites fabricated via friction stir process. Mater. Res. Express 2021, 8, 126523. [Google Scholar] [CrossRef]
  29. Rahman, Z.; Siddiquee, A.N.; Khan, Z.A. Effect of Ti/SiC reinforcement on AA5083 surface composites prepared by friction stir processing. In IOP Conference Series: Materials Science and Engineering; IOP Publishing: Bristol, UK, 2021; Volume 1149, p. 012001. [Google Scholar]
  30. Jain, V.K.; Yadav, M.K.; Siddiquee, A.N.; Khan, Z.A. Optimization of friction stir processing parameters for enhanced microhardness of AA5083/Al-Fe in-situ composites via Taguchi technique. Mater. Sci. Eng. Appl. 2021, 1, 55–61. [Google Scholar] [CrossRef]
  31. D Ghetiya, N.; Bharti, S.; Patel, K.M.; Kumar, S.; Rahimian Koloor, S.S. An insight on optimization of FSP process parameters for the preparation of AA5083/(SiC-Gr) hybrid surface composites using the response surface methodology. Compos. Adv. Mater. 2023, 32, 26349833231186162. [Google Scholar] [CrossRef]
  32. Bharti, S.; Ghetiya, N.D.; Patel, K.M. Parametric optimization of process parameters during friction stir processing of AA5083/(SiC-Gr) hybrid surface composite. Mater. Today Proc. 2023, 78, 420–425. [Google Scholar] [CrossRef]
  33. Kaya, N.; Çetinkaya, C.; Karakoç, H.; Ada, H. Effect of process parameters of Al5083/SiC surface composites fabricated by FSP on microstructure, mechanical properties and wear behaviors. Mater. Chem. Phys. 2024, 315, 128991. [Google Scholar] [CrossRef]
  34. Saxena, P.; Bongale, A.; Kumar, S.; Suresh, R. Tribological and hardness analyses of friction-stir-processed composites using the Taguchi approach. Materials 2023, 16, 420. [Google Scholar] [CrossRef]
  35. Syed, K.; Ali, M.A.; Reddy, K.P.K.; Rao, B.N. Analyzing the Influence of Tool Profile on Friction Stir Process with Taguchi Optimization and Tungsten Nano Powder. Int. J. Veh. Struct. Syst. 2023, 15, 802–807. [Google Scholar]
  36. Zass, K.; Mabuwa, S.; Msomi, V. Introduction of Coal Reinforcing Particles on the Dissimilar FSW AA608/AA5083 Joint via Friction Stir Processing. Metals 2023, 13, 1981. [Google Scholar] [CrossRef]
  37. Rathee, S.; Maheshwari, S.; Siddiquee, A.N.; Srivastava, M.; Sharma, S.K. Process parameters optimization for enhanced microhardness of AA 6061/SiC surface composites fabricated via Friction Stir Processing (FSP). Mater. Today Proc. 2016, 3, 4151–4156. [Google Scholar] [CrossRef]
  38. Jian, W.A.N.G.; Wang, X.W.; Bo, L.I.; Cheng, C.H.E.N.; Lu, X.F. Interface repairing for AA5083/T2 copper explosive composite plate by friction stir processing. Trans. Nonferrous Met. Soc. China 2021, 31, 2585–2596. [Google Scholar]
  39. Msomi, V.; Mabuwa, S. Optimization of Normal and Submerged FSP Parameters for Dissimilar Aluminium Joints Using Taguchi Technique. Mater. Sci. Forum 2021, 1034, 207–218. [Google Scholar] [CrossRef]
  40. Kosaraju, S.; Aziz, M.A.; Yadav, V.P.K.; Shiva, B.; Kolli, M.; Cheepu, M. Taguchi optimization of friction stir process parameters for enhancing joint strength of AA8011 reinforced with SiC nano particles. Int. J. Interact. Des. Manuf. (IJIDeM) 2024, 1–12. [Google Scholar] [CrossRef]
  41. ASTM E8M-04; Test Methods for Tension Testing of Metallic Materials. ASTM: West Conshohocken, PA, USA, 1995.
  42. ASTM E384; Standard Test Method for Microindentation Hardness of Materials. ASTM: West Conshohocken, PA, USA, 2017.
  43. Ahmadkhaniha, D.; Sohi, M.H.; Zarei-Hanzaki, A.; Bayazid, S.M.; Saba, M. Taguchi optimization of process parameters in friction stir processing of pure Mg. J. Magnes. Alloys 2015, 3, 168–172. [Google Scholar] [CrossRef]
  44. Puviyarasan, M.; Kumar, V.S. Optimization of friction stir process parameters in fabricating AA6061/SiCp composites. Procedia Eng. 2012, 38, 1094–1103. [Google Scholar] [CrossRef]
  45. Butola, R.; Ranganath, M.S.; Murtaza, Q. Fabrication and optimization of AA7075 matrix surface composites using Taguchi technique via friction stir processing (FSP). Eng. Res. Express 2019, 1, 025015. [Google Scholar] [CrossRef]
Figure 1. (a) FSW process; (b) Hole drilling and filling with reinforcement particles; (c) Closing of hole with pin less tool; (d) FSP single pass process.
Applsci 14 09616 g001aApplsci 14 09616 g001b
Figure 2. Pin less tool and Pin with tool utilised during the fabrication process.
Applsci 14 09616 g002
Figure 3. Tensile specimen.
Applsci 14 09616 g003
Figure 4. Hardness specimen.
Applsci 14 09616 g004
Figure 5. (a). Microstructure micrographs 50×: AA5083/SiC; (a1,a2) & AA5083/Coal (a3); (b). Microstructure micrographs 100×: AA5083/SiC; (b1,b2) & AA5083/Coal (b3).
Applsci 14 09616 g005
Table 1. Mechanical Properties.
Mechanical Properties
Ultimate tensile strength311 MPa
Percentage elongation58.6%
Microhardness93.1 HV
Table 2. Chemical Composition of AA5083 (in % wt) [36].
Base Material Composition
Magnesium4.03
Manganese0.69
Iron0.16
Silicon0.15
Chromium0.05
Copper0.02
Titanium0.02
Zinc0.01
AlBal
Table 3. Processing parameters with their levels.
Processing ParametersLevels of Parameters
123
Tool traverse speed (TS) in mm/min304560
Tool rotational speed (RS) in rpm6009001200
Tool tilt angle (TA) in °11.752
Table 4. Taguchi L9 design matrix.
No of TestsTraverse Speed [mm/min]Rotational Speed [rpm]Tilt Angle [°]
1.306001
2.456001.75
3.606002
4.309001.75
5.459002
6.609001
7.3012002
8.4512001
9.6012001.75
Table 5. Summary of mechanical properties for different composites and parameters.
TS
(mm/min)
RS
(rpm)
TA
(°)
AA5083/Silicon Carbide CompositeAA5083/Coal Composite
MH
(Hv)
UTS
(MPa)
PE
(%)
MH
(Hv)
UTS
(MPa)
PE
(%)
30600194.871.59.8893.616711.9
456001.7589.611411.888.31097.00
60600289.68811.292.722422.4
309001.7589.421029.096.313412.2
45900294.814518.590.724220.7
60900192.914119.992.416121.2
301200290.624329.595.31017.60
451200193.713218.793.118112.8
6012001.7589.612112.195.91419.38
List of symbols: TS: Traverse Speed (mm/min), RS: Rotational Speed (rpm), TA: Tilt Angle (degrees), MH: Microhardness (Hv), UTS: Ultimate Tensile Strength (MPa), PE: Percentage Elongation (%).
Table 6. AA5083/Silicon carbide composite experimental results with relevant S/N ratio.
TS
(mm/min)
RS
(rpm)
TA
(°)
MH
(Hv)
UTS
(MPa)
PE
(%)
S/N Ratio
for HV
S/N Ratio
for UTS
S/N Ratio
for PE
30600194.871.59.8838.8937.0919.89
456001.7589.611411.839.0441.1421.40
60600289.68811.239.0438.8921.01
309001.7589.421029.039.0346.4429.25
45900294.814518.539.3743.2325.32
60900192.914119.939.3742.9825.98
301200290.624329.539.1447.7129.39
451200193.713218.739.2242.4125.44
6012001.7589.612112.139.0441.6621.64
List of symbols: TS: Traverse Speed (mm/min), RS: Rotational Speed (rpm), TA: Tilt Angle (degrees), MH: Microhardness (Hv), UTS: Ultimate Tensile Strength (MPa), PE: Percentage Elongation (%), S/N Ratio: Signal to noise ratio.
Table 7. AA5083/Coal composite experimental results with relevant S/N ratio.
TS
(mm/min)
RS
(rpm)
TA
(°)
MH
(Hv)
UTS
(MPa)
PE
(%)
S/N Ratio
for HV
S/N Ratio
for UTS
S/N Ratio
for PE
30600193.616711.938.6644.4521.55
456001.7588.31097.0038.9240.7516.90
60600292.722422.439.3447.0127.02
309001.7596.313412.239.6742.5421.71
45900290.724220.739.1547.6826.33
60900192.416121.239.3244.1426.52
301200295.31017.6039.4240.0917.62
451200193.118112.839.3845.1522.11
6012001.7595.91419.3839.2842.9819.44
List of symbols: TS: Traverse Speed (mm/min), RS: Rotational Speed (rpm), TA: Tilt Angle (degrees), MH: Microhardness (Hv), UTS: Ultimate Tensile Strength (MPa), PE: Percentage Elongation (%), S/N ratio: Signal to noise ratio.
Table 8. Table of Responses for the S/N ratio of ultimate tensile strength parameters.
LevelTraverse Speed (mm/min)Rotational Speed (rpm)Tilt Angle (°)
143.7539.0440.83
242.2644.2243.08
341.1843.9343.28
Delta2.575.182.45
Rank213
Table 9. Table of Responses for the S/N ratio of percentage elongation parameters.
LevelTraverse Speed (mm/min)Rotational Speed (rpm)Tilt Angle (°)
126.1820.7723.77
224.0526.8524.10
322.8825.4925.24
Delta3.306.081.47
Rank213
Table 10. Table of Responses for the S/N ratio of microhardness parameters.
LevelTraverse Speed (mm/min)Rotational Speed (rpm)Tilt Angle (°)
139.0238.9939.16
239.2139.2539.04
339.1539.1439.18
Delta0.190.260.15
Rank213
Table 11. Contribution of individual factor to the variation of ultimate tensile strength.
SourceDegree of Freedom (DF)Seq SSF-Valuep-ValuePercentage
Contribution
TS (mm/min)29.99700.610.62111.32
RS (rpm)250.8233.100.24457.55
TA ( ° )211.1100.680.59612.58
Error216.379 18.55
Total888.308
Table 12. Contribution of individual factor to the variation of percentage elongation.
SourceDegree of Freedom (DF)Seq SSF-Valuep-ValuePercentage
Contribution
TS (mm/min)216.8310.850.54016.62
RS (rpm)261.1273.100.24460.36
TA ( ° )23.58300.180.8463.538
Error219.734 19.49
Total8101.275
Table 13. Contribution of individual factor to the variation of microhardness.
SourceDegree of Freedom (DF)Seq SSF-Valuep-ValuePercentage
Contribution
TS (mm/min)20.057774.250.19127.40
RS (rpm)20.101037.390.11948.17
TA ( ° )20.037292.730.26817.78
Error20.01367 6.452
Total80.20975
Table 14. Table of Responses for the S/N ratio of ultimate tensile strength parameters.
LevelTraverse Speed (mm/min)Rotational Speed (rpm)Tilt Angle (°)
142.3644.0744.58
244.5344.7842.09
344.7142.7444.92
Delta2.352.042.83
Rank231
Table 15. Table of Responses for the S/N ratio of percentage elongation parameters.
LevelTraverse Speed (mm/min)Rotational Speed (rpm)Tilt Angle (°)
120.2921.8223.39
221.7824.8519.35
324.3319.7223.65
Delta4.035.134.30
Rank312
Table 16. Table of Responses for the S/N ratio of microhardness parameters.
LevelTraverse Speed (mm/min)Rotational Speed (rpm)Tilt Angle (°)
139.2538.9739.12
239.1539.3839.29
339.3139.3639.30
Delta0.160.400.18
Rank312
Table 17. Contribution of individual factor to the variation of ultimate tensile strength.
SourceDegree of Freedom (DF)Seq SSF-Valuep-ValuePercentage
Contribution
TS (mm/min)210.2330.470.68219.3
RS (rpm)26.45100.290.77312.8
TA ( ° )214.3290.650.60527.0
Error221.969 41.5
Total852.982
Table 18. Contribution of individual factor to the variation of percentage elongation.
SourceDegree of Freedom (DF)Seq SSF-Valuep-ValuePercentage
Contribution
TS (mm/min)224.971.520.39721.5
RS (rpm)239.932.430.29234.4
TA ( ° )234.892.120.32030.0
Error216.44 14.1
Total8116.23
Table 19. Contribution of individual factor to the variation of microhardness.
SourceDegree of Freedom (DF)Seq SSF-Valuep-ValuePercentage
Contribution
TS (mm/min)20.040400.140.8745.792
RS (rpm)20.313161.120.47244.89
TA ( ° )20.063690.230.8159.131
Error20.28026 40.18
Total80.69751
Disclaimer/Publisher’s Note: The statements, opinions and data contained in all publications are solely those of the individual author(s) and contributor(s) and not of MDPI and/or the editor(s). MDPI and/or the editor(s) disclaim responsibility for any injury to people or property resulting from any ideas, methods, instructions or products referred to in the content.

