Article

Irregular Eccentric Wellbore Cementing: An Equivalent Circulation Density Calculation and Influencing Factors Analysis

1
State Key Laboratory of Oil and Gas Reservoir Geology and Exploitation, Southwest Petroleum University, Chengdu 610600, China
2
School of Petroleum and Natural Gas Engineering, Southwest Petroleum University, Chengdu 610600, China
3
School of Sciences, Southwest Petroleum University, Chengdu 610600, China
4
PetroChina Tarim Oilfield Company, CNPC, Korla 841000, China
*
Author to whom correspondence should be addressed.
Appl. Sci. 2024, 14(20), 9573; https://doi.org/10.3390/app14209573
Submission received: 28 August 2024 / Revised: 8 October 2024 / Accepted: 17 October 2024 / Published: 20 October 2024
(This article belongs to the Topic Petroleum and Gas Engineering)

Abstract

:
In the field of cement, if the formation cannot be given sufficient pressure to maintain stability during construction, pressure control failure may occur, leading to the leakage of liquids and gasses from the formation to the wellbore. In addition, irregular wellbore diameter and casing eccentricity are important factors that are easily overlooked and affect the prediction of ECD (Equivalent Circulation Density) calculation. This results in major accidents and ecological disasters, further impacting the global environment. This study focuses on a well in the eastern oilfields of China, and based on a rheological experiment of high temperature and high pressure, an irregular eccentric wellbore model is established according to the measured wellbore diameter and eccentricity data to calculate the ECD of the whole cementing process. Then, a data set is constructed and analyzed using the random forest method to quantitatively evaluate influencing factors such as displacement, rheology, density, and eccentricity on the bottomhole and wellbore ECD. Results find that the density of cement slurry and drilling fluid has the most significant impact on the maximum ECD, with the impact reaching 0.3142 and 0.2902, respectively, and the main factors that affect the minimum ECD are the density and rheological changes in the drilling fluid, reaching 0.7014 and 0.2846. These research findings will contribute to the precise control of wellbore pressure during cementing operations, further ensuring the safety of cementing operations, and laying a technical foundation for the automation and intelligentization of subsequent cementing operations.

1. Introduction

Facing the intensifying issue of climate change, it is widely recommended that the impact of human activities on nature be reduced and the destruction inflicted upon the natural world be mitigated [1,2]. In the field of oil drilling, if the formation cannot be given sufficient pressure to maintain stability during construction, pressure control failure may occur, leading to the leakage of liquids and gasses from the formation to the surface through the wellbore [3]. For example, the Gulf of Mexico Oil Spill in 2010 covered 2500 square kilometers of the sea with crude oil, and the adverse impact on the ecological environment of the Gulf of Mexico is yet to disappear [4]. Subsequent expert analysis identified the direct cause of the incident as pressure control failure during the cementing process in well construction. According to statistics, the recent construction records of 39 oil wells in an oilfield in Eastern China found that more than 70% of the oil wells encountered complex accidents such as well leakage, invasion, and blowout caused by a pressure imbalance [5].
To ensure the safety of cementing operations in well cementing, four-string or five-string casing designs and open-hole completion are currently in use. This also puts forward higher requirements for the accuracy of wellbore pressure prediction and control results during cementing. Existing studies on cementing ECD (Equivalent Circulating Density) mainly focus on quantifying the influence rules of downhole high temperature and high pressure on wellbore fluid rheology based on experiments to improve the accuracy of the model calculation. Some researchers have conducted an experimental study on the rheology of water-based drilling fluids under high temperature and high pressure using the Fann high-temperature, high-pressure viscometer and conducted a qualitative analysis [6]. Another author proposed a comprehensive model for predicting the shape viscosity, yield value, and apparent viscosity by synthesizing multiple published models [7]. Other authors conducted an in-depth study on the influence of pressure on the yield stress, apparent viscosity, and fluidity index of water-based drilling fluids based on the high-temperature, high-pressure rheometer [8]. Researchers enhanced the prediction accuracy and further broadened the application range of the prediction model by using a non-parametric nonlinear regression model to fit the experimental data [9]. Other researchers have explored how the eccentricity of annuli significantly affects the velocity profile and frictional pressure losses in extended-reach wells and slimholes [10]. Authors developed a numerical model to simulate the laminar flow of yield-power-law fluids in eccentric annular geometries, which has an excellent agreement for the case of non-Newtonian fluids [11]. For ECD calculation models, the parameters that most significantly affect the precision of the results are the flow rate, fluid rheology, fluid density, wellbore diameter, and eccentricity. The aforementioned calculation models and commercial software all evolved from the classical drilling ECD calculation model framework, focusing mostly on the variations in flow rate, rheology [12,13,14], and density [15]; however, the wellbore diameter and eccentricity are typically calculated using fixed values throughout, which, ignoring the variations in wellbore diameter and eccentricity, would lead to discrepancies between the calculated results and field-measured values [16], as shown in Figure 1.
Machine learning methods such as random forest, the simulated annealing (SA) algorithm, and support vector regression (SVR) have been widely used in the field of drilling and cementing, mainly for predicting pressure and optimizing conventional calculation models. Some authors using a combination of the SA algorithm and SVR propose an effective monitoring method for bottom well pressure, and the model integrates hydrostatic column pressure, annulus pressure loss, and surface back pressure data, allowing for accurate monitoring without traditional Pressure While Drilling (PWD) instruments [17]. Other authors considered that traditional models often fall short in both accuracy and computational efficiency and evaluated several machine learning algorithms—Bayesian Neural Network (BNN), random forest (RF), Artificial Neural Network (ANN), and Support Vector Machine (SVM) to improve predictions of pressure loss in concentric and eccentric annuli. The results indicate that RF and BNN provided the best accuracy, with mean absolute errors of 2.57% and 3.2%, respectively [18]. Another researcher found the use of computational fluid dynamics (CFD) and machine learning to model pressure loss and mass transfer in membrane channels, focusing on spacer-filled membranes [19].
In response to the deficiencies in the existing research, this study focuses on a well in the eastern oilfields of China, and based on the rheological experiment of high temperature and high pressure, the irregular eccentric wellbore model was established according to the measured wellbore diameter and eccentricity data to calculate the ECD of the whole cementing process. Then, the data set was constructed and analyzed using the random forest method to quantitatively evaluate the influence of various factors such as displacement, rheology, density, and eccentricity on bottomhole and wellbore ECD, identifying the main influencing factors. The research findings contribute to the precise control of wellbore pressure during cementing operations, further ensuring the safety of cementing operations, reducing the risk of environmental pollution, and laying a technical foundation for the automation and intelligentization of subsequent cementing operations.

2. Study on the Irregular Eccentric Shaft Model

2.1. Physical Parameters of the Wellbore Model

2.1.1. Well Diameter

Through research on related hydrodynamic parameter calculation models and simulation software, the method generally used is to first measure the well diameter and then take the average to calculate the well diameter parameter in the barehole section of the cementing casing model [11]. However, when calculating the ECD for cementing, the precision of the well diameter parameter not only affects the accuracy of the calculations for the annular return velocity and circulating frictional resistance but also influences the model’s judgment of the real-time upper and lower interface positions of different injected fluids at each moment. Therefore, in order to prevent a significant deviation between the model calculation results and the measured results, which would lead to complex accidents such as cementing leakage, the annulus open-hole section cannot be regarded as a uniform ring of the same size from top to bottom. Instead, it should be regarded as a combination of rings of different diameters.
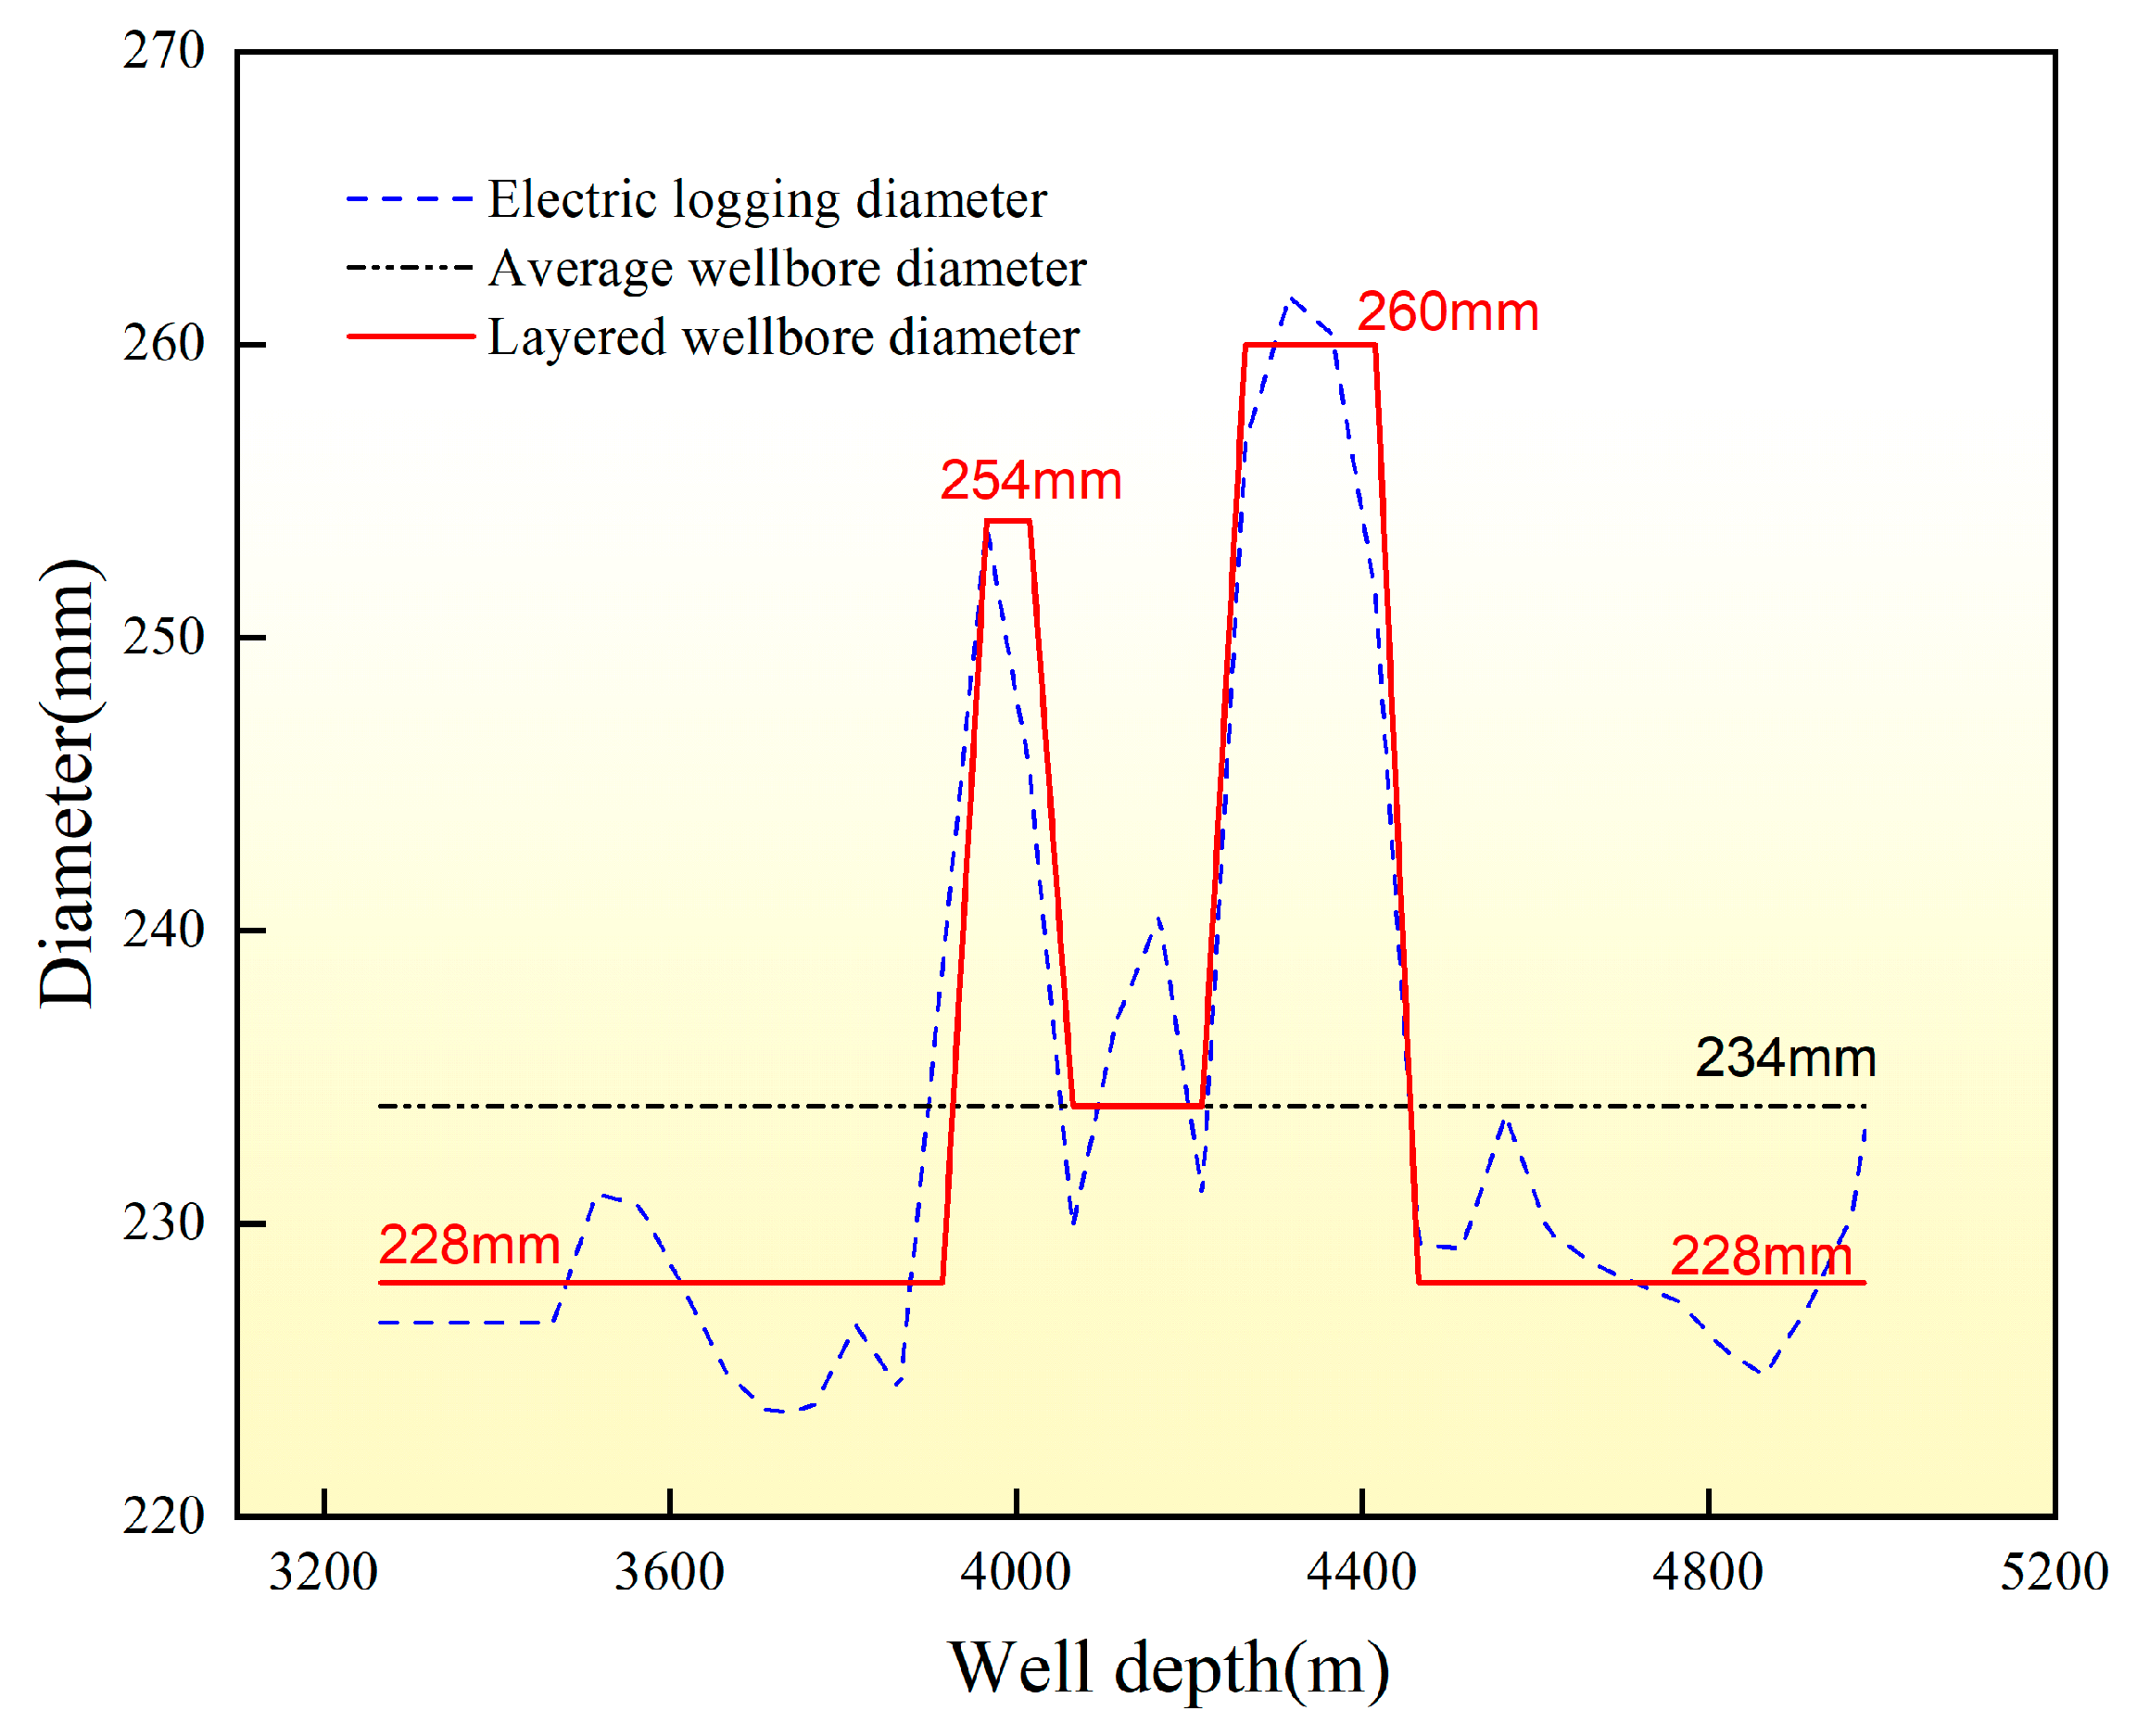
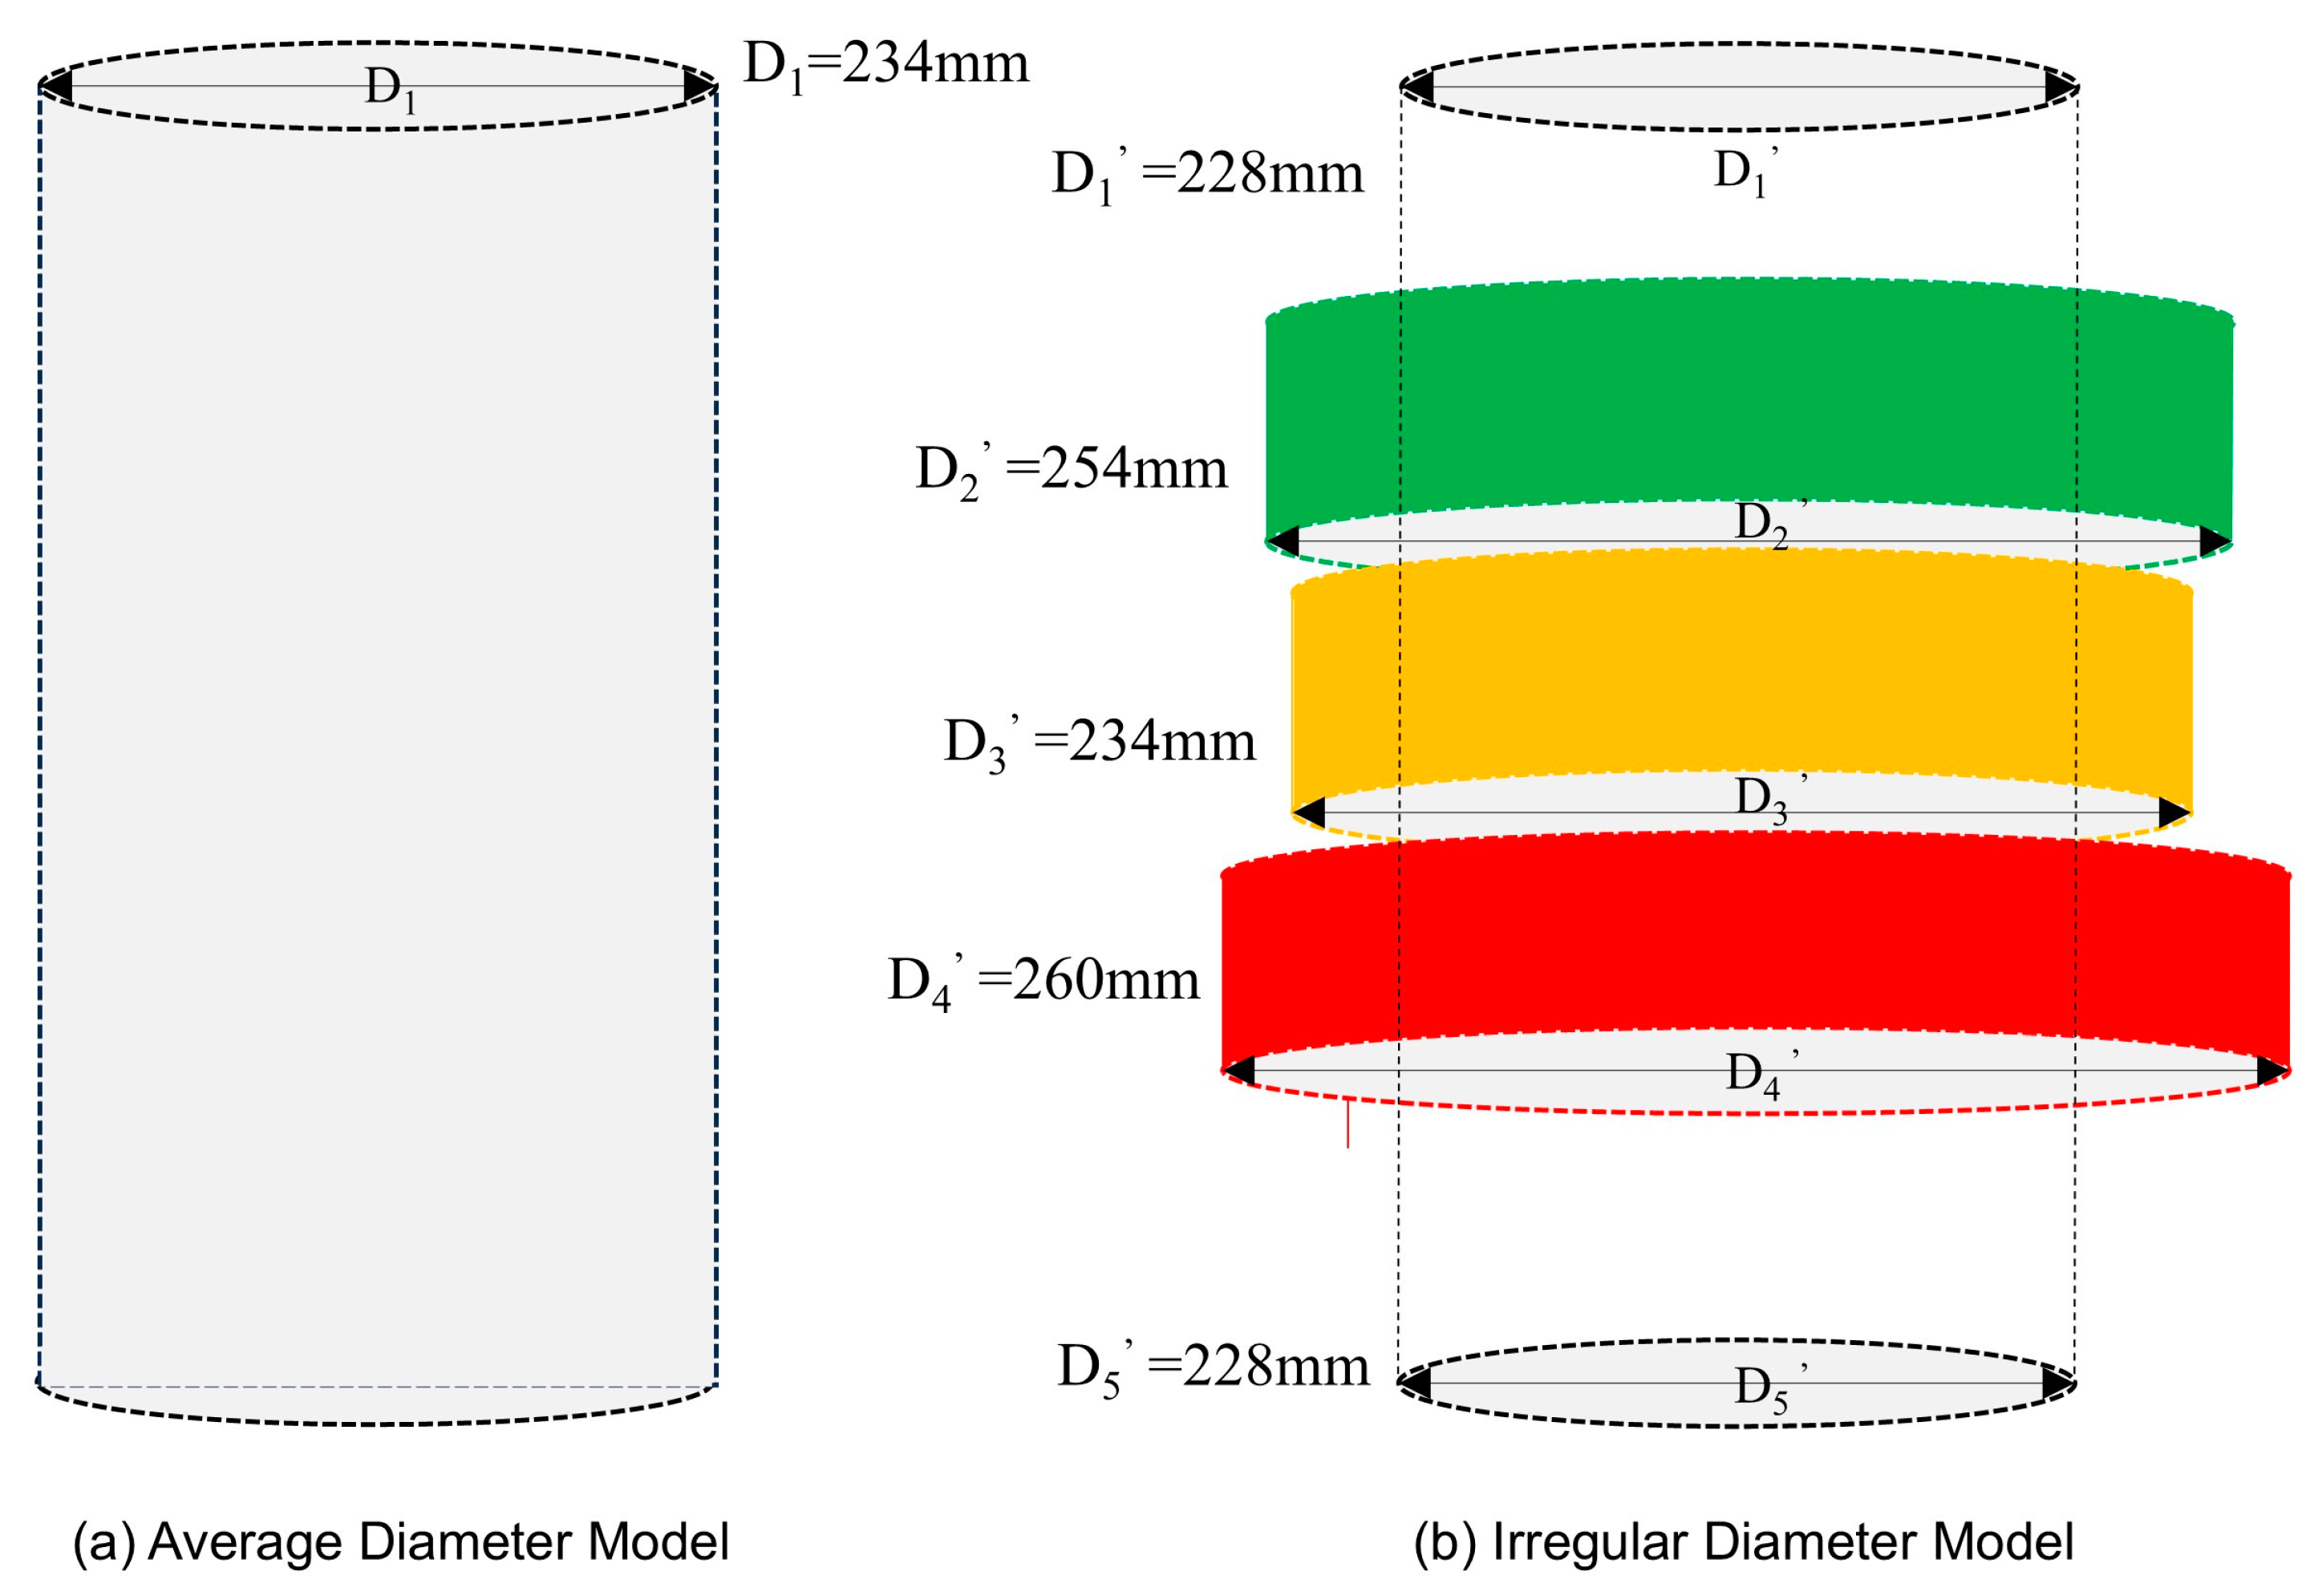
Research has taken a directional well 7X27x2 in an oilfield in Eastern China as an example, and the well depth is 4980 m, the three-opening drill bit size is 215.9 mm, and the outer diameter of the casing is 139.7 mm. Based on the barehole section of the well logging data, this paper calculated parameters of average wellbore model and an irregular wellbore model which are shown in Figure 2. Among them, multifacetedly considering the comprehensive algorithm structure and computation time, the irregular wellbore model adopts a five-layer wellbore model with each layer’s wellbore diameter being the average measured diameter of that section. The comparison of wellbore diameters between the two models is shown in Figure 3.

2.1.2. Eccentricity

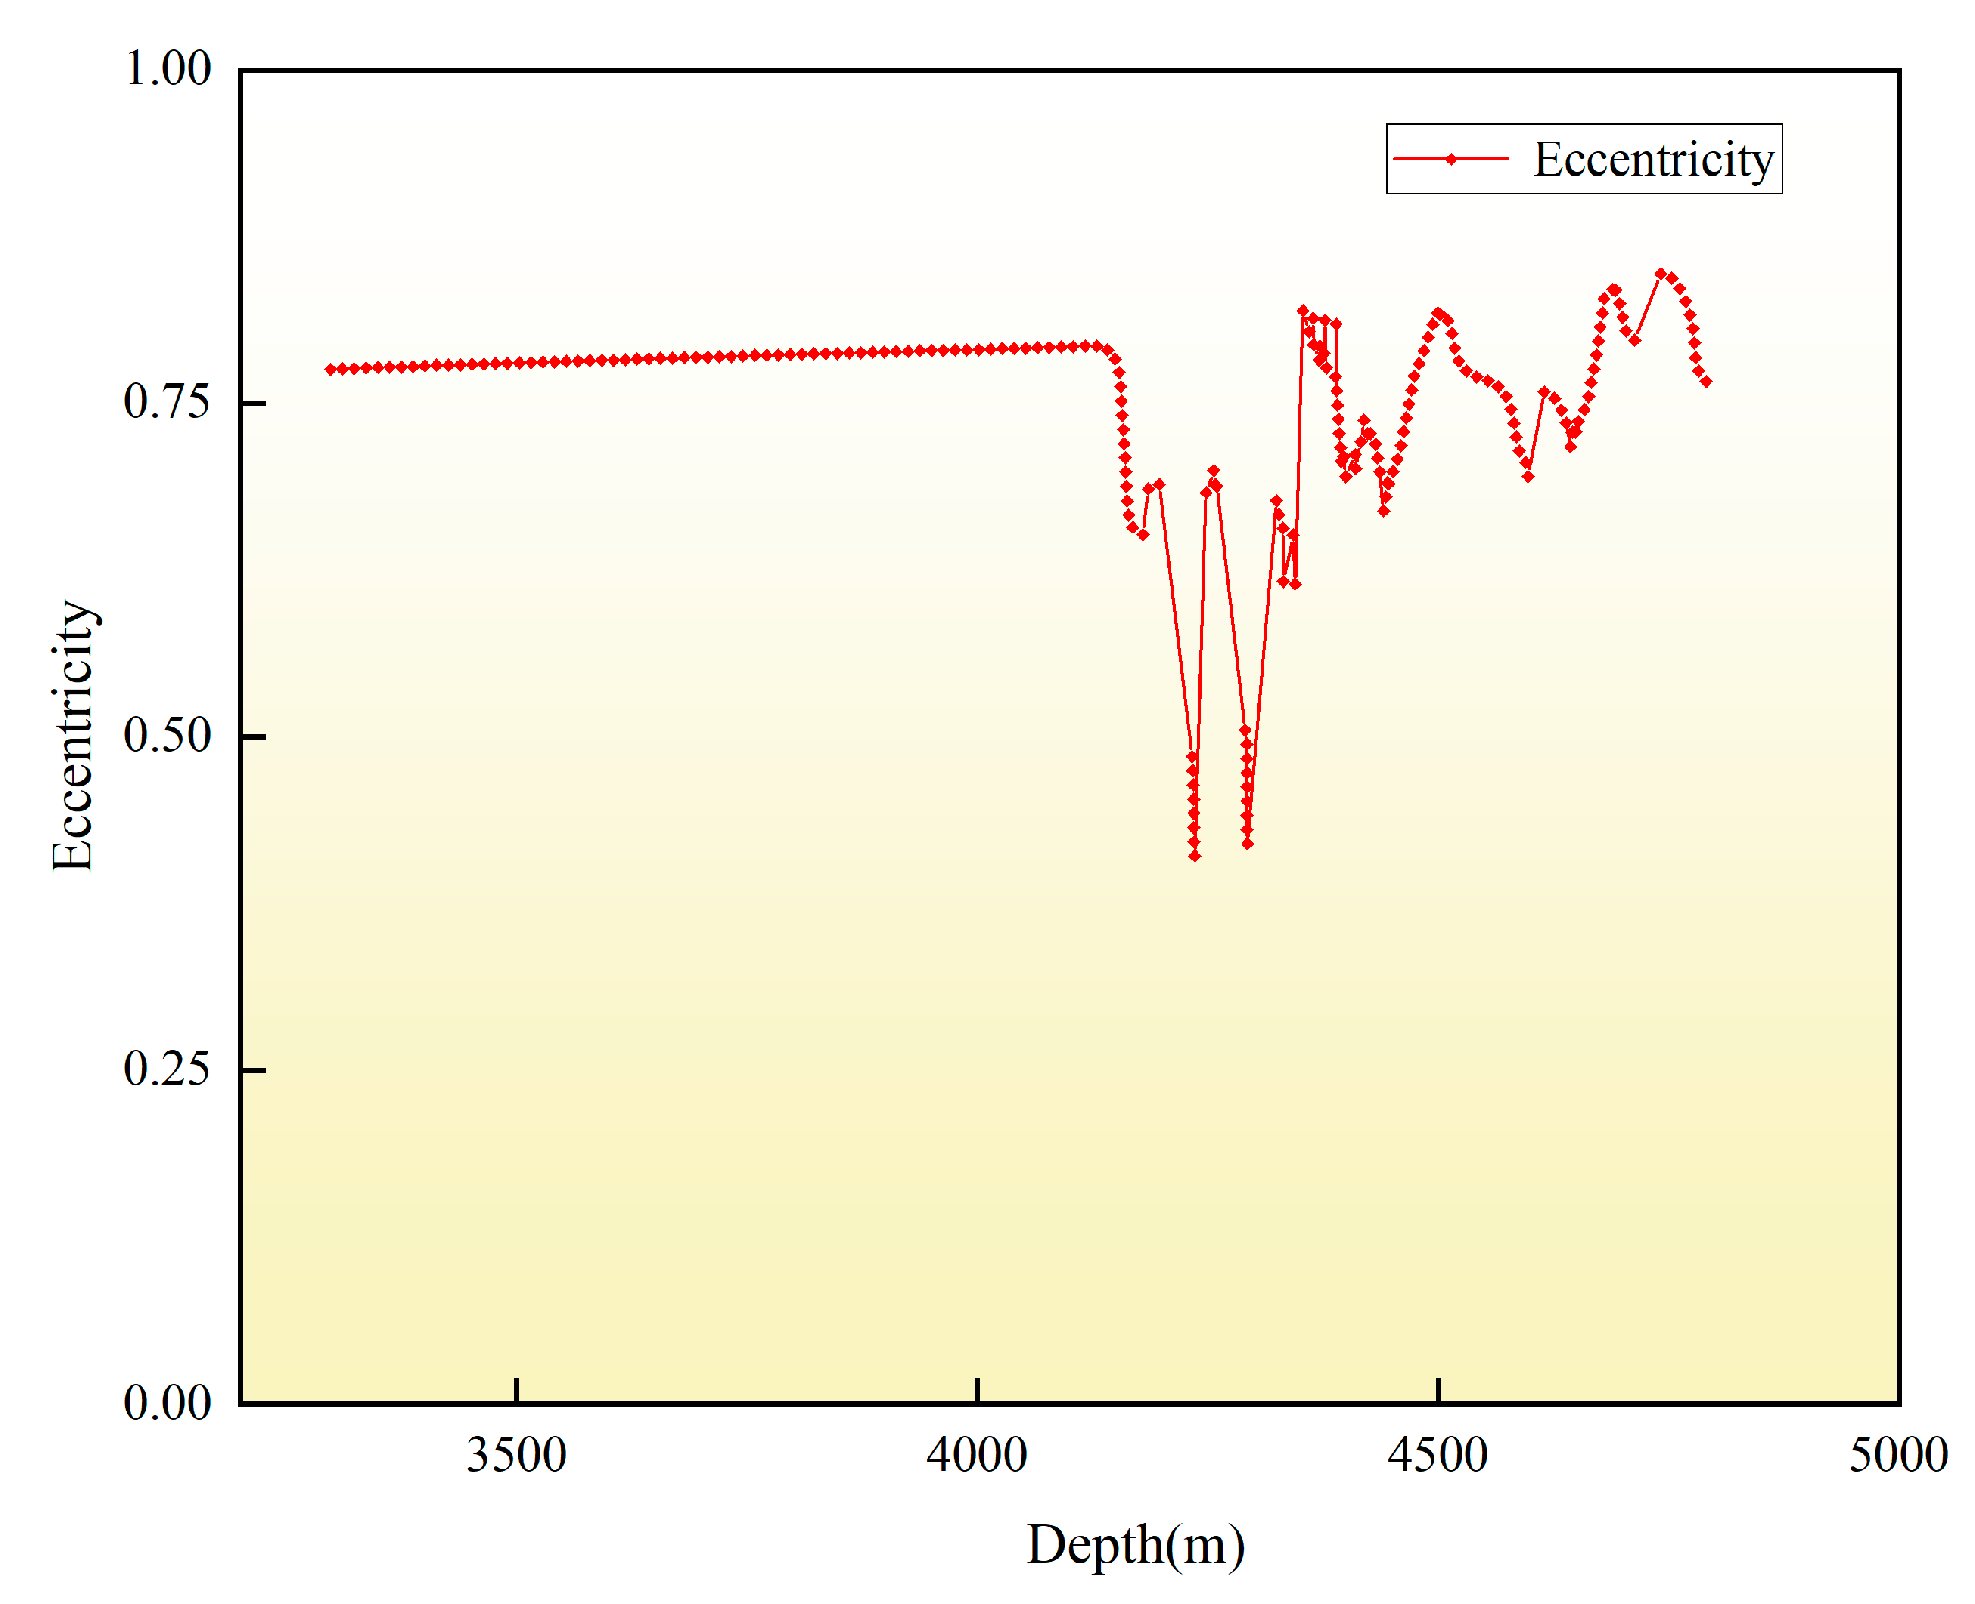
Considering the avoidance of complex strata such as high-pressure water and karst caves, the designed wellbore trajectory may include turns and twists. In a wellbore that extends for thousands of meters, the casing is likely to deviate from the center, especially in the barehole section where the uneven rock wall usually leads to an increase in the casing eccentricity. Research referring to the data from well 7X27x2 predicts the annular eccentricity at different depths in the model on the basis of the professional software CEMPRO+ version 2.7.8 of casing, as shown in Figure 4.

2.2. Physical Parameters of Wellbore Fluids

2.2.1. Density Under High Temperature and High Pressure

In this paper, a multivariate nonlinear regression analysis method is employed to standardize the experimental data of water-based drilling fluids from experimental and related research [20,21]. After fitting, the relationships between the density of water-based drilling fluids, isolation fluids, and temperature and pressure are obtained, as shown in the following equations.
d r i l l i n g f l u i d : ρ D = ρ d 1.63 1.119 × T T 0 + 0.29 × P P 0 3.61 × 10 6
s p a c e r : ρ S = ρ s 1.015 0.616 × T T 0 + 0.598 × P P 0 3.65 × 10 6
where the following variables are used:
  • ρD is the predicted drilling fluid density, kg/m3;
  • ρd is the test drilling fluid density, kg/m3;
  • ρS is the predicted spacer density, kg/m3;
  • ρs is the test spacer density, kg/m3;
  • T is the downhole temperature, °C;
  • T0 is the test temperature, °C;
  • P is the downhole pressure, MPa;
  • P0 is the test pressure, MPa.
As a mixture, there is a significant difference in properties between different cement systems. Additionally, chemical reactions persist after the system is prepared, making accurate density measurement challenging. Therefore, in the model, the density of the cement is based on the design value.

2.2.2. Rheology Under High Temperature and High Pressure

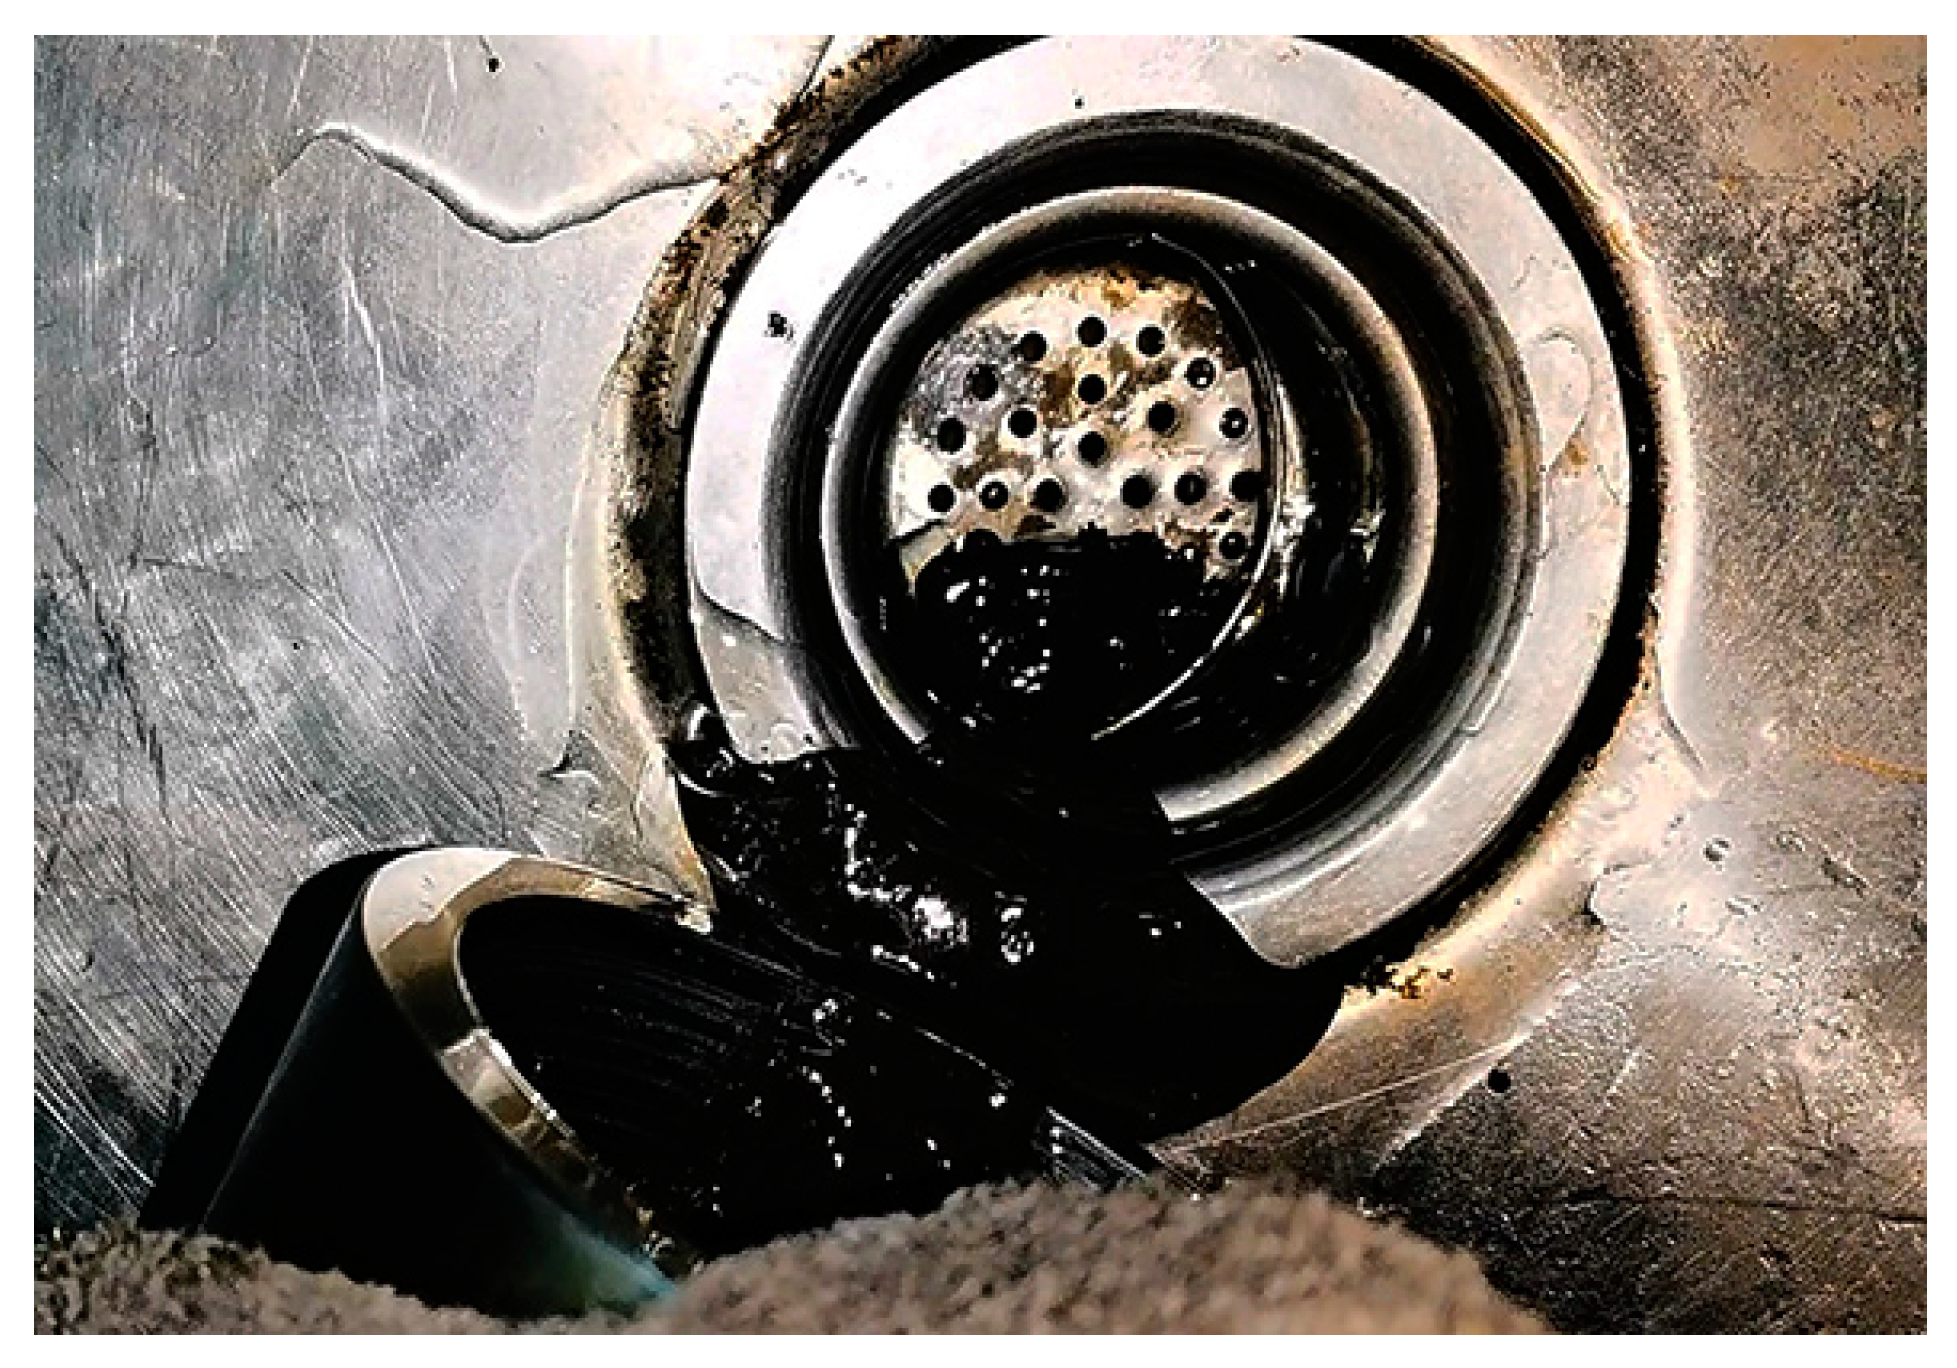
In this study, we choose the Chandler 7600 High Temperature and Pressure Rheometer (Oklahoma City, OK, USA) to measure the rotation shear stress values of reused drilling fluids [22], isolation fluids, and cement slurry at 60, 90, 120, and 150 °C, which are simulated using multivariate nonlinear regression based on the Herschel–Bulkley rheological model. The fitting formula is shown in the following equation, as shown in Figure 5 and Figure 6.
τ = α 1 + α 2 × T T 0 + α 3 × P P 0 +   α 4 + α 5 × T T 0 + α 6 × P P 0 × γ α 7 n = α 7 k = α 4 + α 5 × T T 0 + α 6 × P P 0 τ 0 = α 1 + α 2 × T T 0 + α 3 × P P 0
where the following variables are used:
  • α1α7 are the fitting coefficients, dimensionless;
  • τ is the shear stress, Pa;
  • τ0 is the dynamic shear stress, Pa;
  • n is the fluidity index, dimensionless;
  • k is the consistency coefficient, Pa·sn.
The function relationship between temperature, pressure, and n, k, and τ is obtained by fitting, and the results are shown in Table 1.

3. Study on the ECD Model of the Irregular Eccentric Wellbore

3.1. Temperature Field

3.1.1. Wellbore Model

The thermal analysis within the wellbore can focus on three regions, namely the drill string, the annulus, and the formation [23,24]. The following assumptions are considered to simplify the problem:
  • The radial temperature gradient within the drilling fluid is neglected;
  • The vertical heat conduction along the drill string and the formation is neglected;
  • The thermal conductivity of the formation is assumed to be constant.
The model of the bottomhole temperature field in cementing mainly includes three parts of heat exchange. Firstly, there is a vertical thermal convection along the drill pipe within the drill string. Secondly, there is a heat exchange between the drill pipe and the annulus. Lastly, there is a thermal conduction within the formation and a thermal convection within the annulus. According to the cementing construction plan, the fluid temperature in the drill pipe and annulus can be close to the formation temperature after two weeks of full drilling fluid circulation.

3.1.2. Governing Equation

(1)
Inside the casing:
The heat exchange of the fluid inside the casing includes the thermal transfer of fluid flow during the pumping process (axial), the forced convection heat transfer between the fluid and the casing’s inner wall due to fluid–solid coupling (radial), and the energy (viscous dissipation energy) generated by the fluid friction pressure drop.
Q c ρ 1 q C 1 T c Z + π r c i h c i ( T w T c ) = ρ 1 C 1 π r c i 2 T c t
where the following variables are used:
  • Qc is energy generated by friction pressure drop of drilling fluid per unit length of casing, W/m;
  • ρ1 is the density of the working fluid inside the casing, kg/m3;
  • q is the discharge rate of the drilling fluid, m3/s;
  • C1 is the specific heat capacity of the drilling fluid, W/(m·K);
  • Tc is the temperature of the drilling fluid inside the casing, °C;
  • Tw is the temperature of the casing column, °C;
  • rci is the inner diameter of the casing, m;
  • hci is the convective heat transfer coefficient between the fluid inside the casing and the casing, W/(m·K).
(2)
Casing string:
ρ 2 C 2 T w t = λ 2 2 T w z 2 + 2 r c o h c o r c o 2 r c i 2 T a T w + 2 r c i h c i r c o 2 r c i 2 T c T w
where the following variables are used:
  • ρ2 is the density of the casing string, kg/m3;
  • C2 is the specific heat capacity of the casing string, J/(kg·K);
  • λ2 is the thermal conductivity of the casing, W/(m·K);
  • rci is the inner diameter of the casing, m;
  • rco is the outer diameter of the casing, m;
  • hci is the convective heat transfer coefficient between the fluid inside the casing and the casing itself, W/(m2·K);
  • hco is the convective heat transfer coefficient between the annular fluid and the casing, W/(m2·K);
  • Ta is the temperature of the annular fluid, °C.
(3)
Annular fluid:
The heat exchange of the annular fluid includes the thermal transfer of fluid flow during the pumping process, the forced convection heat transfer formed by fluid–solid coupling between the fluid and casing outer wall and the formation in the radial direction, and the energy (viscous dissipation energy) produced by the fluid friction pressure drop. The heat conduction in the axial direction and the natural convection heat transfer are neglected.
ρ 1 q C 1 T a z + 2 π r b h b T f 1 T a + 2 π r c o h c o T w T a + Q a = ρ 1 C 1 π r b 2 r c o 2 T a t
where the following variables are used:
  • Tf1 is the temperature of the wellbore wall, °C;
  • rb is the radius of the barehole annulus, m;
  • rco is the outer diameter of the casing, m;
  • hb is the convective heat transfer coefficient between the formation and the drilling fluid in the annulus, W/(m·K);
  • hco is the convective heat transfer coefficient between the annular drilling fluid and the casing, W/(m·K);
  • Qa is the heat generated by the frictional pressure drop of the drilling fluid in the annulus per unit length and per unit time, W.
(4)
The formation and the wellbore wall:
ρ e c e λ e T e t = 2 T e r 2 + 1 r T e r + 2 T e z 2
T h = λ e T e + T a r h k f t r h k f t + λ e
where the following variables are used:
  • r is the radial distance, m;
  • ρe is the density of the formation rock, kg/m3;
  • ce is the specific heat capacity of the formation rock, J/(kg·K);
  • λe is the thermal conductivity of the formation, W/(m·K).

3.1.3. Initial and Boundary Conditions

  • Formation temperature: the initial temperature of the drilling fluid in the drill string and the annulus and each element in the formation;
  • Casing inlet boundary: The inlet temperature of the drilling fluid can usually be measured in practice. T(z = 0, t) = Tin, Tin is known;
  • Annulus inlet boundary: at the bottom of the well (z = Hmax), the temperature of the fluid inside the drill string is approximately equal to that in the annulus;
  • Formation boundary: Te(z,r→∞,t) is equal to the geothermal gradient.

3.2. ECD Calculation Model

3.2.1. Hydrostatic Pressure Calculation

From the wellhead to the bottom, based on different layers, the changed annular radius Ri is iteratively calculated via ECD with the functional expression as follows:
E C D R i = i = 1 n ρ T i g h + i = 1 n P f T , R i + P c g H
where the following variables are used:
  • i is the layer, dimensionless;
  • Ri is the layer’s annular radius, m;
  • h is the well layer’s depth, m;
  • Pc is the wellhead back pressure, Pa;
  • ρ(Ti) is the fluid density at the layer’s temperature, kg/m3;
  • Pf(T,Ri) is the frictional pressure drop at the layer’s radius and temperature, Pa.

3.2.2. Frictional Pressure Drop Calculation

In field cementing operations, the annulus below the wellbore is often eccentric, with the downhole fluid flowing through the eccentric annulus [11]. An eccentric annular flow model is established, where the inner and outer radii of the annulus are R1 and R2, respectively, with the center of the inner circle being O1 and the outer circle being O2, as shown in Figure 7. By establishing a polar coordinate system (α, r) with the center of the inner circle as the origin and the radius direction as the ray, the calculation Formula (10) for the annular gap Ri can be obtained.
R i = 1 + cos α R 2 R 1 1 2 R 2 R 1 R 2 sin 2 α
where the following variables are used:
  • α is the angle, °;
  • R1 is the annular inner radius, m;
  • R2 is the annular outer radius, m.
When α = 0, the annular gap is at its maximum; when α = π, it is at its minimum. The Herschel–Bulkley model with three parameters is more representative of the cement slurry, and its constitutive relationship is shown in Equation (11).
τ = k γ n + τ 0
This Equation is established based on the dynamic resistance balance of the fluid flow in the annulus. The frictional pressure drop in the Herschel–Bulkley model can be derived and represented as follows:
P f = 1 + 2 n 3 n 6 u R i G n 2 h k R i + 1 + 2 n 1 + n 2 h τ N R i G G = 1 + 1 + n 4 n 3 + R 1 / R 2 2 1 + R 1 / R 2 + 1 n e R 2 R 1 2 N = 1 + 1 + n 4 n 3 + R 1 / R 2 2 1 + R 1 / R 2 + 1 n n e R 2 R 1 2
where
  • Pf is friction pressure drop, Pa;
  • e is the eccentric distance, m.
Based on another researcher’s experimental data [25], the friction calculation of the model is proven to be accurate. The length of experimental device annulus is 9 m, and the diameters of the inside and outside pipes are 54.42 mm and 127 mm, respectively. The comparison of model calculations and experimental results is shown in Table 2.

3.3. Validation of Computational Results

The ECD calculation model is used to simulate and calculate the ECD in the wellbore and at the bottom of the well during the cementing process in the 7X 7x2 oilfield in Eastern China. The displacement scheme is shown in Table 3, and the wellbore and related fluid parameters are shown in Table 4.
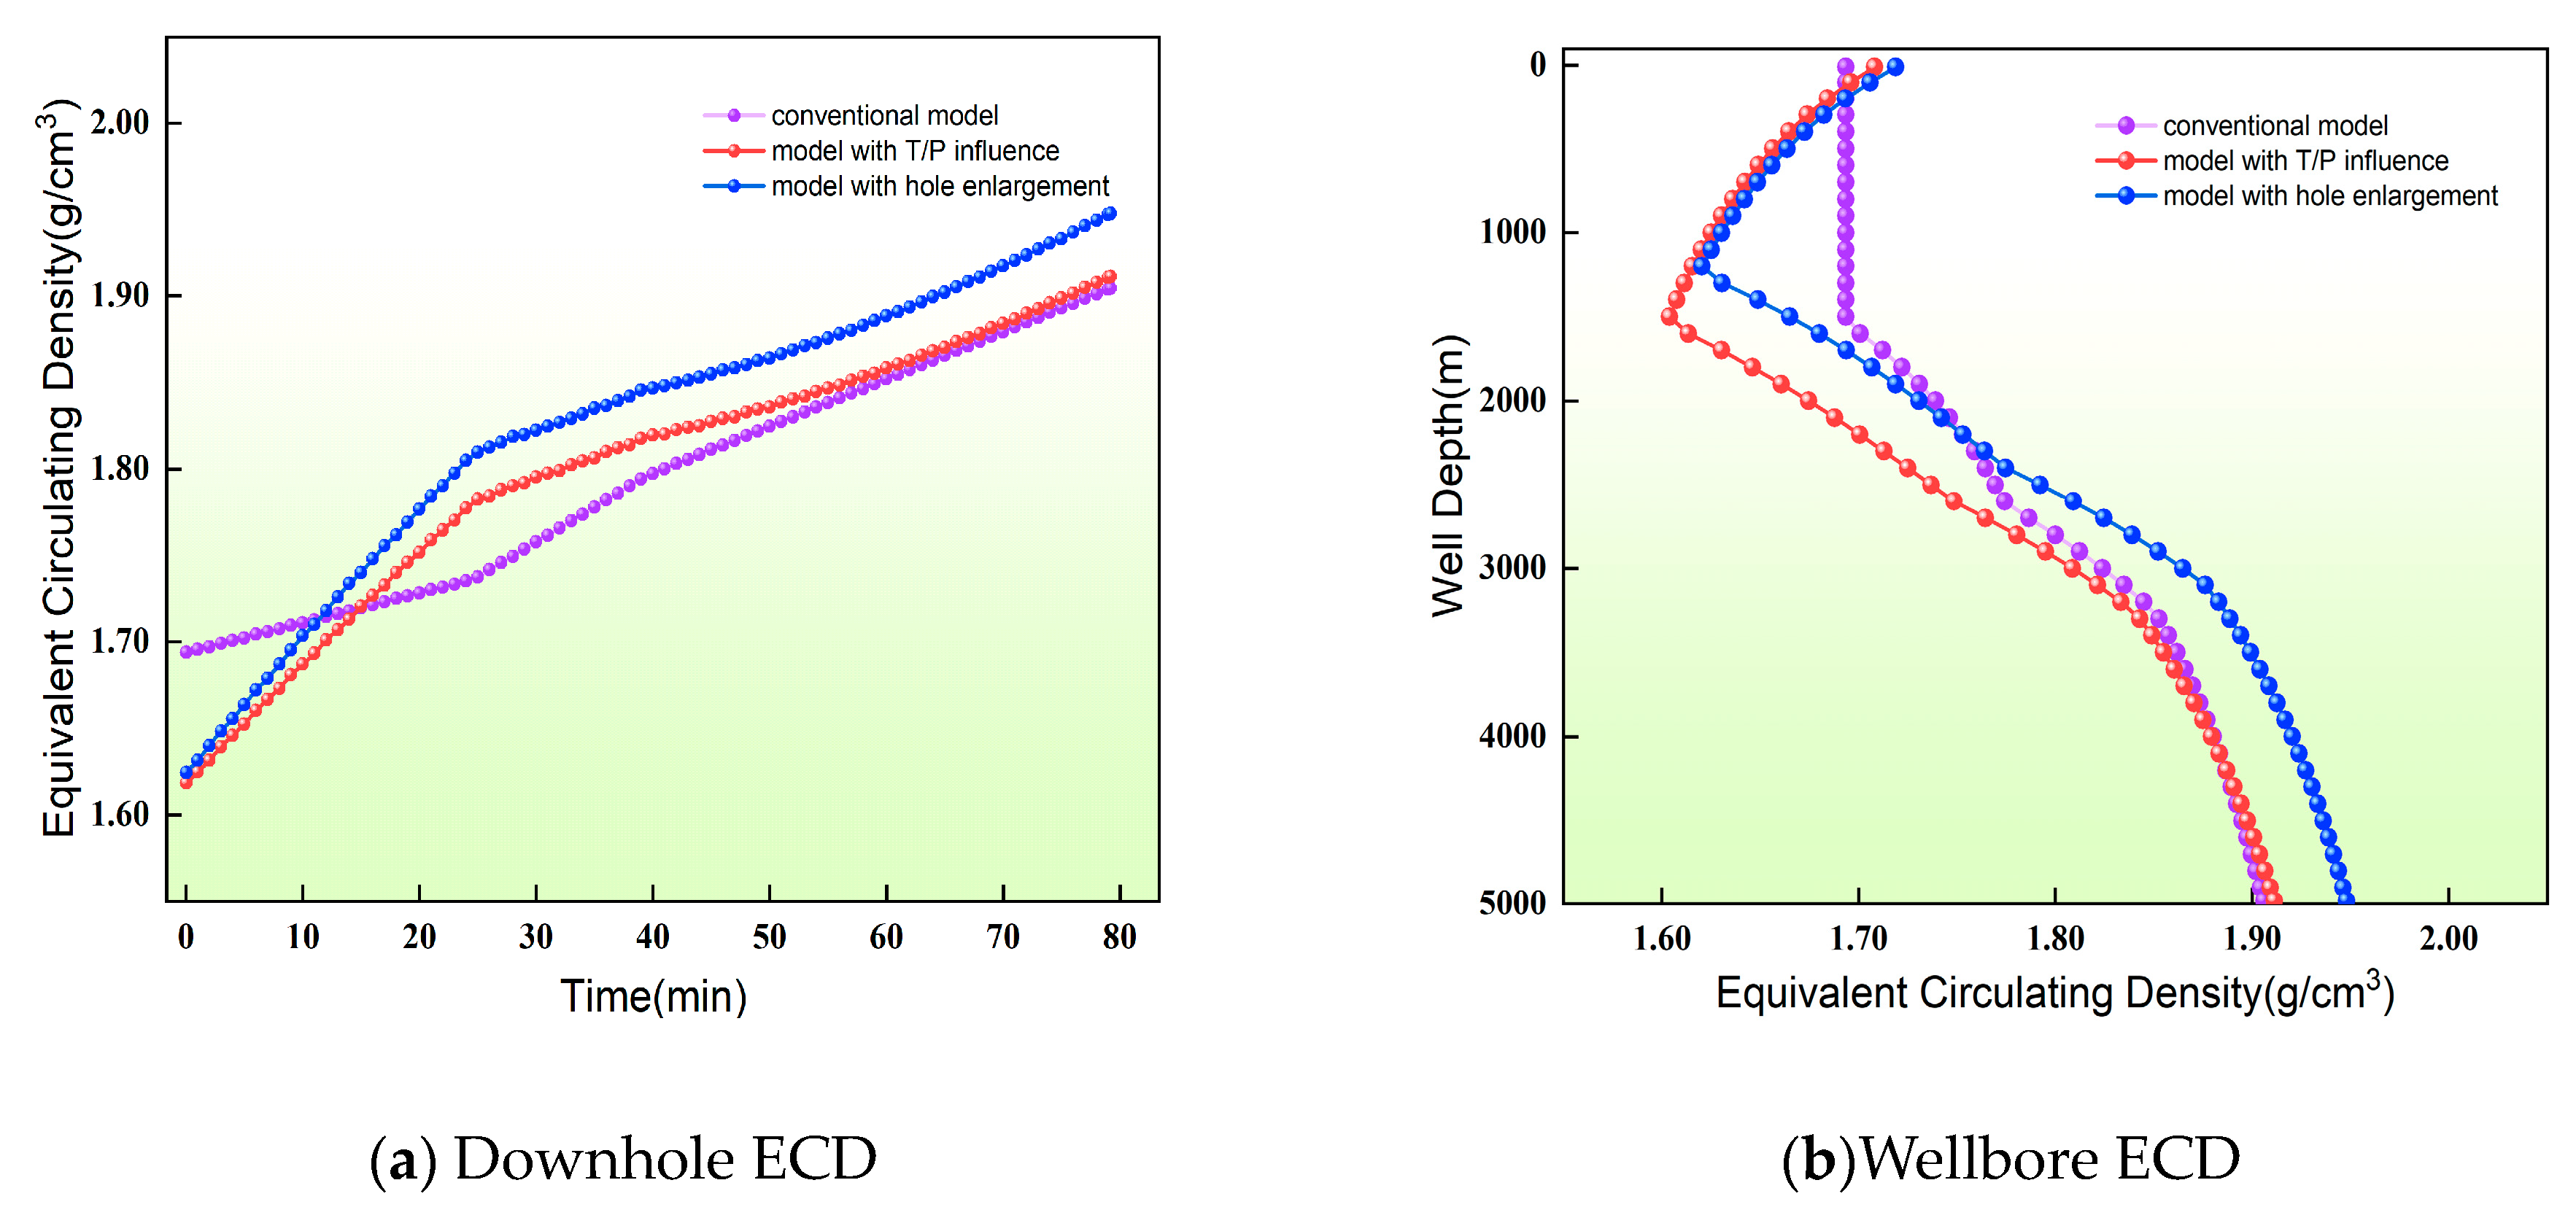
The bottomhole ECD and total well ECD can be calculated using calculation models that consider conventional, coupled temperature–pressure and irregular wellbore diameter factors, respectively. The calculation results are shown in Figure 8. In the figure, compared with the conventional model and the model that only considers temperature and pressure, the new model’s calculation results consider the temperature, pressure, and radius changes. They can more accurately calculate the change in the displacement interface position caused by the irregular wellbore.

4. Based on the Random Forest Algorithm for Irregular Wellbore Diameter Weight Analysis

4.1. Random Forest Model and Related Parameters

The database is constructed using the calculation results of the previous model; then, the model is established using the random forest method to quantitatively analyze the influence of factors such as displacement, rheological changes, different liquid densities, eccentricity, and well diameter changes on ECD [26]. Based on the random forest method combined with the bagging algorithm and the decision tree algorithm, the model’s output is determined via either a majority vote or by averaging the outcomes from multiple decision trees. This approach addresses the issue of insufficient predictive accuracy associated with individual decision trees, bolstering the model’s generalization capabilities.
The database is constructed using the computational outcomes derived from standard cementing ECD models, ECD models that account for thermoelastic coupling, and ECD models that factor in irregular wellbore diameters. It encompasses the complete set of results following the variation in parameters such as well depth, displacement timing, flow rate, eccentricity, rheological properties, density, and the irregularity of the wellbore diameter. The model coefficients are defined as n_estimators set to 200, max_samples set to the full data set, and max_features ranging from 3 to 5.

4.2. The Maximum/Minimum ECD Multifactor Weight Analysis During Cementing Operations

The control variables include the injection displacement rate, drilling fluid density, spacer density, cement slurry density, eccentricity, consideration of expanding diameter, and consideration of physical property changes in high-temperature and high-pressure fluids. The data labels and classification are shown in Table 5. A total of 90 groups of four-factor three-level and three-factor two-level experimental schemes were constructed to perform simulation calculations for the maximum/minimum ECD in cementing operations.
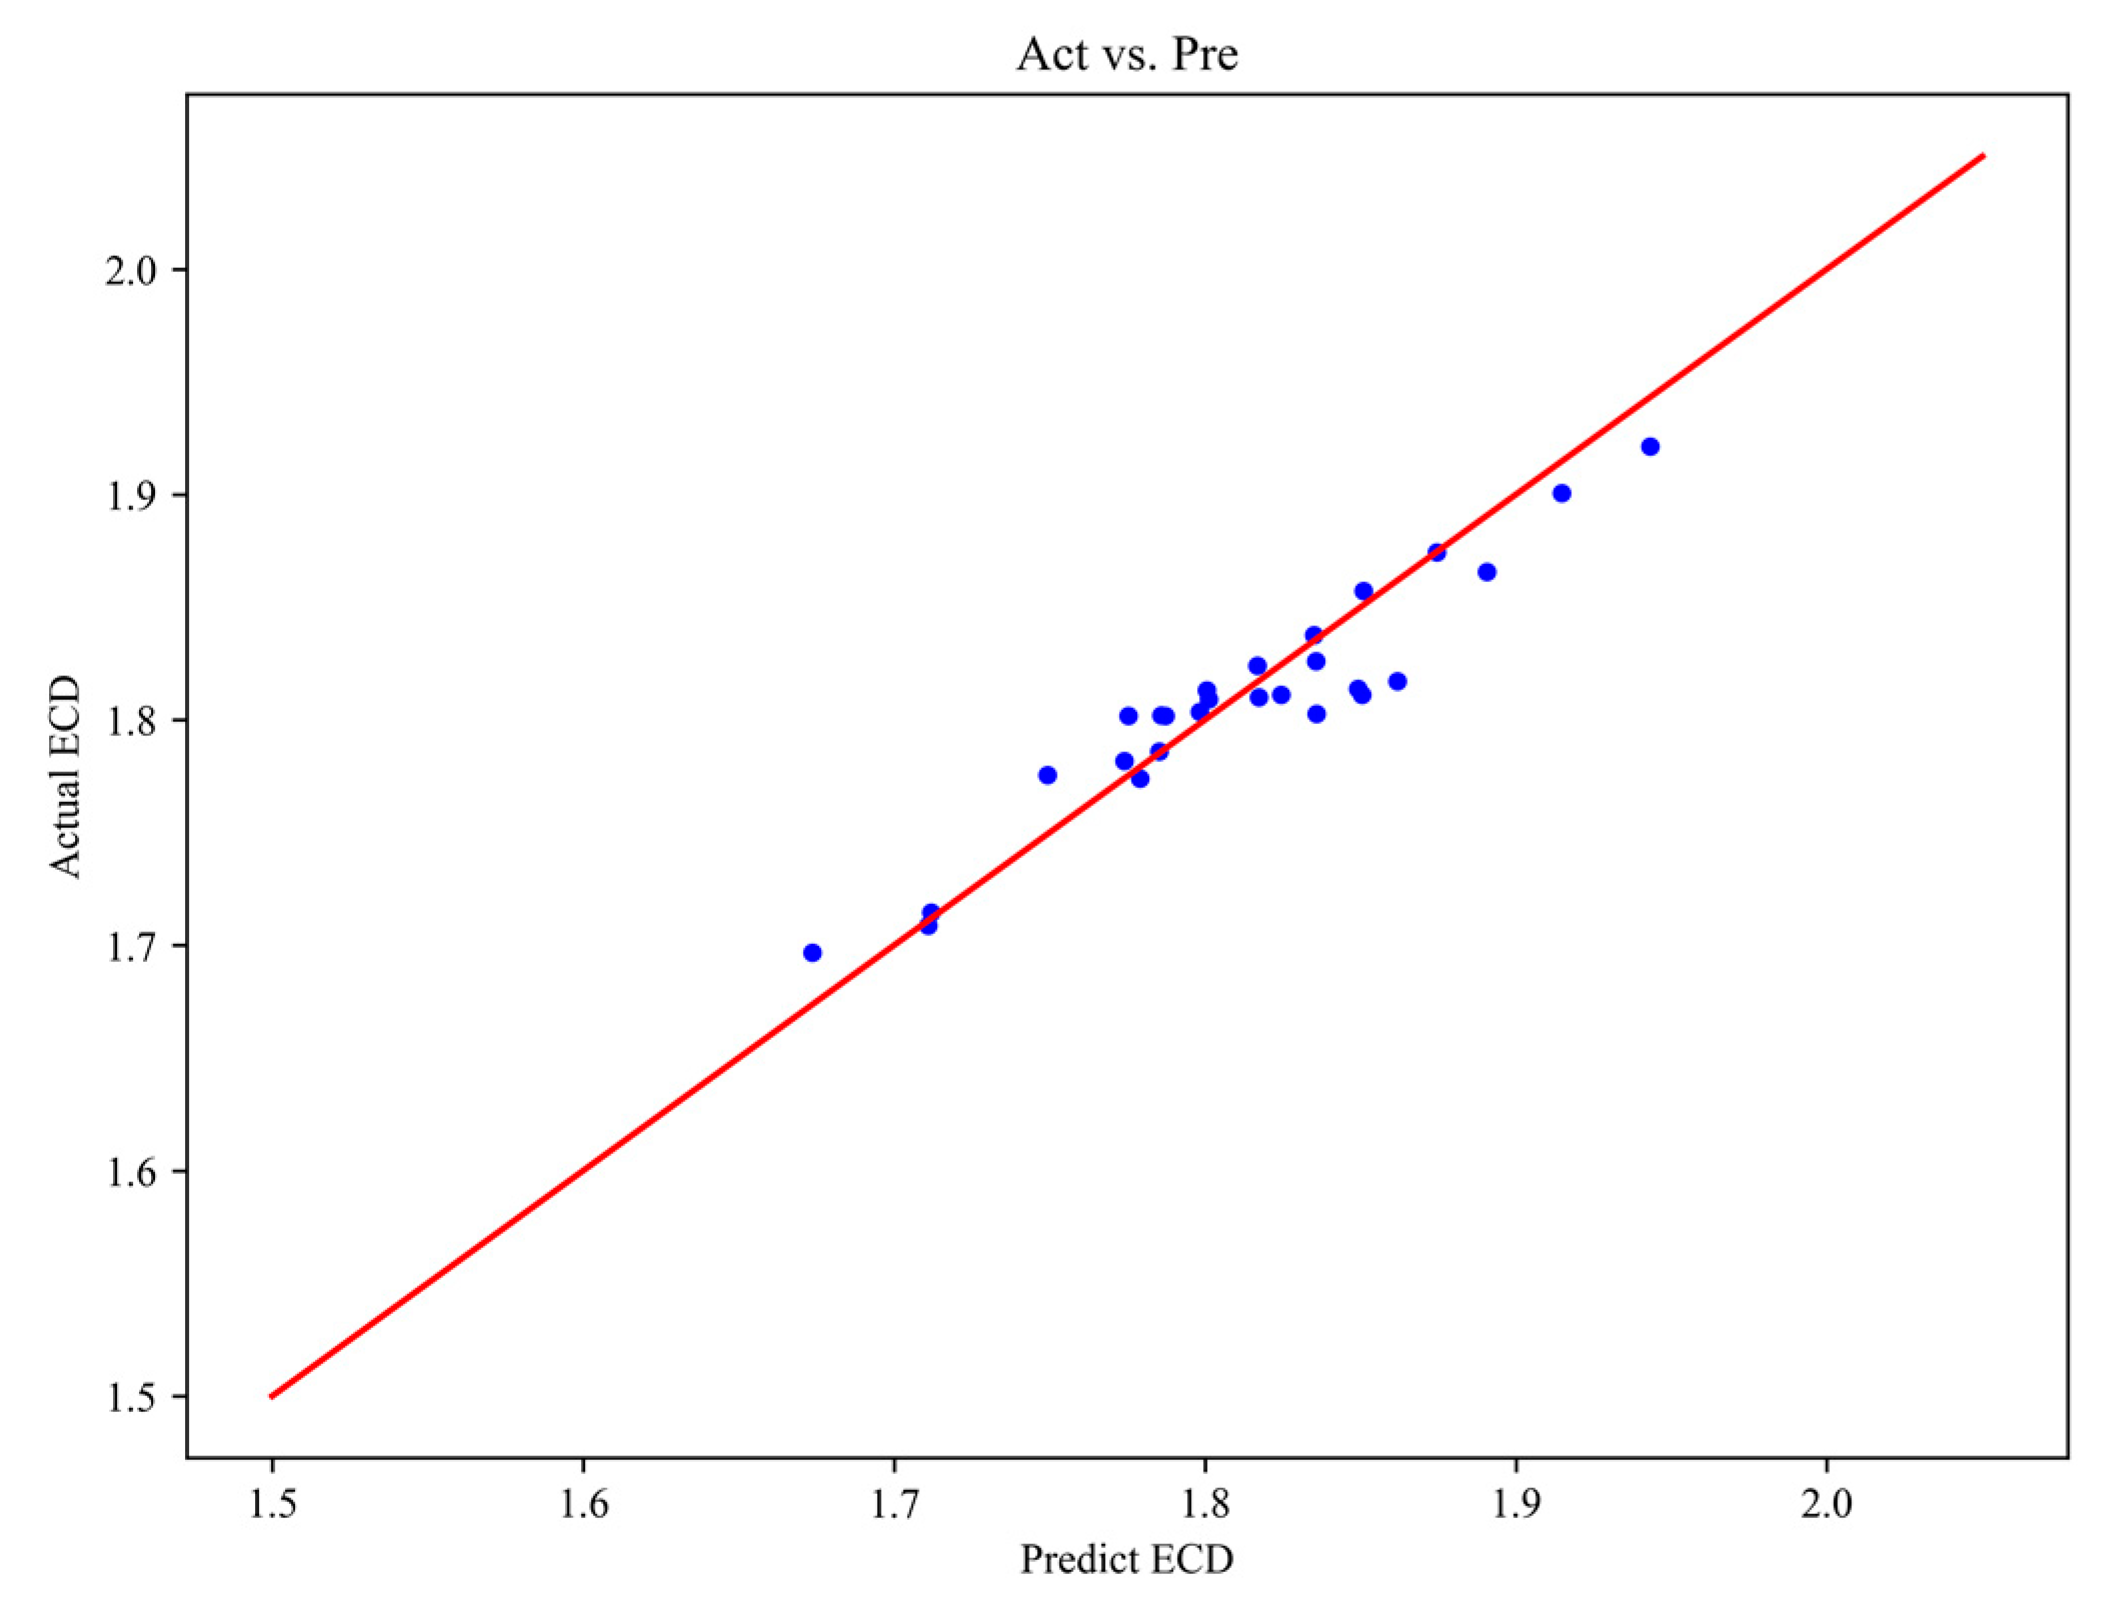
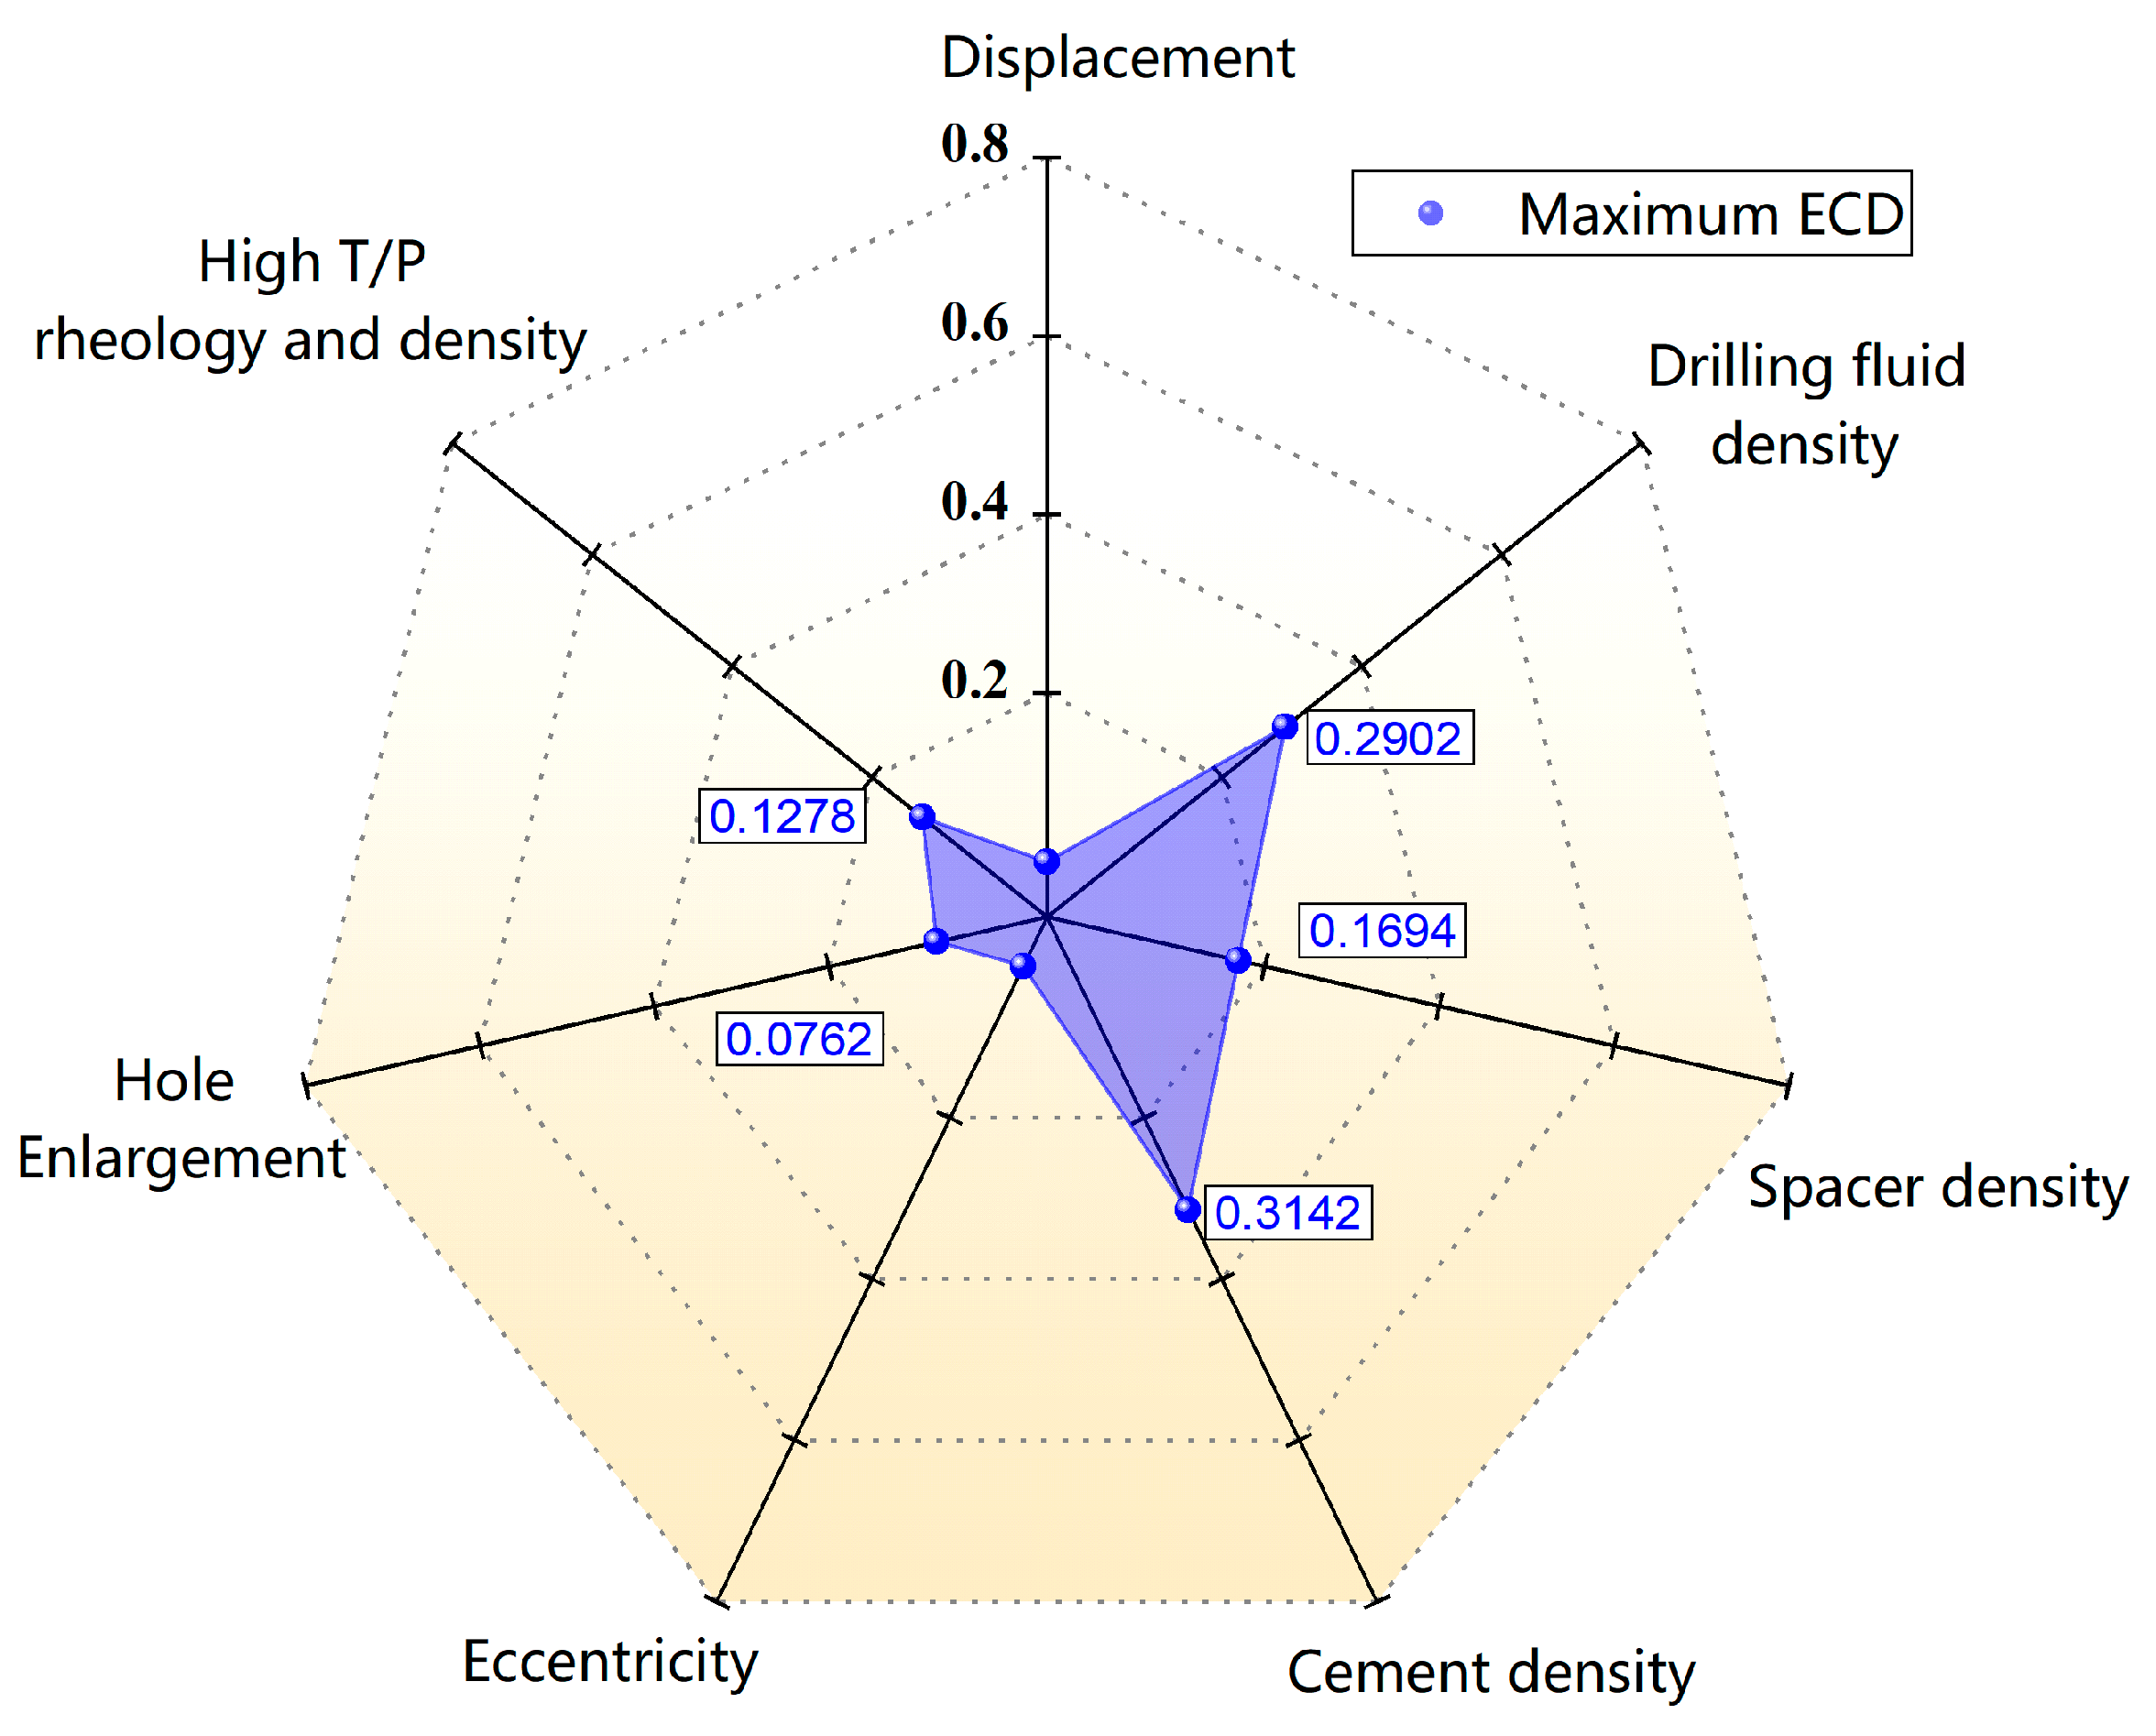
According to the comprehensive weight analysis of the factors influencing the maximum ECD of the annulus using the random forest method, the model parameters were set with estimators at 200, a random state at 42, and a test set proportion at 0.3 with an R2 of 0.8922 and an MSE of 2.84 × 10⁻⁴. The predictive results of the test set compared with the actual values are shown in Figure 9, indicating a good fit for the model. The significance of the factors is presented in Table 6 and Figure 10. According to the results, it can be found that the most significant factors affecting the maximum ECD in the annulus are the density of the drilling fluid, spacer, and cement slurry. Secondary factors include the consideration of high-temperature and high-pressure fluid properties and wellbore irregularity, while eccentricity and displacement volume are non-significant.
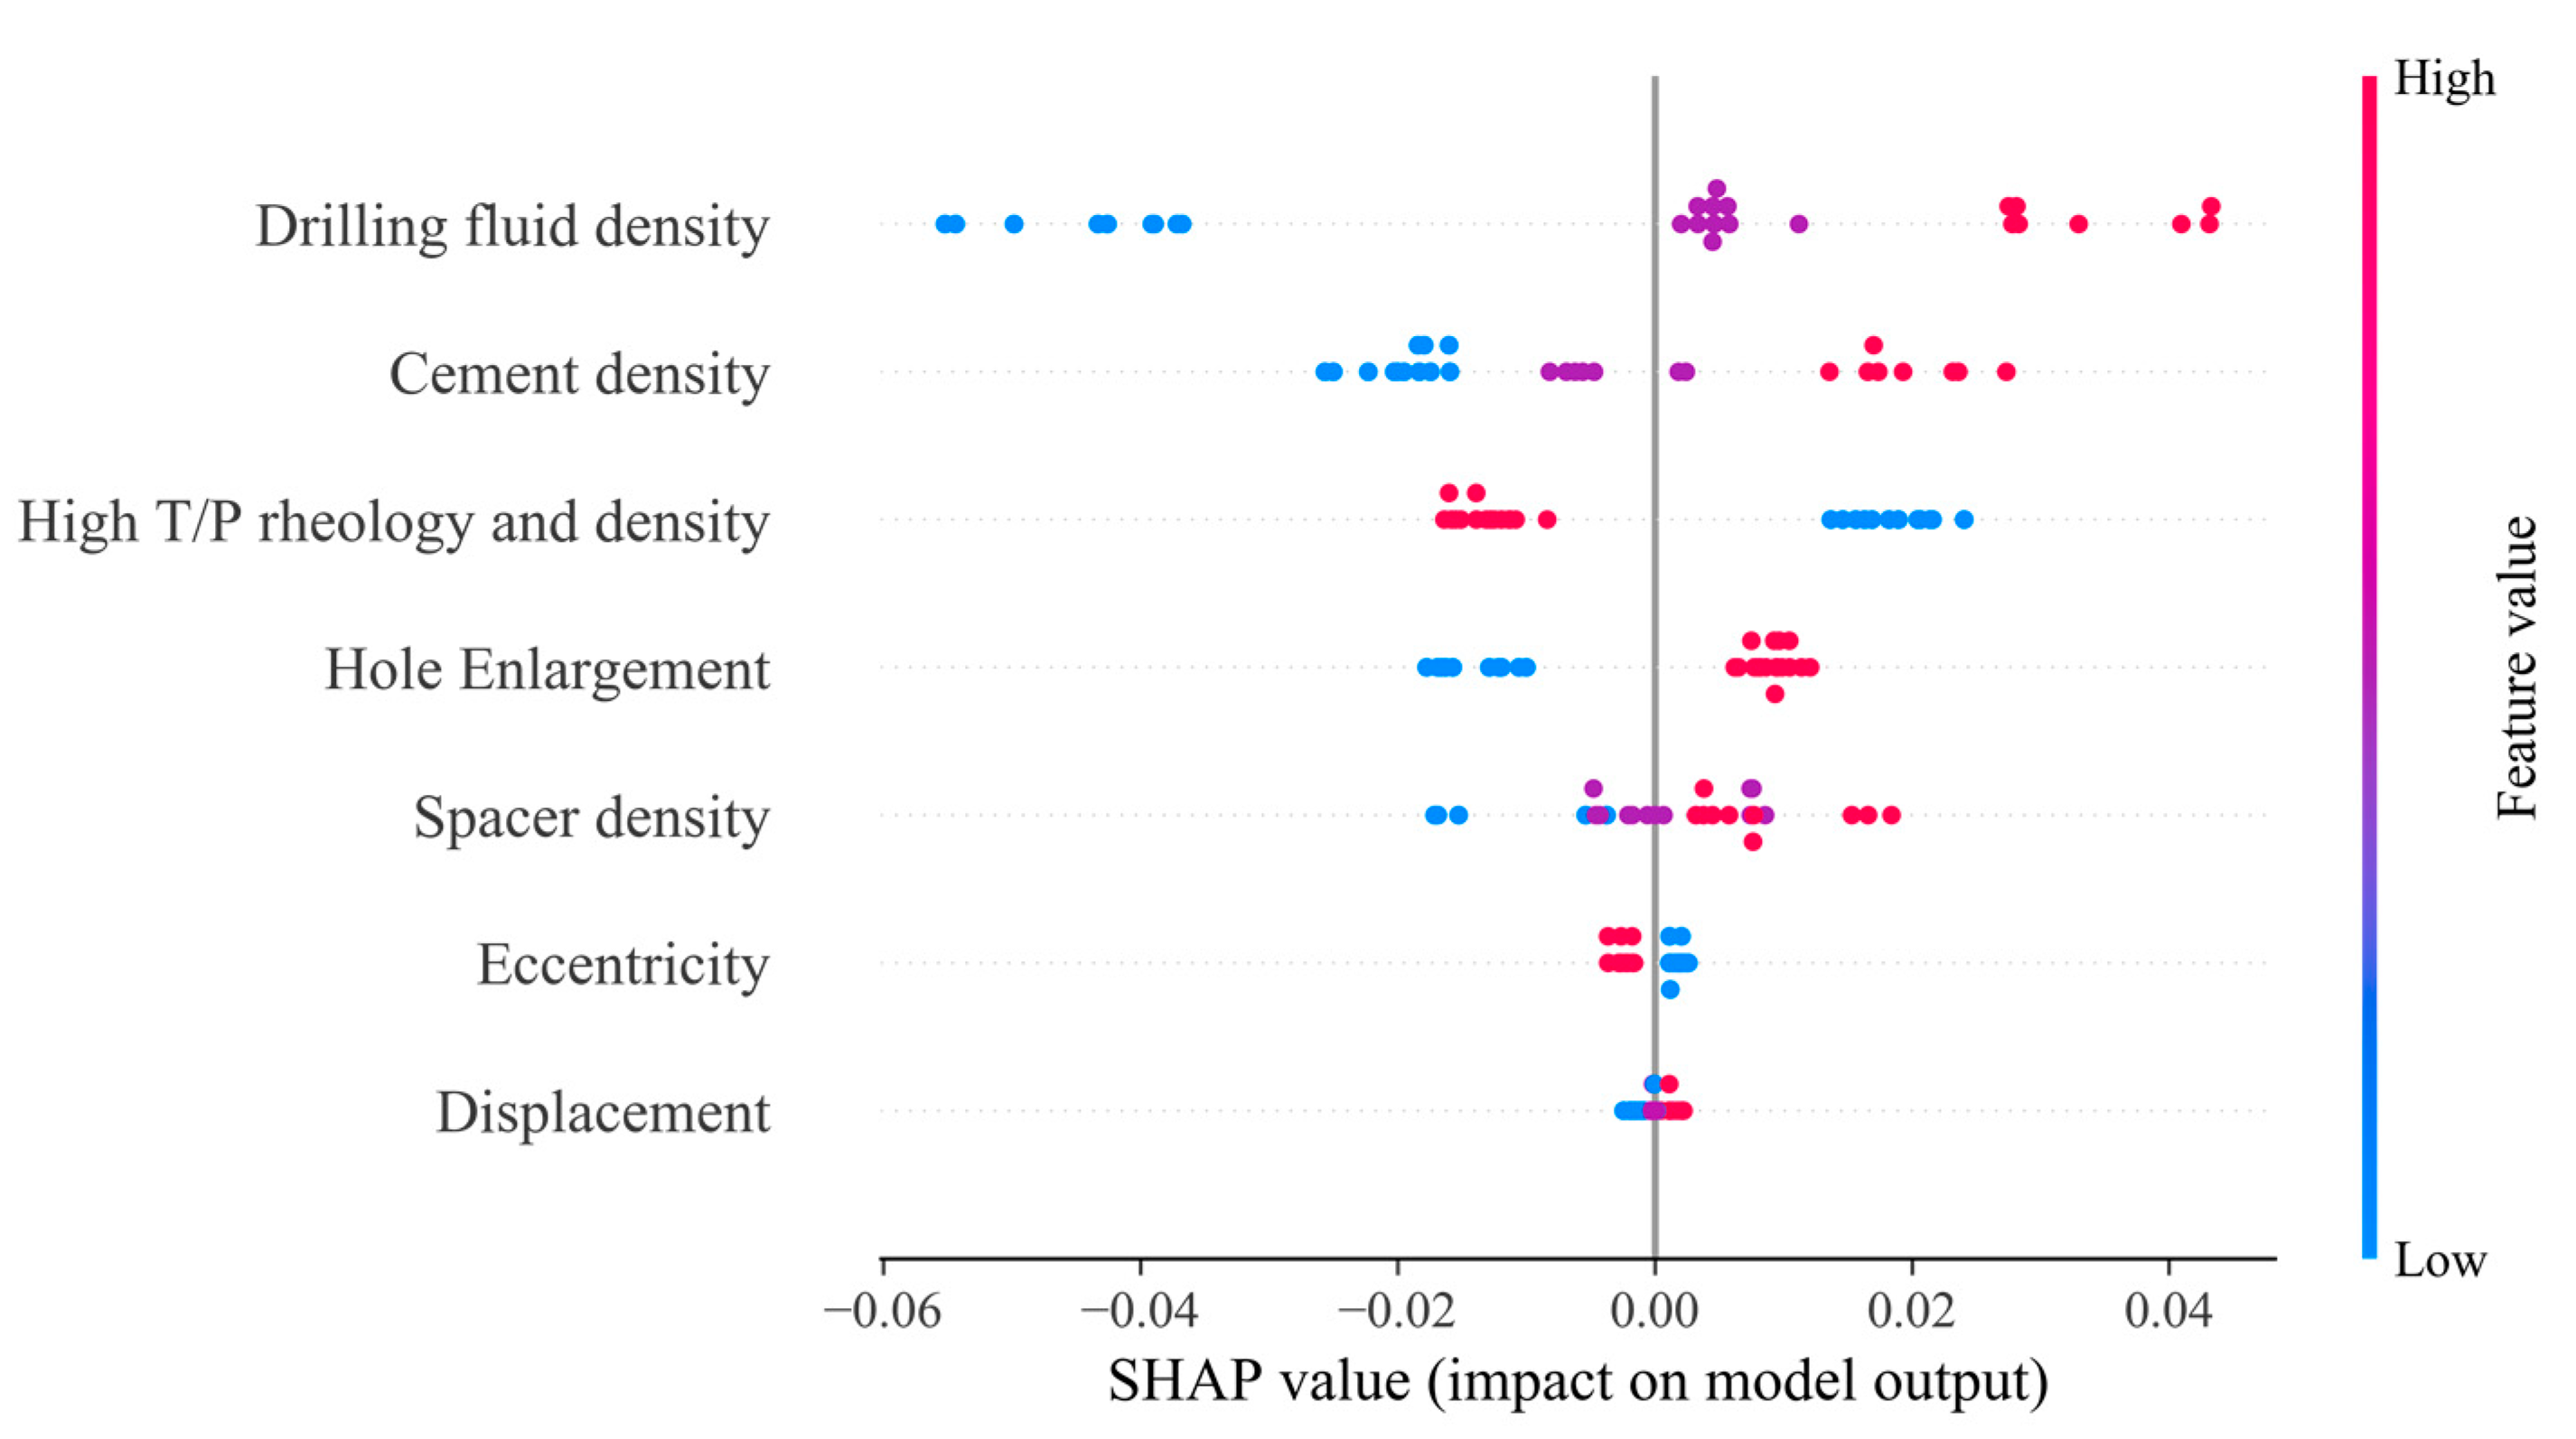
In addition, the positive and negative impacts of factors on ECD need to be analyzed. SHAP (SHapley Additive exPlanations) is an interpretable model inspired by the Shapley value and represents additive explanations. It quantifies the impact of each factor on the prediction outcome. By utilizing the SHAP model for in-depth data analysis, the output value for an individual sample is 0.0793, and the influence of sample factors is shown in Figure 11. This figure shows the impact of each sample’s features on the model’s prediction results. The horizontal axis is the SHAP value, and the vertical axis is the actual value of the feature. The redder the color, the higher the positive impact the feature has on the prediction results, and the bluer the color, the higher the negative impact. Meanwhile, the wider the color area on the horizontal axis, the greater the impact of the feature value on the result. The figure reveals that the flow rate, density of the drilling fluid, spacer, cement slurry, and consideration of wellbore enlargement are positively correlated with the maximum ECD result, while eccentricity and the consideration of high-temperature high-pressure fluid properties are negatively correlated with the outcome.
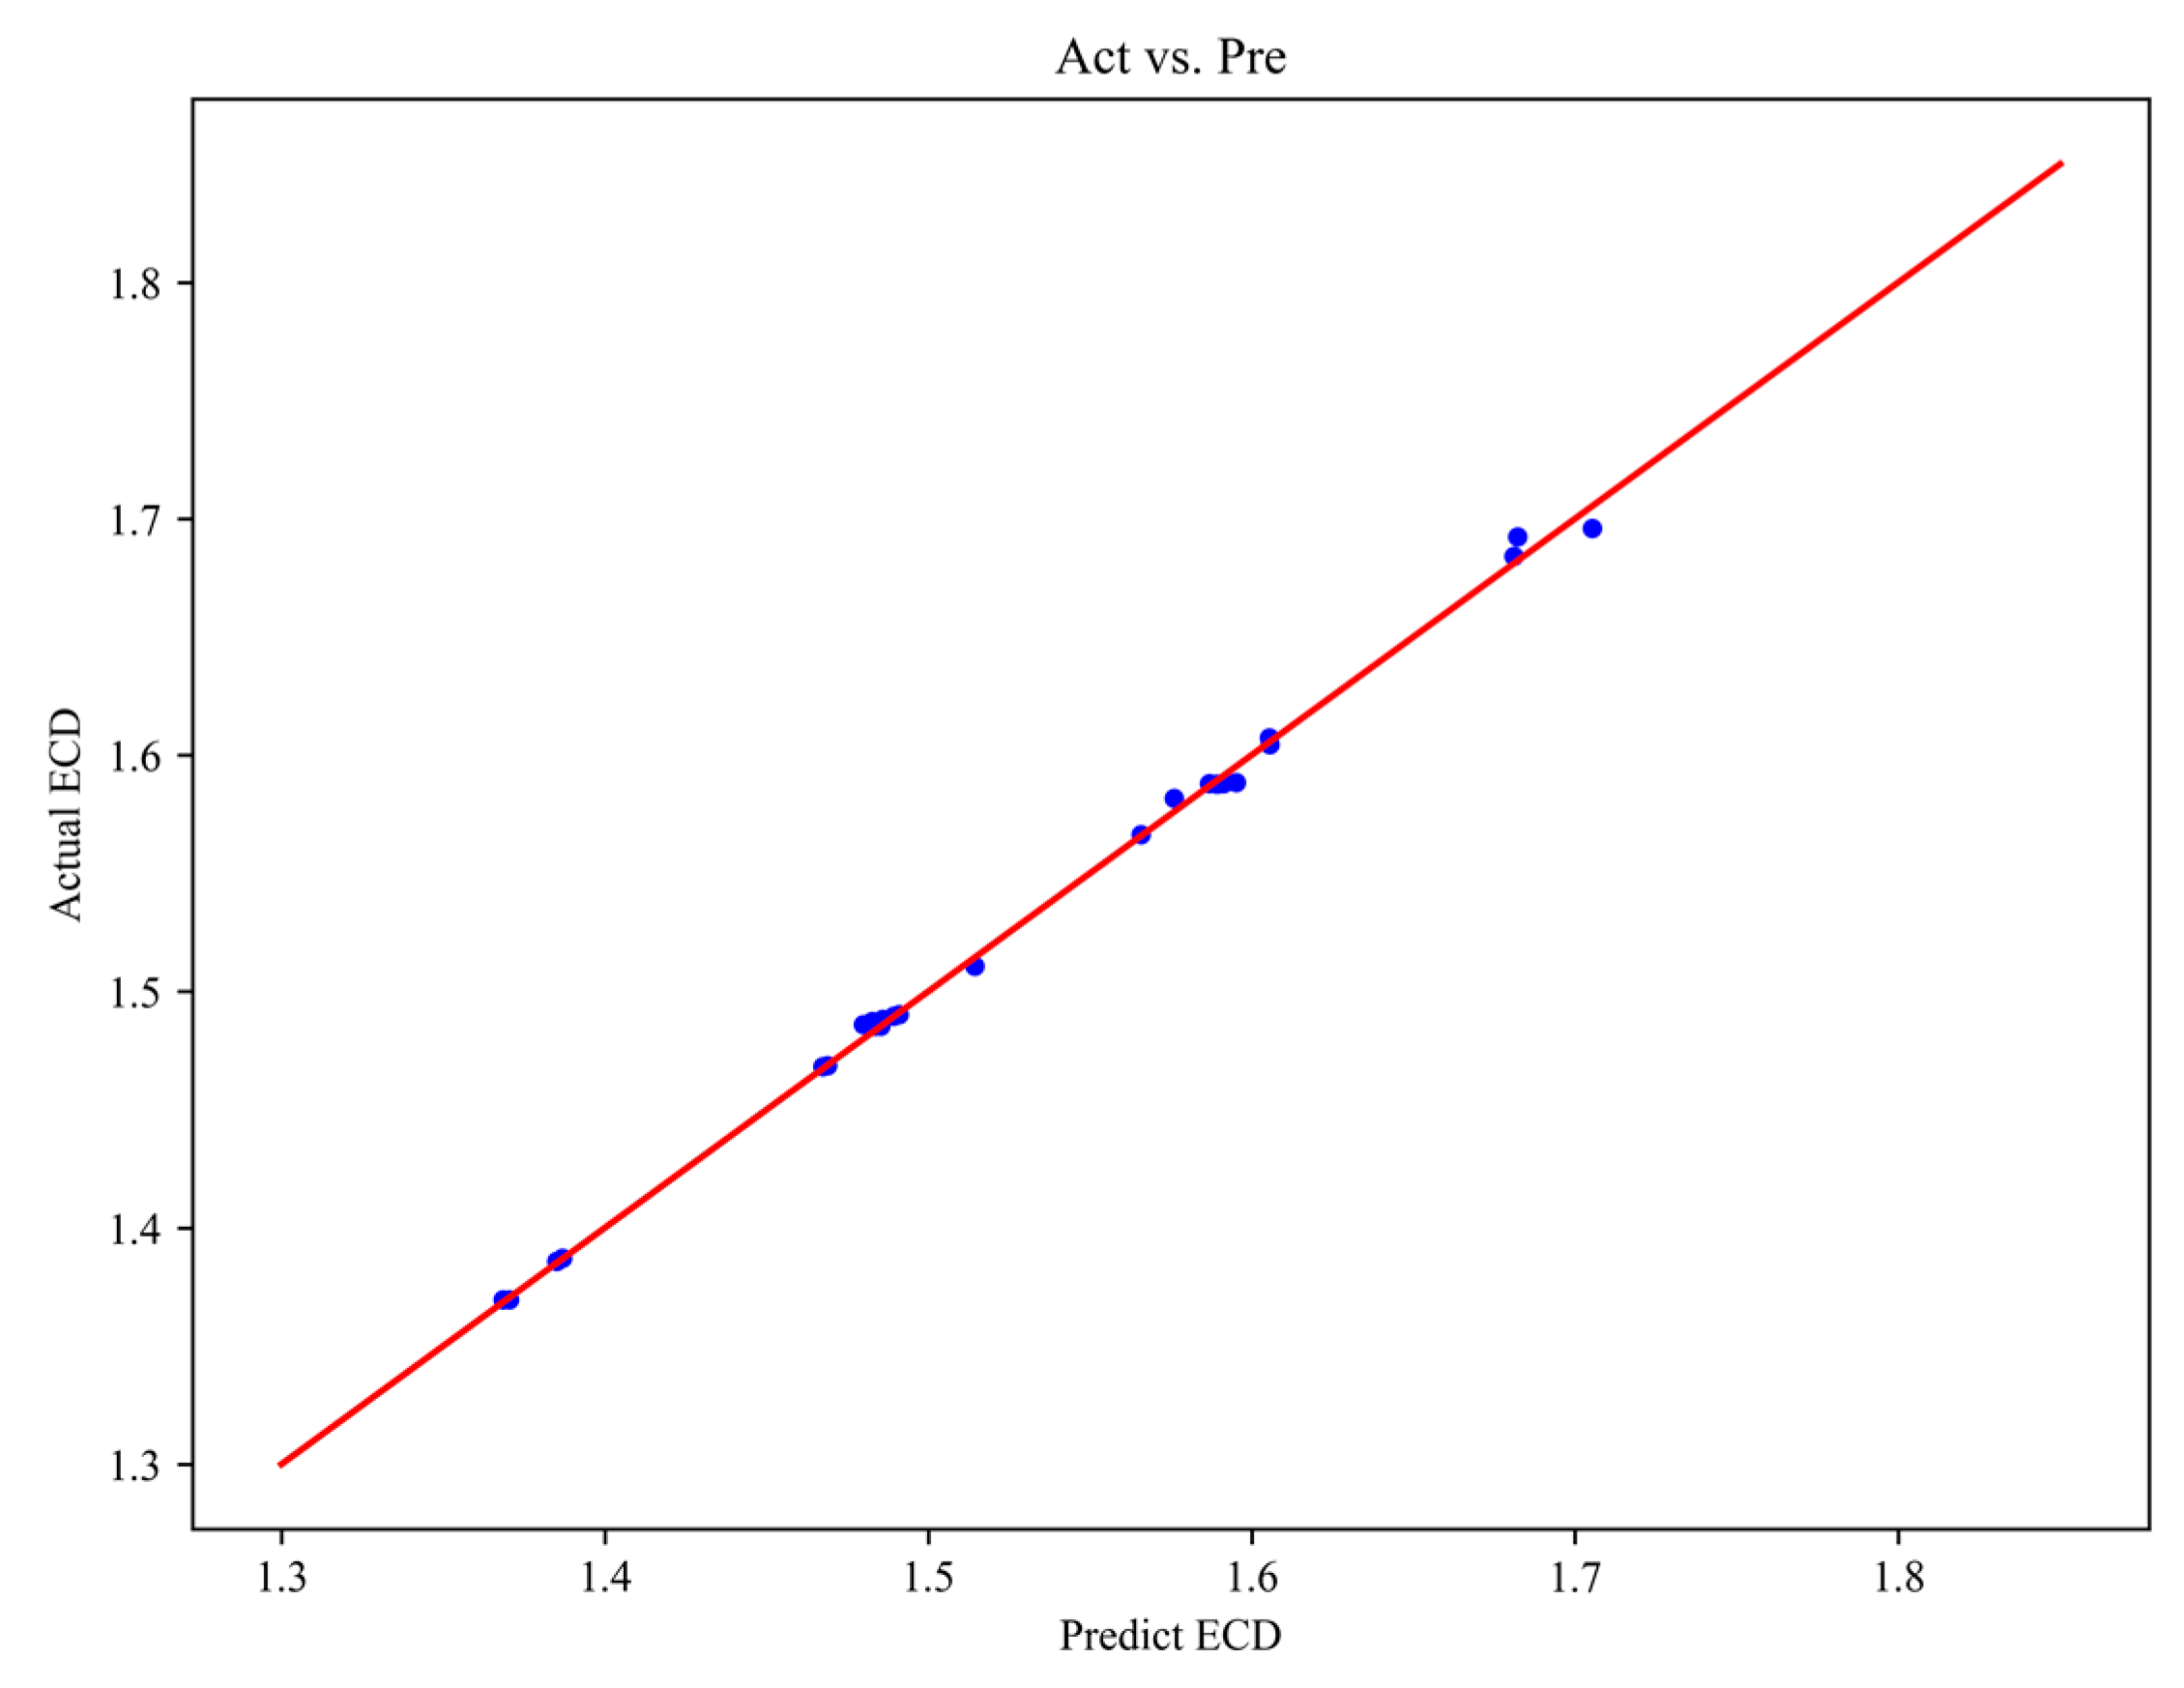
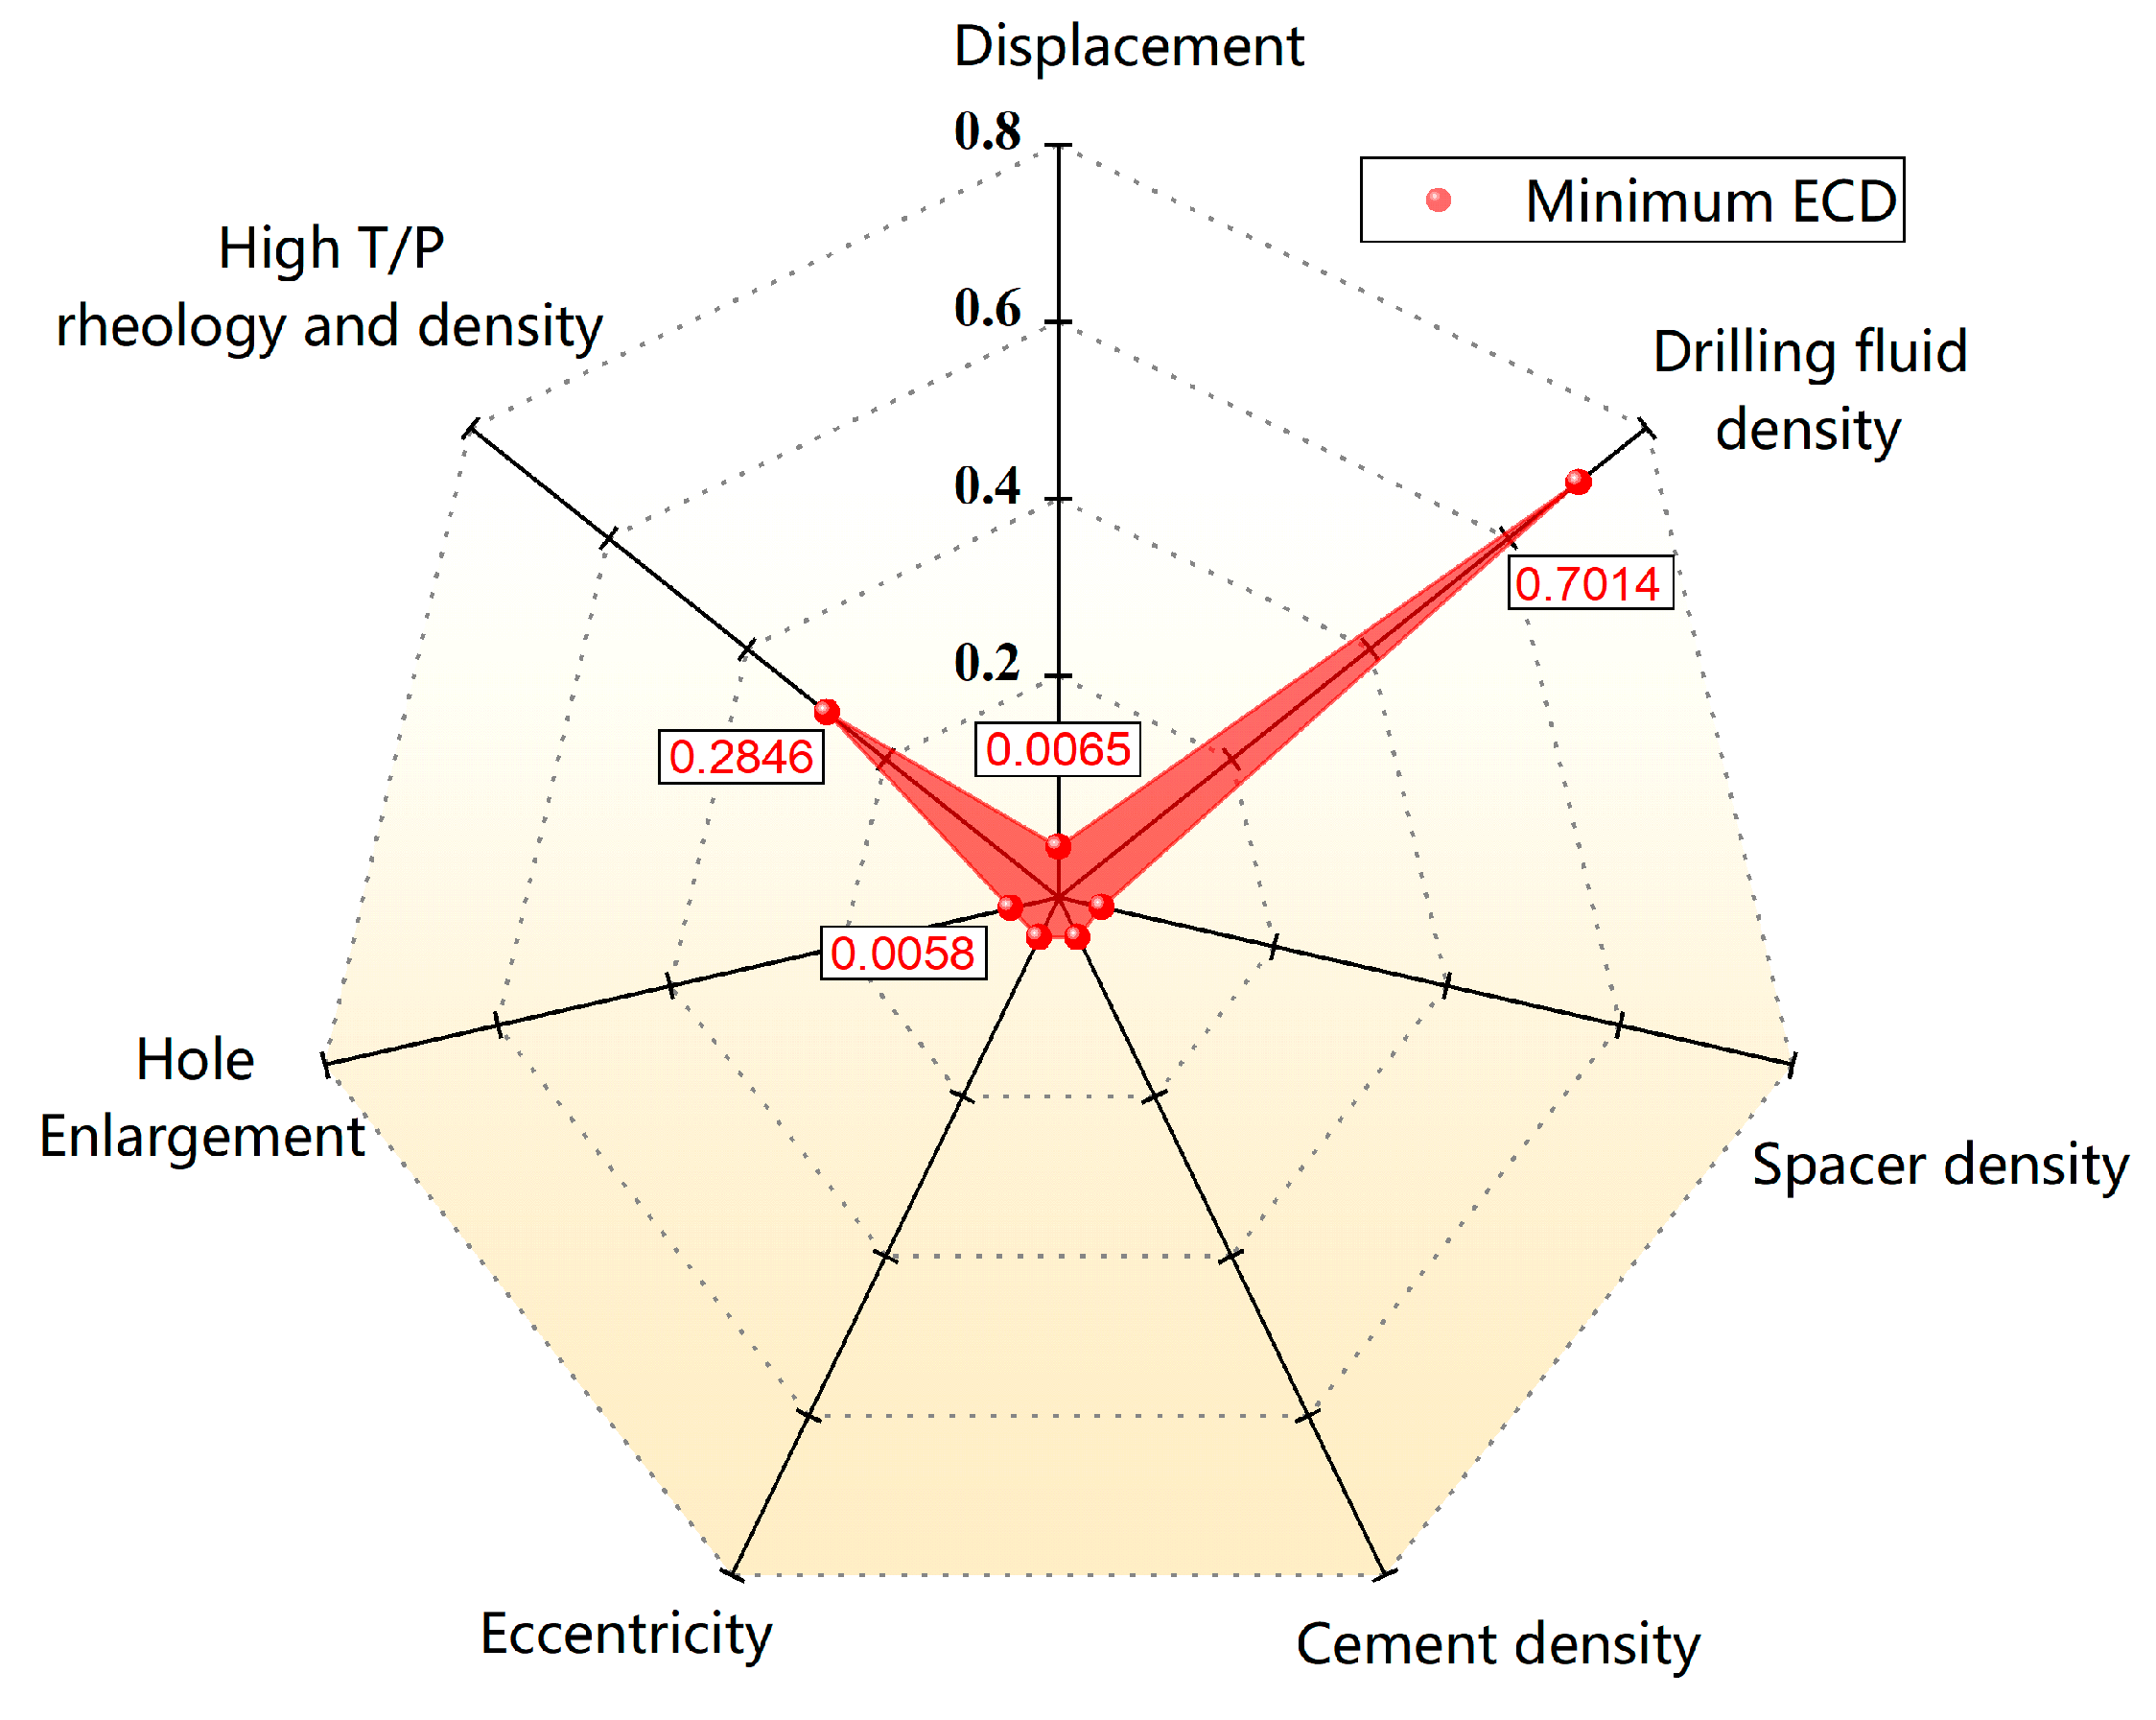
We suggest the readers to refer to the previous analysis path to quantitatively analyze the factors affecting the minimum ECD. The R2 for the minimum ECD model is 0.9982, with an MSE of 1.48 × 10⁻⁵. The predictive results of the test set compared with the actual values are shown in Figure 12, indicating a good fit for the model. The significance of the factors is presented in Table 7 and Figure 13. The results reveal that the most significant factors affecting the minimum ECD in the annulus are the drilling fluid density and the consideration of high-temperature, high-pressure fluid properties. The secondary factors include flow rate and the consideration of wellbore irregularity, while the density of the spacer, cement slurry, and eccentricity are non-significant.
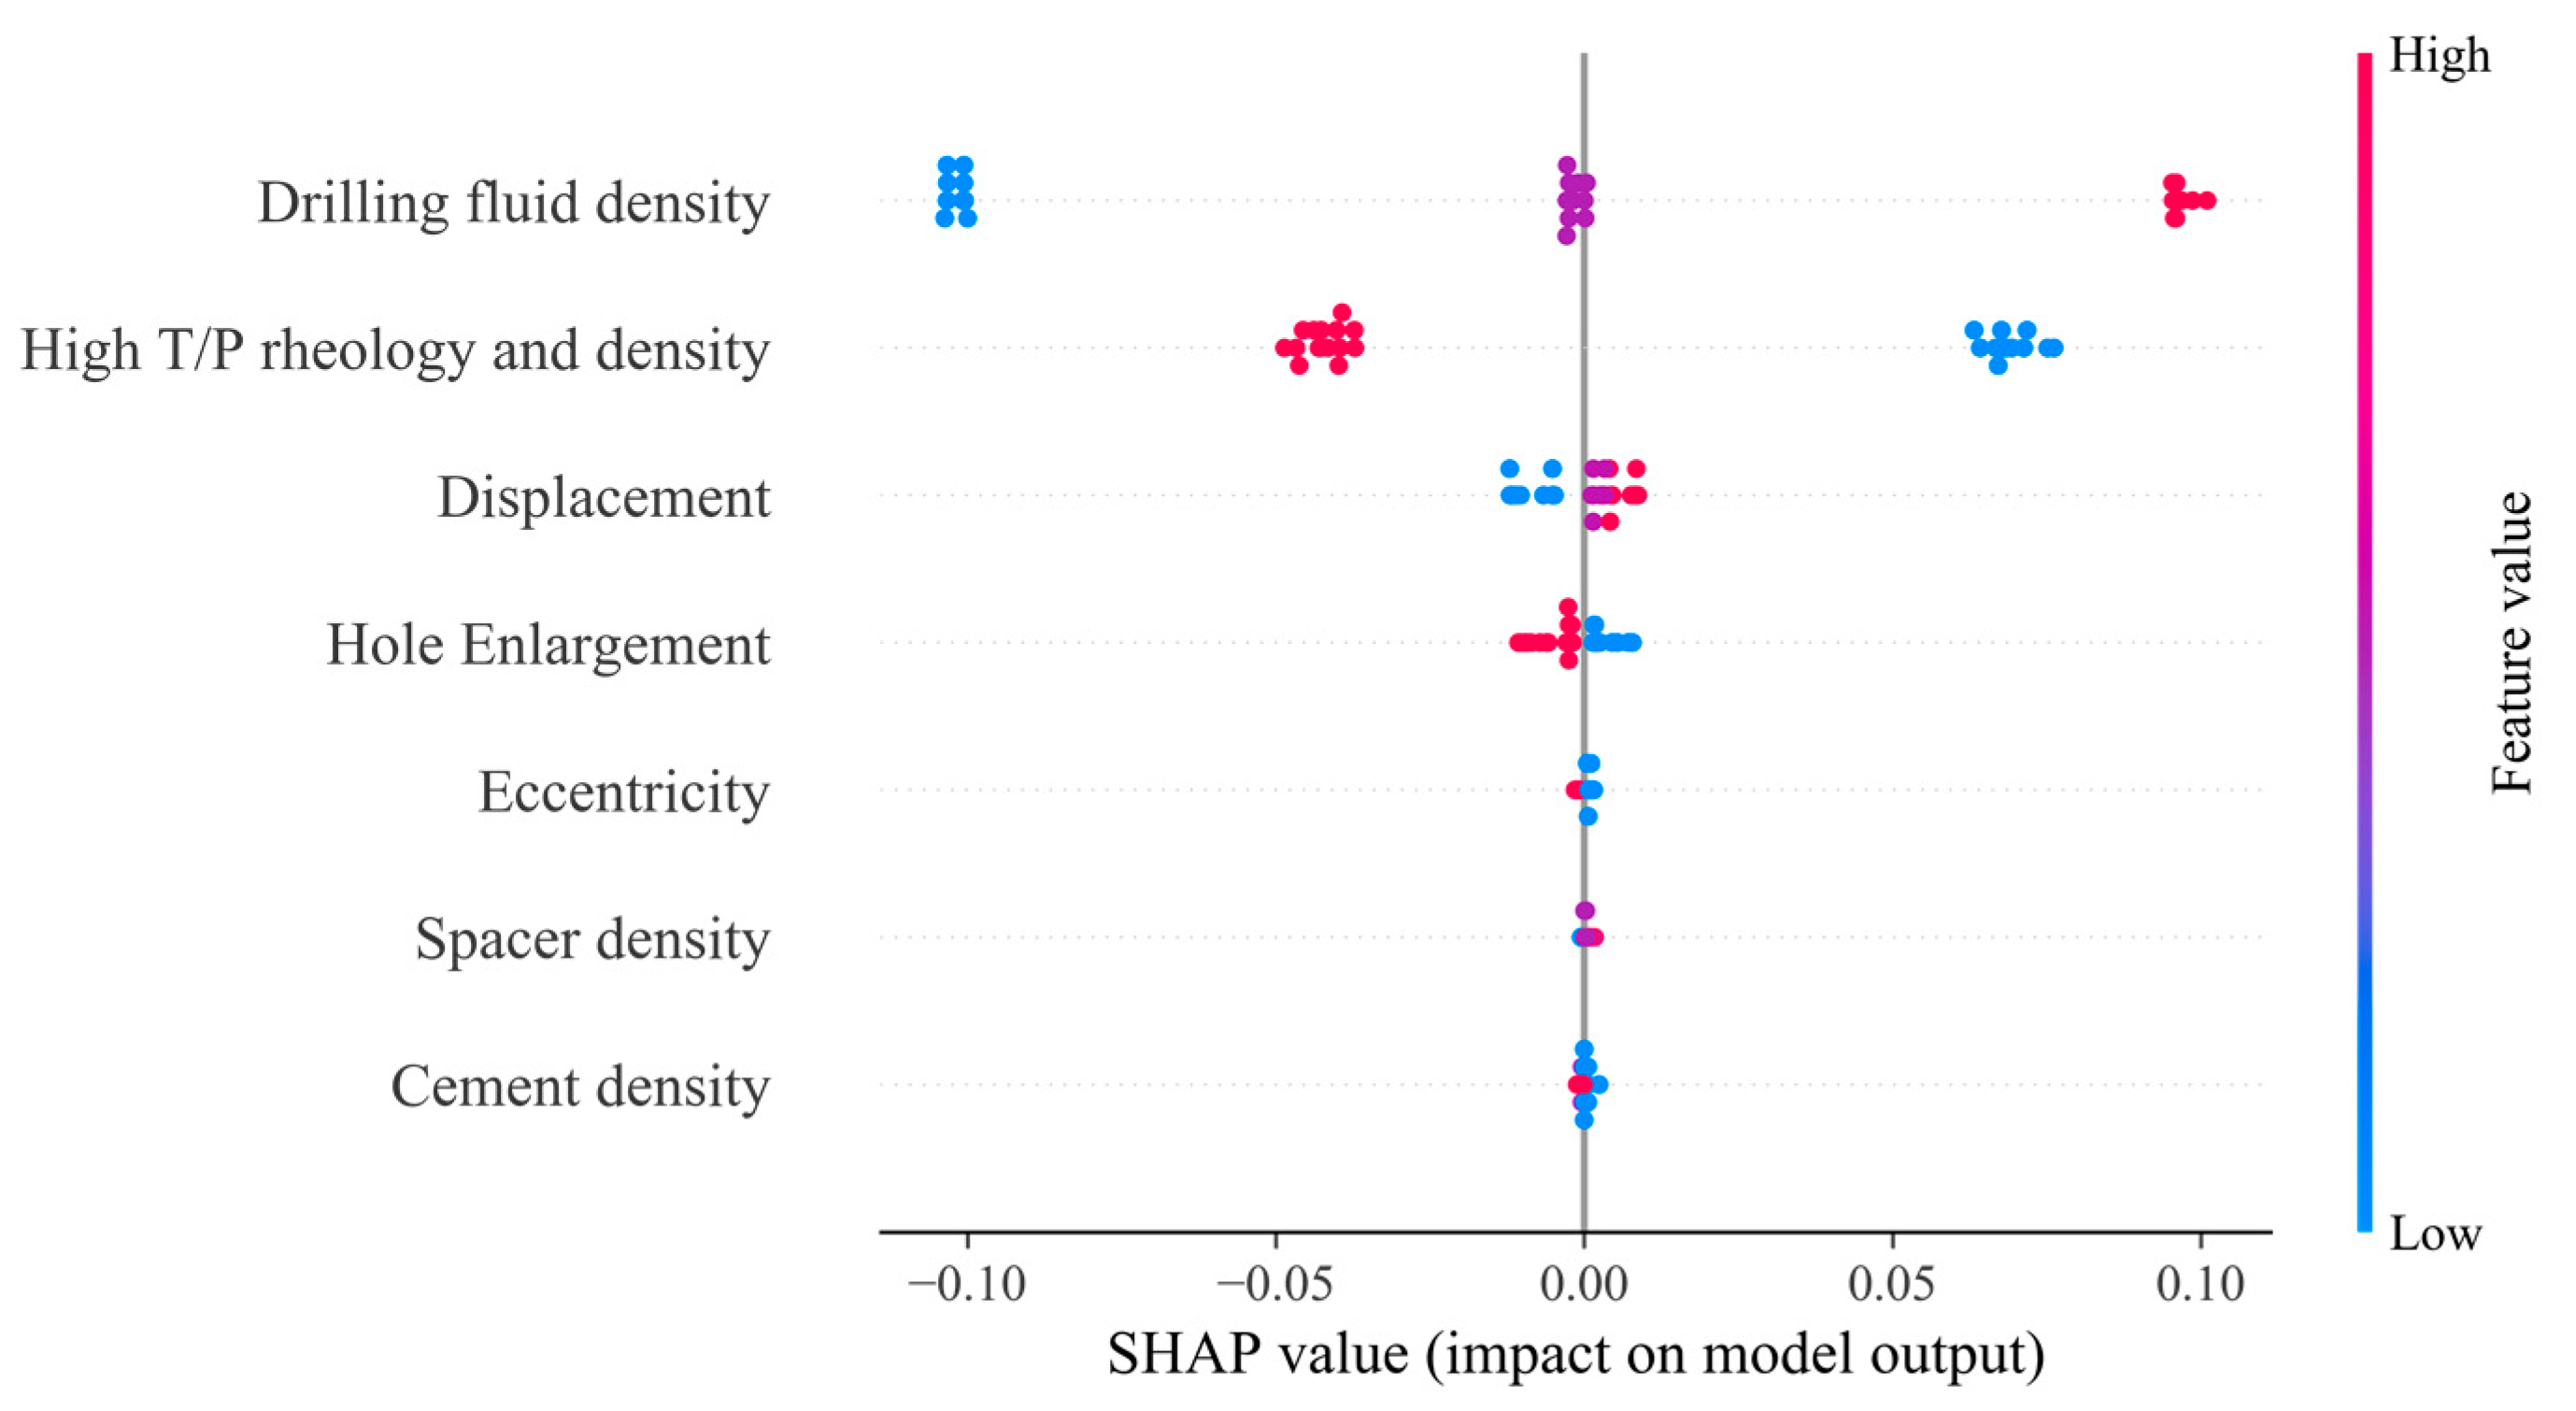
By utilizing the SHAP model for in-depth data analysis, the output value for an individual sample is 0.1297. The influence of sample factors on the result is shown in Figure 14. This figure reveals that the density of the drilling fluid and the flow rate are positively correlated with the minimum ECD result, while high-temperature and high-pressure properties and wellbore enlargement are negatively correlated with the result. The influence of other factors is not significant. This understanding is consistent with the engineering experience, further demonstrating the model’s good interpretability.

5. Conclusions

  • In view of the narrow density window problem faced by deep well drilling and cementing operations, this study establishes a new calculation model for cementing ECD. This new model does not adopt the assumption of a uniform wellbore but instead establishes a multi-layer structure of the wellbore based on an irregular wellbore, further clarifying the impact of irregular well diameter factors on both the downhole and wellbore ECD. The comparison between the model calculation results and the conventional, temperature, and pressure models proves that an irregular well diameter significantly impacts the downhole and wellbore ECD and provides new ideas for the study of deep well ECD control methods.
  • Based on the random forest method, a quantitative analysis of the calculation results of the new model found that the density of cement slurry and drilling fluid has the most significant impact on the maximum ECD, with the impact reaching 0.3142 and 0.2902, respectively. Moreover, the impact of spacer fluid density, rheological changes, and irregular well diameter cannot be ignored. The main factors that affect the minimum ECD are the density and rheological changes in the drilling fluid, reaching 0.7014 and 0.2846.

Author Contributions

Conceptualization, F.Y. and Z.L.; Methodology, J.S.; Software, H.L. and Y.S.; Validation, J.S. and J.Z.; Data curation, Y.S. and J.Z.; Writing—original draft, F.Y. and H.L.; Writing—review & editing, Z.L. All authors have read and agreed to the published version of the manuscript.

Funding

This research study was supported by the scientific research starting project of SWPU (No. 2021QHZ029), the National Natural Science Foundation of China (52274010), and the Sichuan Science and Technology Program (2020JDTD0019).

Institutional Review Board Statement

Not applicable.

Informed Consent Statement

Since this study does not involve humans, Informed Consent Statement were waived for this study.

Data Availability Statement

The original contributions presented in the study are included in the article, further inquiries can be directed to the corresponding author.

Conflicts of Interest

Author Jingyan Zhang was employed by PetroChina Tarim Oilfield Company, CNPC. The remaining authors declare that the re-search was conducted in the absence of any commercial or financial relationships that could be construed as a potential conflict of interest.

References

  1. Hou, Z.; Luo, J.; Xie, Y.; Wu, L.; Huang, L.; Xiong, Y. Carbon Circular Utilization and Partially Geological Sequestration: Potentialities, Challenges, and Trends. Energies 2023, 16, 324. [Google Scholar] [CrossRef]
  2. Xie, Y.; Qi, J.; Zhang, R.; Jiao, X.; Shirkey, G.; Ren, S. Toward a Carbon-Neutral State: A Carbon–Energy–Water Nexus Perspective of China’s Coal Power Industry. Energies 2022, 15, 4466. [Google Scholar] [CrossRef]
  3. Barbosa, C.; Felipe, L.; Iqbal, J. Novel Shear Dependent Cement Slurry System, Tailored to Rescue and Cure Losses when ECD Management and LCM Pills Failed—A Case Study from Southern Iraq. In Proceedings of the Middle East Oil, Gas and Geosciences Show, Manama, Bahrain, 19–21 February 2023. [Google Scholar]
  4. Wu, X.; Li, Z.; Hou, Z.; Liu, J.; Huang, S.; Su, D.; Li, J.; Cao, C.; Wu, L.; Song, W. Analytical Perspectives on Cement Sheath Integrity: A Comprehensive Review of Theoretical Research. ACS Omega 2024, 9, 17741–17759. [Google Scholar] [CrossRef]
  5. Wu, X.; Liu, J.; Li, Z.; Song, W.; Liu, Y.; Shi, Q.; Chen, R. Failure Analysis of Cement Sheath Mechanical Integrity Based on the Statistical Damage Variable. ACS Omega 2023, 8, 2128–2142. [Google Scholar] [CrossRef] [PubMed]
  6. Annis, M. High-Temperature Flow Properties of Water-Base Drilling Fluids. J. Pet. Technol. 1967, 19, 1074–1080. [Google Scholar] [CrossRef]
  7. Zhao, J.; Pillai, S.; Pilon, L. Rheology of colloidal gas aphrons (microfoams) made from different surfactants. Colloids Surf. A Physicochem. Eng. Asp. 2009, 348, 93–99. [Google Scholar] [CrossRef]
  8. Gokdemir, M.G.; Erkekol, S.; Dogan, H.A. Investigation of High Pressure Effect on Drilling Fluid Rheology. In Proceedings of the ASME 2017 36th International Conference on Ocean, Offshore and Arctic Engineering, Trondheim, Norway, 25–30 June 2017. [Google Scholar]
  9. Ye, Y.; Fan, H.; Liu, Y. A New Approach for Predicting the Rheological Properties of Oil-Based Drilling Fluids under High Temperature and High Pressure Based on a Parameter-Free Method. Appl. Sci. 2023, 13, 8592. [Google Scholar] [CrossRef]
  10. Hashemian, Y.; Yu, M.; Shirazi, S.; Ahmed, R. Accurate Predictions of Velocity Profiles and Frictional Pressure Losses in Annular YPL-Fluid Flow. J. Can. Pet. Technol. 2014, 6, 355–363. [Google Scholar] [CrossRef]
  11. Dokhani, V.; Ma, Y.; Li, Z.; Geng, T.; Yu, M. Effects of drill string eccentricity on frictional pressure losses in annuli. J. Pet. Sci. Eng. 2020, 187, 106853. [Google Scholar] [CrossRef]
  12. Heshamudin, N.S.; Katende, A.; Rashid, H.A.; Ismail, I.; Sagala, F.; Samsuri, A. Experimental investigation of the effect of drill pipe rotation on improving hole cleaning using water-based mud enriched with polypropylene beads in vertical and horizontal wellbores. J. Petrol. Sci. Eng. 2019, 179, 1173–1185. [Google Scholar] [CrossRef]
  13. Katende, A.; Segar, B.; Ismail, I.; Sagala, F.; Saadiah, H.H.A.R.; Samsuri, A. The effect of drill–pipe rotation on improving hole cleaning using polypropylene beads in water-based mud at different hole angles. J. Pet. Explor. Prod. Technol. 2020, 10, 1253–1262. [Google Scholar] [CrossRef]
  14. Yeu, W.J.; Katende, A.; Sagala, F.; Ismail, I. Improving hole cleaning using low density polyethylene beads at different mud circulation rates in different hole angles. J. Nat. Gas. Sci. Eng. 2019, 61, 333–343. [Google Scholar] [CrossRef]
  15. Babu, D.R. Effect of P–ρ–T behavior of muds on lossrgain during high-temperature deep-well drilling. J. Petrol. Sci. Eng. 1998, 20, 49–62. [Google Scholar] [CrossRef]
  16. Yuan, B.; Li, J.; Xu, B.; Su, Y.; Li, B.; Yang, L. Managed wellhead backpressure during waiting setting of managed pressure cementing. J. Petrol. Sci. Eng. 2021, 207, 109158. [Google Scholar] [CrossRef]
  17. Liang, H.; Liu, G.; Zou, J.; Bai, J.; Jiang, Y. Research on calculation model of bottom of the well pressure based on machine learning. Future Gener. Comput. Syst. 2021, 124, 80–90. [Google Scholar] [CrossRef]
  18. Kumar, A.; Ridha, S.; Ganet, T.; Vasant, P.; Ilyas, S.U. Machine Learning Methods for Herschel–Bulkley Fluids in Annulus: Pressure Drop Predictions and Algorithm Performance Evaluation. Appl. Sci. 2020, 10, 2588. [Google Scholar] [CrossRef]
  19. Binger, Z.M.; Achilli, A. Surrogate modeling of pressure loss & mass transfer in membrane channels via coupling of computational fluid dynamics and machine learning. Desalination 2023, 548, 116241. [Google Scholar] [CrossRef]
  20. McMordie, W.C., Jr.; Bland, R.G.; Hauser, J.M. Effect of Temperature and Pressure on the Density of Drilling Fluids. In Proceedings of the SPE Annual Technical Conference and Exhibition, New Orleans, LA, USA, 26–29 September 1982. [Google Scholar]
  21. Osman, E.A. Determination of Drilling Mud Density Change with Pressure and Temperature Made Simple and Accurate by ANN. In Proceedings of the Middle East Oil Show, Manama, Bahrain, 9–12 June 2003. [Google Scholar]
  22. Alade, O.; Mahmoud, M.; Al-Nakhli, A. Rheological studies and numerical investigation of barite sag potential of drilling fluids with thermochemical fluid additive using computational fluid dynamics (CFD). J. Petrol. Sci. Eng. 2023, 220, 111179. [Google Scholar] [CrossRef]
  23. Dokhani, V.; Ma, Y.; Yu, M. Determination of equivalent circulating density of drilling fluids in deepwater drilling. J. Nat. Gas. Sci. Eng. 2016, 34, 1096–1105. [Google Scholar] [CrossRef]
  24. Yang, M.; Luo, D.; Chen, Y.; Li, G.; Tang, D.; Meng, Y. Establishing a practical method to accurately determine and manage wellbore thermal behavior in high-temperature drilling. Appl. Energy 2019, 238, 1471–1483. [Google Scholar] [CrossRef]
  25. Flayh, S.J.; Sultan, H.S.; Alshara, A.K. Numerical study of drilling fluids pressure drop in wellbores with pipe rotation. IOP Conf. Ser. Mater. Sci. Eng. 2019, 518, 32037. [Google Scholar] [CrossRef]
  26. Meng, Y.; Yang, M.; Liu, S.; Mou, Y.; Peng, C.; Zhou, X. Quantitative Assessment of the Importance of Bio-physical Drivers of Land Cover Change. Ecol. Inform. 2020, 61, 101204. [Google Scholar] [CrossRef]
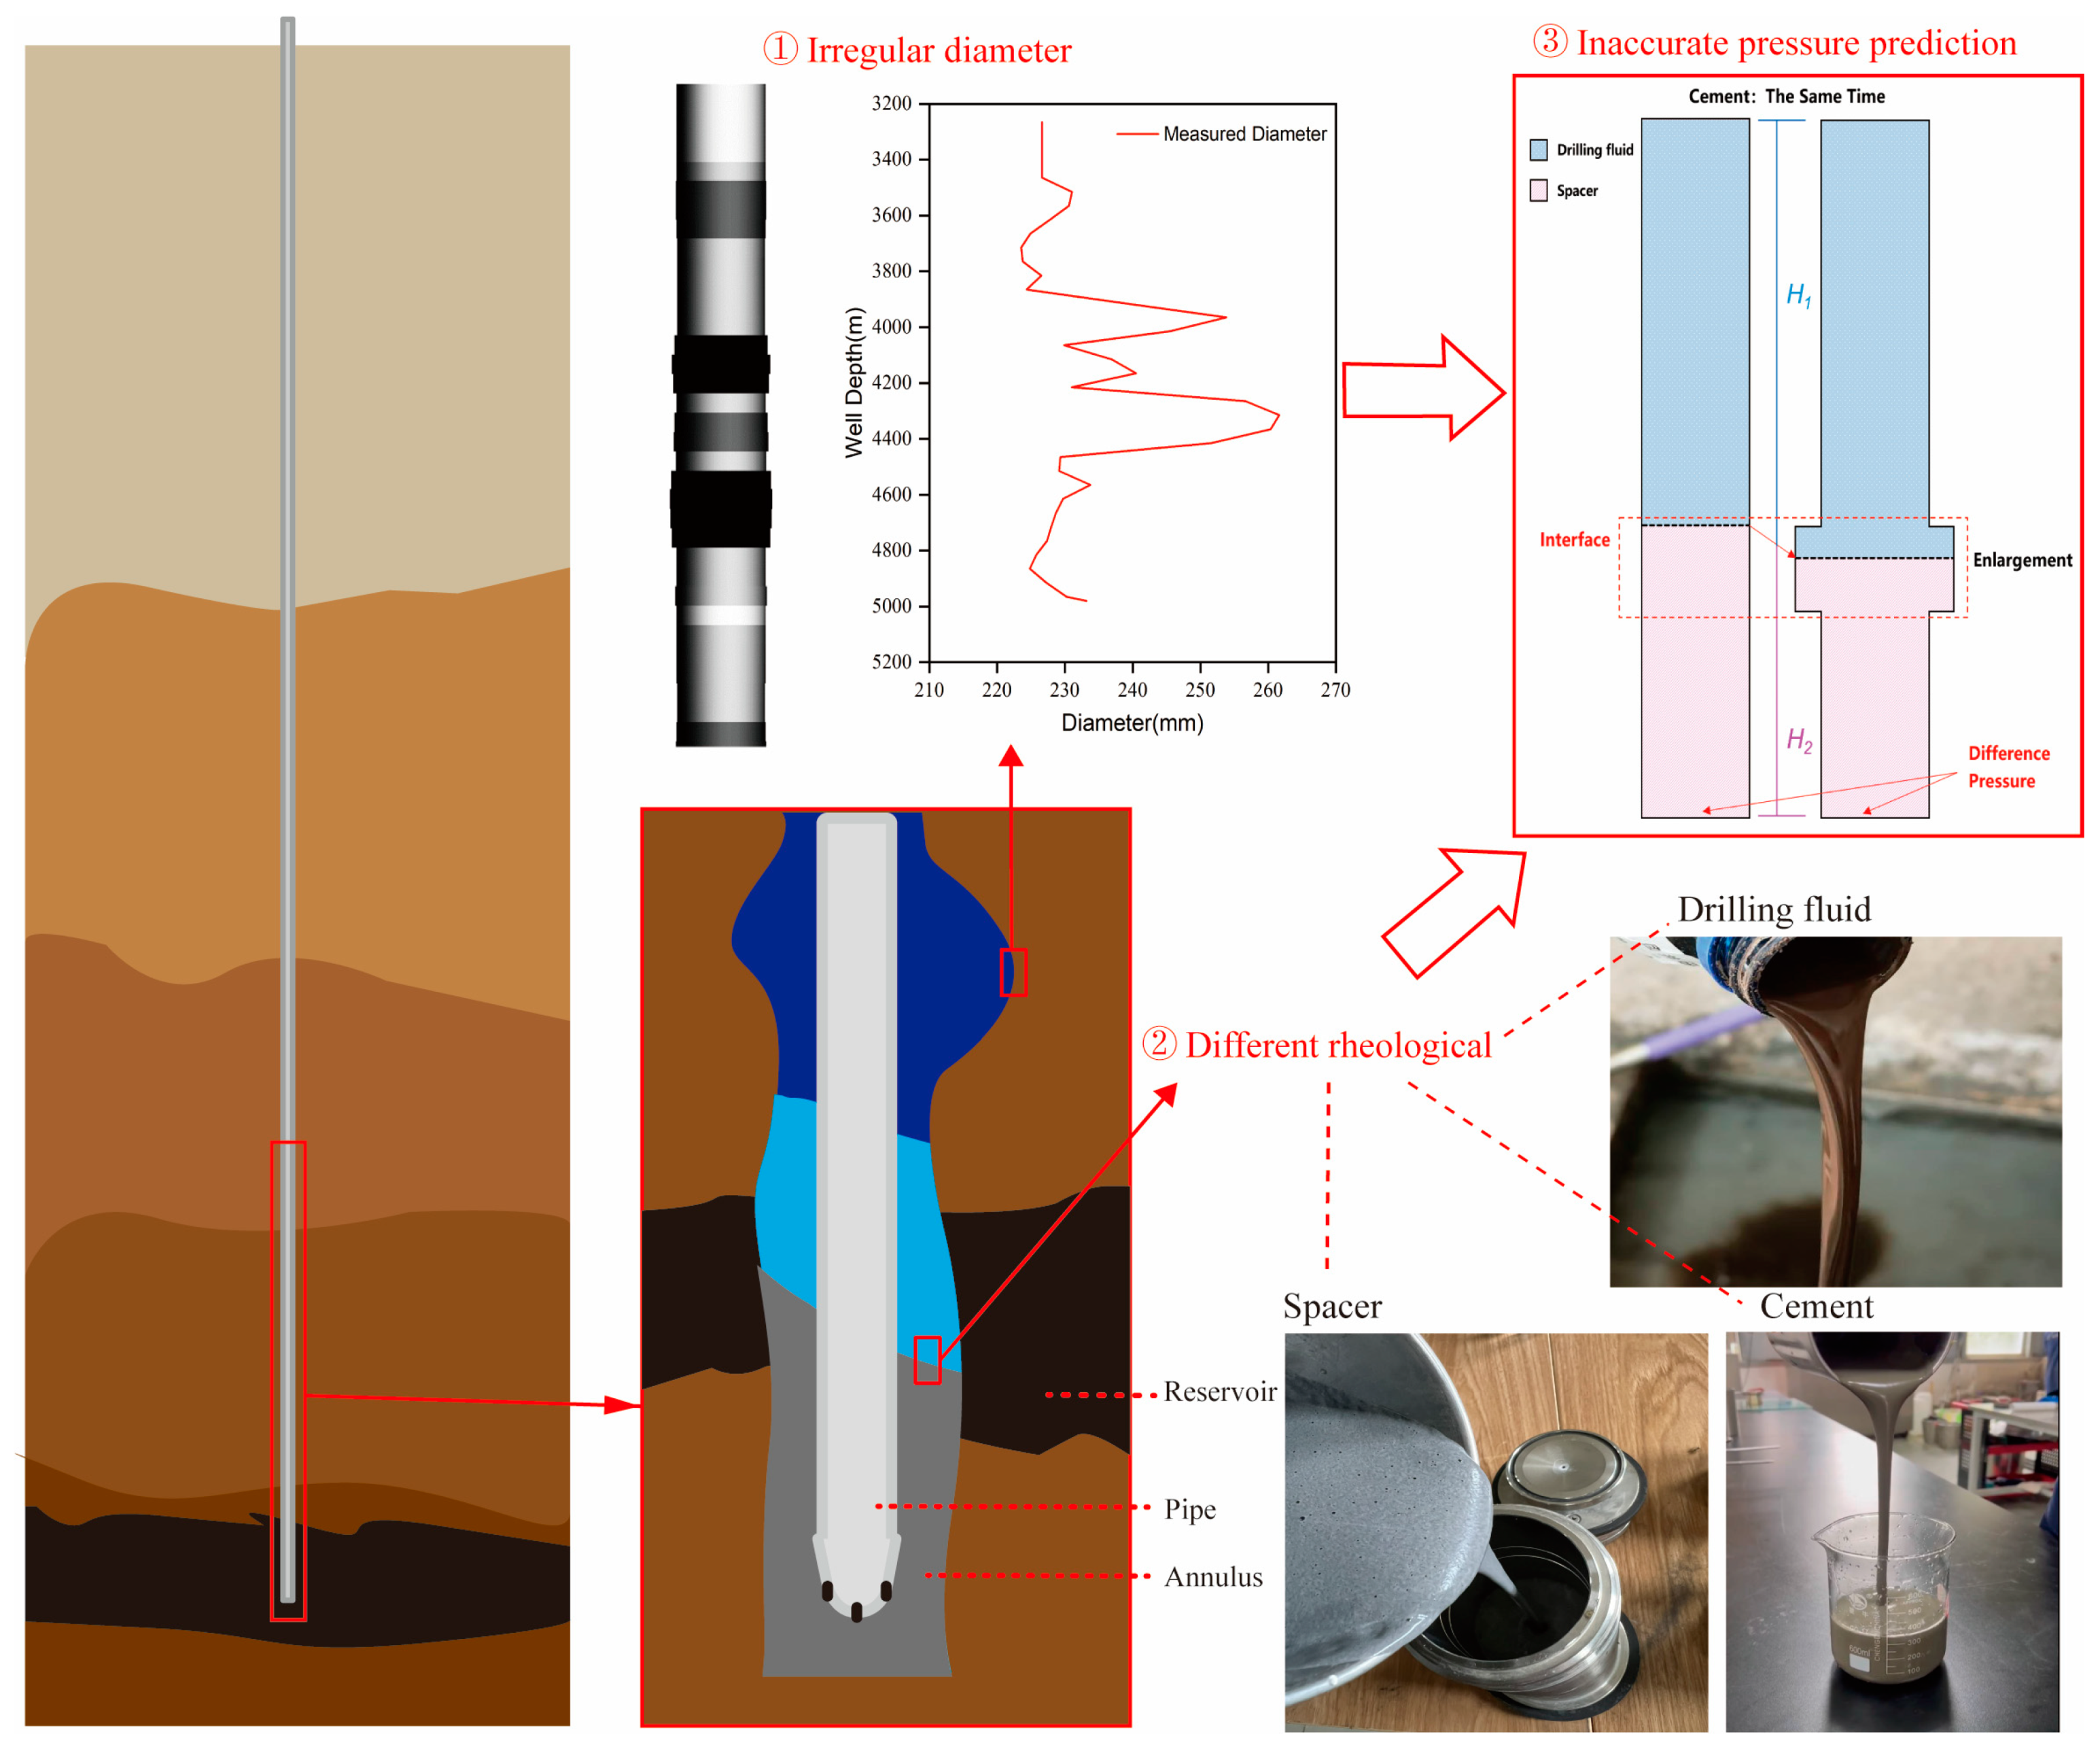
Figure 1. Impact of the fluid properties and irregular diameter on pressure prediction during cementing.
Applsci 14 09573 g001
Figure 2. Well log diameter curve.
Applsci 14 09573 g002
Figure 3. Wellbore comparison map.
Applsci 14 09573 g003
Figure 4. The prediction of eccentricity.
Applsci 14 09573 g004
Figure 5. Chandler 7600 Rheometer.
Applsci 14 09573 g005
Figure 6. Drilling fluid after experiment.
Applsci 14 09573 g006
Figure 7. The eccentric annulus motion model.
Applsci 14 09573 g007
Figure 8. Comparison of the calculation results of different models.
Applsci 14 09573 g008
Figure 9. Comparison of predicted and actual maximum ECD values for the model.
Applsci 14 09573 g009
Figure 10. ECD of the weight analysis of annular influencing factors.
Applsci 14 09573 g010
Figure 11. Weight analysis of the influencing factors for the maximum ECD in the annulus.
Applsci 14 09573 g011
Figure 12. Comparison of predicted and actual minimum ECD values for the model.
Applsci 14 09573 g012
Figure 13. Analysis of the weight of bottomhole influencing factors in ECD.
Applsci 14 09573 g013
Figure 14. Weight analysis of influencing factors for the minimum ECD in the annulus.
Applsci 14 09573 g014
Table 1. Fitting flow equation of the drilling fluid, spacer, and cement slurry.
FluidParametersThe Fitted EquationR2
Drilling fluidkk = 0.623 − 0.006 × (TT0) − 0.004 × (PP0)0.982
nn = 0.769
τtau = 1.784 + 0.015 × (TT0) + 0.017 × (PP0)
Spacerkk = 0.69 − 0.001 × (TT0)0.998
nn = 0.573
τtau = 18.514 − 0.013 × (TT0)
Cement slurrykk = 0.992 − 0.003 × (TT0)0.999
nn = 0.739
τtau = 1.698 + 0.005 × (TT0)
Table 2. Comparison of model calculations and experimental results.
Inlet Velocity
(m/s)
Model Calculation
(Pa)
Experimental Result
(Pa)
Deviation
(%)
0.1824,043.3521,858.3519.09
0.327,829.7326,313.375.45
0.430,270.0529,501.2592.54
0.532,334.3032,301.2360.1
Table 3. The displacement scheme.
Item NumberType of FluidInjection Flow Rate
(m3/min)
Injection Volume
(m3)
1Spacer1.830
2Leading cement1.018.0
3Tailing cement1.034.0
4Displacement fluid 11.24.8
5Displacement fluid 21.243
Table 4. The wellbore parameters and related fluid parameters.
ItemParameterValueParameterValue
Annulus parametersDrill bit size, m0.2159Inlet mud temperature, °C29.4
Pipe size, m0.1397Geothermal gradient, °C/100 m4.9
Pipe depth, m4971Wellbore depth, m4980
fluid parametersRheology of fluidRefer to Table 1
Density of drilling fluid and spacer, g/cm3Refer to Equations (1) and (2)
Density of cement, g/cm3Leading: 2.05/tailing: 1.90
Displacement and replacement timeRefer to Table 3
Table 5. Data labels and classification.
LabelsClassificationLabelsClassification
Drilling fluid density1.4/1.5/1.6Eccentricity0.4/0.8
Spacer density1.6/1.7/1.8Irregular wellbore diameterPresence = 1/absence = 0
Cement slurry density1.8/1.9/2.0
Flow rate0.5/1.2/1.8RheologyPresence = 1/absence = 0
Table 6. The significance of influencing factors and average SHAP values for maximum ECD in cementing operations.
LabelsImportanceSHAP ValueLabelsImportanceSHAP Value
Flow rate0.01110.001Eccentricity0.01110.0021
Drilling fluid density0.29020.0266High T/P rheology
and density
0.12780.0156
Spacer density0.16940.0072
Cement slurry density0.31420.0159Hole enlargement0.07620.0109
Table 7. Significance of influencing factors and average SHAP values for the minimum ECD in cementing operations.
LabelsImportanceSHAP ValueLabelsImportanceSHAP Value
Flow rate0.00650.0059Eccentricity0.00060.0009
Drilling fluid density0.70150.0633High T/P rheology
and density
0.28460.0542
Spacer density0.00070.0004
Cement slurry density0.00030.0004Hole enlargement0.00580.0046
Disclaimer/Publisher’s Note: The statements, opinions and data contained in all publications are solely those of the individual author(s) and contributor(s) and not of MDPI and/or the editor(s). MDPI and/or the editor(s) disclaim responsibility for any injury to people or property resulting from any ideas, methods, instructions or products referred to in the content.