6.2. Comparison of Feature Extraction Module Structures
The GhostNet series networks are lightweight networks designed for image classification, which may not be optimal for radar imagery recognition. Therefore, we designed TG2Net specifically to handle radar imagery. To demonstrate the advantages of TG2Net, we conducted a longitudinal comparison with the GhostNet series networks, as shown in
Table 3. Here, the accuracy is based on TD as the input.
In this subsection and the subsequent experiments, the evaluation of lightweight network models is based on two categories of metrics. The first category encompasses model efficiency indicators, including the number of trainable parameters, FLOPs, and inference time, which assess the computational cost and operational efficiency. The second category includes performance metrics, namely accuracy, precision, recall, and F1 score, offering a comprehensive assessment of the model’s classification capabilities.
By comparing TG1Net and TG2Net, as well as GhostNetV1-0.5 and GhostNetV2-0.5 in
Table 3, it can be observed that adding DFC attention significantly improved the network performance, at the cost of a slight increase in the number of parameters and FLOPs. This improvement was mainly attributed to the DFC’s ability to capture the dependencies between pixels in distant spatial locations. However, there was an exception: the accuracy of GhostNetV2 was approximately 0.7% lower than that of GhostNetV1. We speculate that this may have been due to the fact that the radar spectrogram data were better suited for simple, fast convolution operations that extract local information, and the addition of DFC introduced redundant computation, leading to a decrease in the generalization ability.
To further investigate the impact of the model complexity on the recognition performance, we reduced the scale of GhostNetV1 and GhostNetV2 to half of their original size and added or removed a layer from TG2Net. The comparison in
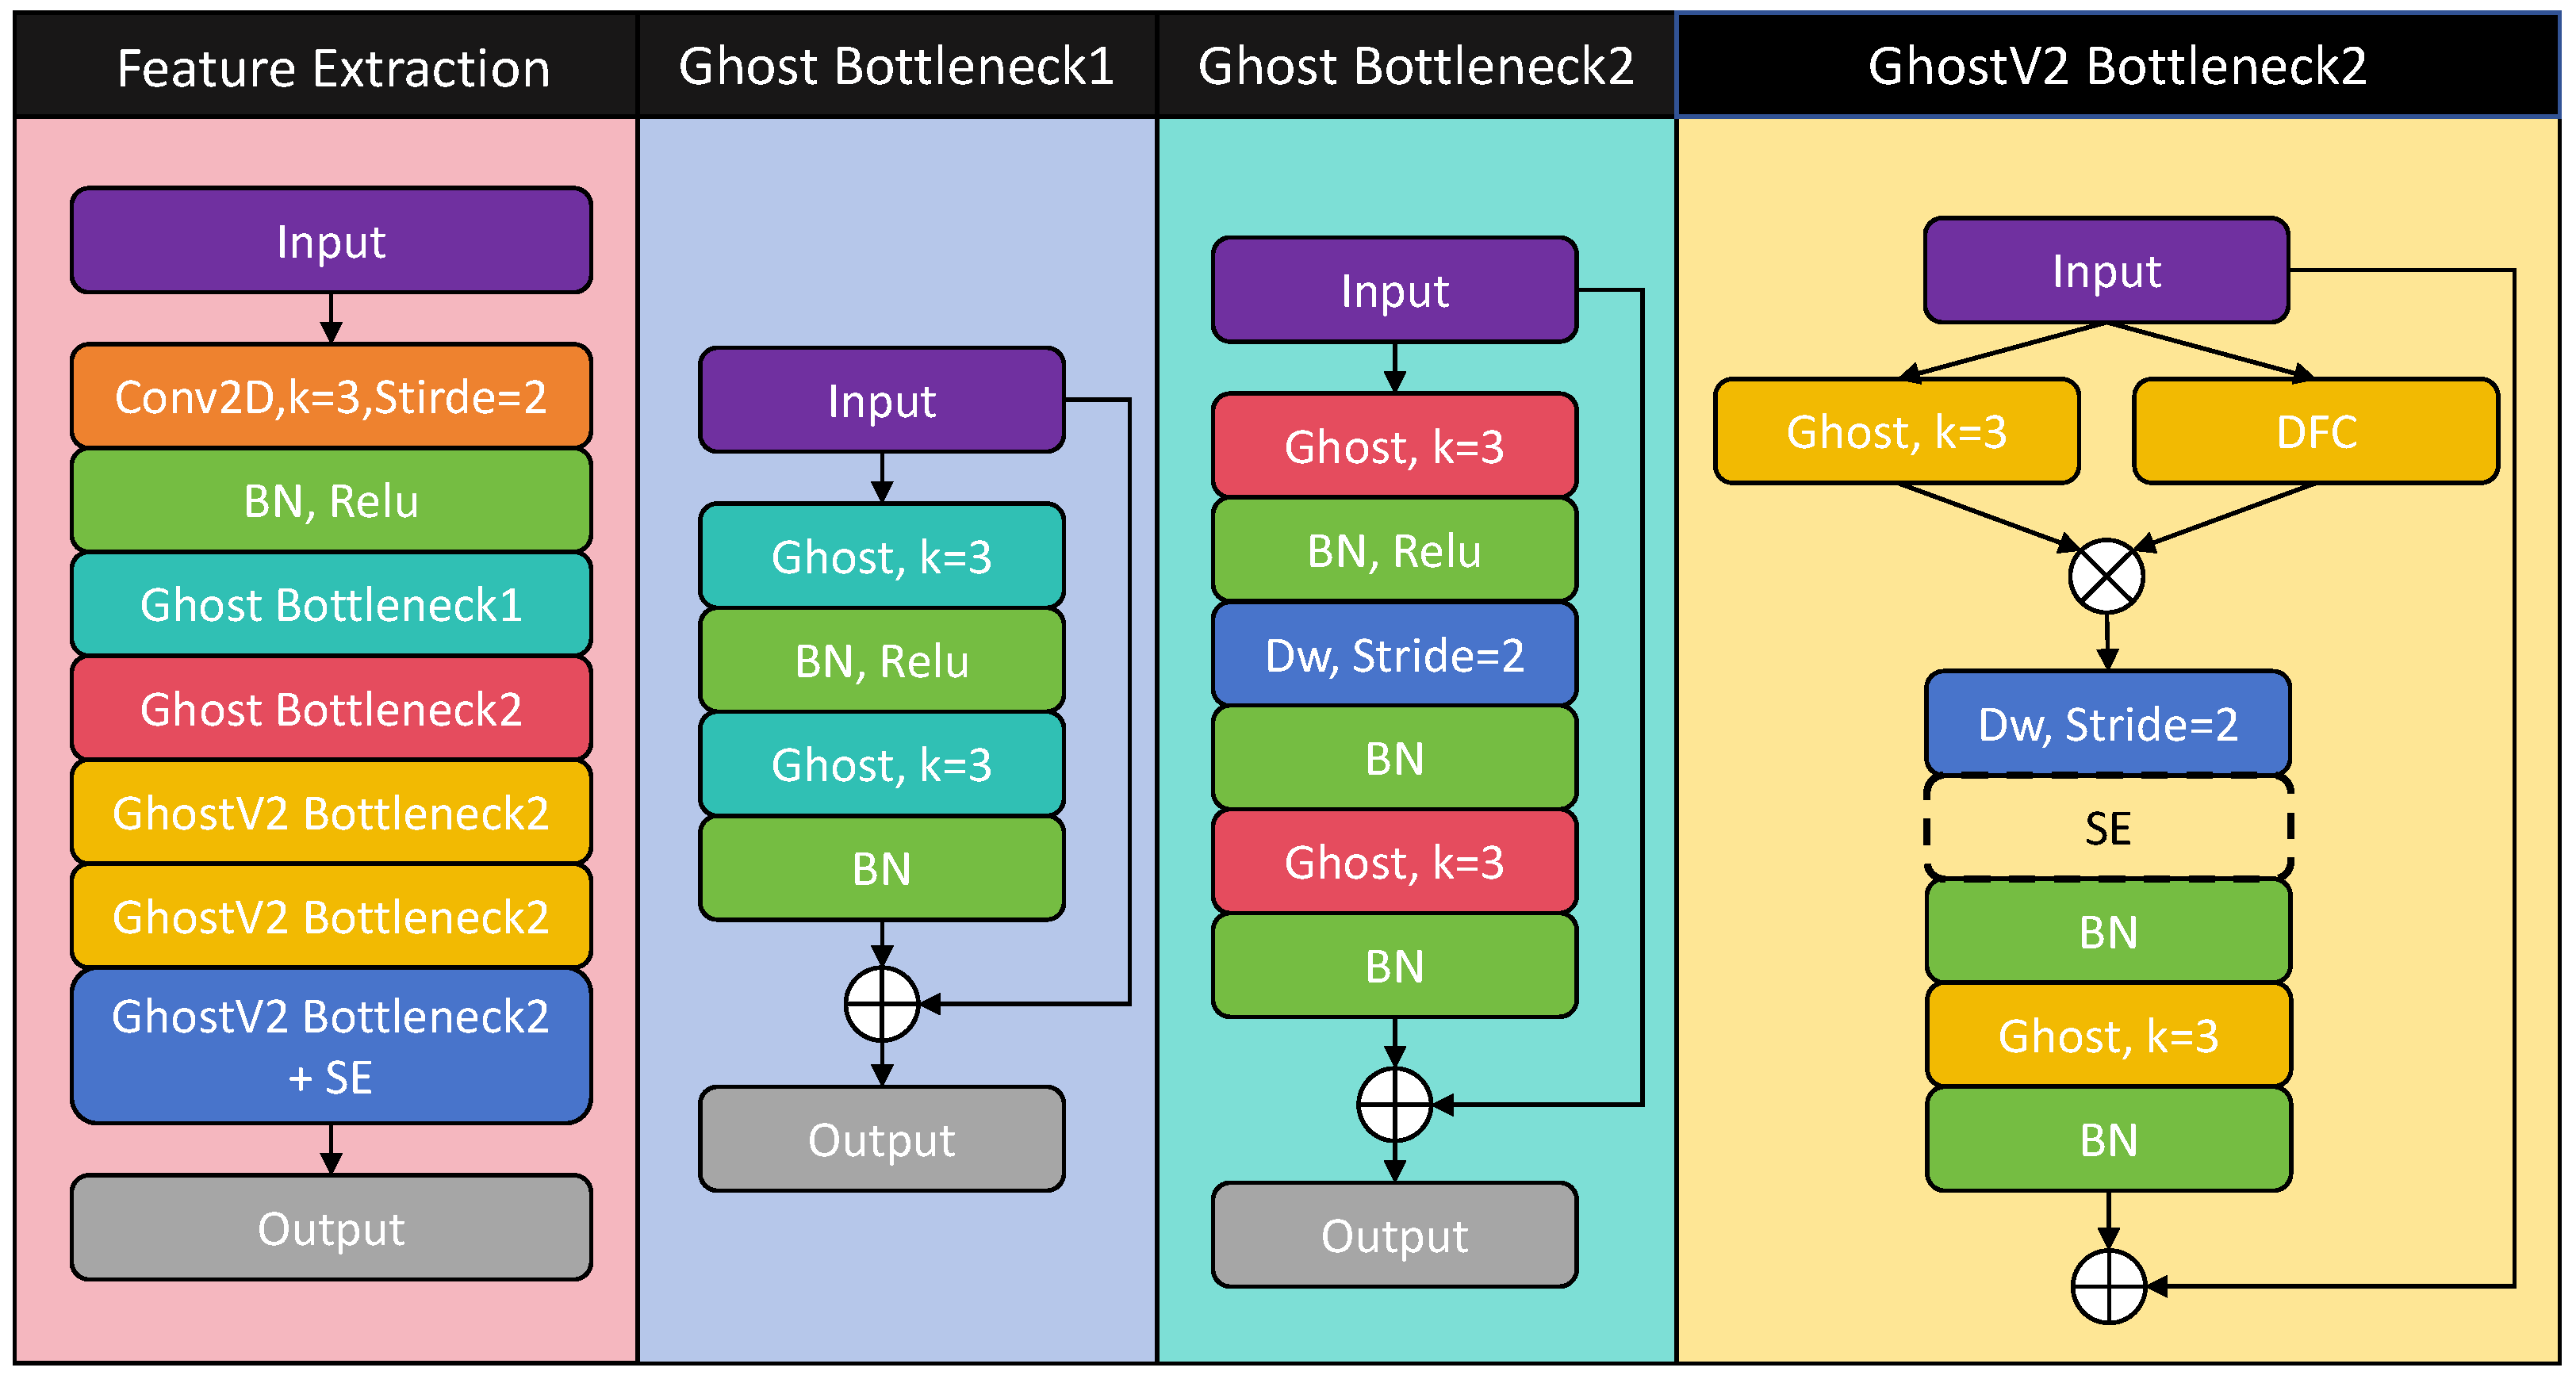
Table 3 reveals that, except for GhostNetV1-0.5 and TG2Net, the difference in accuracy among the remaining models was not significant. This suggests that by using GhostV2 convolution, it was possible to explore an optimal lightweight feature extraction module TG2 with minimal parameter costs. TG2 achieved 97.99% accuracy with only a 6-layer structure, 0.12 M parameters, and 52.4 M FLOPs. This remarkable performance is attributed to the TG2 structure, which draws inspiration from ResNet18. A key factor is the similarity to ResNet18 in the number and arrangement of bottleneck blocks. Thus, TG2 can be viewed as an improvement of the successful classic model ResNet18, leveraging GhostV2 convolution to create a lightweight network. The superior performance of ResNet18 on the dataset used in this paper will be demonstrated in
Section 6.4.
6.3. Analysis of Fusion Methods
To verify the effectiveness of TG2-CAFNet, we conducted ablation experiments and compared different fusion methods. As shown in
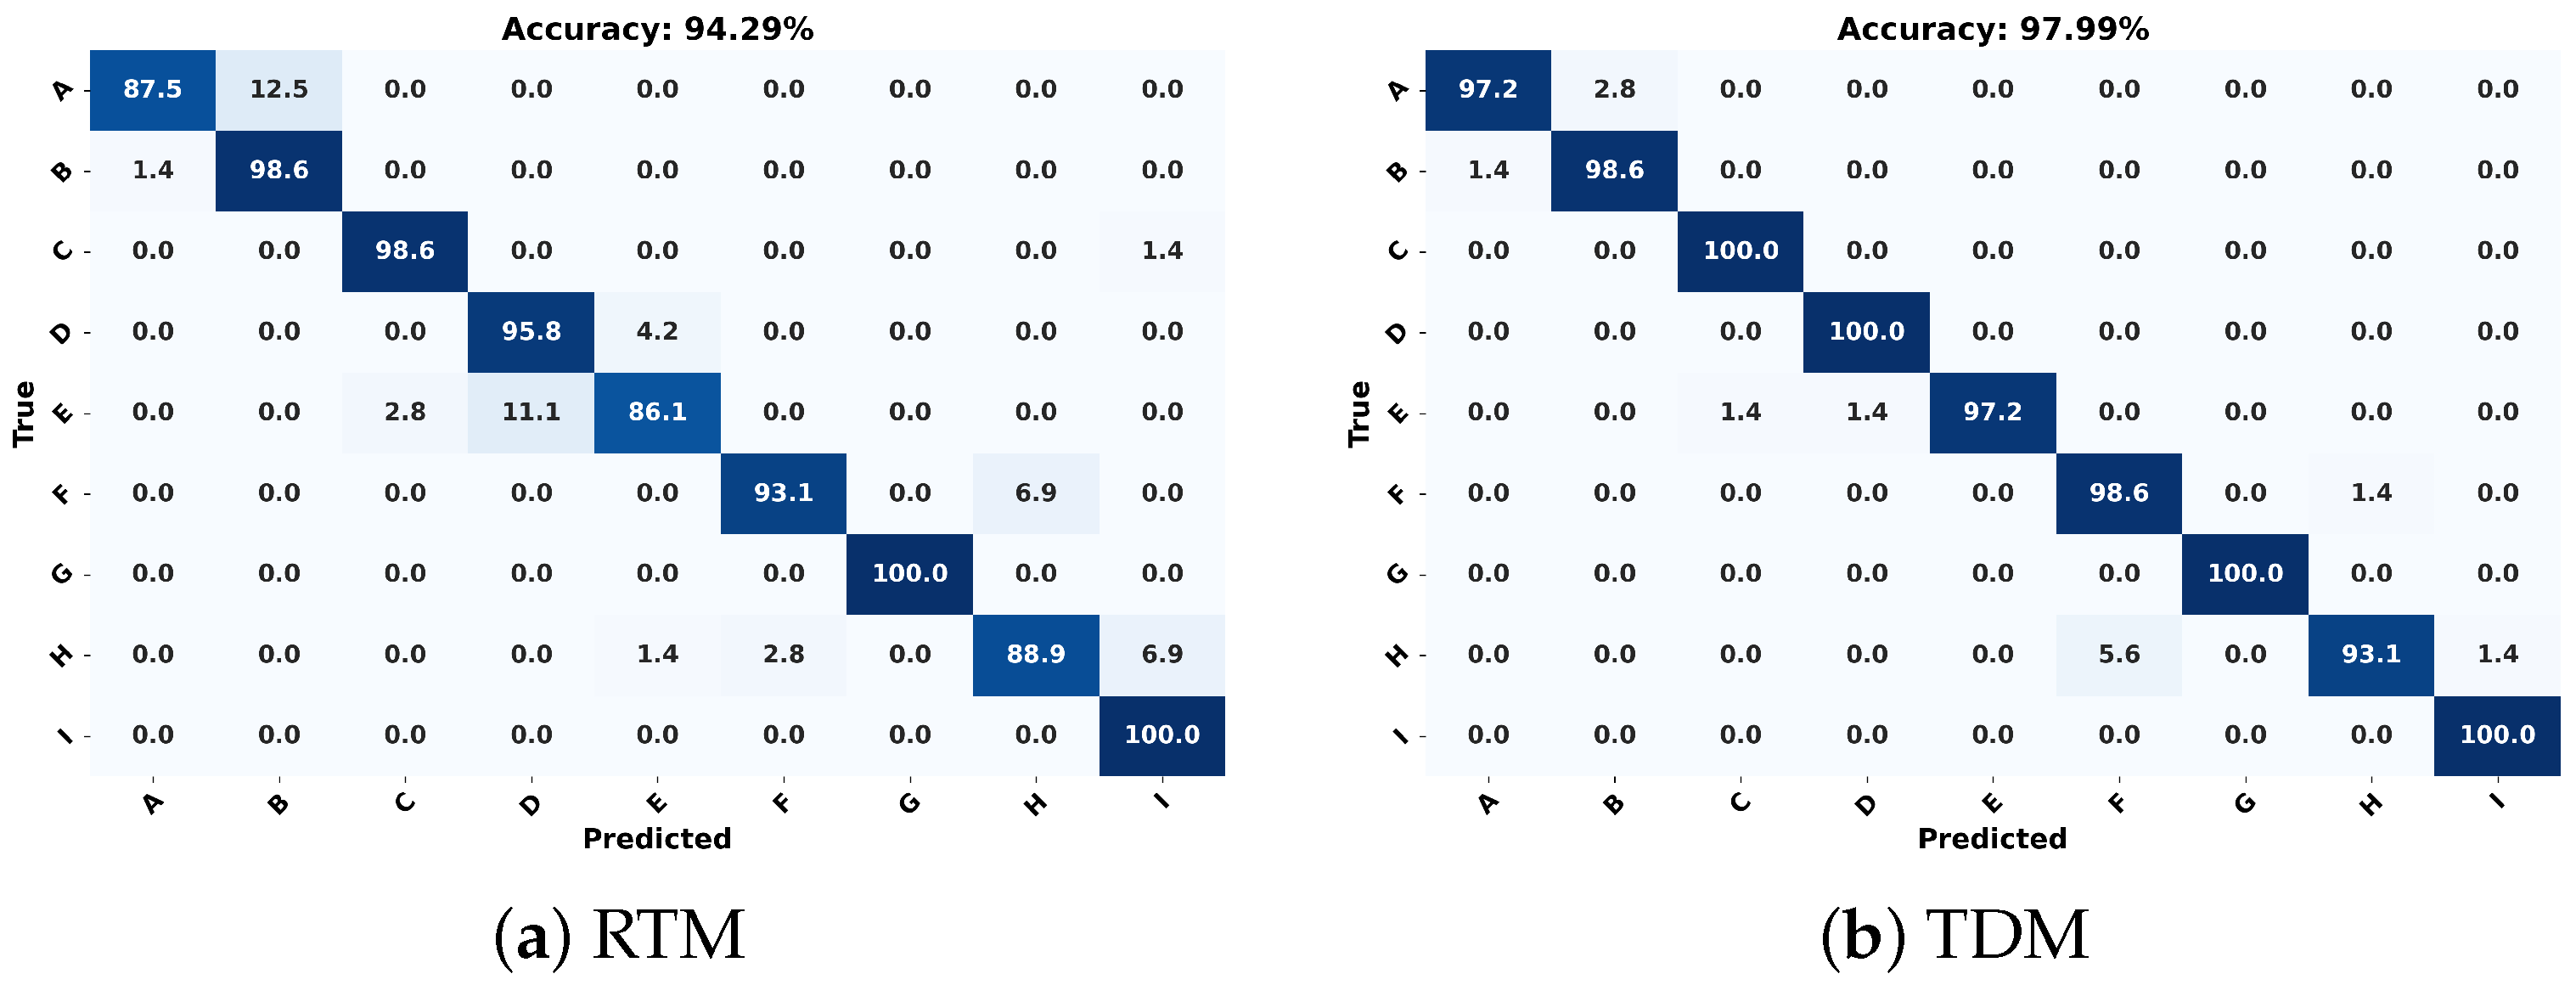
Figure 10, confusion matrices were used to observe the performance of TG2Net when the RTM and TDM were individually used as input features. Confusion matrices help identify the error patterns of different models on specific classes. By observing the confusion matrices, we could find out whether certain categories were easily confused, thereby conducting an in-depth analysis of the contribution of the different feature extraction methods to the different categories.
From
Figure 10, we can see that the recognition performance of the RTM as a feature was not as good as that of the TDM. The RTM did not perform well in distinguishing similar actions; for example, 12.5% of “walking” was misclassified as “running”, 11.1% of “kicking” was misclassified as “punching”, 6.9% of “bending” was misclassified as “squatting”, and 6.9% of “squatting” was misclassified as “standing up”. This is because an RTM only shows the relationship between the target’s distance and time, which can only capture the target’s macro movement trajectory, but cannot effectively capture subtle differences between similar actions. In contrast, a TDM reflects the Doppler effect of the target’s movement over time, capturing both speed information and micro-movement features. Therefore, in
Figure 10, the misclassification rates of the TDM are mostly below 6%.
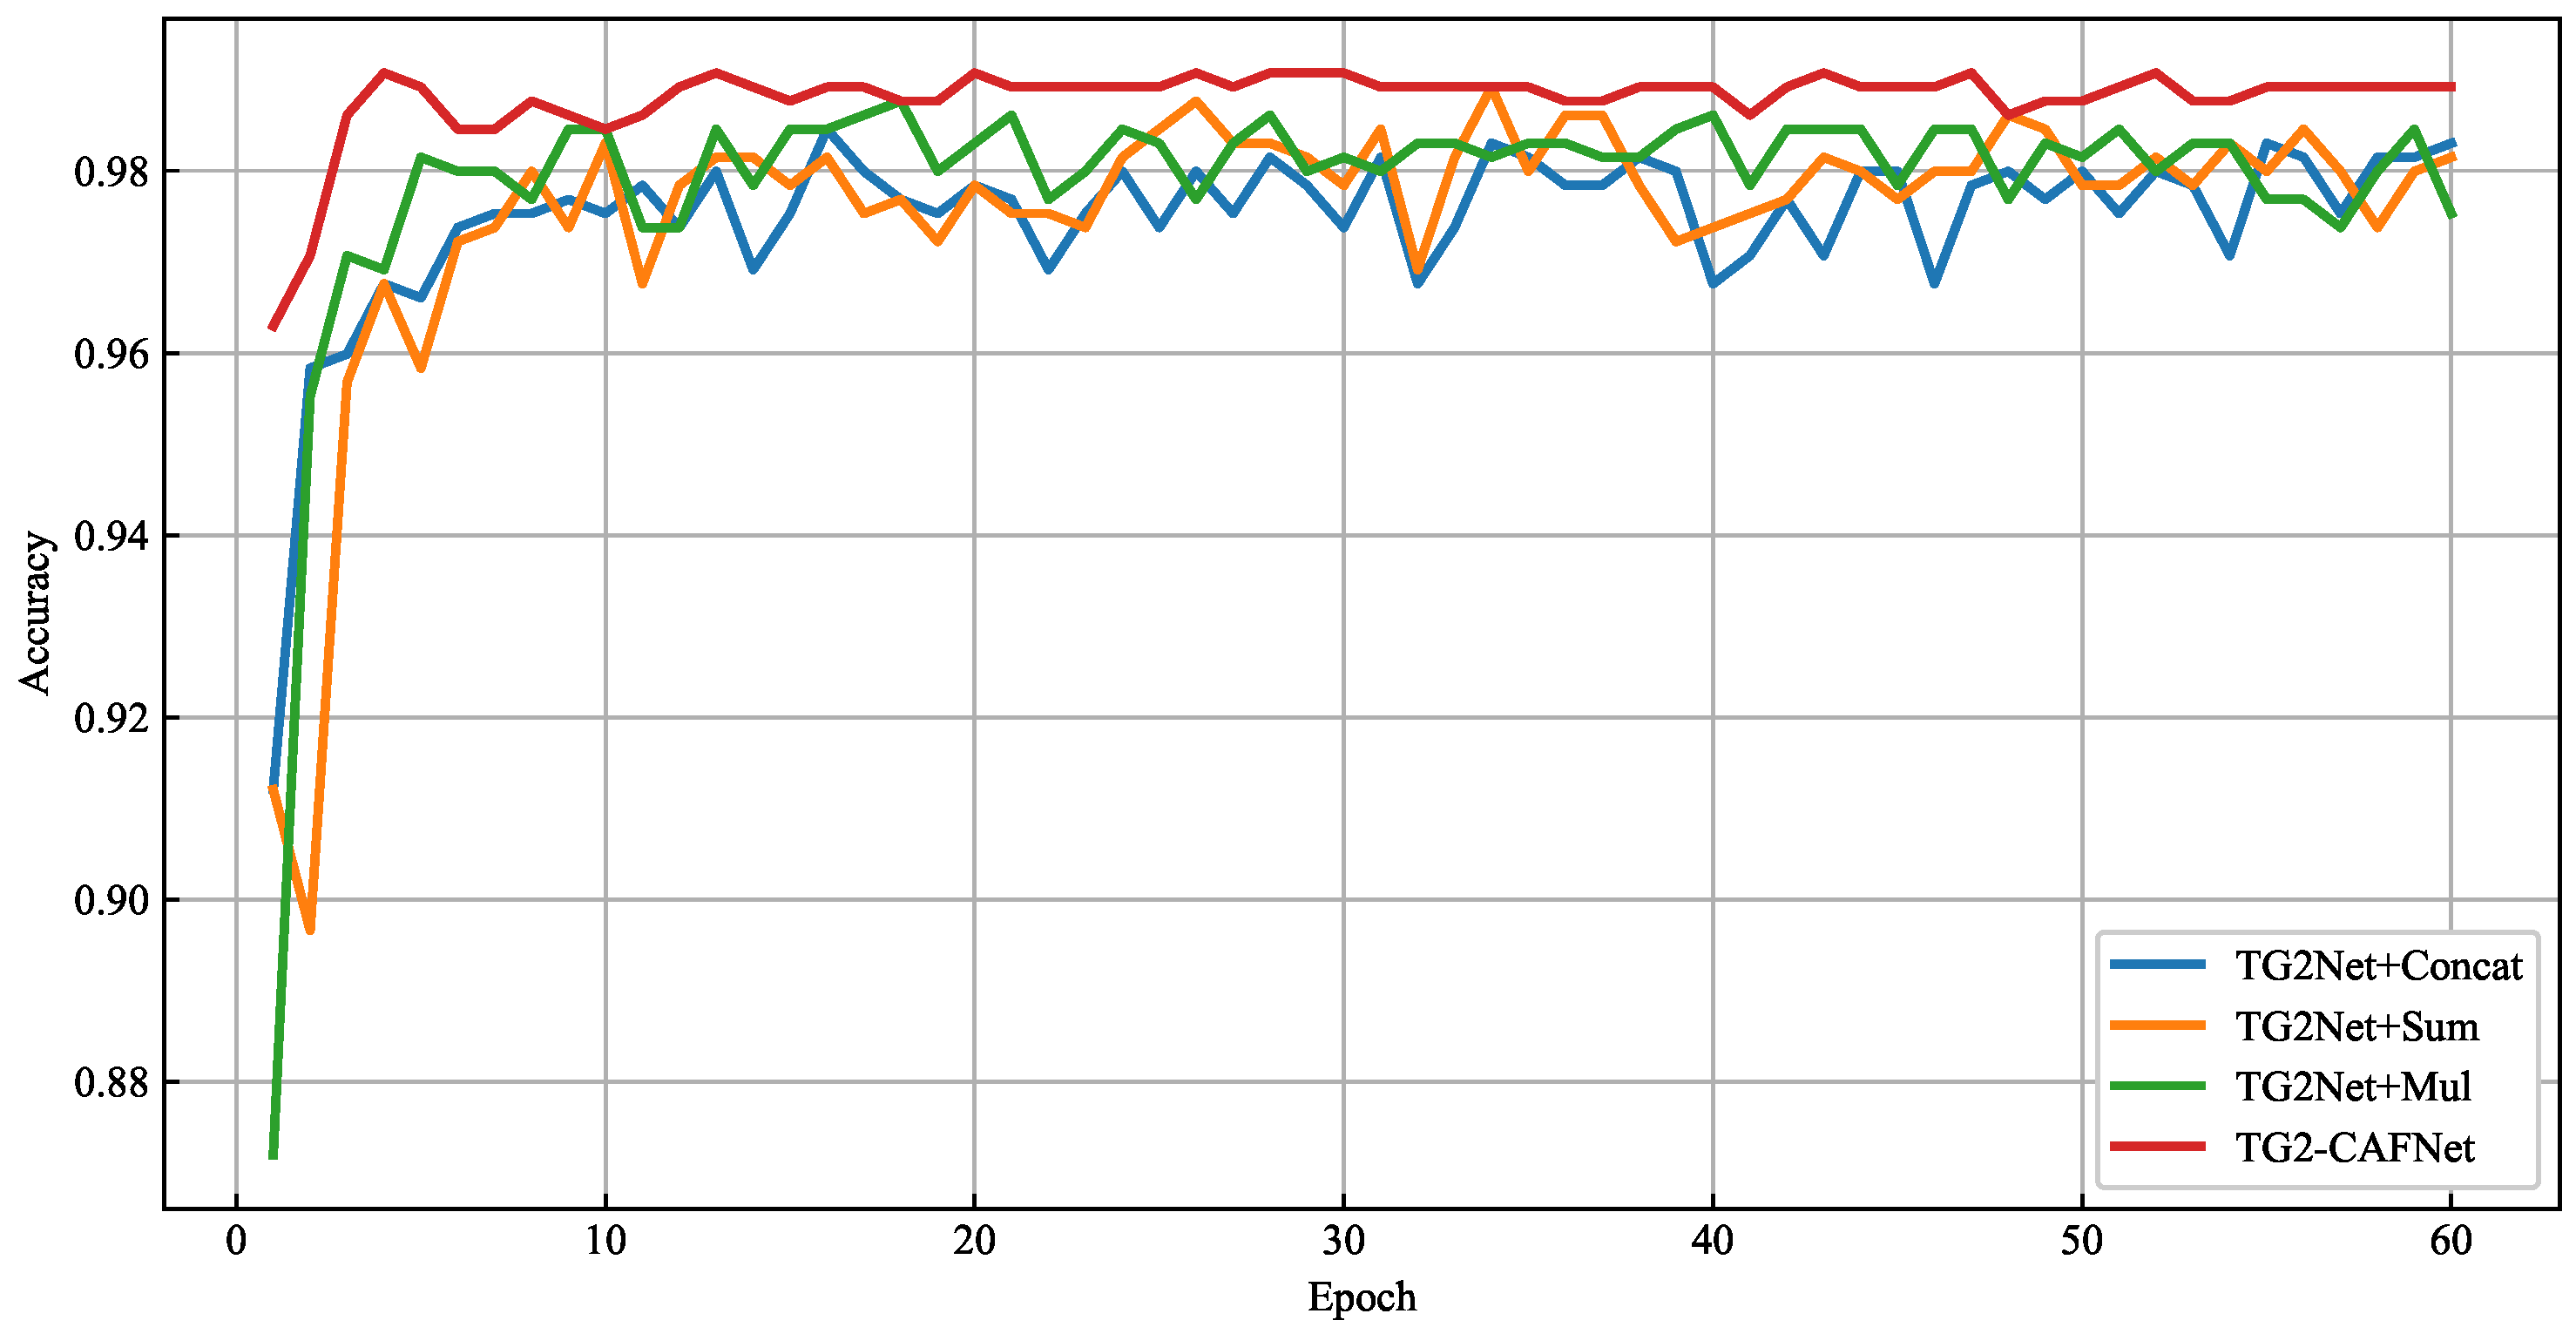
Combining an RTM and TDM can take advantage of both the macro-positioning information provided by the RTM and the speed and micro-movement features captured by the TDM, highlighting the necessity of feature fusion. In
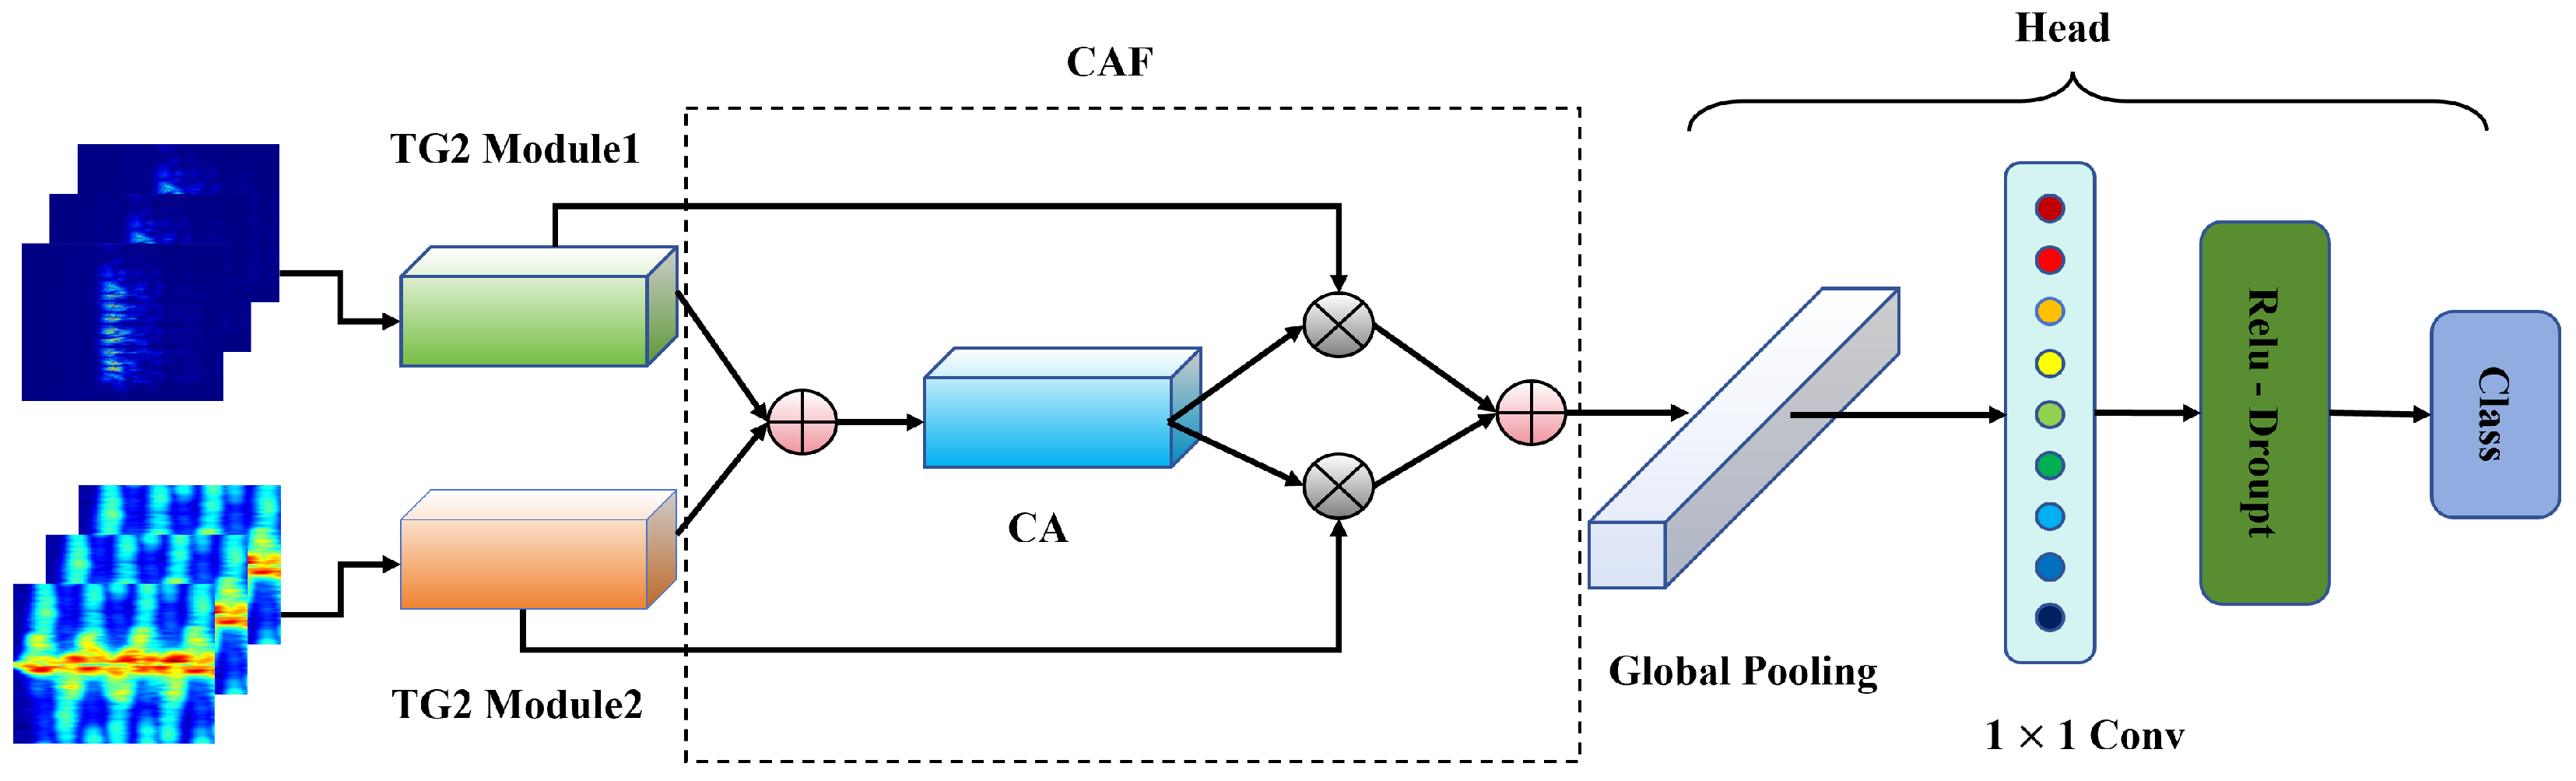
Figure 11, we compare traditional fusion methods with the proposed fusion method, CAF. As shown in the figure, concatenation fusion performed the worst overall. Although this method did not lose any information, it was prone to overfitting due to the increased dimensions and was insufficient for feature interactions. Addition fusion performed slightly better than concatenation fusion, and due to its involvement in feature interaction, addition fusion is more robust than concatenation. Multiplication fusion achieved a slightly lower overall accuracy compared to CAF but was far less robust than CAF and addition fusion. The CAF fusion method outperformed the traditional fusion methods in both accuracy and robustness. This is attributed to CAF’s nonlinear fusion mechanism, which effectively integrates multiple features, avoids the overfitting problem of concatenation fusion, and surpasses addition and multiplication fusion in feature interactions. Therefore, CAF demonstrated a superior performance in handling complex features.
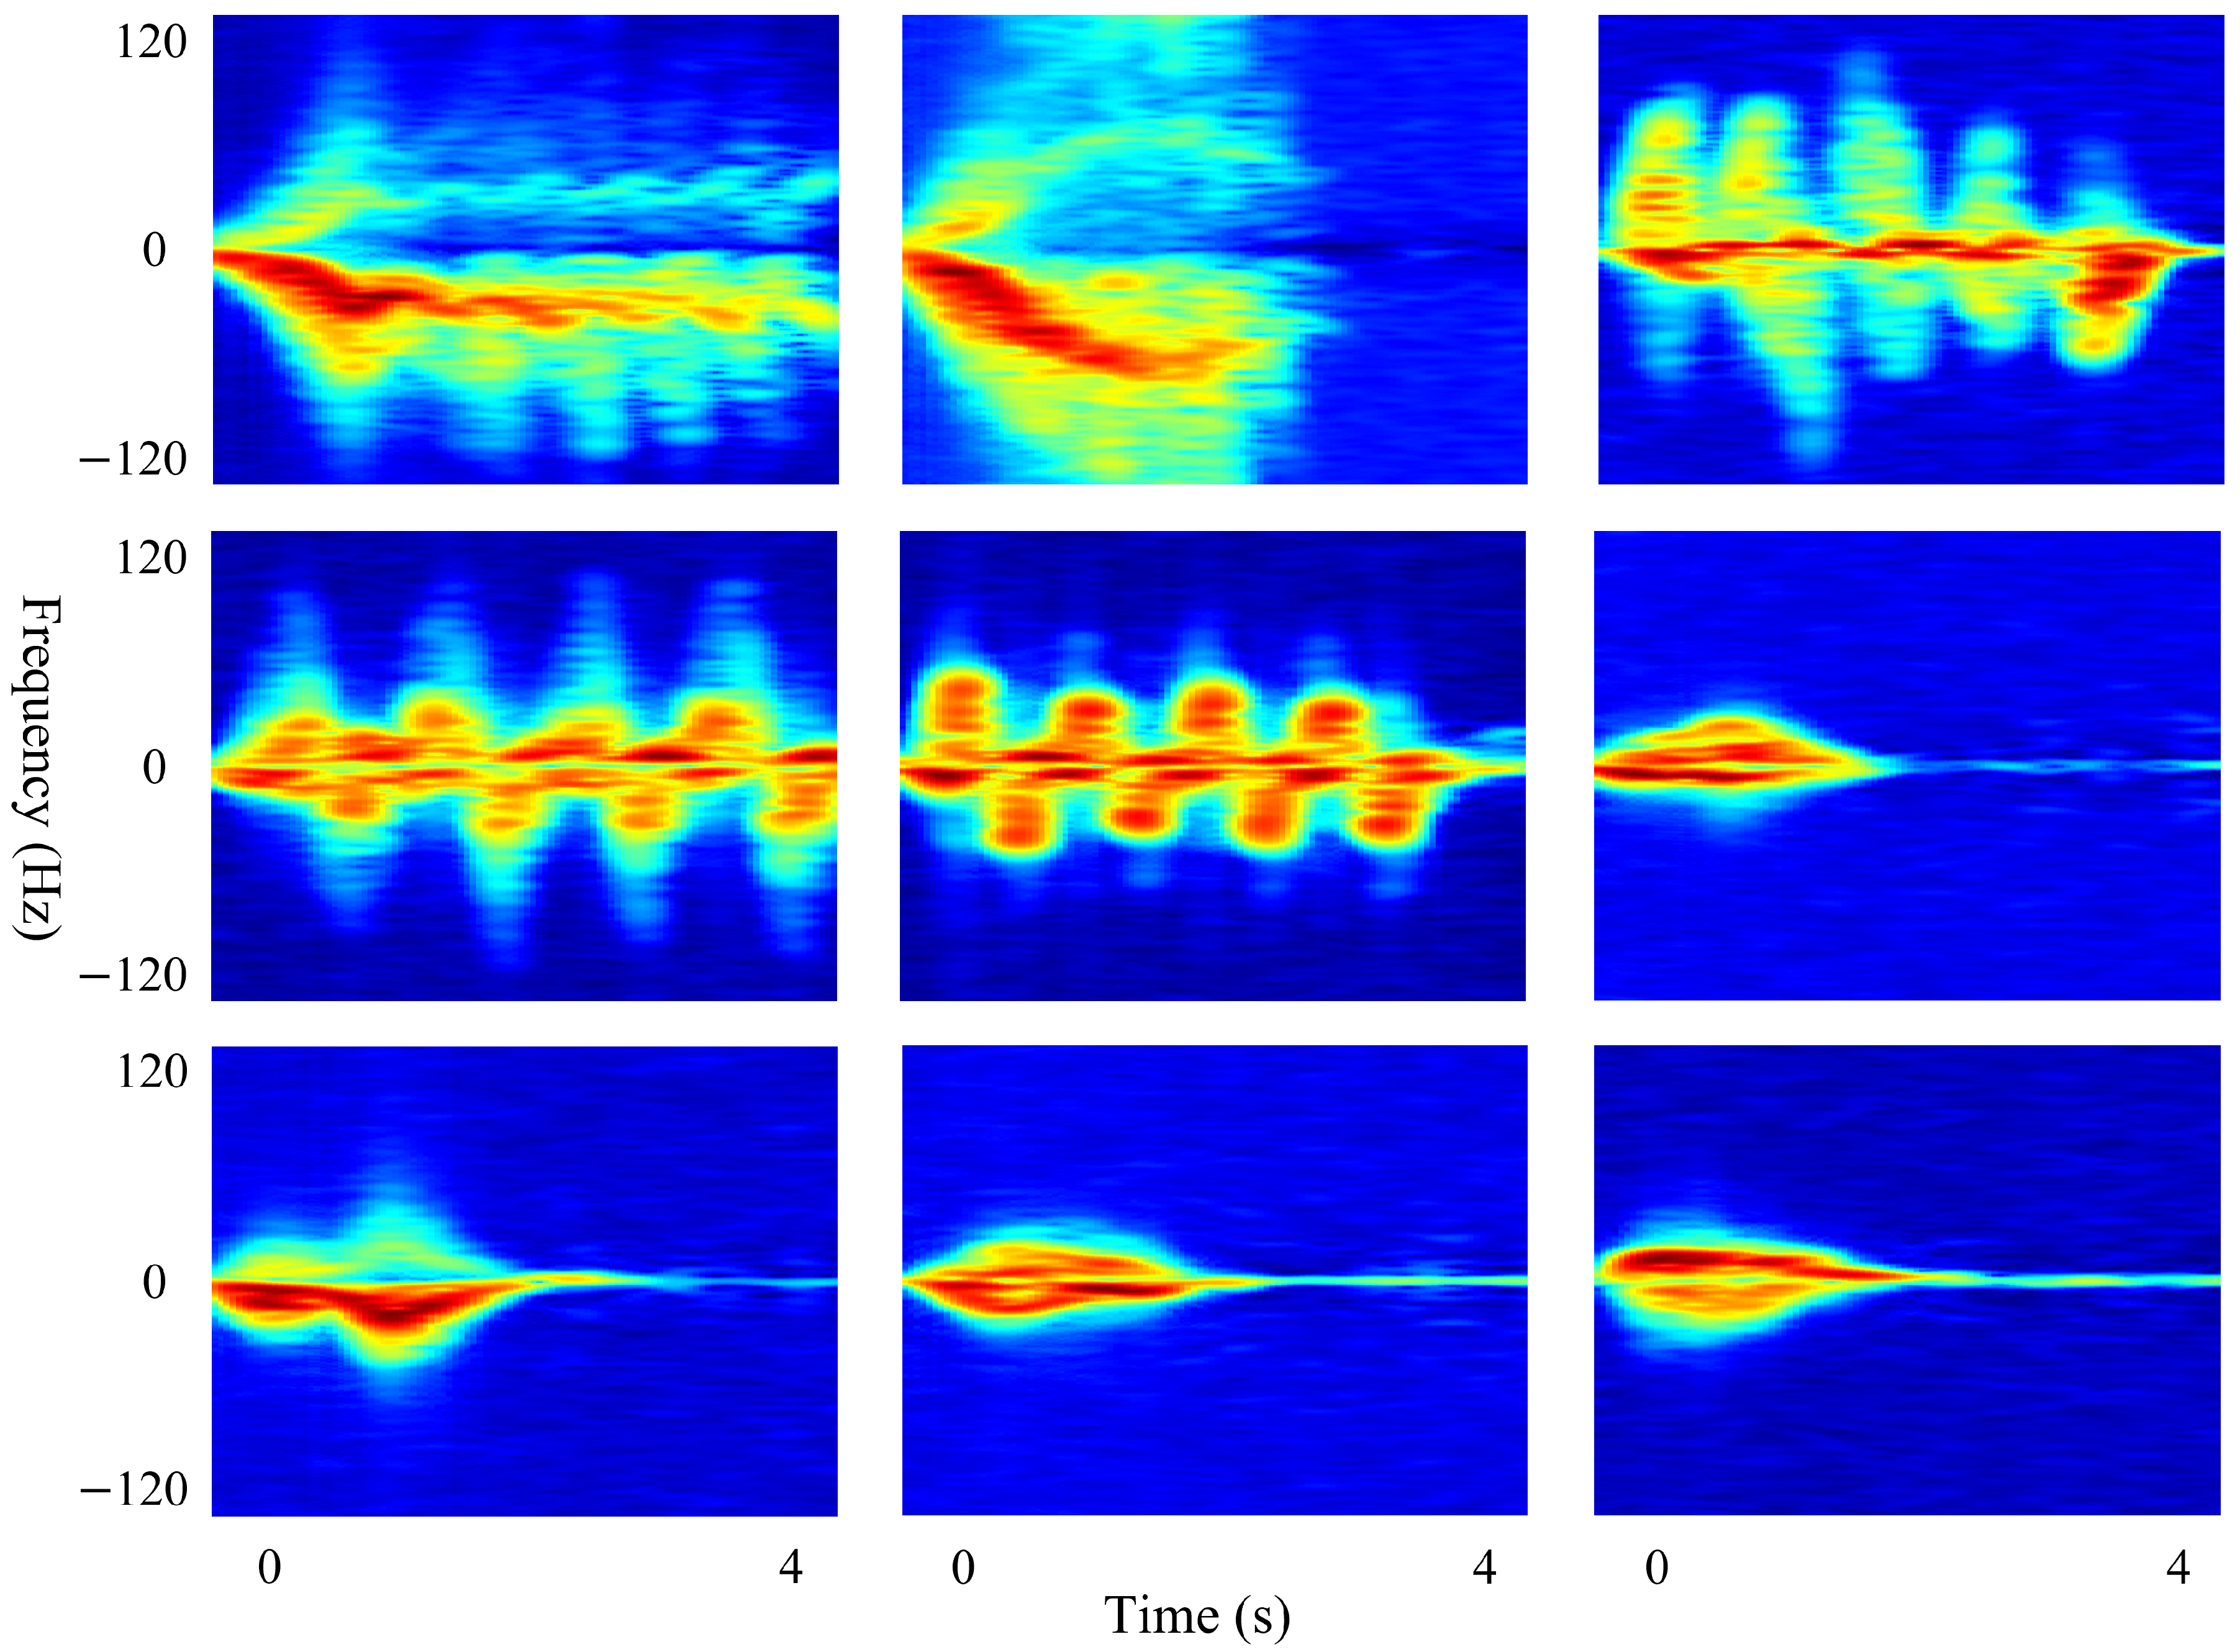
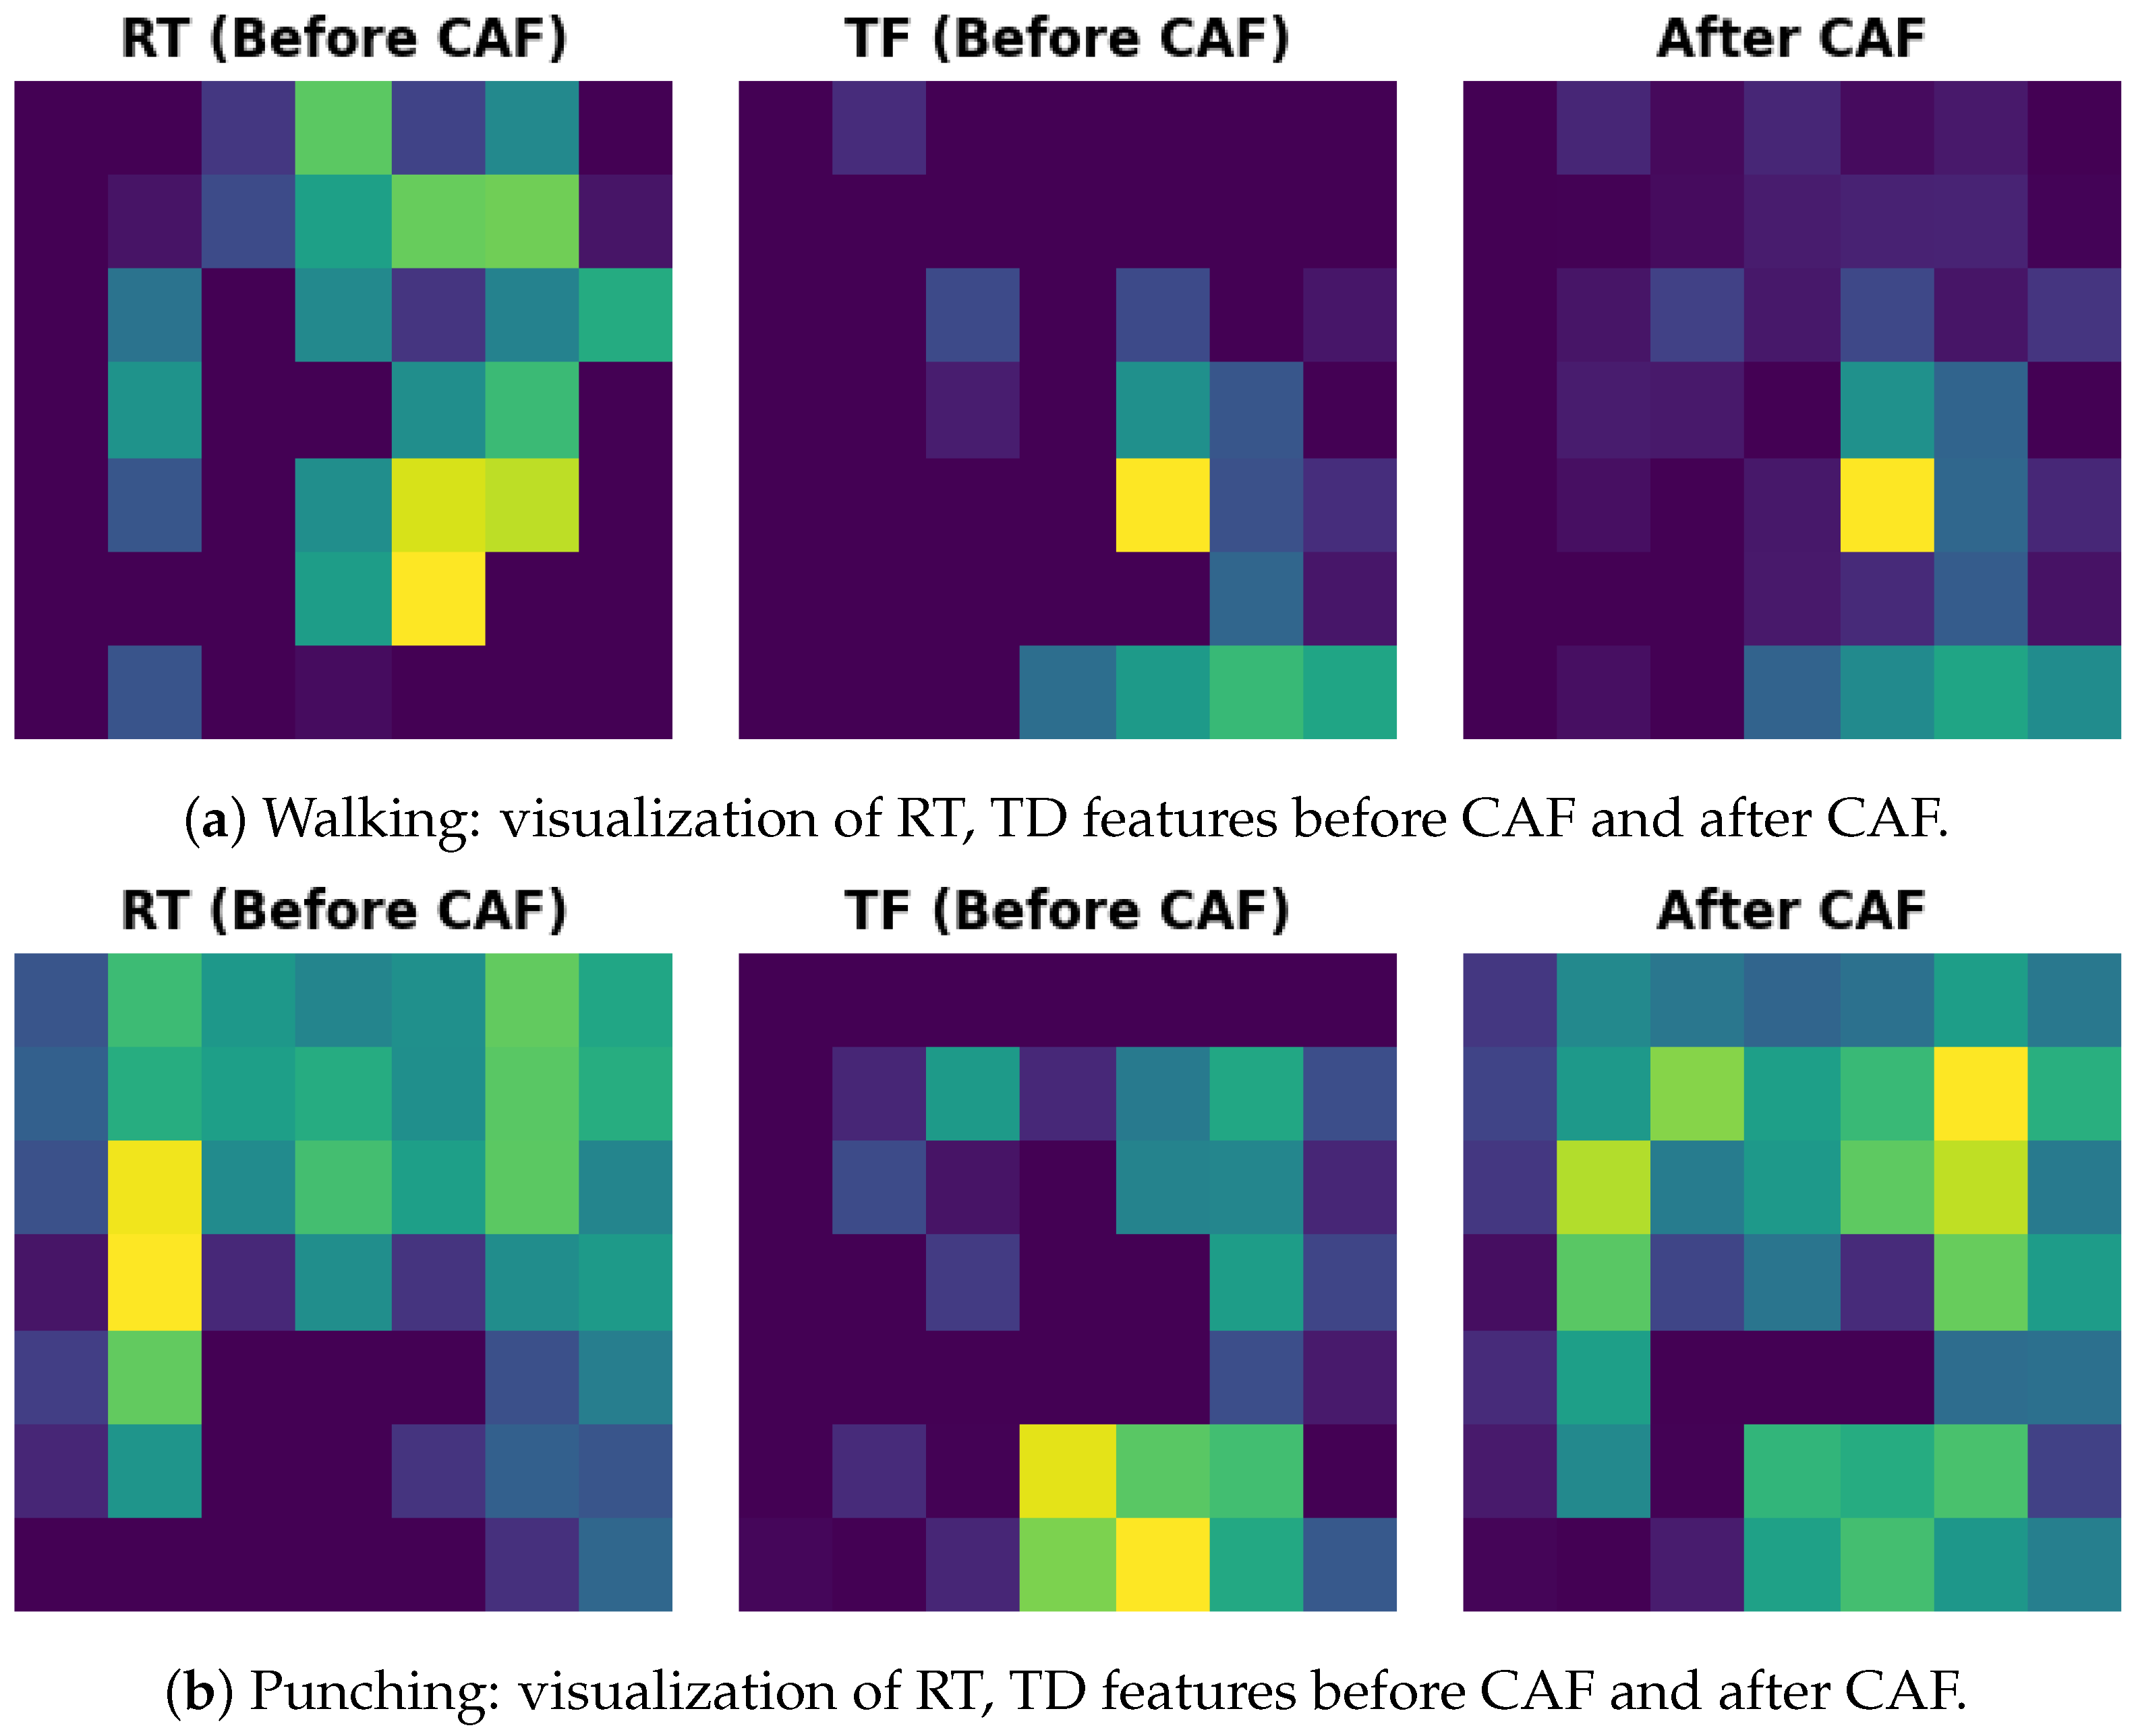
To better understand how CAF performs feature fusion, we visualized the features extracted by TG2-CAFNet in
Figure 12, including the RT and TF features before CAF fusion and the features after fusion. We analyzed the visualized features of two actions: running and punching. As shown in the figure, in the case of running, the RT features before CAF fusion covered more dispersed regions, indicated by several low-brightness green blocks, whereas the TF features were more focused on specific key areas. After CAF fusion, the final feature map was primarily dominated by the TF features, with the RT features being diminished. This demonstrates that CAF effectively filters and retains features that are more important for action recognition, thereby enhancing the model’s accuracy. In contrast, for the punching action, both RT and TF features were significant before CAF fusion, and both were well preserved in the fused feature map, indicating a complementary fusion. Hence, CAF is not a simple linear fusion, but rather has an adaptive capability to balance different features. It can selectively fuse features based on their importance for different actions, allowing CAF to achieve a better recognition performance when handling complex actions.
To demonstrate the significant advantages of CAF, a statistical significance test was conducted. In this study, a one-way analysis of variance (ANOVA) was first carried out to evaluate the differences between the fusion methods. The results of the ANOVA test showed that the F value was 51.6145 and the p-value was 2.88 × , which is much smaller than the significance level of 0.05. This indicates that the differences in accuracy among the different fusion methods were statistically significant, meaning that at least two groups had a significant difference.
While the ANOVA test successfully demonstrated that there was a statistically significant difference between the groups, it did not specify which groups exhibited significant differences. Therefore, a post hoc Tukey HSD (honest significant difference) test was performed, as shown in
Table 6. The Tukey HSD test indicated that the mean differences between CAF and the other methods were significant, particularly for concatenation, multiplication, and summation. The
p-adj values were close to or equal to 0 (where
p-adj = 0 indicates an extremely small
p-value), and the mean differences (Mean Diff) were relatively large. In contrast, the difference between multiplication and summation was not significant (
p-adj = 0.4044), suggesting that their performance was similar. The Mean Diff in
Table 6 actually reflects the average accuracy difference between the two fusion methods. A larger mean difference indicates a more pronounced performance difference between the two groups. The mean differences between CAF and the other three fusion methods were all large, and the confidence intervals did not include zero, indicating that these differences were statistically significant. This aligns with the ANOVA test results, further verifying the significant performance advantage of CAF over the other fusion methods.
Finally, in
Figure 13, we present a detailed error analysis using two confusion matrices of TG2-CAFNet. Although TG2-CAFNet demonstrated an excellent recognition performance, it still produced misclassifications of certain actions. By observing the matrices, it can be seen that misclassification and omission errors mainly occurred in the three groups of actions enclosed in red rectangles. These three groups consisted of similar actions, where differences in amplitude, frequency, and period were not obvious. In fact, when a person performs one action, the characteristics of their movements may resemble those of another person performing a different action, further increasing the difficulty of recognition. Therefore, in order to reduce errors, it is important to enhance the distinction and extraction of features for similar behaviors. Methods that could be applied include performing radar-based temporal analysis, introducing complex radar data, and further integrating other data types. These approaches aim to provide a comprehensive analysis of human behaviors from multiple perspectives, thereby minimizing the model’s misclassification rate.
6.4. Comparison with Other Models
As shown in
Table 7, we compared TG2-CAFNet with several mainstream models to validate its performance. Overall, when the TDM was used as input, the accuracy was generally higher than when the RTM was used. Regardless of the input type, DenseNet121 and ResNet18 achieved the highest recognition accuracy, primarily due to their complex deep network structures, which allowed them to capture more detailed features and improve the classification results. However, their large number of parameters makes them unsuitable for deployment in practical applications. In the comparison of lightweight models, we selected four classical lightweight architectures. In terms of parameters and FLOPs, MobileNetV3-Small-0.75 and ShuffleNetV2-0.5 performed similarly to TG2Net. However, MobileNetV3-Small-0.75 performed poorly in terms of accuracy, limiting its applicability in scenarios with high accuracy requirements. While ShuffleNetV2-0.5 excelled for inference time, it fell slightly behind TG2Net in other metrics. EfficientNetLite0 and MobileViTV3-0.5 were inferior to TG2Net in both lightweight design and accuracy.We also compared a CRNN, a temporal model. Although the CRNN had a relatively small number of parameters and FLOPs, it suffered from a longer inference time and lower accuracy compared to TG2Net. Finally, TG2-CAFNet, by fusing both RTM and TDM features, further boosted the recognition accuracy by approximately 1%. Although it did not have the best parameters or FLOPs among all models, TG2-CAFNet achieved notable accuracy improvements by sacrificing a modest increase in parameters and FLOPs, meaning the model remains suitable for deployment. While its inference time may not be its strongest suit, the focus of this research was not real-time performance, but deployability and accuracy improvements.
In summary, TG2-CAFNet leverages GhostV2 convolution to construct a radar spectrogram feature extraction module, TG2, with a significantly lower parameter count and FLOPs compared to existing lightweight models. We believe that the lightweight nature and high recognition accuracy of TG2 for radar spectrograms can mainly be attributed to redundant features and DFC attention. RTMs and TDMs are representations of human actions in the range–time domain and time-Doppler domain, respectively. These representations are abstract and contain a lot of details. Redundant features enrich feature representation and help capture complex range–time and time–frequency relationships. The introduction of DFC further enhances the model’s focus on the spatial information of radar spectrograms. Then, multi-domain fusion technology is used to further improve the model’s performance. Traditional fusion methods do not allow for steady performance improvements, so the non-linear fusion method AFF is introduced, providing a dynamic adaptive weighting fusion approach. Meanwhile, the use of CA extends the weighted fusion to spatial distribution, which is of significant importance for radar spectrograms with a clear physical meaning.


