1. Introduction
The technological advancement in recent decades has driven the popularity of portable electronic devices, expanding their applications in communication and sensing. However, this expansion requires increasingly smaller and more efficient batteries. A promising solution is harnessing the generation of energy from rotating parts in relative motion, using piezoelectric materials that convert structural vibrations into electrical energy.
Piezoelectricity is a property discovered by physicists Jacques and Pierre Curie in the 1880s. It consists of the generation of electrical energy when a material is subjected to mechanical stress. Materials with electric dipoles aligned either naturally or artificially exhibit this property, where the electric potential is proportional to the movement caused by the mechanical stress. Conversely, when applying an electric field to the piezoelectric material, it deforms, resulting in dimensional changes [
1].
With technological advancements, new materials and methods have emerged, as seen in the literature [
1,
2]. Sodano et al. [
2] presented an energy generation configuration based on piezoelectric elements with two storage methods: capacitor and nickel–metal hydride battery. The capacitor has been widely used for storing the generated electrical energy. The generation structure consists of a piezoelectric transducer PSI-5H4E coupled to an 80 mm aluminum beam. Meanwhile, Lefeuvre et al. [
3] implemented a mechanical system with a circuit synchronized to the system’s vibration to enhance energy transfer efficiency. The proposed circuit includes a full-wave rectifier and a buck-boost DC-DC converter as the load, resulting in an efficiency of 88%.
Recently, many articles have modeled energy harvester systems with piezoelectric transducers as mass-spring systems, such as cantilever beams, operating in the resonance region [
4,
5,
6,
7,
8]. These systems collect mechanical vibrations, primarily at low frequencies, and convert them into electrical energy, reaching maximum potential. Gonçalves et al. [
9] developed a project for a mini wind turbine using piezoelectric transducers for low-power devices. The prototype allows for the control of dimensions, geometries, and masses attached to the end of the beam to achieve the highest potential possible. Excitation is performed by permanent magnets attached to the generator shaft, interacting with the free end of a steel beam. The study used a PZT C-64 and achieved a maximum output power of 2.06 mW for a single beam and 3.78 mW for three beams in parallel, with power densities of 18.8 μW/mm
3 and 11.5 μW/mm
3, respectively.
In this research, we present an electrical power generation system utilizing the piezoelectric effect in transducers coupled to a free-clamped beam. Controlled excitations were performed using an electromechanical shaker. We assessed the power and generation efficiency with different loads: pure resistive, capacitive resistive, and nonlinear (full-wave rectifier). The generated power is developed based on the characteristics of each load. Additionally, we conducted modeling with piezoelectric generators coupled to the beam, selecting the most effective loads. We compared power generation results with different load types to analyze their influence on the piezoelectric generator and, finally, evaluated the load generated in a low-energy-consumption application.
The objective of this study is to extend these findings by investigating the efficiency of piezoelectric transducers in low-power systems, targeting applications where vibrational energy is already present in the environment, such as in machinery, operating vehicles, or wearables like smart footwear, implantable technology, and smart fabrics [
10,
11,
12,
13]. By exploring the feasibility of energy harvesting in these contexts, the aim is to demonstrate that it is possible to harness these vibrations to power low-power devices, reducing the need for external energy sources.
The structure of this paper is organized as follows:
Section 2 presents the energy conversion mechanisms involved in the piezoelectric effect and provides details about the transducers and circuits used.
Section 3 outlines the methodology, including the analytical modeling and experimental setup for evaluating the power generation system.
Section 4 discusses the results of the experiments and simulations, comparing the performance of the two transducers (PZT-5H and P5-13B) under different load conditions.
Section 5 concludes the study, summarizing the key findings regarding the energy harvesting capabilities of the transducers and providing insights into their practical applications in low-power systems”.
2. Energy Conversion Mechanisms
In the phenomenon of piezoelectricity, energy generation can occur through three conversion mechanisms: piezoelectric, electromagnetic, and electrostatic. In the case of conversion using the piezoelectric effect, a piezoelectric material can be employed in a spring system, converting kinetic energy into electrical energy through the pressure exerted by the mass on the material induced by vibrations in the system [
14].
Due to the advantages of not requiring an external voltage source, allowing the use of high voltages, and providing greater electrical generation capacity, the behavior of two piezoelectric transducers was evaluated in a cantilever-free structure, which is the most used configuration due to its advantages. The most suitable mechanical mode for this type of configuration is mode 31, as it offers efficient electromechanical coupling and can generate higher mechanical deformations with a relatively low mechanical force. Additionally, this configuration is easy to construct and has a relatively low resonance frequency.
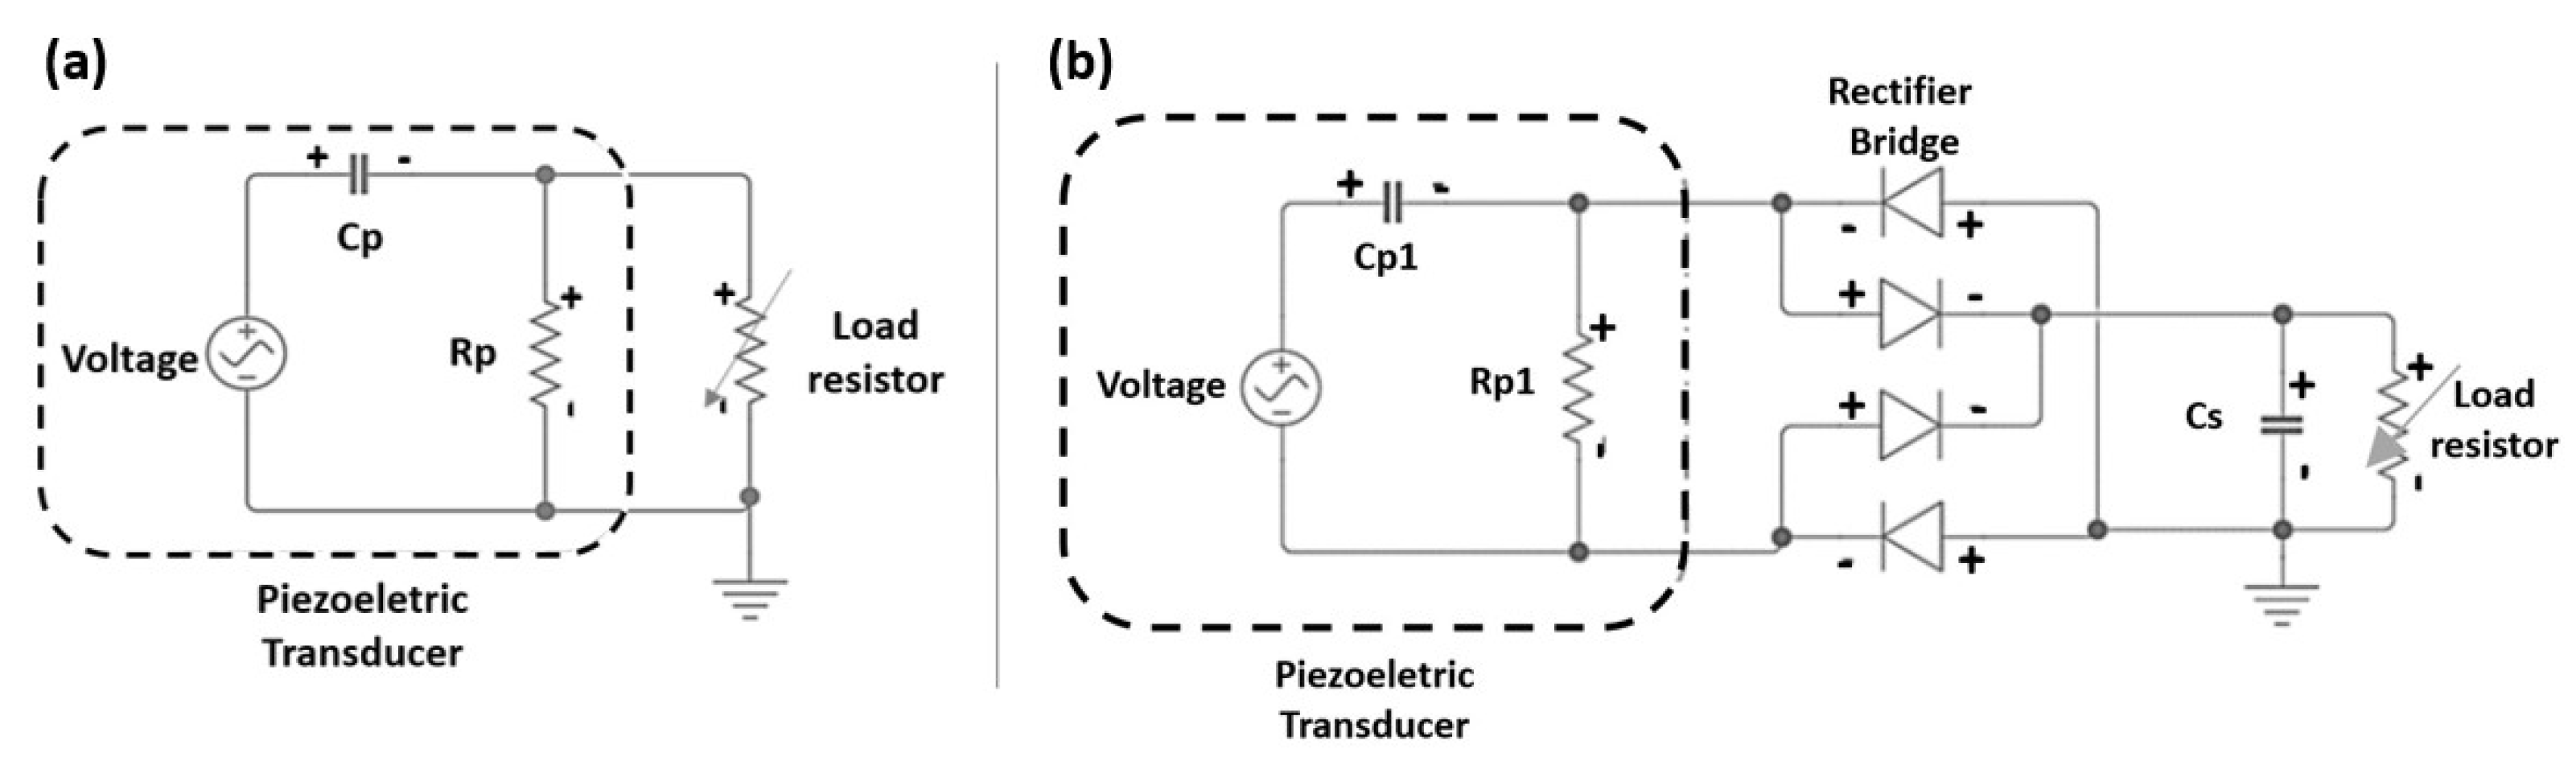
A vibration-based energy harvesting system, which converts mechanical energy into electrical energy, consists of a piezoelectric transducer coupled to a cantilevered beam, modeled as a mass-spring-damper system (
Figure 1a). For energy dissipation, a load resistor is employed, as depicted in
Figure 1b. In the configuration where the system has a mass element fixed at the end, the objective is to reduce the resonance frequency and increase mechanical deformation. To achieve this, it is necessary for the excitation frequency to approach the natural frequency of the mechanical system, ensuring a greater deformation in the beam. Therefore, the excitation frequency should be close to the resonance frequency to achieve maximum potential generation [
14,
15], as illustrated in
Figure 1c.
Signal conditioning circuits play a crucial role in the operation of the energy harvesting system as they are responsible for converting the alternating current (AC) signal generated by the piezoelectric transducer into direct current (DC), which is widely used by electronic devices. The goal is to maximize power generation while keeping the power consumption of these circuits as low as possible, aiming for maximum efficiency.
To achieve this, two circuits will be modeled: one using a load resistor and another using a diode bridge circuit. Additionally, a comparative analysis of the LTC-3588 integrated circuit will be conducted in relation to the previous methods of extracting electrical energy and applying it to a temperature monitoring system.
Table 1 presents the mechanical and electrical parameters, which will be used to determine the equivalent circuit based on the mechanical system in question.
Input energy comes from the base vibration, represented by y(t), while the output energy, z(t), is the electrical energy generated through the voltage and current across the load resistor due to mechanical efforts on the piezoelectric transducer. For a single-degree-of-freedom (1-DOF) piezoelectric system with a constant excitation amplitude as a function of frequency, as illustrated in
Figure 1a, the governing equations of the system are as follows:
The mechanical equation is as follows:
The electrical equation is as follows:
where y is the base excitation displacement,
z =
x −
y is the relative displacement of the transducer with respect to the base, and
I is the output current of the extraction circuit.
By using the Laplace transform and solving Equation (1), we obtain the transfer function between the excitation and the relative displacement of the transducer, given by the following:
Reorganizing, we have the expression for the relative displacement:
In the case of standard energy extraction and the storage circuit, the voltage V is no longer a pure sinusoidal wave and is rectified, resulting in the rectified voltage V. The system employs a full-wave rectifier to achieve this transformation, ensuring that the rectification process efficiently converts the alternating current into a unidirectional flow, essential for subsequent energy storage and utilization [
16,
17]. Thus, the power generated by the circuit according to the literature [
18] is given by the following:
Therefore, , and , where A represents the amplitude of the system’s excitation.
3. Methodology
3.1. Analytical Modeling
To develop the model for piezoelectric generators, a cantilevered beam was employed due to its capability to convert vibration into electrical energy [
19]. Simulations were conducted based on the system equations, considering different operating conditions. The simulation procedure was divided into three stages.
In the first stage, parameters were defined, model equations were implemented in MATLAB, and representative curves of the generation system were obtained. This was crucial for characterizing the transducers and for integrating the piezoelectric beam model with the electrical model. Subsequently, the model of the DC-DC buck circuit was obtained using the Simulink/Sim-Power Systems toolbox, which provides the necessary elements for modeling power systems, including electronic circuits. The procedure involved inserting system elements, connecting circuit components, and defining their characteristic parameters.
After modeling the circuits, in the third stage, the systems were interconnected in the computational environment, and relevant data were defined for extraction. At the end of the simulation process, the electrical power generated by the circuits was evaluated to estimate the system’s autonomy. The autonomy time of the rechargeable battery used to power the microcontroller was assessed with and without the operation of the piezoelectric generation system.
3.2. Buck Circuit Model
The DC-DC buck circuit is widely used in energy harvester systems; therefore, it is important to simulate and evaluate its practical application. The DC-DC buck circuit in Simulink is similar to the LTC 3588-1 chip distributed by Linear Technology, which was used in the application. This chip integrates a full-wave rectifier and a high-efficiency DC-DC buck converter.
In the simulation, the circuit was integrated into the Simulink environment along with the oscillatory mechanical part, rectification, and DC-DC buck conversion. The ODE45 solver was used to solve differential equations.
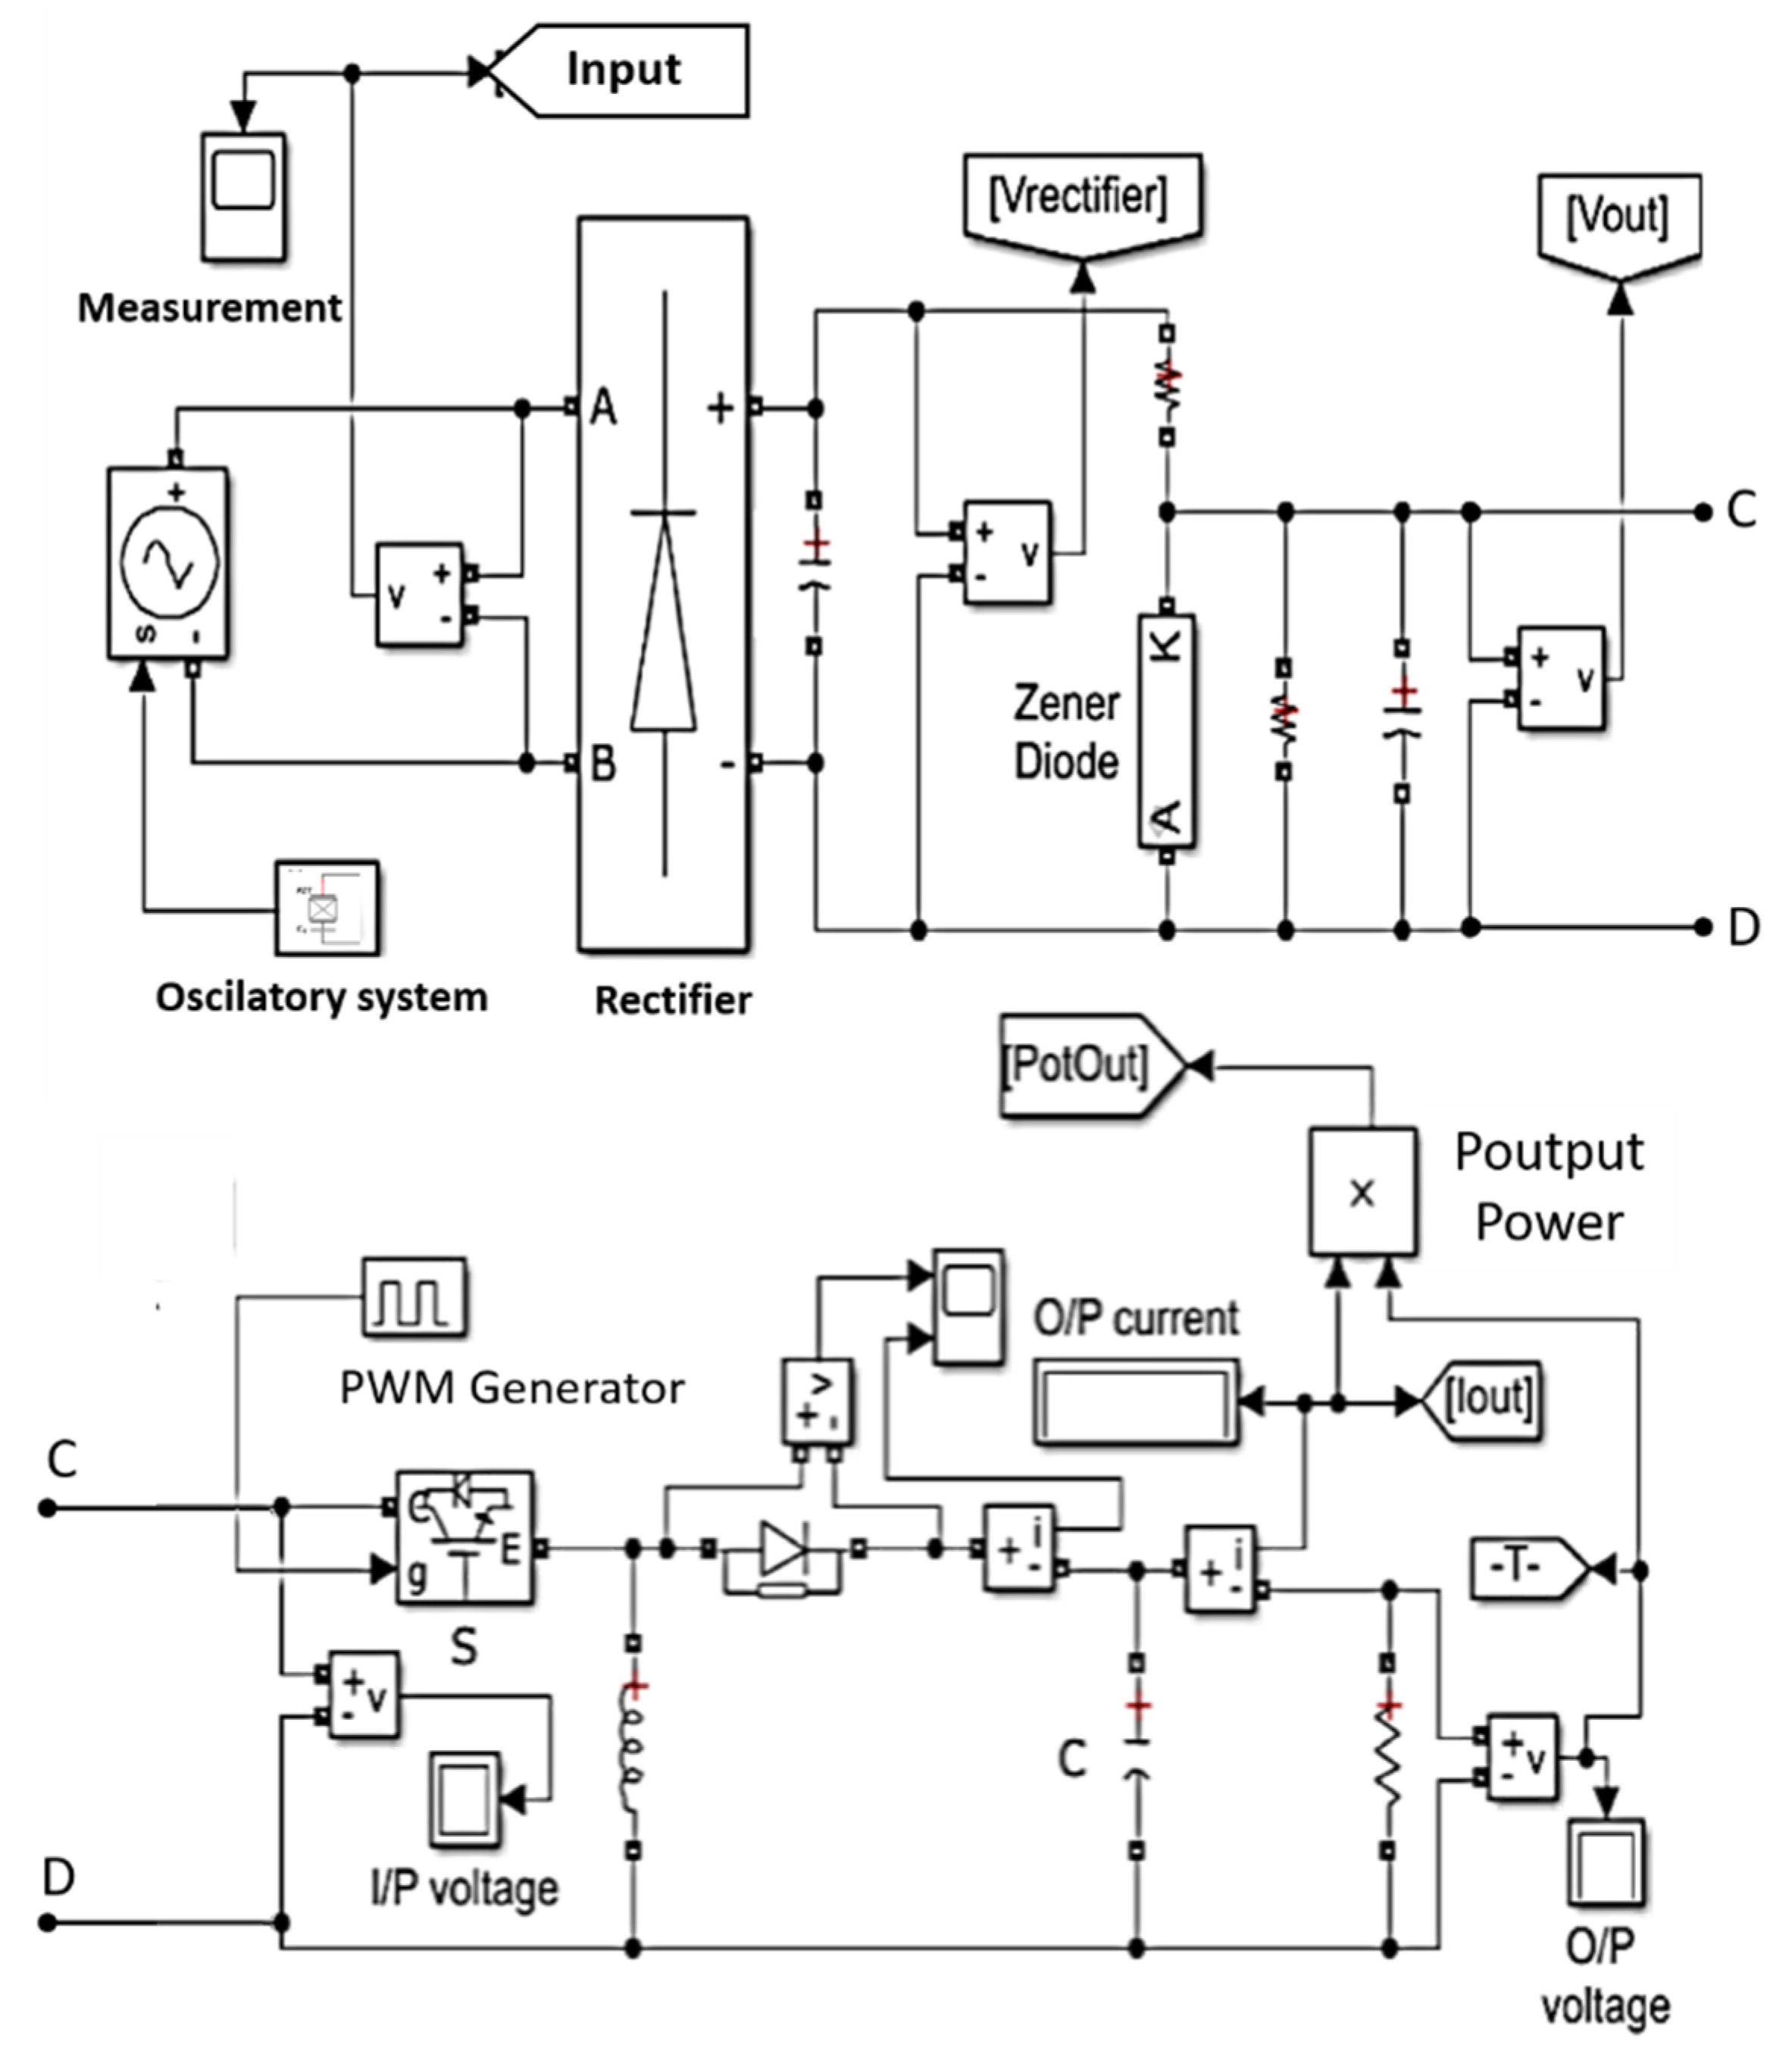
The overall model of the DC-DC buck circuit, the rectified input, and the 1-DOF oscillatory system are depicted in
Figure 2. A mass-spring-damper system controls a voltage source that powers the rectification circuit. After rectification, the signal is regulated by a Zener diode and delivered to the DC-DC converter circuit. The simulation was conducted for 4 s, with a sinusoidal frequency sweep from 0 to 50 Hz, to analyze the response of the extraction system.
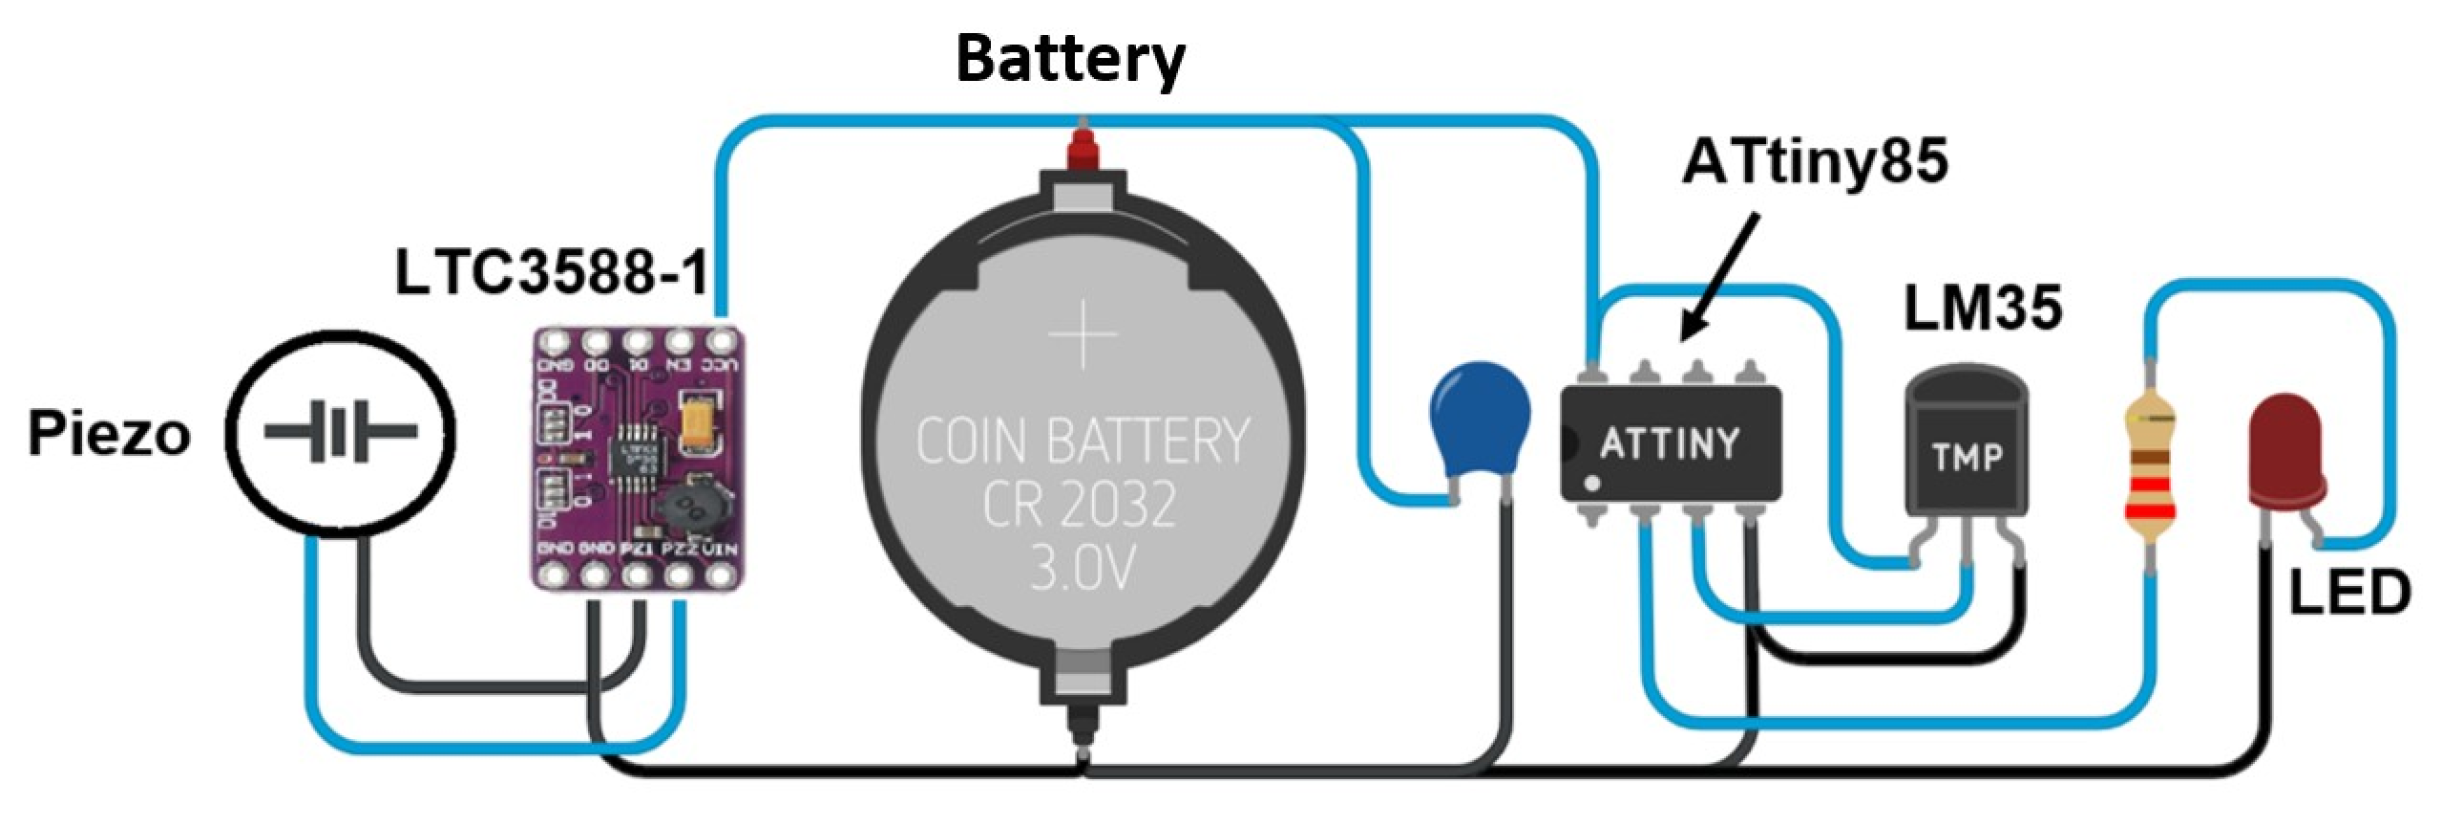
3.3. ATtiny85 Microcontroller
The optimization of electronic circuits in an energy generation system is crucial for improving energy efficiency. A common system involves combining a piezoelectric generator with an extraction circuit composed of an AC-DC rectifier and a DC-DC voltage regulator. Subsequently, the generated energy is stored before being utilized.
Figure 3 illustrates the general schematic of this system [
20].
In this work, the ATtiny85 microcontroller was used due to its easy programming, low cost, and low current consumption in sleep mode. It features a 10-bit analog-to-digital converter with 4 channels and operates safely within a voltage range of 1.8 V to 3.3 V, compatible with the battery and the DC-DC buck circuit. The microcontroller was programmed to operate at a frequency of 1 MHz without the need for an external clock signal. These characteristics make it ideal for a compact device that can operate for extended periods at low voltages while connected to a battery.
The LM35 temperature sensor was utilized to monitor temperature. This sensor has low power consumption, an operating range of 4 V to 30 V, and a current consumption of 60 μA. The sensor has a sensitivity of approximately 10 mV/°C and can measure temperatures between −55 °C and 150 °C.
The microcontroller performs real-time temperature readings through LM35. When it detects that the temperature has exceeded 40 °C, it exits the sleep mode and activates its output, indicating the setpoint crossover. When the temperature returns below the setpoint, it waits for about 3 s before entering sleep mode again. Both the microcontroller and the LM35 are powered by a rechargeable Li-ion battery (model LIR3032H, 3.7 V), charged by the piezoelectric transducer, with a capacity of 70 mA/h.
It is important to highlight that the circuit monitoring system will be evaluated through data acquisition in the Matlab Simulink environment, using the serial port. A heat gun was used to heat the sensor, allowing the evaluation of the temperature response, while the microcontroller’s sleep mode input and output were assessed.
3.4. Experimental Test Bench
According to the diagram in
Figure 4, the experimental system consists of a (1) power supply, (2) amplifier, (3) signal generator (Agilent 33210A), (4) shaker (ModalShop 2025E), (5) cantilever structure, (6) position sensors (LVDTs), (7) digital oscilloscope (Agilent DSO3062A), (8) signal acquisition system (QuantumX MX840B), (9) microcomputer, (10) spectrum analyzer, and (11) digital multimeter (Hikari, HM-2082). The chosen electromechanical system involves the shaker fixed on an inertial table, along with other equipment [
21].
The transducers used consist of two active layers (bimorph) made of PZT ceramic material, operating electrically in parallel and designed to be sensitive to flexural mechanical forces. The parameters of the PZT-5H and P5-13B model transducers are listed in
Table 2, and the details of the cantilever structures mounted with their respective models are illustrated in
Figure 2.
To facilitate installation in oscillatory mechanical systems and ensure rigidity, the transducers are secured using PVC bars. The piezoelectric constants d31 and d32, related to mode 31, are crucial for the efficiency of the piezoelectric material and are tabulated. The stiffness depends on the physical dimensions of the material and is related to Young’s modulus.
Piezoelectric materials, known for their high impedance resulting in high voltages and low currents, are influenced by the dielectric constant (ε) in their energy efficiency. The dielectric constant, an intrinsic property, plays a crucial role in the generator’s performance, with higher values being preferable. Additionally, the sensor’s geometry can impact the effective dielectric constant, influencing the distribution of voltages and electric fields [
22,
23]. Ceramic materials like PZT are often chosen due to their favorable electrical and mechanical properties, typically exhibiting satisfactory values for the dielectric constant ε.
It is important to highlight that a structure that undergoes deformation when subjected to a load is considered flexible. The system used models of the piezoelectric sensor as a cantilever beam, with controlled frequency and amplitude excitation.
3.5. Experimental Test Procedures
The experimental setup procedures were implemented on a Minipa protoboard to reduce circuit dimensions and minimize losses due to the Joule effect. The assembled circuits are shown in
Figure 5. A 1 MΩ, 0.2 W potentiometer was used in the resistive circuit of
Figure 5a, and a 16 V capacitor with 100 µF and a DB107 bridge rectifier were used in the full-wave rectifier circuit of
Figure 5b.
An external amplifier and a 100 mV sinusoidal signal generator were connected to adjust the frequency and amplitude of the input signal to the shaker. The signal generator was linked to the amplifier for compatibility with the shaker. A spectrum analyzer monitors the input signal to the shaker, while the oscilloscope monitors the output signal from the piezoelectric transducer. Voltmeters and ammeters measure the voltages and currents of the transducer.
The cantilevered configuration was employed with a mass at the end of the piezo to adjust the resonance frequency and maximize energy generation.
The selection of resistors and capacitors in the circuits (
Figure 5) was primarily driven by practical considerations to ensure stable operation and ease of tuning. In the resistive circuit (
Figure 5a), a 1 MΩ, 0.2 W potentiometer was chosen for its wide resistance range, which facilitated practical adjustments during testing. This allowed fine-tuning the load without needing to swap components, thus streamlining the experiment. For the rectifier circuit (
Figure 5b), the 100 µF, 16 V capacitor was selected based on its effectiveness in smoothing the output signal and reducing ripple under the operational conditions of the experiment. The 100 µF value was determined through preliminary tests that showed it provided an optimal balance between charge time and voltage stabilization, while the 16 V rating ensured reliable performance without component failure during voltage fluctuations. These choices were made to maintain efficiency and stability throughout the testing process.
Signals were acquired by a system with LVDT, an oscilloscope, a spectrum analyzer, and a digital multimeter, with data acquisition and visualization performed on the computer.
The natural frequencies of the systems were characterized using an oscilloscope and spectrum analyzer with an impact hammer and accelerometer. The piezo capacitances were measured using a function generator and an oscilloscope. The generation response in the resonance regions was evaluated by varying the potentiometer values. For the DC-DC buck circuit, the power response was analyzed as a function of the excitation frequency adjusted by the generator.
3.6. Analysis and Validation of Results
A validation of this method was performed by comparing experimental and analytical results according to the following methodology:
- (a)
Observation of frequency response peaks to determine if they align with the expected natural frequencies in the theoretical model.
- (b)
Verification of whether the transducer achieves the expected potential for generating electrical energy in experiments for the proposed cases: resistive circuit, circuit with diode bridge, and DC-DC buck converter.
- (c)
Assessment of relative error percentages concerning analytical results to verify the conformity of the experimental model.
- (d)
Comparison of the potential generated by the transducers with recent works in the literature, considering power density, voltages, and natural frequencies.
- (e)
Evaluation of the monitoring system’s compliance with mode change requirements, ensuring that the Attiny85 microcontroller operates correctly with low power consumption.
4. Results and Discussions
4.1. Validation of the Mechanical System
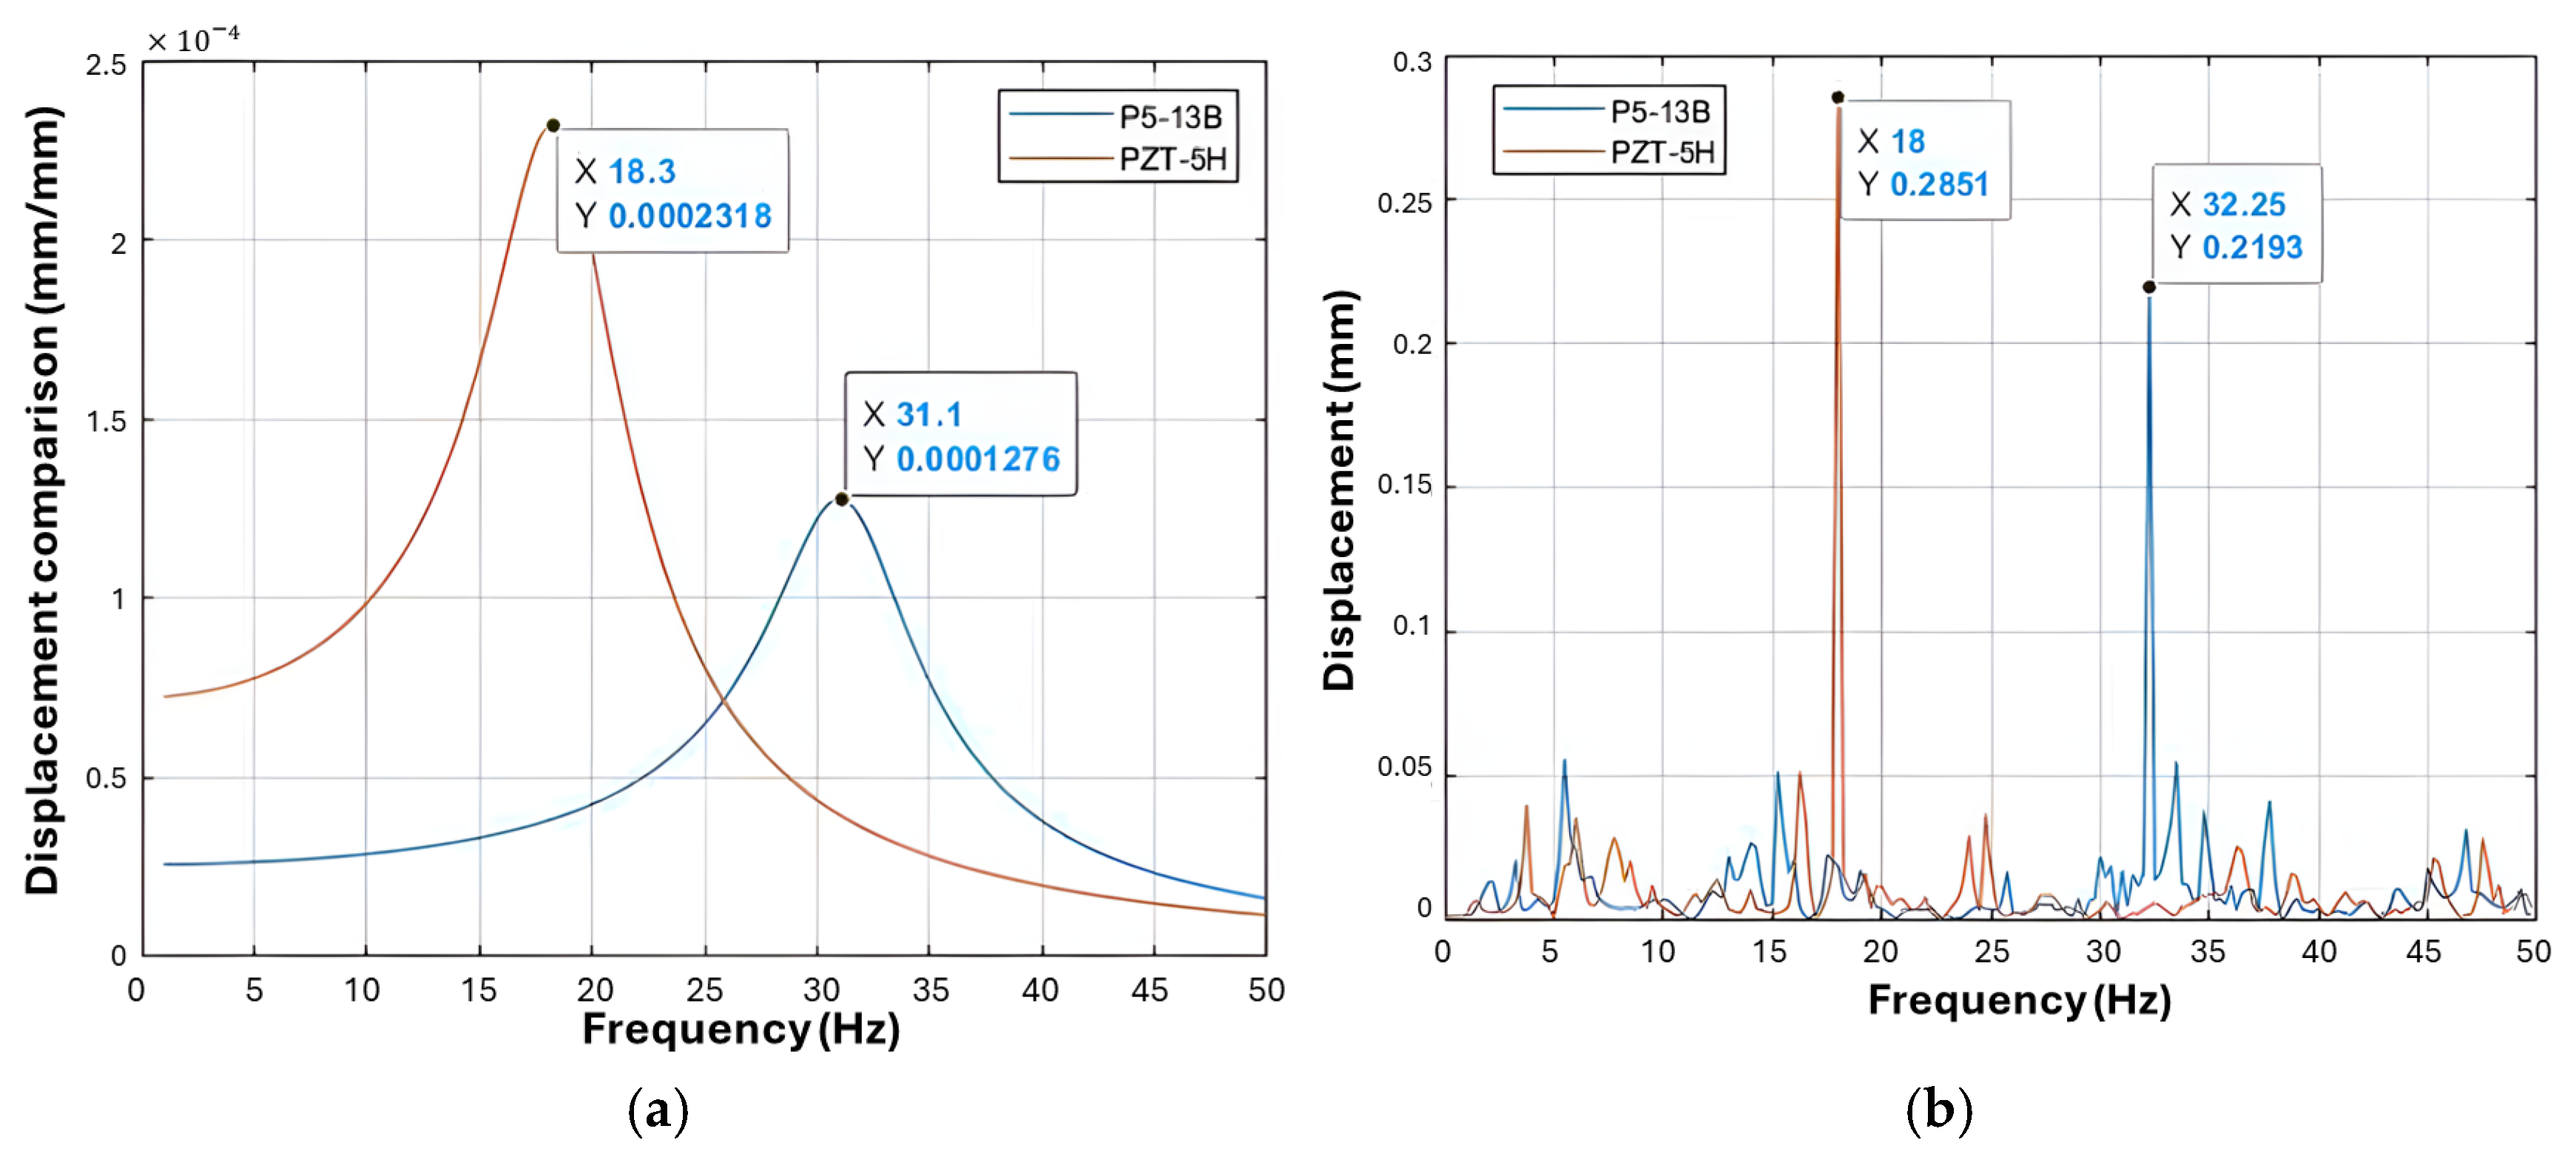
To validate the system, we compared the resonance frequencies obtained from analytical and experimental models. The analytical model utilized the transfer function of both piezoelectric transducers, while the experimental model involved an impact test using a hammer and a frequency response captured by an accelerometer. A frequency ramp (0 to 50 Hz) further confirmed resonance by measuring the maximum voltage on an oscilloscope. As illustrated in
Figure 6b and
Table 3, the peaks in oscillation amplitude represent the natural resonance frequencies, where the system achieves maximum energy and efficiency.
These experimental methods allow for a precise determination of the resonance region, critical for optimizing energy capture from the transducers.
It is noted that the PZT-5H piezoelectric exhibited a larger amplitude due to its larger dimensions and lower rigidity, allowing it to generate higher energy levels at its resonance frequency. The peaks determine the region of resonance and capture better energy levels, and the results are acceptable. After the experiments, errors of 1.63% and 4.50% were obtained with the analyzer, and 2.73% and 2.57% with the oscilloscope, for the PZT-5H and P5-13B transducers, respectively.
4.1.1. Case 1—Resistive Load
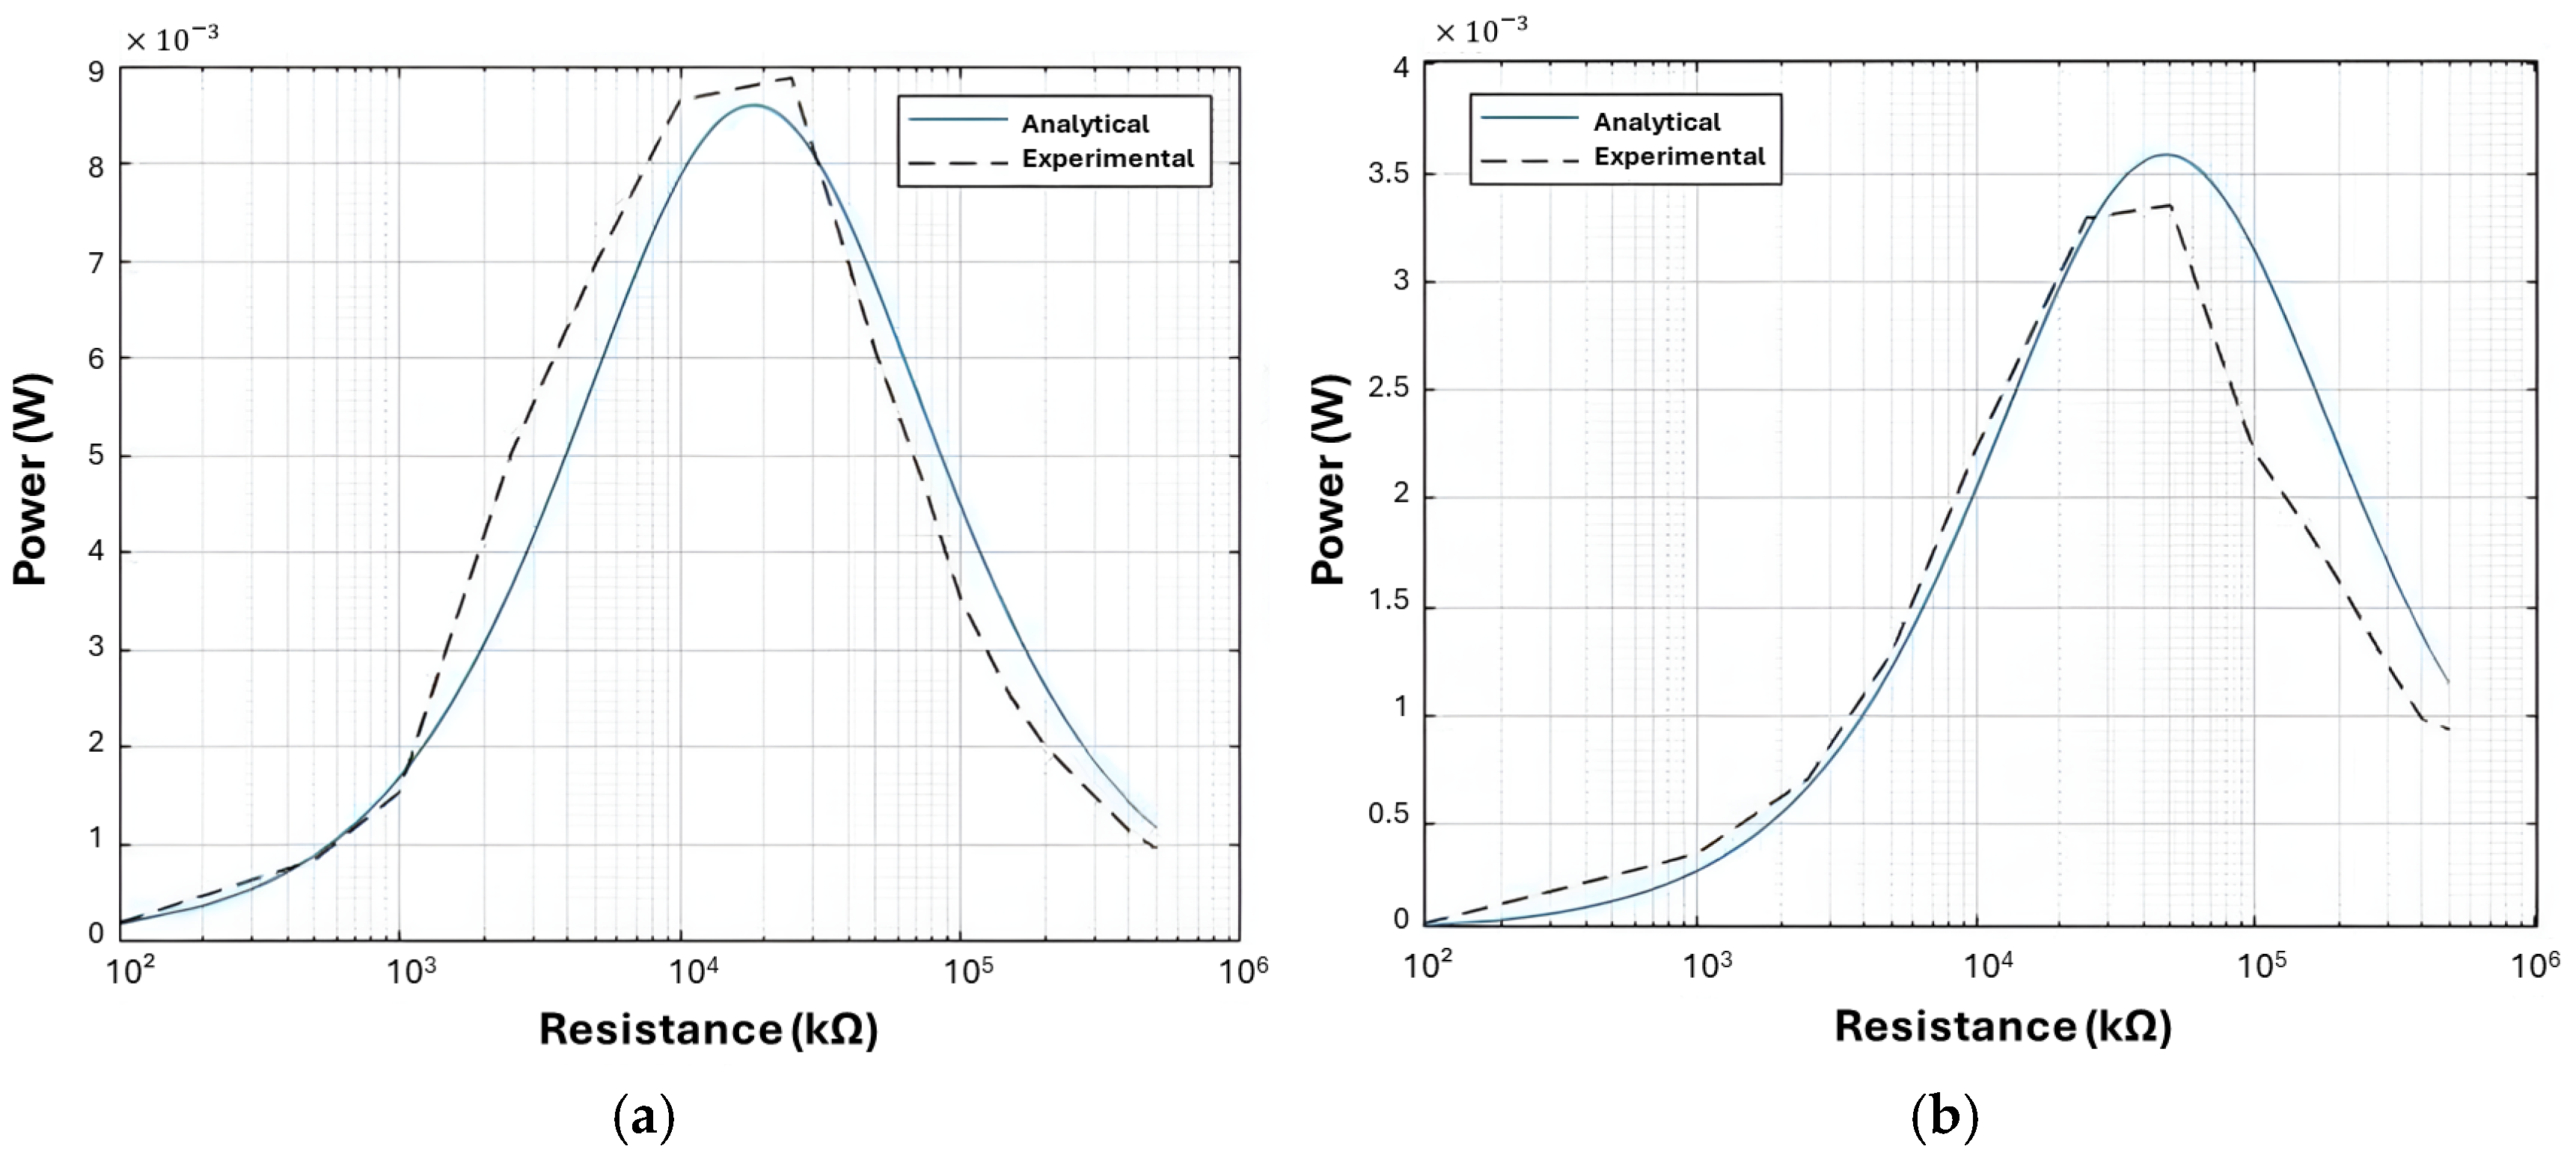
In this case (resistive load), the value of maximum power was determined for comparison with analytical values, and, consequently, the circuit power (ROpt) for the frequency used was determined.
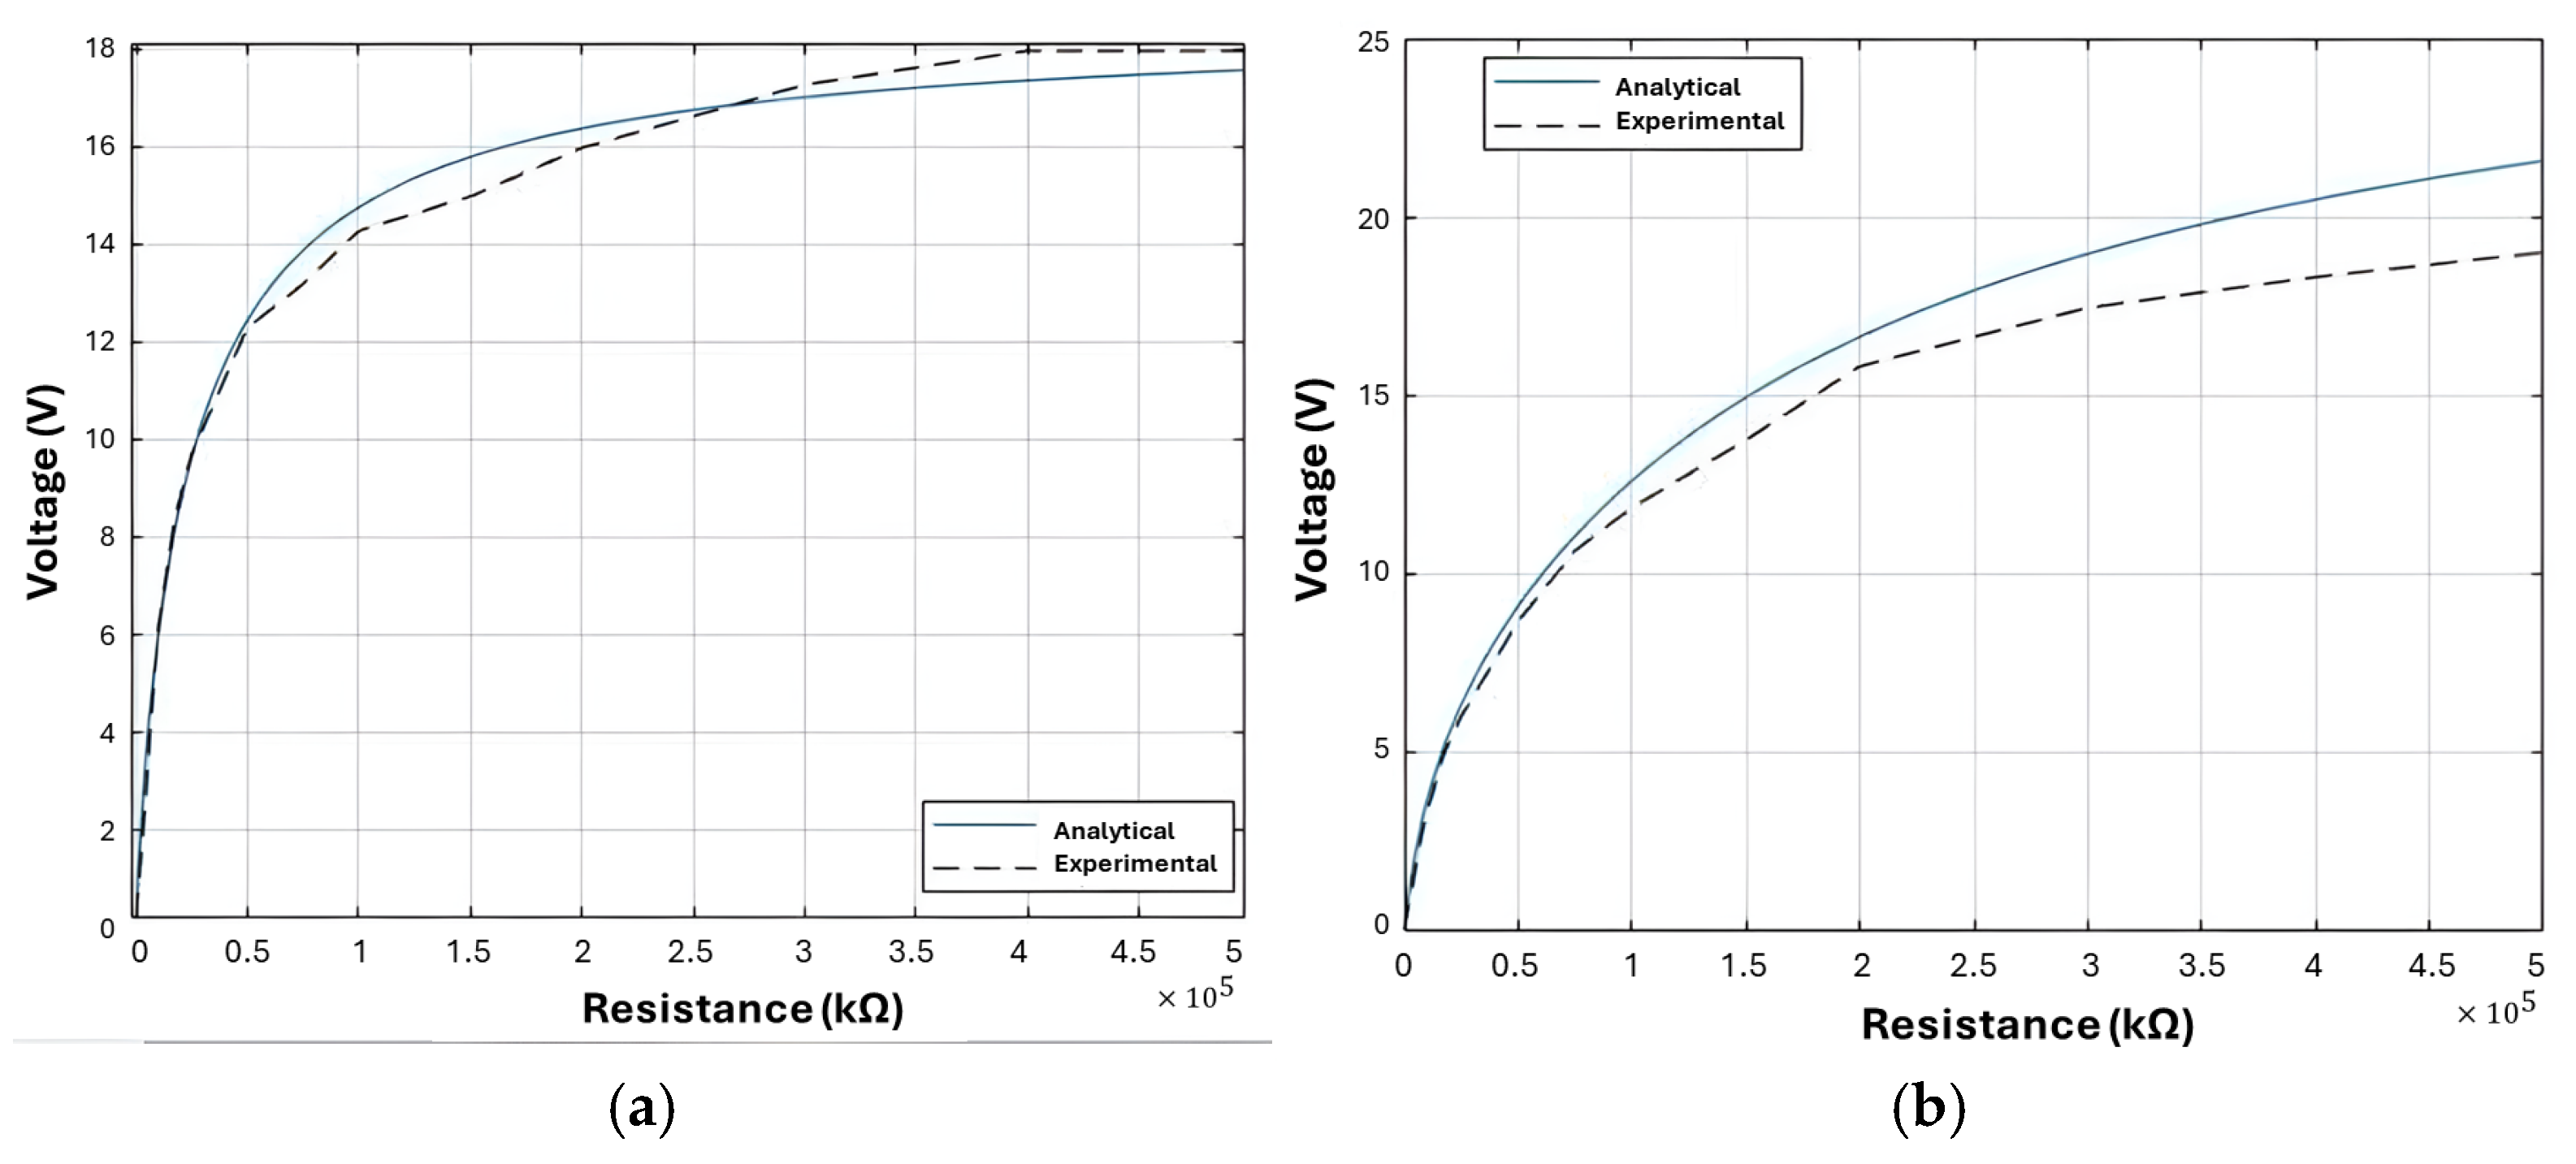
In this experiment, the excitation frequency was fixed, and the value of the load resistance was varied to obtain the electrical voltage and output current in the piezoelectric transducer. At the resonance frequency, an ROpt of 25 kΩ and 50 kΩ was obtained for the PZT-5H and P5-13B transducers, respectively. In comparison with the analytical result, errors of 9.46% and 9.48% were obtained for the PZT-5H and P5-13B transducers, respectively (
Figure 7 and
Table 4).
In
Figure 7, it can be observed that there is conformity between the analytical and experimental curves up to the value of 0.5 × 10⁵ Ω, after which the values diverge, explaining the high error. This error is associated with the fact that the resistances do not reach the maximum generated voltage as the piezos’ generation capacity has practically been reached. In
Figure 8 and
Table 5, the results of the voltage curves generated as a function of the generated power for the transducers are detailed.
The comparison between the experimental and analytical values of the maximum powers generated by the circuit with a load resistor, with values of 25 kΩ and 50 kΩ, was below 5%, validating the model for Case 1—resistive load.
4.1.2. Case 2—Diode Bridges
Following the same previous procedures,
Figure 9 and
Table 6 show the voltages obtained with a diode bridge circuit, capacitor, and resistor for both transducers.
Although there is reasonable agreement between the analytical and experimental curves in
Figure 9, the difference between the results obtained for the PZT-5H and P5-13B transducers is significant, with errors of 2.04% and 11.79%, respectively, as indicated in
Table 6. It is important to note that a greater difference in the P5-13B piezo is associated with the fact that it has a lower generated current and, therefore, greater difficulty in ensuring the transistor thresholds.
Similarly to the resistive circuit (Case 1), the curves and results of resistance x power for the diode bridge circuit were obtained, as shown in
Figure 10 and
Table 7.
The errors obtained from the analytical and experimental comparison for the maximum generated powers were 2.29% and 6.09%, associated with the resistance values of 17.5 kΩ and 75 kΩ for the PZT-5H and P5-13B transducers, respectively. This is consistent with expectations due to variations in the electrical parameters of the electrical components.
However, pronounced distortions were observed in piezo P5-13B, which showed the lowest generated potential due to its lower coupling factor, a smaller volume of piezoelectric material, and lower deformation capacity due to the dimensions of the beam to which the piezoelectric material is attached, along with greater difficulty in securing the beam.
4.1.3. Case 3—DC-DC Buck Circuit
In
Figure 11, the power curves as a function of frequency generated by the DC-DC buck converter circuit, LTC-3588-1, are presented. The circuit’s output power was evaluated by varying the excitation frequency in 5 Hz increments.
In
Figure 11, it is observed that the system generated a power of 4.53 mW and 1.38 mW for the PZT-5H and P5-13B transducers, respectively. The Simulink graph shows higher density in the power peak regions, including the system’s resonance region. With this data, it is evident that the P5-13B device, due to the low power generated in this experiment, is limited in its applicability in monitoring systems.
Table 8 presents the results of the Simulink simulation and experimental values, demonstrating the approximation between the values and highlighting the DC-DC buck converter circuit, LTC-3588-1, as an ally for the extraction and storage of piezoelectric energy. It is important to note that the IC allows voltage selection, enabling the choice of the best option for storing energy in the rechargeable battery and application. The DC-DC buck converter circuit had an output setpoint of 3.3 V.
Table 9 presents the power densities of the PZT5H and P5-13B transducers, which have volumes of 1.368 cm
3 and 0.820 cm
3, respectively, for comparative purposes. It is observed that, despite the circuit with a resistor generating more power, the reached voltage was 21.9 V, which makes it impractical for use in TTL circuits. On the other hand, the circuit with a bridge rectifier presented lower generated power due to diode polarization, Joule effect losses, and capacitor loading.
Considering the volume parameters of each transducer in cm3 and the power density, which allows evaluating the generation per unit volume, it is concluded that the resistive circuit presented the highest current availability, but the voltage is not continuous enough to be applied to an IC. On the other hand, the LTC-3588 consumes a portion of the generated power, and although the circuit has lower power generation, it has a stable average voltage of 3 V, which is interesting for use in TTL-level integrated circuits of 5 V.
4.2. Application in Temperature Monitoring System
In the Simulink/MATLAB environment, the data from the Attiny85 microcontroller was monitored to evaluate its operation in different states.
Figure 12 shows the system assembled on a protoboard, where a battery powers both the microcontroller and the LM35 temperature sensor, as well as the indicator LED, allowing the storage of the generated energy.
To enhance the understanding of the energy harvesting process,
Figure 12 illustrates the complete system where the energy generated by the piezoelectric transducers is converted and stored using the LTC3588-1 circuit. This stored energy is then utilized to power the temperature monitoring system. The microcontroller (ATtiny85) and temperature sensor (LM35) benefit from the harvested energy, ensuring efficient power usage and longer operational autonomy.
For data acquisition, the microcontroller sends temperature information, using the PWM pin, and the microcontroller’s state (on or in sleep mode) to the acquisition system. The information is sent via serial communication with a baud rate of 9600 bps (bits per second) and a 4-bit struct data type, with an “R” identifier at the beginning for Simulink system identification. The temperature reading occurs at each complete watchdog cycle.
In the application, the microcontroller monitored the ambient temperature, generating a response signal, as shown in
Figure 13.
Analyzing
Figure 13, it can be observed that the microcontroller enters active mode when the temperature exceeds 40 °C and returns to sleep mode after 3 s if the temperature falls below the setpoint. The microcontroller will only exit sleep mode again if there is a new exceeding of the setpoint value.
The piezoelectric element, in conjunction with the LTC-3588-1, can generate up to 4.53 mW at its maximum potential, thus maintaining the electrical potential of the system. However, it is necessary to evaluate the autonomy of the monitoring system with the use of the battery.
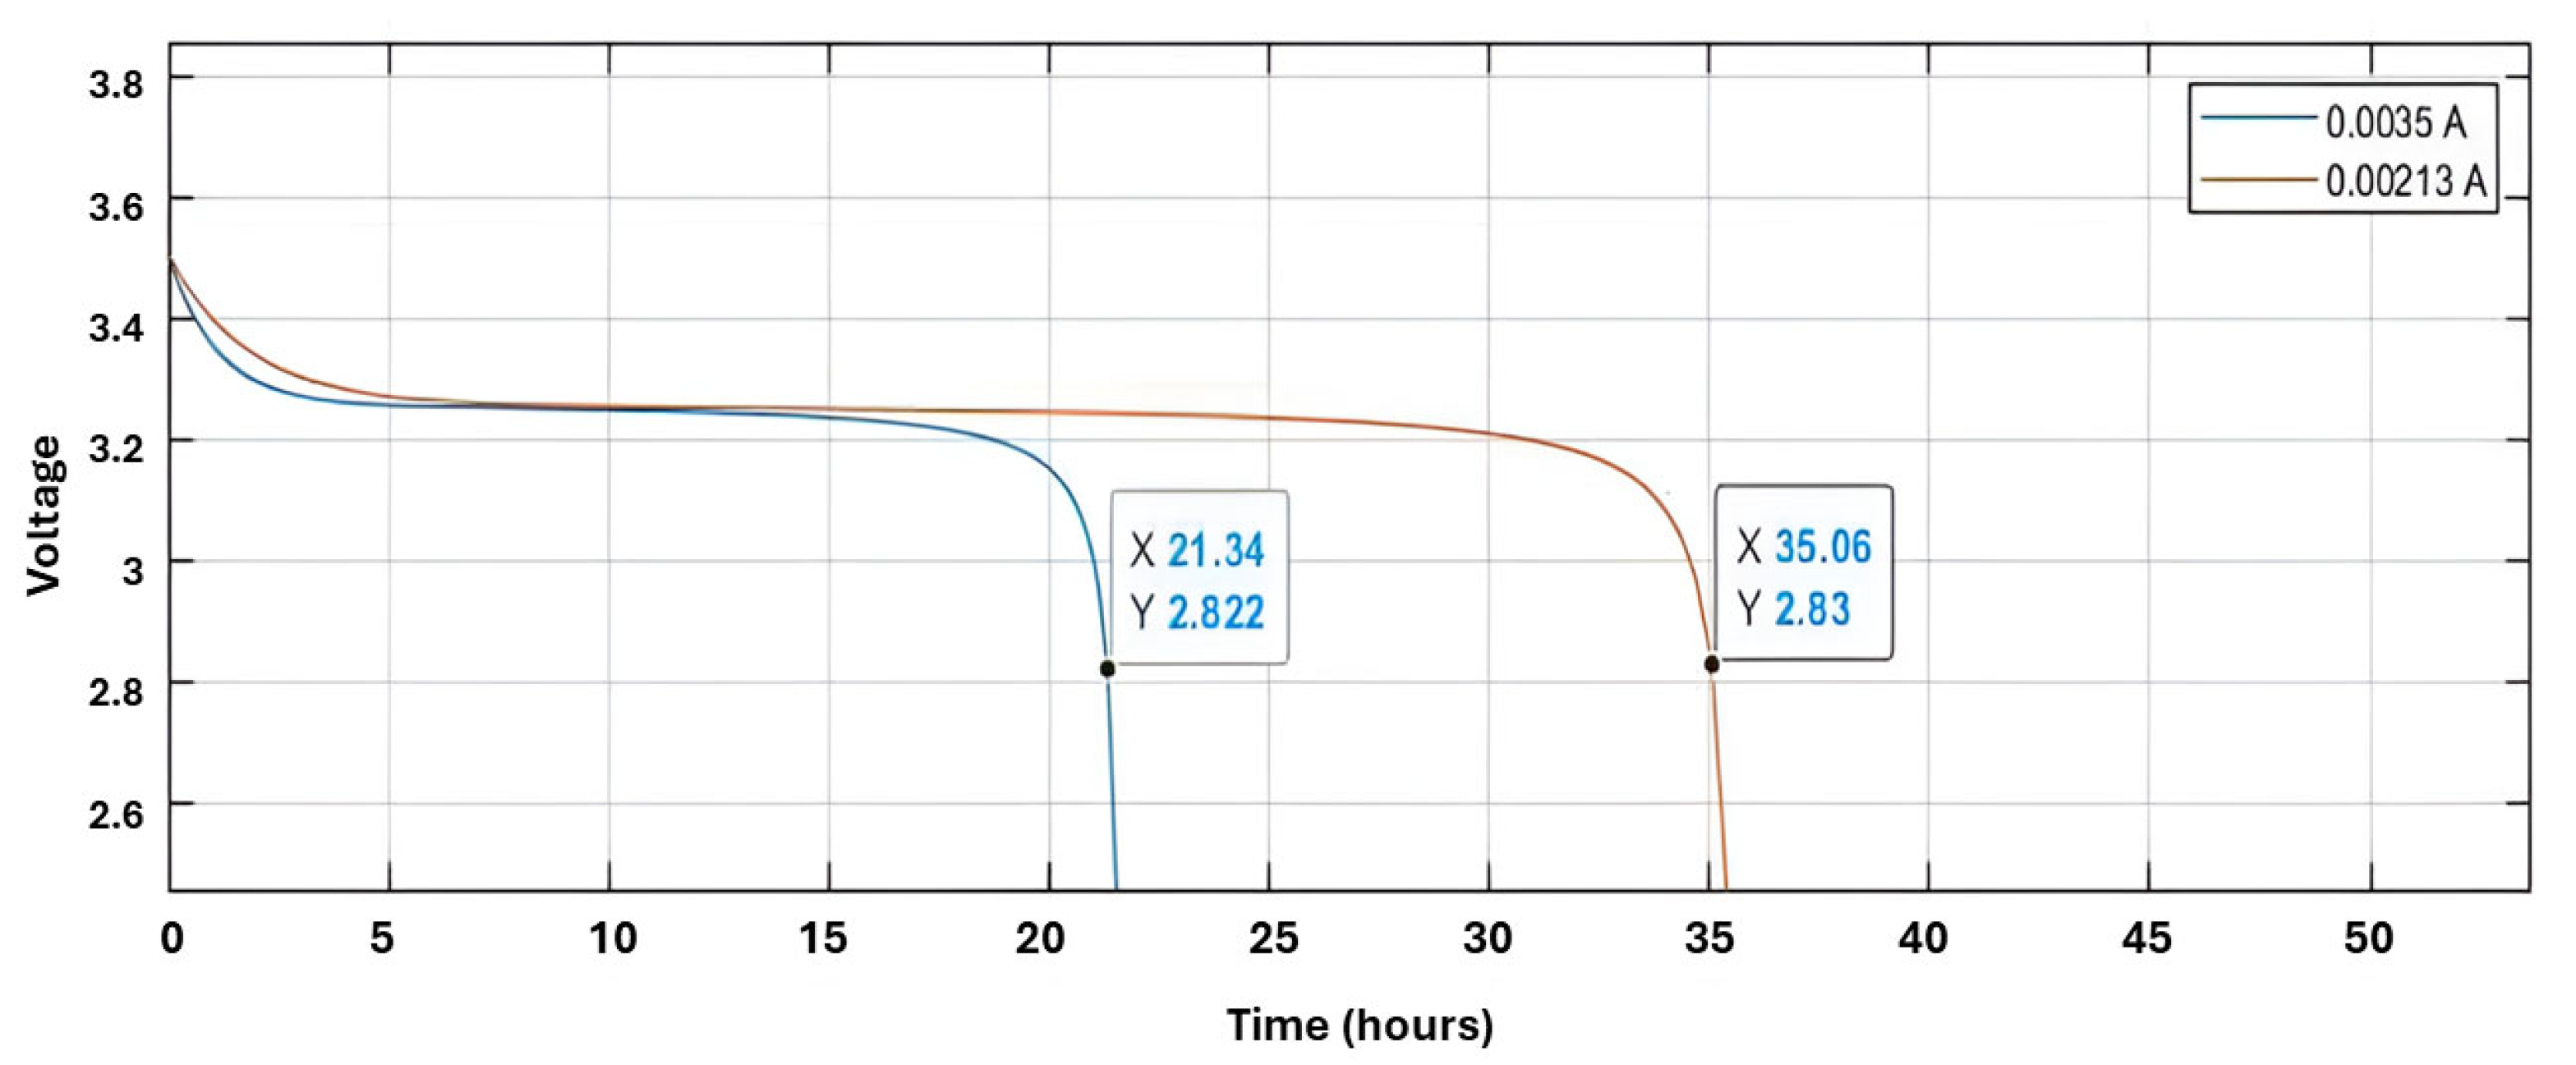
In this configuration, a fully charged battery has 3.6 V and a cut-off voltage of 2.7 V during use, which is the operating voltage limit of the microcontroller. The system can function until the battery is fully discharged, and, considering that the temperature stays above the setpoint for 50% of the time, i.e., a consumption of 3.5 mA/h (measured), the system would have an autonomy of 21.34 h without charging. With the system charging, consuming 2.3 mA/h (assuming the piezoelectric generator is in ideal condition), the circuit would operate for 35.06 h, representing an increase of 64.3% in the system’s autonomy.
Figure 14 shows the Simulink-implemented simulation of the autonomy of the monitoring system based on this data.
4.3. Final Comments
This research explored and applied the concept of energy harvesting to generate electrical current and power low-power systems. The analytical simulations conducted in Matlab and Simulink, which showed results close to the experiments, validated the relevance of these simulations as valuable tools for study. The developed electronic circuit, consisting of a resistor, full-wave rectifier, and buck-boost converter, was tested and validated in a low-power temperature monitoring system. The promising results indicate that this circuit can be applied in energy harvesting systems, converting mechanical efforts, such as vehicle vibrations, wind, electric motors, machinery, and pedestrian movement, into usable electrical energy to power low-consumption circuits. This technology is especially advantageous in remote or hard-to-reach locations as it extends the time between device recharges and reduces the need for constant maintenance and monitoring.
The comparison conducted between PZT-5H and P5-13B piezoelectric transducers is essential because their specific properties can lead to significantly different performances in practical applications. This is especially relevant in contexts where optimizing energy efficiency is crucial, such as in low-power autonomous systems. The results obtained in this study can provide valuable insights for engineers seeking to optimize energy harvesting systems, particularly in situations where small efficiency gains can have a significant impact.
The results presented in this paper reinforce the employment of piezoelectricity in energy harvesting systems to generate energy for low-power loads. Considering the variety of piezoelectric sensors and the variety of mechanisms to convert mechanical energy into electricity by this technology, it is a challenge to find similar systems to compare these results in terms of generated power, for instance. Yet, some cited works can be used as examples and aim to understand the importance of evaluating the efficiency in terms of mechanical energy converted.
Psoma et al. [
24] used piezoelectric sensors to generate energy in a biomechanic application, installing these transducers in the fingers of a glove. The hand movement when each finger impacts a keyboard, table, or mouse during standard use can generate a power of 323 mW. Observe that this result represents a great difference in energy harvesting when compared with the application of this work, which employs a vibrational cantilever beam. To understand the origin of this difference, it is important to observe the mechanical energy applied in the movement: while the vibrational system uses free vibration and the inertial mass of vibration, the other system directly converts the applied force from the impact between the fingers of a glove and the solid surface of a keyboard or table.
The other cantilever beam system tested in Motter [
25] also presents low-power-generated energy, similar to this work, which confirms the nature of low-power-generated sources when employing a vibrational system.
In the opposite direction, following the principles of Psoma et al. [
24] but extrapolating the example of external force applied in a piezoelectric harvesting system, Xu et al. [
26] used PZT-5H (the same transducer used in this work) to create a device embedded in asphalt pavement to generate energy for traffic road facilities. In this case, the external force was derived from vehicles that rolled on the road surface.
5. Conclusions
In this paper, a comparative study was conducted between two commercial models of piezoelectric transducers, PZT-5H and P5-13B, subjected to different types of loads. The results indicated distinct behaviors in terms of generated power. Maximum power outputs of 8.88 mW for the PZT-5H and 3.3 mW for the P5-13B were achieved, with corresponding electrical power densities of 6.49 mW/cm3 and 4.02 mW/cm3, respectively, when operating at their resonance frequencies. Although both transducers demonstrated good power generation performance, the findings suggest that, for the same configuration, a larger transducer with a higher coupling factor and greater deformation capacity is more advantageous for maximizing energy generation.
In terms of the energy harvesting system, the circuits implemented played a crucial role in optimizing the overall performance. The resistor and diode bridge circuits, while simple, showed a disadvantage in output voltage. In contrast, the LTC-3588-1 circuit achieved a stable output of 3.3 V and generated 4.53 mW of power, proving effective in boosting the system’s efficiency for low-power applications. This circuit’s ability to consistently convert the harvested energy into usable power makes it suitable for powering microcontroller-based systems, such as temperature sensors, extending their operational autonomy. The energy harvesting system demonstrated an increase in system autonomy by approximately 64.3% under dynamic temperature conditions, with the potential for further improvements in environments with more stable conditions. These results highlight the practicality of integrating energy harvesting circuits like the LTC-3588-1 into low-power sensor networks, enhancing sustainability and reducing dependency on external power sources.


 ,
, 


