Communication

Exploring the Effects of Gratitude Voice Waves on Cellular Behavior: A Pilot Study in Affective Mechanotransduction

by
David del Rosario-Gilabert
1,2,3,4,*,
Jesús Carbajo
4,
Antonio Valenzuela-Miralles
1,2,
Irene Vigué-Guix
1,
Daniel Ruiz
3,
Gema Esquiva
2 and
Violeta Gómez-Vicente
2
1
Instituto de Neurociencia Avanzada de Barcelona (INAB), Passeig del Mare Nostrum, 15, 08039 Barcelona, Spain
2
Department of Optics, Pharmacology and Anatomy, University of Alicante, 03690 San Vicente del Raspeig, Spain
3
Department of Computer Technology, University of Alicante, 03690 San Vicente del Raspeig, Spain
4
Department of Physics, Systems Engineering and Signal Theory, University of Alicante, 03690 San Vicente del Raspeig, Spain
*
Author to whom correspondence should be addressed.
Appl. Sci. 2024, 14(20), 9400; https://doi.org/10.3390/app14209400
Submission received: 22 August 2024 / Revised: 21 September 2024 / Accepted: 10 October 2024 / Published: 15 October 2024

Abstract

:
Emotional communication is a multi-modal phenomenon involving posture, gestures, facial expressions, and the human voice. Affective states systematically modulate the acoustic signals produced during speech production through the laryngeal muscles via the central nervous system, transforming the acoustic signal into a means of affective transmission. Additionally, a substantial body of research in sonobiology has shown that audible acoustic waves (AAW) can affect cellular dynamics. This pilot study explores whether the physical–acoustic changes induced by gratitude states in human speech could influence cell proliferation and Ki67 expression in non-auditory cells (661W cell line). We conduct a series of assays, including affective electroencephalogram (EEG) measurements, an affective text quantification algorithm, and a passive vibro-acoustic treatment (PVT), to control the CO2 incubator environment acoustically, and a proliferation assay with immunolabeling to quantify cell dynamics. Although a larger sample size is needed, the hypothesis that emotions can act as biophysical agents remains a plausible possibility, and feasible physical and biological pathways are discussed. In summary, studying the impact of gratitude AAW on cell biology represents an unexplored research area with the potential to enhance our understanding of the interaction between human cognition and biology through physics principles.

1. Introduction

Since the earliest recorded history, emotions have been the subject of interest for the scientific community due to their significant impact on humans’ daily lives and well-being [1]. Emotions are an inherent aspect of the human experience and play a fundamental role in communicating with others [2], affecting posture, gestures, and facial and oral expressions [3,4,5,6,7,8]. However, although several studies have attributed a prominent role to the voice in the recognition of emotional experience, oral expressions of emotion have been considerably less extensively investigated than facial expressions [9,10].
The articulation of emotional states through sound is a complex phenomenon. People raise their voices when they are happy or angry, modifying their voice characteristics through the laryngeal muscles [11,12] and encoding emotional information in the resulting speech signal [13,14,15]. Ultimately, emotions modify the characteristics of the phonatory apparatus [13,14,15], affecting different acoustic parameters such as fundamental frequency contour (F0), timbre, amplitude, and temporal aspects [16,17,18,19]. It has been demonstrated that humans can perceive and differentiate the emotions of others by listening to voice signals [20,21,22,23,24].
One emotion that falls within the positive emotion category is gratitude. Consider the affective feeling of having a flat tire on a remote road and a passerby stops to assist you in changing it. Such unexpected acts of kindness can evoke strong feelings of gratitude, emphasizing the importance of social support in times of need. Gratitude is strongly associated with higher well-being, social relationship benefits, and lower stress and depression levels [25,26]. Several studies have revealed that gratitude correlates with areas of the anterior cingulate cortex (ACC) and medial prefrontal cortex (mPFC) [27,28]. Electroencephalogram (EEG) devices have demonstrated their potential for classifying positive emotions, including gratitude, with an accuracy of approximately 80% [29]. Likewise, the use of gratitude letters has been demonstrated to be an effective method for inducing feelings of gratitude in laboratory settings [30,31], and affective dictionaries have been proposed as a systematic method for assessing and quantifying the emotional content of textual data [32,33].
Additionally, several studies have demonstrated the capacity of audible acoustic waves (AAW) to alter cell behavior [34,35]. The well-established field of mechanotransduction examines the physical–biological process by which AAWs reach the extracellular matrix and interact with cell nuclei [36,37,38]. Building on this idea and the concept that emotions act as physical modulators of human speech, we hypothesize that gratitude AAWs could influence cellular dynamics through the human voice. Specifically, this pilot study aims to determine whether gratitude, as a biophysical agent, can affect the proliferation of non-auditory cells.

2. Materials and Methods

2.1. Participants

The participant, a 48-year-old Spanish right-handed male, was a renowned spiritual guide. This study was designed in accordance with the Declaration of Helsinki and was approved by the Institutional Committee for Ethical Review of Projects (CIREP-UA) of the University of Alicante (Alicante, Spain).

2.2. Design

Four different AAWs were employed during experimentation: (i) control, (ii) emotional voice, (iii) non-emotional voice, and (iv) synthesized emotional voice. At the beginning of the session, the participant wrote a gratitude letter in accordance with the Toepfer and Walker protocol [39] in a quiet, private room.
The gratitude letter (see Appendix A) was then read out loud in front of a transductor to generate the emotional voice condition (ii). The non-emotional voice condition (see Appendix A) was a recording firstly of a text fragment from Don Quixote de la Mancha, under identical conditions as in case (ii), by the same subject. Non-emotional stimuli (iii) were recorded before emotional stimuli (ii) because the effects of writing a gratitude letter may be persistent over time [30]. The synthesized emotional voice condition (iv) was synthesized from the gratitude letter written by the participant, and it contained the same words and cadence of that condition (ii). During the readings (ii) and (iii), the participant’s EEG recording was taken. The total time spent in the room (writing gratitude letter + placing EEG electrodes + recording emotional and non-emotional stimuli) was about 45 min. Subsequently, a word analysis algorithm using affective dictionaries was developed to quantify the emotional component of texts.
Ultimately, an electro-acoustic radiation system based on a loudspeaker and passive acoustic treatment was installed in the CO2 incubator. All AAWs were radiated over non-auditory cells for 72 h in independent experiments at a distance of 27 cm. In the control condition (i), the electroacoustic system remained off. Biological assays were carried out.

2.3. Set-Up

2.3.1. Audio Recording System

The recording system consisted of a condenser microphone (model Rode NT5 S, produced by RØDE, Sydney, Australia), situated at a distance of 15 cm from the source, coupled with a passive acoustic device (model Kaotica Eyeball, Winnipeg, MB, Canada) to minimize the impact of the recording environment. The transducer was connected to a Zoom-H6 recorder and registered in WAV format (16-bit, 44,100 Hz).

2.3.2. EEG Data Recordings

EEG signals were captured using 15 passive electrodes (FP1, FPz, F7, F3, Fz, F4, F8, C3, Cz, C4, P3, Pz, P4, O1, O2) arranged in accordance with the international 10–20 system [40]. The recordings were taken using the OpenBCI system, with a sampling rate of 125 Hz, and touch-proof electrode adapters (all produced by OpenBCI, Brooklyn, NY, USA). Electrode impedance was maintained below 50 kOhms, according to the impedance mode coded in the software of the OpenBCI GUI (version 5.2.2). The default settings of the OpenBCI electrode cap were used for the online reference and ground electrodes.

2.3.3. Passive Vibro-Acoustic Treatment

The reason for using a passive vibro-acoustic treatment (PVT) was twofold. On the one hand, since a diffuse field can be assumed in an enclosure, the reverberant field is expected to dominate the acoustic behavior in a CO2 incubator. On the other hand, passive sound-absorbing materials and insulating materials reduce background noise generated by electro-mechanical systems and actuators improving signal-to-noise ratio (SNR) while homogenizing the acoustic environment at the same time. For this purpose, EliAcoustic Pyramidal sound-absorbing material (595.0 × 595.0 mm with a thickness of 50 mm and a density of 29 kg/m3) was placed on the walls of the incubator (FormaTM Steri-CycleTM CO2 incubator, model 371, Thermo Electron Corporation, Waltham, MA, USA), and COPOPREN insulation (470 × 490 mm, 80 mm thick and 80 kg/m3 density) was installed in the incubator tray to reduce structural vibrations (Figure 1a).

2.3.4. Electro-Acoustic Radiation System

The acoustic stimulus was radiated onto the non-auditory cells using a Bose SoundLink Color II loudspeaker suspended on an acoustic hanger in a CO2 incubator at an equivalent sound pressure level (Lp) of 80 dB (measured at 1 min intervals and calibrated with an NA-28 sound level meter, serial number 00762289, Rion Co., Ltd., Tokyo, Japan) for 72 h (Figure 1b). The transducer was connected to a digital audio player (AGPTEK 32 GB, manufactured by AGPTEK Shenzhen, China) with a properly shielded 3.5 mm mini-jack cable and a HUB supplying power.

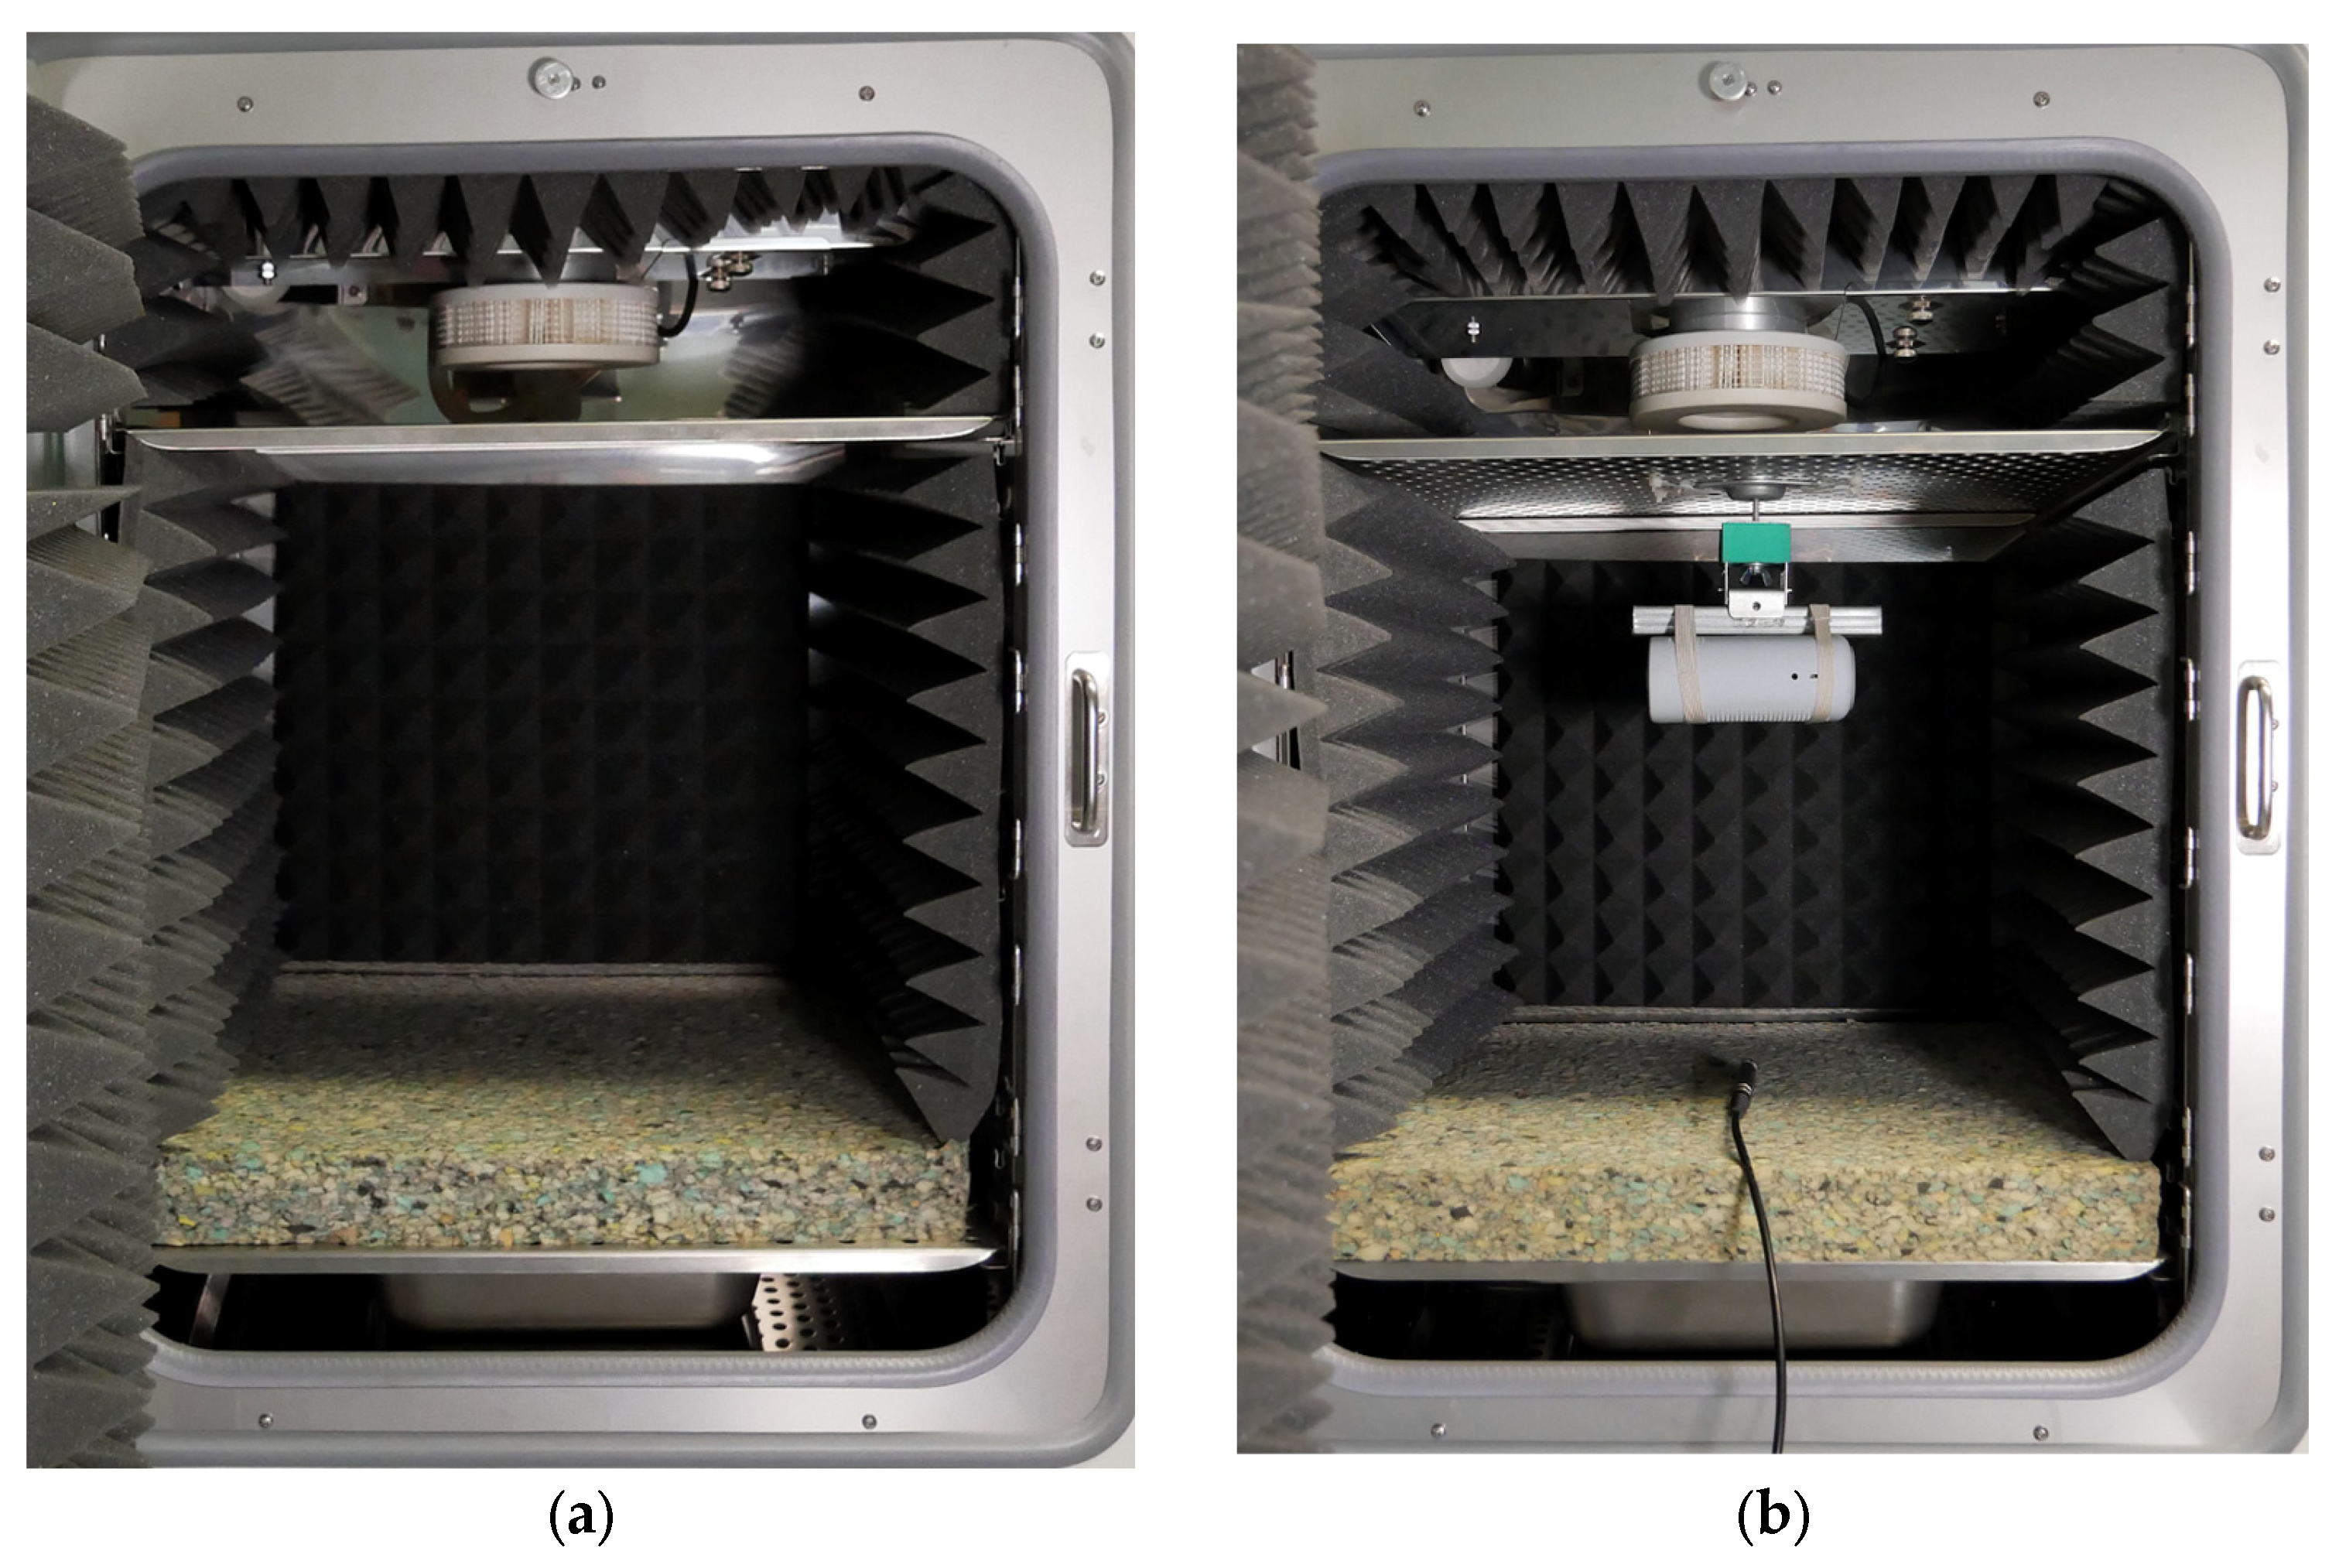
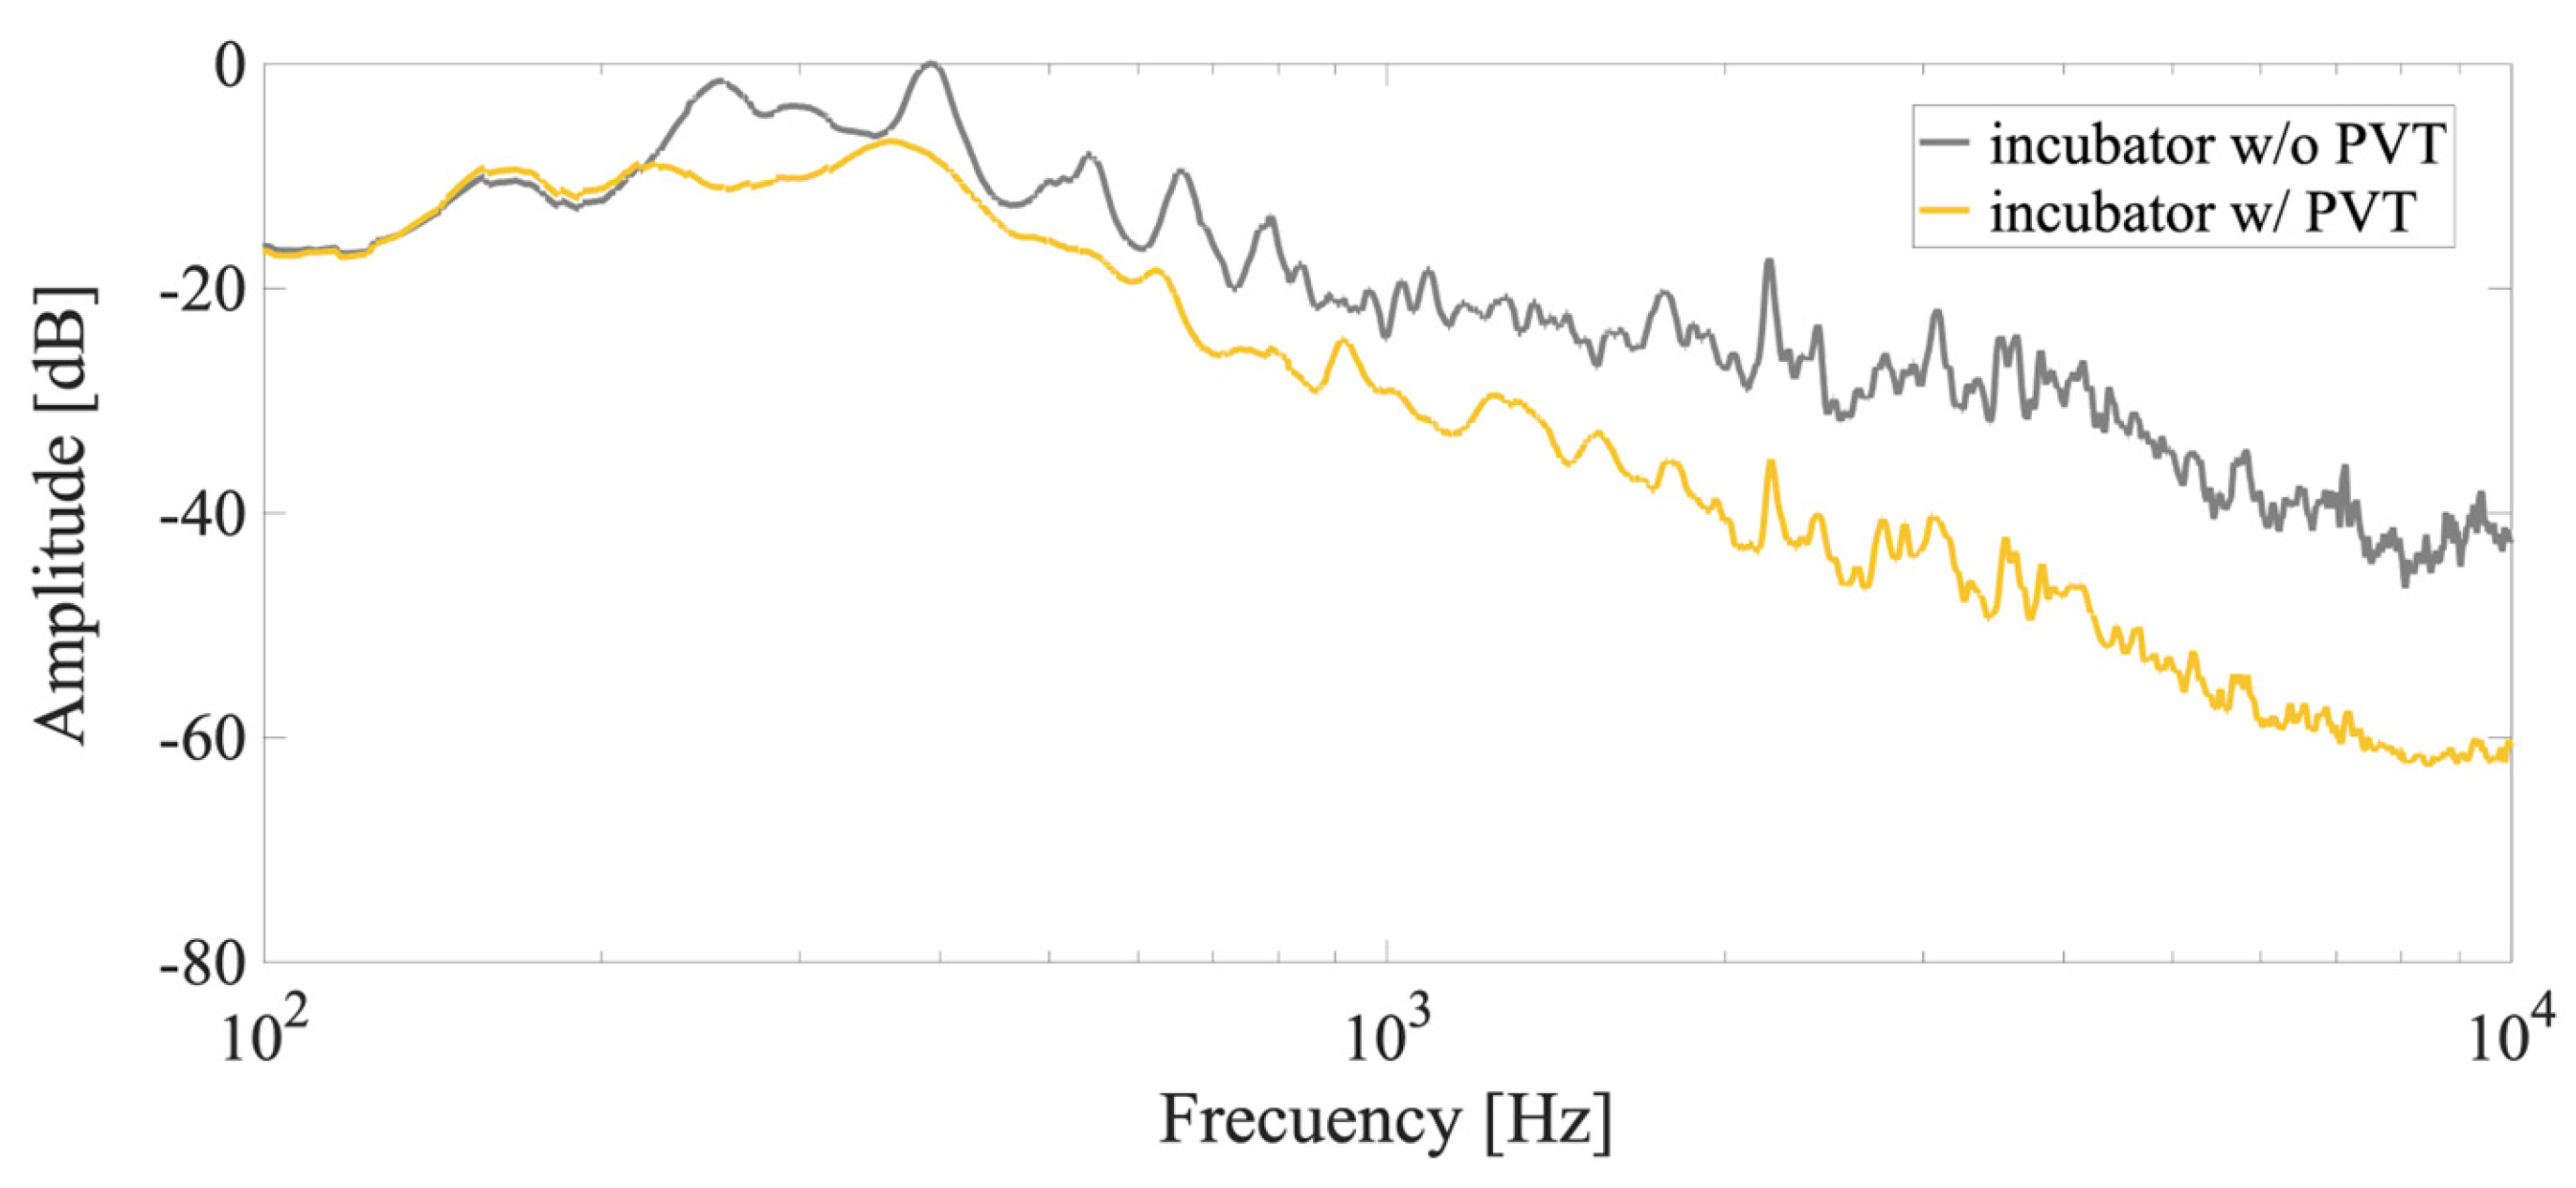
2.3.5. Noise and Vibration Measurements

Experimental measurements were employed to characterize the set-up, which was composed of ARTA software (version 1.9.1), a TASCAM 144 mk2 acquisition card, and a Bose SoundLink Color II loudspeaker suspended on an acoustic hanger. The measurements were taken with a Brüel & Kjaer microphone transducer (4188-A-21, B&K, Copenhagen, Denmark) connected to a 2-channel Brüel & Kjaer CCLD signal conditioner (1704-A-002, B&K, Copenhagen, Denmark) with Z-weighting for a 1 min duration (intervals of 0.1 s). To measure the sound pressure level (Lp), a Brüel & Kjaer microphone (Type 4188-A-21, B&K, Copenhagen, Denmark) was used.

2.4. Data Analyses

2.4.1. Voice Synthesis Method

The synthesized emotional signal (iv) was generated from the emotional voice (ii) using VoiceOver, a reading technology based on voice synthesis integrated into the Mac OS X operating system. Starting with the gratitude letter written by the participant, the synthetized audio signal was adjusted by following the wave-log in an audio sequencer (Steinberg Cubase LE 11.1 software) to ensure maximum synchrony and balancing of amplitudes.

2.4.2. Audio Filtering and Processing

All audio signal was processed with a passband filter (150 Hz and 10 KHz cutoff frequencies), normalized to −3 dB, and digitally limited to −1 dB. A noise gate was employed to minimize the unwanted sound artifacts.

2.4.3. Audio Analysis Magnitude-Squared Coherence

Magnitude-squared coherence (MSC) was used to measure the similarities between the spectral content of (ii) the emotional signal and (iv) the synthesized emotional signal [41]. The MSC of the two signals, x(t) and y(t), was defined as [42]:
C x y f = P x y ( f ) 2 P x x ( f ) · P y y ( f )
where P x y ( f ) represents the cross power spectral density and P x x ( f ) and P y y ( f ) denote the power spectral density. The MSC was calculated for frequencies between 20 and 5000 Hz (mscohere function in MATLAB).

2.4.4. Audio Spectrogram

In order to analyze the temporal variation of (ii) the emotional signal and (iv) the synthesized emotional signal, a spectrogram was calculated (spectrogram function in MATLAB).

2.4.5. Affective Text Algorithm

Affective dictionaries can estimate the writer’s feelings, providing a computational approach to investigating the emotional connotations of written texts. Two databases have been used to check whether writers are displaying gratitude feelings: the lexicon of the National Research Council of Canada built on parameters of Valence, Arousal, and Dominance (NRC-VAD) and the NRC Word-Emotion Association Lexicon (EMOLEX) [33,43]. The NRC-VAD Lexicon is a dictionary based on a Russell tridimensional model that includes 19,917 English words classified by valence, arousal, and dominance [44]. The EMOLEX, on the other hand, is a dictionary that includes 14,154 English words classified by feeling (positivity and negativity) and emotions (anger, anticipation, disgust, fear, joy, sadness, surprise and trust). To test whether there was a gratitude feeling in the participant’s voice, an affective text analysis was conducted to quantify the valence and arousal levels associated with both (i) emotional and (ii) non-emotional stimuli.

2.4.6. EEG Pre-Processing and Filtering

An EEG recording was conducted in order to compare the participant’s ACC activity during the recording of (ii) emotional (gratitude) and (iii) non-emotional stimuli (resting-state). We selected a fixed data segment from all signals, using the first 2.244 min (maximum amount of data in one of the conditions) for analysis. Data were linearly demeaned. To prevent edge artifacts during filtering [45], we reflected the first and last 10 s of each signal, which were trimmed after filtering. The EEG data were then zero-phase filtered (filtfilt function in MATLAB), with a 4th-order Butterworth high-pass filter set at 0.5 Hz.

2.4.7. Estimating the Power Spectral Density (PSD) for Each Frequency Band

We estimated the power spectrum density (PSD) for each data segment within the broadband range of 1–45 Hz at the Fz electrode using a modified version of the Welch method [46] (window = 1 s; 0% overlap; resolution = 1 Hz). To minimize autocorrelation between contiguous windows, our modification only considered a single 1 s window every three 1 s windows (i.e., 1 s every 3 s, as computed in [47]). Each condition had a total of 45 windows of 1 s. Power values were log-transformed and converted to the unit 10*log10[μV²]. For each frequency, the spectral power was detrended for all 1 s spectral estimates throughout the full recording before comparing conditions. This approach minimized the impact of spectral power drifts in the signal, preventing artificial differences between conditions. The resulting spectral power values were computed using Simpson’s rule (bandpower function in MATLAB) in the theta (4–7.9 Hz), alpha (8–11.9 Hz), beta (12–29.9 Hz), and gamma (30–45 Hz) frequency bands. We excluded the delta band (1–3.9 Hz) from the analysis due to its susceptibility to blinking and movement artifacts [48].

2.4.8. EEG Statistical Analysis

Before computing any statistical analyses, we checked for potential outliers in our data (power of in each of the 1 s windows) by running the Grubbs test with an α-level of 0.05 (isoutlier in MATLAB). If any significant outliers were found, they were removed. We checked for data normality using the Kolmogorov–Smirnov test (kstest in Matlab). For statistical assessment of the power values in each frequency band, we applied a two-tailed paired t-test (t-test in MATLAB) and corrected the p-values for multiple comparisons by applying the false discovery rate (FDR) of Benjamini and Hochberg [49] (fdr_BH function in the Multiple Testing Toolbox [50]). For the statistical assessment of the power values across the frequency range, we performed sample-by-sample paired t-tests between the spectral power at the Fz electrode between resting-state and gratitude conditions. We used a cluster-based permutation test procedure (100,000 randomizations) to correct p-values [51,52].

2.5. Biological Assays

661W murine cells, which express photoreceptor and retinal ganglion markers [53,54], were used for biological experimentation. We selected this cell line because there is substantial evidence that the 661W cell line can respond to various external stimuli, such as electromagnetic radiation in the visible range, highlighting its versatility in signal reception and transduction (i), and because it is an adherent culture, which could facilitate the transmission of mechanical waves from the microenvironment into the cell (ii). Cells were cultured in DMEM (4.5 g/L glucose) supplemented with penicillin/streptomycin, 2 mM L-glutamine, and 10% (v/v) fetal bovine serum (all reagents were acquired from Capricorn Scientific GmbH, Ebsdorfergrund, Germany). They were seeded at a density of 100,000 cells/flask and incubated in a CO2 incubator (37 °C and 5% CO2).

2.5.1. Crystal Violet Staining

The protocol of Mickuviene et al. (2004) was used to evaluate cell proliferation [55]. Cells were seeded in sterile polystyrene 96-well plates (3000 cells/well, 12 replicates) and incubated for 24 h. Afterward, plates were exposed to the acoustic stimulus for 72 h and they were fixed with 96% (v/v) ethanol for 10 min, followed by staining with 0.05% (w/v) crystal violet dissolved in 20% (v/v) ethanol for 30 min. After three consecutive washes with distilled water, the plates were dried in the dark at room temperature. In order to dissolve the dye, 100 μL of a 50% (v/v) ethanol and 0.1% (v/v) acetic acid solution was added and the plate was incubated for 5 min at room temperature. The supernatant was transferred to a clean 96-well plate. Ultimately, the absorbance was measured in a spectrophotometer (AD 340 Microplate Reader, Beckman Coulter, Brea, CA, USA) at a wavelength of 620 nm.

2.5.2. Immunocytochemistry

Immunofluorescence was used to study two conditions, namely (i) the control and (ii) the emotional signal, both of which were incubated separately for 72 h at an equivalent Lp of 80 dB. Sterile round glass coverslips (12 mm diameter) were placed at the bottom of 24-well polystyrene plates. 661W cells were seeded onto the coverslips at a density of 20,000 cells per well, with five replicates per condition. After stimulation, cells were fixed using 4% (w/v) paraformaldehyde (Merck, Darmstadt, Germany) in phosphate-buffered saline (PBS, pH 7.4) for 10 min at room temperature. Then, the fixative solution was removed and the cells were washed three times with PBS (1 mL per well) for 5 min each. Permeabilization was performed for 10 min using 0.1% (v/v) Triton X-100 (Merck) in PBS. To reduce antibody binding to non-specific epitopes, cells were incubated for 1 h at room temperature with 1% (w/v) bovine serum albumin (Merck) in PBS. Next, incubation with the primary antibody against Ki-67 (#28074-1-AP, Proteintech, Rosemont, IL, USA), which was diluted to 1:100 in blocking solution (final concentration 4 μg/mL), was carried out overnight at 4°C in a humidified chamber. Following incubation, cells were washed three times with PBS for 5 min each. A secondary antibody, Alexa Fluor™ 488-conjugated donkey anti-rabbit IgG (#A21206, Invitrogen, Waltham, MA, USA) diluted to 1:1000 in blocking solution (final concentration 2 μg/mL), was then applied and incubated for 2 h at room temperature. Subsequently, cells were washed three times with PBS for 5 min each and coverslips were mounted onto microscopy slides using a DAPI-containing (2 μg/mL) antifade mounting medium (CitiFluor™, Electron Microscopy Sciences, Hatfield, PA, USA). Coverslips were sealed with nail polish and samples were stored at 4 °C, protected from light, until image acquisition. All immunostaining procedures included negative controls, in which the primary antibody was omitted. Imaging and analysis were performed using a laser scanning confocal microscope (LSM 800, Zeiss, Jena, Germany) at 40× magnification.

2.5.3. Image Processing

Confocal images were captured on the same day, maintaining consistent laser intensity, gain, and brightness settings. Parallel staining was performed using identical antibody dilutions. For further image analysis, five random fields per condition were processed. Initially, the DAPI channel images were binarized by adjusting the luminance threshold and designating each nucleus as a region of interest (ROI). The mean luminance value for each cell was then calculated based on the ROI. Luminance assessment was conducted with ImageJ software (version 1.54f).

2.5.4. Statistical Analysis

MATLAB software (version R_2020a) was employed for statistical analysis. Once Grubbs’ test was performed and basic statistics were calculated, the normality of the samples was verified by means of the Kolmogorov–Smirnov test. Variances were compared using a two-sample t-test.

3. Results

3.1. Evaluation of the Affective State

The value of the gratitude letter was calculated from NRC-VAD Lexicon dictionary. When two words matched, the valence and arousal values were extracted from the affective dictionary. To solve the unmatched cases because of the inflected form (i.e., plural, feminine, conjugated, etc.) a lemmatization process was carried out. Then, we calculated the differences between valence and arousal. The gratitude letter valence was 15% more positive with respect to the Don Quixote text, while differences in arousal were less than 1%.
Moving forward, to explore whether there was an alteration in the emotional brain areas during the reading of the gratitude letter, the EEG signal was subjected to analysis. We averaged the log-transformed power spectrum across the 45 windows for each condition and found significant differences between resting-state and gratitude conditions within the range from 1 to 11.125 Hz (Figure 2). We divided and computed the log-transformed power for each canonic frequency and found significant differences between conditions in the theta (p = 0.0020), alpha (p = 0.0257), and beta (p = 0.00257) but not in the gamma (p = 0.5824) band (Figure 3). All p-values were corrected for multiple comparisons (see Methods—Statistical Analyses).

3.2. Audio Analysis

To characterize the acoustic stimulus, the spectrograms, spectra, and MSC were computed. The spectrograms of (ii) the emotional voice and (iv) the synthetized emotional voice were calculated to analyze the similarity of temporal components (Figure 4a). The spectra of these signals were then calculated (Figure 4b). In the context of the MSC, a value of 1 represents the maximum degree of similarity, whereas a value of 0 represents the minimum degree of similarity. Following a visual inspection of the spectra, we calculated the MSC for all the frequencies between 0 and 5 kHz (Figure 4c).

3.3. Characterization of the Environment and Electro-Acoustic Radiation System

The experimental set-up comprised a passive vibro-acoustic treatment and an electro-acoustic radiation system. Initially, the environment was characterized by measuring the Lp both before and after the passive acoustics elements were installed in the CO2 incubator (Figure 5).
The PVT significantly reduced the background noise from electro-mechanical systems and actuators of the CO2 incubator, and an overall noise level reduction of 10 dB at 250 Hz, 5 dB at 1000 Hz, and 20 dB at 5 KHz was achieved.

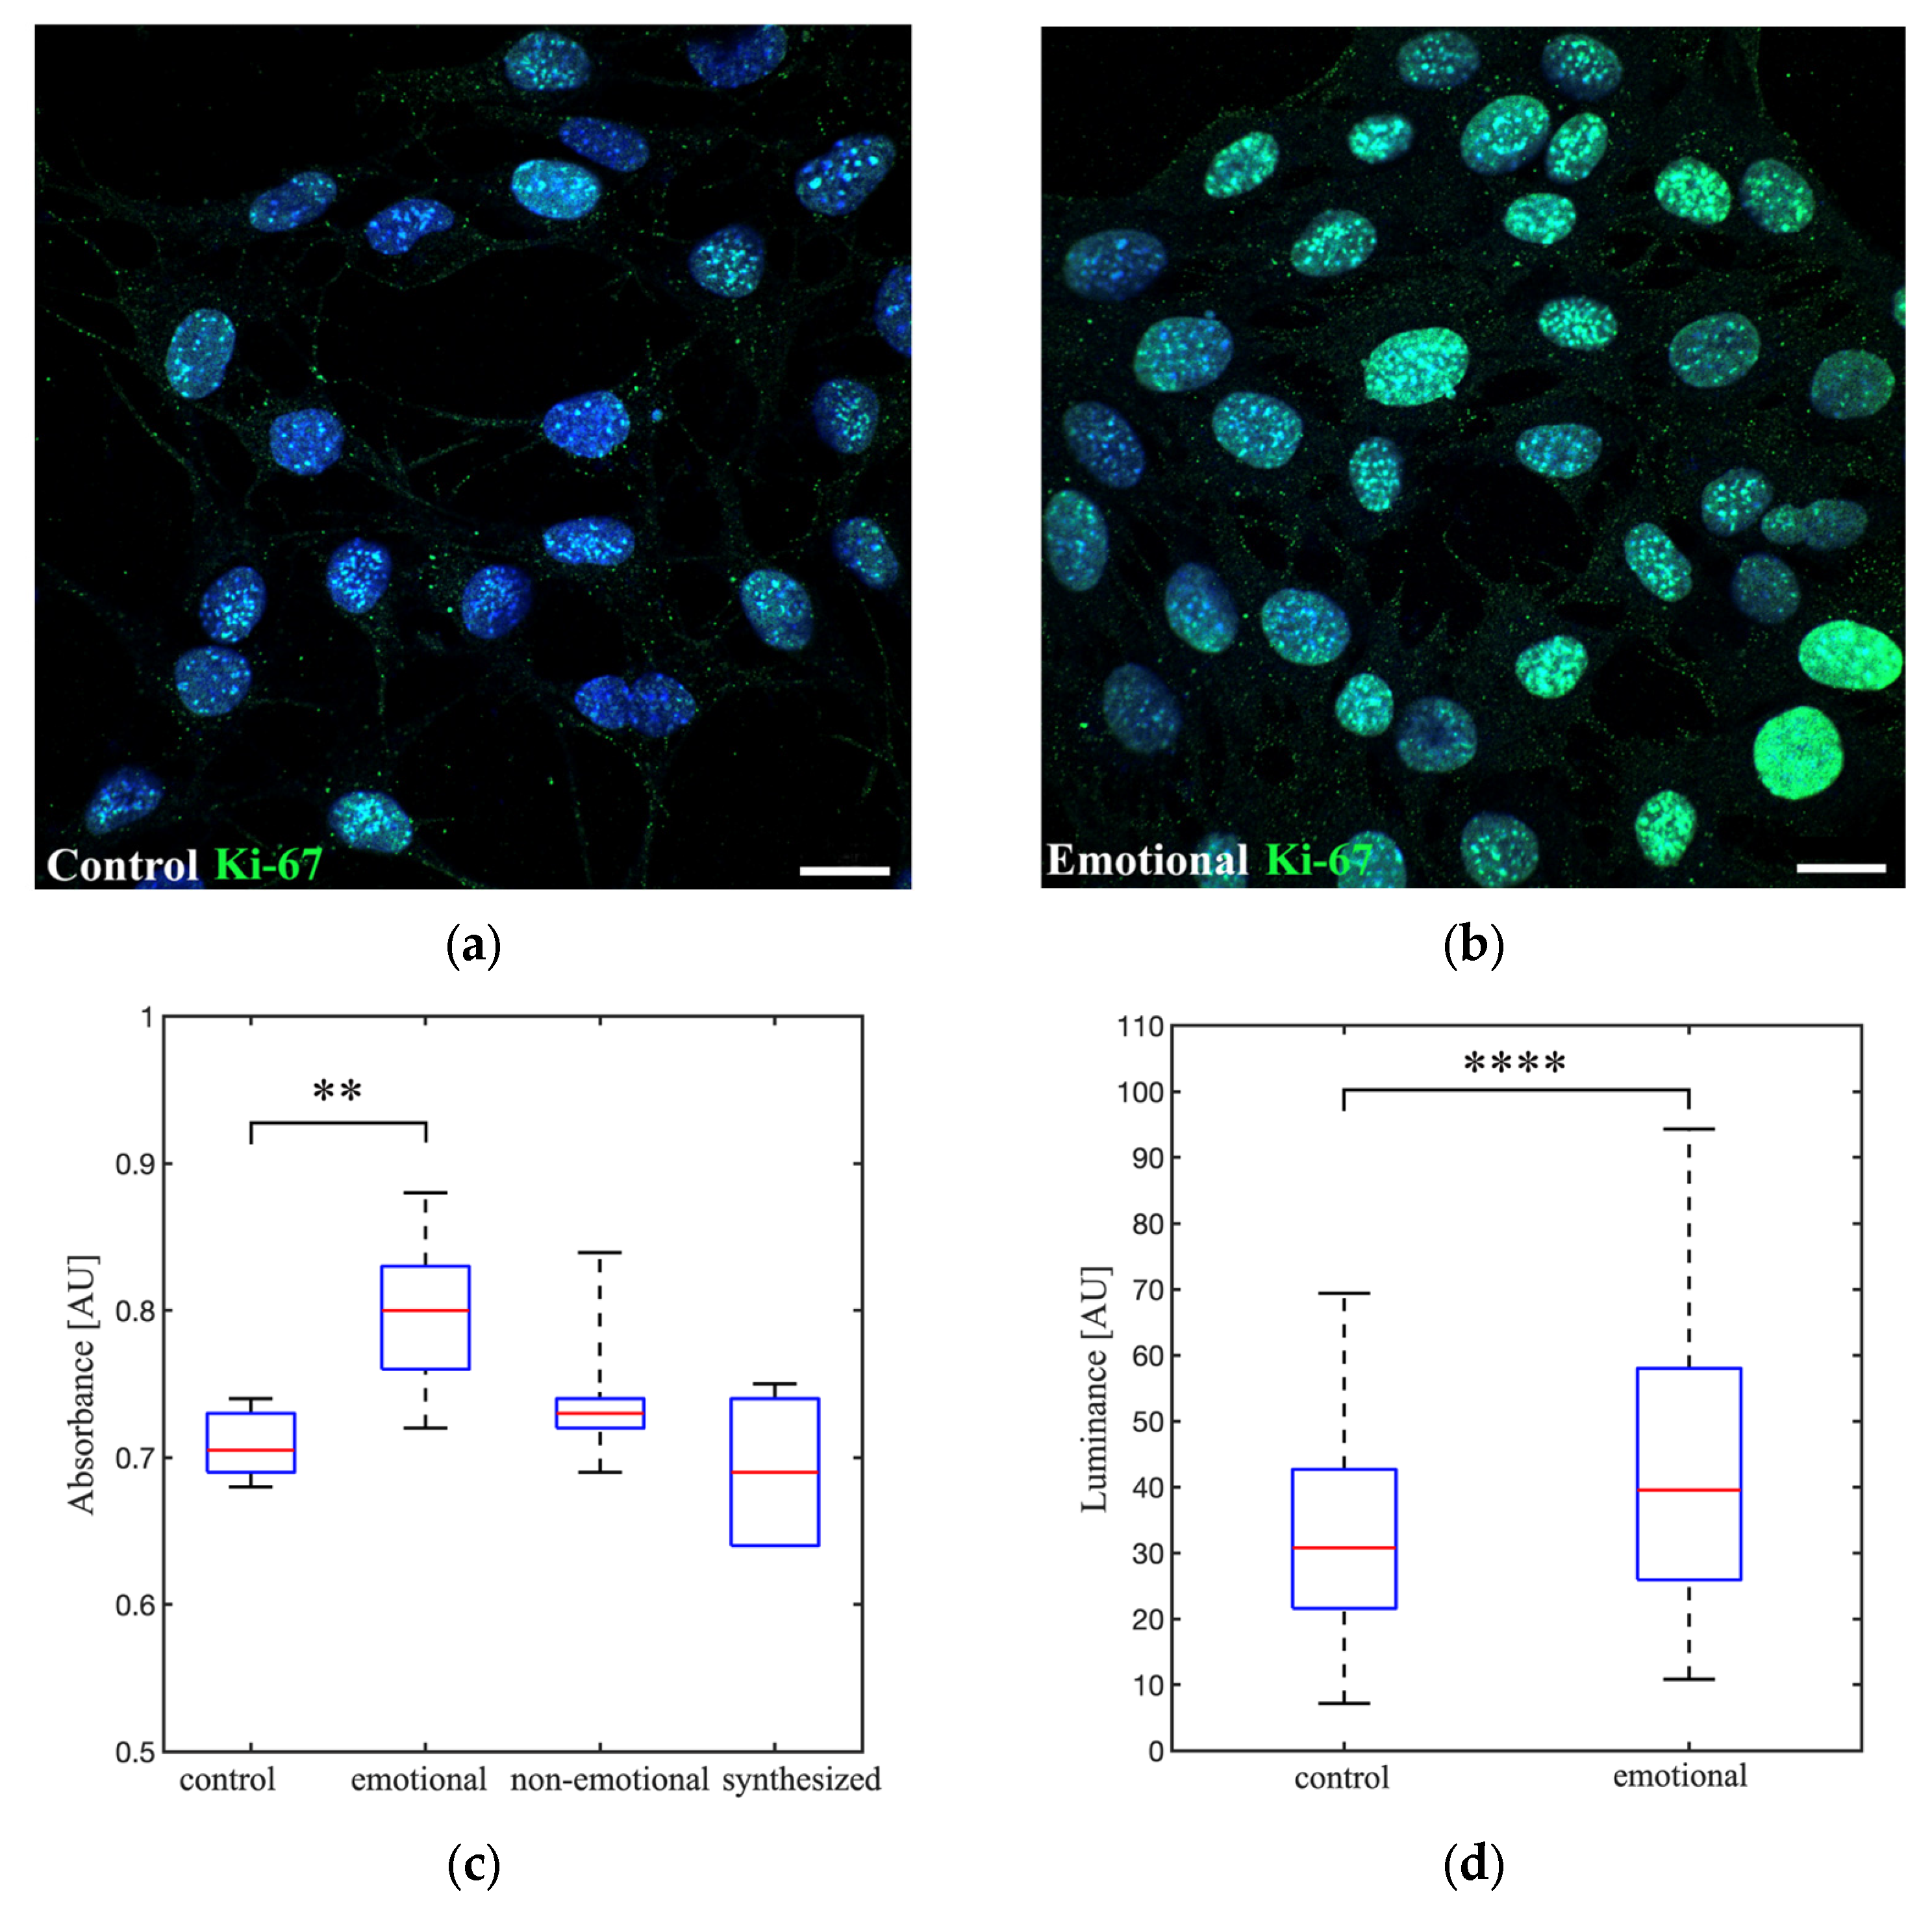
3.4. Effects of Emotional, Non-Emotional and Synthesized AAW on Cell Proliferation

To evaluate the impact of emotions on cellular dynamics, 661W cells were subjected to different AAW stimuli generated by a loudspeaker in a controlled acoustic environment for a period of 72 h at 80 dB. In the control condition, the loudspeaker was inactive. A PVT was installed in the CO2 incubator test. The analysis of cell proliferation (crystal violet assay) revealed statistically significant differences between (i) the control and (ii) the emotional voice (* p = 0.004), with average absorbances of 0.71 ± 0.02 and 0.80 ± 0.05, respectively. No other significant differences were identified between (iii) the non-emotional voice (p = 0.179) and (iv) the synthesized emotional voice (p = 0.481). The average absorptions were 0.74 ± 0.05 and 0.69 ± 0.05, respectively, in comparison to the control condition (Figure 6c).
As expected, an increase in cell proliferation was accompanied by an increase in Ki-67 expression. The statistical analysis of the confocal images of Ki-67 immunofluorescence (Figure 6a,b) revealed significant differences in cell-to-cell luminance between (i) the control and (ii) the emotional voice (**** p= 0.000007, Figure 6d).

4. Discussion

Given that emotions modify the characteristics of the phonatory apparatus influencing different speech parameters [15,16], and several studies in the field of sonobiology have demonstrated the capacity of AAWs to induce changes in cell behavior [34,35], this investigation sought to identify whether the physical–acoustic changes produced by emotions in speech production could have any effect on cellular dynamics. Among all available emotions, gratitude was chosen because there is an effective method to induce feelings of gratitude in a laboratory setting: gratitude letters [30,31].
At the level of the brain, reading a letter of gratitude written by the same participant following the protocol of Toepfer and Walker produced a change in the participant’s brain activity. While we cannot conclude that changes in EEG power are uniquely due to gratitude, there were significative differences between reading aloud a fragment of Don Quixote and a personal gratitude letter in the theta, alpha, and beta bands. However, the results obtained are in concordance with several studies that reported neural correlates of gratitude in ACC [27,28]. Furthermore, the gratitude letter analysis revealed notable differences in valence between reading aloud a modern version of Don Quixote and a personal gratitude letter. Combining EEG measurements and affective text analysis, we showed that the participant’s emotional system was positively altered when he was in a state of gratitude. The participant reported to the researcher that he felt “calmer and happier” after writing and reading the gratitude letter. As a result, we support Toeper and Walker’s hypothesis that writing a gratitude letter can promote a positive emotional state.
Before performing the biological assays, a PVT was installed in the CO2 incubator, which provided better acoustic control of the environment and reduced background noise from electro-mechanical systems and actuators. The signal-to-noise ratio was significantly improved, reaching values of 10 dB at 250 Hz, 5 dB at 1000 Hz, and 20 dB at 5 KHz. Biological assays showed a significant increase in the proliferation of 661W cells after exposure to the gratitude voice compared to the control group. This result is consistent with the findings from the crystal violet and the Ki-67 (well-known proliferation marker [56]) immunocytochemistry assays. It is reasonable to assume that the differences shown in 661W cell proliferation between the control and the emotional voice case, a read-aloud version of the gratitude letter, was caused by some particular properties of the participant’s voice (* p = 0.004). However, this possibility was controlled using a non-emotional stimulus, a read-aloud modern version of Don Quixote, which did not produce significant changes compared to the control group (p = 0.179). To isolate the physical aspects of the gratitude emotion in the participant’s voice, a synthesized emotional stimulus was created. This consisted of a synthesized version of the same gratitude letter read aloud by the participant and showed strong temporal synchrony and acceptable spectral similarity (MSC = 0.21, 0–5000 Hz band). The synthesized case was not statistically significantly different from the control (p = 0.481).
As introduced earlier, emotion in speech is mainly characterized by F0, amplitude, timbre, and temporal aspects. Having carefully considered all of these aspects, we hypothesize that the biophysical emotional parameters driving the biological changes may be the F0 and timbre components. The amplitude and temporal aspects showed a high degree of similarity, whereas F0 and timbre showed more variability. Although we cannot rule out that some of these differences may be due to the method of synthesis, variations in F0 are closely linked to emotional expression. For instance, emotions such as happiness often lead to increased F0, whereas tenderness states may lower it [57]. Moreover, the harmonic structure contributes to the timbre of the voice and plays a crucial role in conveying emotional nuance, as different emotional states modulate both the amplitude and distribution of these harmonic frequencies [58,59]. As a future improvement to our protocol, an actor would read aloud the gratitude letter written by the participant, and the resulting AAW signal would be radiated over cells. This new control would provide us with more information about the frequency components.
From a biophysical perspective, there is evidence in the literature that AAW stimuli are capable of inducing significant changes in cellular dynamics and genetic expression. Kumeta et al., 2018 demonstrated that sound stimulation (94 dB, sine-wave sound with a frequency range of 55 Hz to 4 kHz) resulted in a significant reduction in Ptgs2 mRNA levels in the bone marrow-derived ST2 cell line. This was attributed to an increase in RNA decay [34]. In another study by Lin et al. (2021) on in vitro cardiac muscle HL1 cells, significant differences between emotional and non-emotional AAW stimulation were found using alpha-tubulin staining after the different 20 min sound exposures. Compared to the control condition, non-acoustic stimuli, the light emission intensity displayed by phalloidin (F-actin), beta-actin, and alpha-actinin-1 increased when the cells were exposed to meditative music, mantras, and love signals, but decreased with hate signals [60].
Focusing on the mechanotransductional response, the potential biological mechanisms that could trigger the cellular responses to AAW can be classified into two main groups: biochemical signaling pathways and cytoskeletal dynamics. As expected, both groups are interconnected, making it quite difficult in many cases to differentiate between these mechanisms. First, the signal must be captured from the extracellular environment and transmitted into the cell through mechanosensitive sensors. At this point, the plasma membrane contains numerous mechanosensitive biomolecules/structures, notably integrins [61], mechanosensitive ion channels [62], primary cilia [63], cadherins [64], and ICAMs [62,65], among others. When the biosignal reaches these mechanosensors, it induces conformational changes that initiate intracellular signaling. For example, variations in the electrochemical gradient occur via mechanosensitive ion channels [62] and phosphorylation cascades such as the Hippo pathway, which regulates nuclear regulators YAP/TAZ (Yes-associated protein/transcriptional coactivator with PDZ-binding motif) [66]. Additionally, traction forces are generated and transmitted through the integrin–cytoskeleton axis to the nuclear membrane, where various cytoskeletal components physically interact with the LINC complex (linker of nucleoskeleton and cytoskeleton) [67]. Once in the nucleus, different biochemical and/or mechanical signals induce changes in chromatin organization, due, among other factors, to the interaction between the nuclear lamina and the lamina-associated chromatin domains (LADs) [68], creating specific gene expression programs and modulating aspects such as cell differentiation and proliferation [69]. Furthermore, the mechanoregulation of transcription factors through their differential nuclear translocation plays an important role in modulating gene expression. An example of this is YAP/TAZ, which, when phosphorylated through the Hippo pathway, continues to be retained in the cytoplasm, preventing its translocation to the nucleus and its interaction with members of the TEAD family (Transcriptional Enhanced Associate Domain) [70]. However, in its dephosphorylated state, it undergoes nuclear internalization, helping to promote the expression of anti-apoptotic genes such as COX-2, BIRC5, and Glut1 [71].
In summary, although this is a preliminary study that requires an expanded sample size, the hypothesis that emotions could act as biophysical agents influencing cellular processes through the physical and acoustic characteristics of the human voice is a tangible possibility. Further exhaustive research is needed.

5. Conclusions

Emotions impact the characteristics of the phonatory system, influencing physical speech parameters. Additionally, multiple studies in sonobiology have shown that AAWs can induce changes in cellular dynamics. The present work studies whether the physical–acoustic changes induced by gratitude in human speech can influence cell proliferation and Ki67 expression in the 661W cell line (non-auditory). Gratitude, understood as the state of awareness and appreciation that arises when another person’s altruistic actions are directed toward us, was the emotion chosen for the present study due to its social importance. The biological assays demonstrated a notable increase in the proliferation of 661W cells upon exposure to an emotional voice of gratitude compared to the control group. Possible physical and biological pathways were discussed based on the recent literature. Despite the limitations, the possibility that gratitude might influence cellular behavior through the physical–acoustic characteristics of the human voice is a plausible one. Consequently, studying the impact of emotional AAW on cell biology opens up a promising area of research, with the potential to advance our understanding of how human cognition interacts with biology through the laws of physics.

Author Contributions

D.d.R.-G.: Conceptualization, Methodology, Software, Validation, Formal analysis, Investigation, Resources, Data Curation, Writing—original draft, Writing—review and editing, Writing—review and editing, Visualization, Supervision, Project administration. J.C.: Software, Resources—review and editing, Visualization. A.V.-M.: Software, Investigation. I.V.-G.: Software, Visualization, Writing—review and editing. D.R.: Supervision. V.G.-V.: Conceptualization, Methodology, Validation, Formal analysis, Resources, Writing—review and editing, Visualization, Supervision, Project administration. G.E.: Conceptualization, Methodology, Validation, Investigation, Formal analysis, Resources, Writing—review and editing, Supervision, Project administration. All authors have read and agreed to the published version of the manuscript.

Funding

This research received no external funding.

Institutional Review Board Statement

The study was conducted in accordance with the Declaration of Helsinki and was approved by the Ethics Committee of the University of Alicante (protocol code UA-2021-03-30 and date of approval 3 March 2021).

Informed Consent Statement

Informed consent was obtained from all subjects involved in this study.

Data Availability Statement

The raw data supporting the conclusions of this article will be made available by the authors on request.

Acknowledgments

The authors wish to thank Muayyad Al-Ubaidi who kindly provided 661W murine cells from the University of Houston (USA) and Laura de Gea for her assistance in analyzing the affective dictionary.

Conflicts of Interest

The authors declare no conflicts of interest.

Appendix A

Appendix A.1. Gratitude Letter

  • Gracias por mostrarme que aquello que soy en realidad va mucho más allá de lo que incluso puedo llegar a imaginar ahora. Gracias por estar siempre a mi lado ofreciéndome una mano para andar en esta realidad junto a ti. Gracias también, por andar frente a mí apartando cualquier obstáculo. Desde el primer momento que te reconocí sentí que un universo entero se abría dentro de mi mente y de mi corazón. En ese momento se abrió un reconocimiento de miles de años al servicio del amor, al servicio de la paz.
  • Todo aquello que me enseñas me transforma de una forma tan profunda que ni tan siquiera puedo llegar a entender. Esta transformación que ha ido calando a través del tiempo me permite hoy en día mirar la vida y a mí mismo desde una perspectiva completamente distinta a la que lo hacía antes de conocerte.
  • Esta transformación me permite compartir aquello que tú me enseñas con muchas otras personas por varios lugares del planeta. El agradecimiento que siento cuando pongo palabras a tu enseñanza es un espacio inconmensurable dentro de mi corazón. Gracias por tu paciencia, tu amor y tu entrega hacia mí.

Appendix A.2. Don Quixote from la Mancha

  • En un lugar de La Mancha, del cual no quiero acordarme, no hace mucho tiempo vivía un hidalgo de los de lanza en astillero, escudo antiguo, rocín flaco y galgo corredor. Una olla de algo más vaca que carnero, salpicón la mayoría de las noches, duelos y quebrantos los sábados, lentejas los viernes, algún palomino de añadido los domingos, consumían las tres cuartas partes de su hacienda. El resto se completaba con un traje de velarte, calzas de terciopelo para las fiestas, con sus pantuflas del mismo material, y los días entre semana se honraba con su traje de paño fino. Tenía en su casa una ama que pasaba de los cuarenta años y una sobrina que no llegaba a los veinte, y un mozo de campo y plaza que tanto ensillaba el rocín como tomaba la podadera. La edad de nuestro hidalgo rondaba los cincuenta años. Era de complexión recia, delgado de carnes, enjuto de rostro, gran madrugador y amigo de la caza. Dicen que tenía el sobrenombre de «Quijada», o «Quesada», sobre esto hay alguna diferencia entre los autores que escriben de este caso, aunque por conjeturas verosímiles se entiende que se llamaba «Quijana». Pero esto importa poco a nuestro cuento: basta que en la narración no se salga un punto de la verdad.
  • Es, pues, de saber que este mencionado hidalgo, en los ratos que estaba ocioso —que eran la mayor parte del año—, se daba a leer libros de caballerías, con tanta afición y gusto, que olvidó casi por completo el ejercicio de la caza y aun la administración de su hacienda; y llegó a tal punto su curiosidad y desatino en esto, que vendió muchas fanegas de tierra de sembradura para comprar libros de caballerías en que leer, y, así, llevó a su casa todos cuantos pudo encontrar; y, de todos, ningunos le parecían tan bien como los que compuso el famoso Feliciano de Silva, porque la claridad de su prosa y aquellas intrincadas razones suyas le parecían de perlas, y más cuando llegaba a leer aquellos requiebros y cartas de desafíos, donde en muchas partes hallaba escrito: «La razón de la sinrazón que a mi razón se hace, de tal manera mi razón enflaquece, que con razón me quejo de la vuestra hermosura». Y también cuando leía: «Los altos cielos que de vuestra divinidad divinamente con las estrellas os fortifican y os hacen merecedora del merecimiento que merece vuestra grandeza».

References

  1. Darwin, C. The Expression of the Emotions in Man and Animals; Cambridge University Press: Cambridge, UK, 2013; ISBN 9781108061834. [Google Scholar]
  2. Ekman, P. Are There Basic Emotions? Psychol. Rev. 1992, 99, 550–553. [Google Scholar] [CrossRef] [PubMed]
  3. Scherer, K.; Johnstone, T.; Klasmeyer, G. Vocal Expression of Emotion. In Handbook of Affective Sciences; Davidson, R.J., Scherer, K.R., Goldsmith, H.H., Eds.; Oxford University Press: Oxford, UK, 2003. [Google Scholar]
  4. Russell, J.A.; Bachorowski, J.A.; Fernández-Dols, J.M. Facial and Vocal Expressions of Emotion. Annu. Rev. Psychol. 2003, 54, 329–349. [Google Scholar] [CrossRef] [PubMed]
  5. Banse, R.; Scherer, K.R. Acoustic Profiles in Vocal Emotion Expression. J. Pers. Soc. Psychol. 1996, 70, 614–636. [Google Scholar] [CrossRef] [PubMed]
  6. Whiteside, S.P. Acoustic Characteristics of Vocal Emotions Simulated by Actors. Percept. Mot. Ski. 1999, 89, 1195–1208. [Google Scholar] [CrossRef] [PubMed]
  7. Schirmer, A.; Adolphs, R. Emotion Perception from Face, Voice, and Touch: Comparisons and Convergence. Trends Cogn. Sci. 2017, 21, 216–228. [Google Scholar] [CrossRef]
  8. Ekman, P. Facial Expressions of Emotion: An Old Controversy and New Findings. Philos. Trans. R. Soc. Lond. B Biol. Sci. 1992, 335, 63–69. [Google Scholar] [CrossRef]
  9. Johnstone, T.; Scherer, K.R. Vocal Communication of Emotion. In Handbook of Emotions; Lewis, M., Haviland-Jones, J., Eds.; Guilford Press: New York, NY, USA, 2000. [Google Scholar]
  10. Scherer, K.R. Vocal Correlates of Emotional Arousal and Affective Disturbance. In Handbook of Social Psychophysiology; Wagner, H., Manstead, A., Eds.; John Wiley & Sons: Hoboken, NJ, USA, 1989. [Google Scholar]
  11. Pietrowicz, M.; Hasegawa-Johnson, M.; Karahalios, K.G. Acoustic Correlates for Perceived Effort Levels in Male and Female Acted Voices. J. Acoust. Soc. Am. 2017, 142, 792–811. [Google Scholar] [CrossRef]
  12. Kadiri, S.R.; Alku, P. Glottal Features for Classification of Phonation Type from Speech and Neck Surface Accelerometer Signals. Comput. Speech Lang. 2021, 70, 101232. [Google Scholar] [CrossRef]
  13. Grichkovtsova, I.; Morel, M.; Lacheret, A. The Role of Voice Quality and Prosodic Contour in Affective Speech Perception. Speech Commun. 2012, 54, 414–429. [Google Scholar] [CrossRef]
  14. Gobl, C.; Ní Chasaide, A. The Role of Voice Quality in Communicating Emotion, Mood and Attitude. Speech Commun. 2003, 40, 189–212. [Google Scholar] [CrossRef]
  15. Birkholz, P.; Martin, L.; Willmes, K.; Kröger, B.J.; Neuschaefer-Rube, C. The Contribution of Phonation Type to the Perception of Vocal Emotions in German: An Articulatory Synthesis Study. J. Acoust. Soc. Am. 2015, 137, 1503–1512. [Google Scholar] [CrossRef] [PubMed]
  16. Kuang, J.; Liberman, M. Integrating Voice Quality Cues in the Pitch Perception of Speech and Non-Speech Utterances. Front. Psychol. 2018, 9, 2147. [Google Scholar] [CrossRef] [PubMed]
  17. Honorof, D.N.; Whalen, D.H. Perception of Pitch Location within a Speaker’s F0 Range. J. Acoust. Soc. Am. 2005, 117, 2193–2200. [Google Scholar] [CrossRef] [PubMed]
  18. Lee, C.-Y.; Dutton, L.; Ram, G. The Role of Speaker Gender Identification in Relative Fundamental Frequency Height Estimation from Multispeaker, Brief Speech Segments. J. Acoust. Soc. Am. 2010, 128, 384–388. [Google Scholar] [CrossRef]
  19. Lieberman, P.; Michaels, S.B. Some Aspects of Fundamental Frequency and Envelope Amplitude as Related to the Emotional Content of Speech. J. Acoust. Soc. Am. 1962, 34, 922–927. [Google Scholar] [CrossRef]
  20. Sobin, C.; Alpert, M. Emotion in Speech: The Acoustic Attributes of Fear, Anger, Sadness, and Joy. J. Psycholinguist. Res. 1999, 28, 347–365. [Google Scholar] [CrossRef]
  21. Juslin, P.N.; Laukka, P. Communication of Emotions in Vocal Expression and Music Performance: Different Channels, Same Code? Psychol. Bull. 2003, 129, 770–814. [Google Scholar] [CrossRef]
  22. Juslin, P.N.; Scherer, K.R. Vocal Expression of Affect. In The New Handbook of Methods in Nonverbal Behavior Research; Harrigan, J.A., Rosenthal, R., Scherer, K.R., Eds.; Oxford University Press: Oxford, UK, 2005. [Google Scholar]
  23. Breitenstein, C.; Van Lancker, D.; Daum, I. The Contribution of Speech Rate and Pitch Variation to the Perception of Vocal Emotions in a German and an American Sample. Cogn. Emot. 2010, 15, 57–79. [Google Scholar] [CrossRef]
  24. Davletcharova, A.; Sugathan, S.; Abraham, B.; James, A.P. Detection and Analysis of Emotion from Speech Signals. Procedia Comput. Sci. 2015, 58, 91–96. [Google Scholar] [CrossRef]
  25. Wood, A.M.; Froh, J.J.; Geraghty, A.W.A. Gratitude and Well-Being: A Review and Theoretical Integration. Clin. Psychol. Rev. 2010, 30, 890–905. [Google Scholar] [CrossRef]
  26. Wood, A.M.; Maltby, J.; Gillett, R.; Linley, P.A.; Joseph, S. The Role of Gratitude in the Development of Social Support, Stress, and Depression: Two Longitudinal Studies. J. Res. Pers. 2008, 42, 854–871. [Google Scholar] [CrossRef]
  27. Fox, G.R.; Kaplan, J.; Damasio, H.; Damasio, A. Neural Correlates of Gratitude. Front. Psychol. 2015, 6, 1491. [Google Scholar] [CrossRef] [PubMed]
  28. Yu, H.; Gao, X.; Zhou, Y.; Zhou, X. Decomposing Gratitude: Representation and Integration of Cognitive Antecedents of Gratitude in the Brain. J. Neurosci. 2018, 38, 4886–4898. [Google Scholar] [CrossRef] [PubMed]
  29. Hu, X.; Yu, J.; Song, M.; Yu, C.; Wang, F.; Sun, P.; Wang, D.; Zhang, D. EEG Correlates of Ten Positive Emotions. Front. Hum. Neurosci. 2017, 11, 26. [Google Scholar] [CrossRef] [PubMed]
  30. Toepfer, S.M.; Cichy, K.; Peters, P. Letters of Gratitude: Further Evidence for Author Benefits. J. Happiness Stud. 2012, 13, 187–201. [Google Scholar] [CrossRef]
  31. Boehm, J.K.; Lyubomirsky, S.; Sheldon, K.M. A Longitudinal Experimental Study Comparing the Effectiveness of Happiness-Enhancing Strategies in Anglo Americans and Asian Americans. Cogn. Emot. 2011, 25, 1263. [Google Scholar] [CrossRef]
  32. Bradley, M.M.; Lang, P.J. Affective Norms for English Words (ANEW): Instruction Manual and Affective Ratings; University of Florida: Gainesville, FL, USA, 1999. [Google Scholar]
  33. Mohammad, S.M.; Turney, P.D. Crowdsourcing a Word-Emotion Association Lexicon. Comput. Intell. 2013, 29, 436–465. [Google Scholar] [CrossRef]
  34. Kumeta, M.; Takahashi, D.; Takeyasu, K.; Yoshimura, S.H. Cell Type-Specific Suppression of Mechanosensitive Genes by Audible Sound Stimulation. PLoS ONE 2018, 13, e0188764. [Google Scholar] [CrossRef]
  35. Kwak, D.; Combriat, T.; Wang, C.; Scholz, H.; Danielsen, A.; Jensenius, A.R. Music for Cells? A Systematic Review of Studies Investigating the Effects of Audible Sound Played Through Speaker-Based Systems on Cell Cultures. Music Sci. 2022, 5, 20592043221080965. [Google Scholar] [CrossRef]
  36. Alenghat, F.J.; Ingber, D.E. Mechanotransduction: All Signals Point to Cytoskeleton, Matrix, and Integrins. Sci. STKE 2002, 2002, pe6. [Google Scholar] [CrossRef]
  37. Ross, T.D.; Coon, B.G.; Yun, S.; Baeyens, N.; Tanaka, K.; Ouyang, M.; Schwartz, M.A. Integrins in Mechanotransduction. Curr. Opin. Cell Biol. 2013, 25, 613–618. [Google Scholar] [CrossRef] [PubMed]
  38. Dupont, S.; Morsut, L.; Aragona, M.; Enzo, E.; Giulitti, S.; Cordenonsi, M.; Zanconato, F.; Le Digabel, J.; Forcato, M.; Bicciato, S.; et al. Role of YAP/TAZ in Mechanotransduction. Nature 2011, 474, 179–184. [Google Scholar] [CrossRef] [PubMed]
  39. Toepfer, S.M.; Walker, K. Letters of Gratitude: Improving Well-Being through Expressive Writing. J. Writ. Res. 2009, 1, 181–198. [Google Scholar] [CrossRef]
  40. Rowan, A.J.; Tolunsky, E. Primer of EEG: With a Mini-Atlas; Butterworth-Heinemann: Oxford, UK, 2003. [Google Scholar]
  41. Gish, H. The Magnitude Squared Coherence Estimate: A Geometric View. In Proceedings of the ICASSP ’84. IEEE International Conference on Acoustics, Speech, and Signal Processing, San Diego, CA, USA, 19–21 March 1984; Volume 1. [Google Scholar] [CrossRef]
  42. Malekpour, S.; Gubner, J.A.; Sethares, W.A. Measures of Generalized Magnitude-Squared Coherence: Differences and Similarities. J. Frankl. Inst. 2018, 355, 2932–2950. [Google Scholar] [CrossRef]
  43. Mohammad, S.M. Obtaining Reliable Human Ratings of Valence, Arousal, and Dominance for 20,000 English Words. In Proceedings of the ACL 2018—56th Annual Meeting of the Association for Computational Linguistics, Proceedings of the Conference (Long. Papers), Melbourne, Australia, 15–20 July 2018; Volume 1, pp. 174–184. [Google Scholar] [CrossRef]
  44. Russell, J.A. A Circumplex Model of Affect. J. Pers. Soc. Psychol. 1980, 39, 1161–1178. [Google Scholar] [CrossRef]
  45. Cohen, M.X. Analyzing Neural Time Series Data: Theory and Practice; The MIT Press: Cambridge, MA, USA, 2014; ISBN 9780262319553. [Google Scholar]
  46. Welch, P.D. The Use of Fast Fourier Transform for the Estimation of Power Spectra: A Method Based on Time Averaging Over Short, Modified Periodograms. IEEE Trans. Audio Electroacoust. 1967, 15, 70–73. [Google Scholar] [CrossRef]
  47. Delorme, A.; Beischel, J.; Michel, L.; Boccuzzi, M.; Radin, D.; Mills, P. Electrocortical Activity Associated with Subjective Communication with the Deceased. Front. Psychol. 2013, 4, 834. [Google Scholar] [CrossRef]
  48. Yamada, T.; Meng, E. Guía Práctica Para Pruebas Neurofisiológicas Clínicas-EEG; Ovid Technologies: New York, NY, USA, 2020. [Google Scholar]
  49. Benjamini, Y.; Hochberg, Y. Controlling the False Discovery Rate: A Practical and Powerful Approach to Multiple Testing. J. R. Stat. Soc. Ser. B (Methodol.) 1995, 57, 289–300. [Google Scholar] [CrossRef]
  50. Martínez-Cagigal, V. Multiple Testing Toolbox-File Exchange-MATLAB Central. Available online: https://ch.mathworks.com/matlabcentral/fileexchange/70604-multiple-testing-toolbox (accessed on 28 July 2024).
  51. Meyer, M.; Lamers, D.; Kayhan, E.; Hunnius, S.; Oostenveld, R. Enhancing Reproducibility in Developmental EEG Research: BIDS, Cluster-Based Permutation Tests, and Effect Sizes. Dev. Cogn. Neurosci. 2021, 52, 101036. [Google Scholar] [CrossRef]
  52. Maris, E.; Oostenveld, R. Nonparametric Statistical Testing of EEG- and MEG-Data. J. Neurosci. Methods 2007, 164, 177–190. [Google Scholar] [CrossRef]
  53. Sayyad, Z.; Sirohi, K.; Radha, V.; Swarup, G. 661W Is a Retinal Ganglion Precursor-like Cell Line in Which Glaucoma-Associated Optineurin Mutants Induce Cell Death Selectively. Sci. Rep. 2017, 7, 16855. [Google Scholar] [CrossRef] [PubMed]
  54. Tan, E.; Ding, X.Q.; Saadi, A.; Agarwal, N.; Naash, M.I.; Al-Ubaidi, M.R. Expression of Cone-Photoreceptor-Specific Antigens in a Cell Line Derived from Retinal Tumors in Transgenic Mice. Investig. Ophthalmol. Vis. Sci. 2004, 45, 764–768. [Google Scholar] [CrossRef] [PubMed]
  55. Mickuviene, I.; Kirveliene, V.; Juodka, B. Experimental Survey of Non-Clonogenic Viability Assays for Adherent Cells In Vitro. Toxicol. Vitro 2004, 18, 639–648. [Google Scholar] [CrossRef] [PubMed]
  56. Sun, X.; Kaufman, P.D. Ki-67: More than a Proliferation Marker. Chromosoma 2018, 127, 175. [Google Scholar] [CrossRef] [PubMed]
  57. Tursunov, A.; Kwon, S.; Pang, H.S. Discriminating Emotions in the Valence Dimension from Speech Using Timbre Features. Appl. Sci. 2019, 9, 2470. [Google Scholar] [CrossRef]
  58. Brück, C.; Kreifelts, B.; Wildgruber, D. Emotional Voices in Context: A Neurobiological Model of Multimodal Affective Information Processing. Phys. Life Rev. 2011, 8, 383–403. [Google Scholar] [CrossRef]
  59. Nussbaum, C.; Schirmer, A.; Schweinberger, S.R. Contributions of Fundamental Frequency and Timbre to Vocal Emotion Perception and Their Electrophysiological Correlates. Soc. Cogn. Affect. Neurosci. 2022, 17, 1145–1154. [Google Scholar] [CrossRef]
  60. Lin, C.D.; Radu, C.M.; Vitiello, G.; Romano, P.; Polcari, A.; Iliceto, S.; Simioni, P.; Tona, F. Sounds Stimulation on In Vitro HL1 Cells: A Pilot Study and a Theoretical Physical Model. Int. J. Mol. Sci. 2021, 22, 10156. [Google Scholar] [CrossRef]
  61. Kechagia, J.Z.; Ivaska, J.; Roca-Cusachs, P. Integrins as Biomechanical Sensors of the Microenvironment. Nat. Rev. Mol. Cell Biol. 2019, 20, 457–473. [Google Scholar] [CrossRef]
  62. Matthews, B.D.; Thodeti, C.K.; Ingber, D.E. Activation of Mechanosensitive Ion Channels by Forces Transmitted Through Integrins and the Cytoskeleton. Curr. Top. Membr. 2007, 58, 59–85. [Google Scholar] [CrossRef]
  63. Delling, M.; Indzhykulian, A.A.; Liu, X.; Li, Y.; Xie, T.; Corey, D.P.; Clapham, D.E. Primary Cilia Are Not Calcium-Responsive Mechanosensors. Nature 2016, 531, 656–660. [Google Scholar] [CrossRef] [PubMed]
  64. Muhamed, I.; Chowdhury, F.; Maruthamuthu, V. Biophysical Tools to Study Cellular Mechanotransduction. Bioengineering 2017, 4, 12. [Google Scholar] [CrossRef] [PubMed]
  65. Bui, T.M.; Wiesolek, H.L.; Sumagin, R. ICAM-1: A Master Regulator of Cellular Responses in Inflammation, Injury Resolution, and Tumorigenesis. J. Leukoc. Biol. 2020, 108, 787–799. [Google Scholar] [CrossRef] [PubMed]
  66. Chang, Y.C.; Wu, J.W.; Wang, C.W.; Jang, A.C.C. Hippo Signaling-Mediated Mechanotransduction in Cell Movement and Cancer Metastasis. Front. Mol. Biosci. 2019, 6, 157. [Google Scholar] [CrossRef] [PubMed]
  67. Spindler, M.C.; Redolfi, J.; Helmprobst, F.; Kollmannsberger, P.; Stigloher, C.; Benavente, R. Electron Tomography of Mouse LINC Complexes at Meiotic Telomere Attachment Sites with and without Microtubules. Commun. Biol. 2019, 2, 376. [Google Scholar] [CrossRef]
  68. Chang, L.; Li, M.; Shao, S.; Li, C.; Ai, S.; Xue, B.; Hou, Y.; Zhang, Y.; Li, R.; Fan, X.; et al. Nuclear Peripheral Chromatin-Lamin B1 Interaction Is Required for Global Integrity of Chromatin Architecture and Dynamics in Human Cells. Protein Cell 2022, 13, 258–280. [Google Scholar] [CrossRef]
  69. Peric-Hupkes, D.; van Steensel, B. Role of the Nuclear Lamina in Genome Organization and Gene Expression. Cold Spring Harb. Symp. Quant. Biol. 2010, 75, 517–524. [Google Scholar] [CrossRef]
  70. Fu, M.; Hu, Y.; Lan, T.; Guan, K.L.; Luo, T.; Luo, M. The Hippo Signalling Pathway and Its Implications in Human Health and Diseases. Signal Transduct. Target. Ther. 2022, 7, 376. [Google Scholar] [CrossRef]
  71. Zhang, X.; Abdelrahman, A.; Vollmar, B.; Zechner, D. The Ambivalent Function of YAP in Apoptosis and Cancer. Int. J. Mol. Sci. 2018, 19, 3770. [Google Scholar] [CrossRef]
Figure 1. Experimental set-up. (a) A passive acoustic treatment consisting of sound-absorbing and isolation panels was installed in a conventional incubator CO2 (Forma™ Steri-Cycle™ CO2 incubator, model 371, Thermo Electron Corporation, Waltham, MA, USA) to homogenize the acoustic field and reduce background noise. (b) The electro-acoustic radiation system consisted of a loudspeaker suspended on an acoustic support and connected to a digital audio player. The acoustic stimulus was radiated onto non-auditory cells at an Lp of 80 dB for 72 h.
Applsci 14 09400 g001
Figure 2. Averaged log-transformed power spectrum [in 10*log10(µV2)/Hz] of the Fz electrode across the frequency range of 0.5–45 Hz. Upper: Log-transformed power spectrum in the resting-state (gray) and gratitude (mustard) conditions. Shaded areas denote, for each condition, the standard error of the mean (SEM). Lower: Difference in power spectrum between conditions. The dotted line denotes the zero-power difference. The solid dark line at the bottom of the x-axis denotes the significant cluster of p-values from a paired t-test (α-level = 0.05) for the resting-state and gratitude power spectrum (p-values were corrected for multiple comparisons via cluster-based permutation test; N = 100,000 randomizations).
Applsci 14 09400 g002
Figure 3. Averaged log-transformed power [in 10*log10(µV2)/Hz] across the Fz electrode for each frequency band for the resting-state (gray) and gratitude (mustard) conditions. Frequency bands are considered as theta (4–7.9 Hz), alpha (8–11.9 Hz), beta (12–29.9 Hz), and gamma (30–45 Hz). Solid lines within the violins indicate the mean value. Dashed lines denote the power at 0. Vertical lines denote the limit between frequency bands. Asterisks denote the significance of the difference between conditions established using paired t-tests: ** (p < 0.01), and * (p ≤ 0.05).
Applsci 14 09400 g003
Figure 4. Emotional (ii) and synthesized emotional (iv) voice signal analysis. (a) Upper: Spectrogram of the emotional stimulus recorded by the participant after reading aloud the gratitude letter. Lower: Spectrogram of the synthesized emotional stimulus obtained from the text of the gratitude letter written by the participant using VoiceOver. (b) Upper: Spectrum of the emotional voice stimulus. Lower: Spectrum of the synthesized emotional voice stimulus. (c) Analysis of the magnitude-squared coherence (MSC) value [in AU] shows the similarities between the spectral content of (ii) the emotional signal and (iv) the synthesized emotional signal. The dashed red line denotes the 0.7 threshold for MSC values. The mean MSC value was 0.21 for a frequency bandwidth of 0–5000 Hz. AU, arbitrary units.
Applsci 14 09400 g004
Figure 5. In situ measurements of background noise from the CO2 incubator. Gray line: Normalized mean Lp of the CO2 incubator without vibro-acoustic elements. Yellow line: Normalized mean Lp of the CO2 incubator with passive vibro-acoustic elements. PVT, passive vibro-acoustic treatment.
Applsci 14 09400 g005
Figure 6. The impact of emotional, non-emotional, and synthesized voice radiation on the 661W cell line: proliferation assay and Ki-67 protein expression. Confocal microscopy representative image depicts the Ki-67 control condition (a) and the Ki-67 emotional human voice condition (b). A passive vibro-acoustic treatment (PVT) was installed in the CO2 incubator test. 661W cells seeded at a density of 20,000 cells/well and incubated for 72 h with the electro-acoustic system turned off (control group) and gratitude voice (emotional group). All acoustic stimuli were radiated using a loudspeaker-based system with an equivalent level of 80 dB. Cells were imaged with a laser-scanning confocal microscope at 40× magnification. Scale bar, 20 µm. (c) Absorbance values at 620 nm for crystal violet staining of 661W cells, seeded at a density of 2000 cells/well, and incubated for 72 h without acoustic stimuli (control group), with gratitude voice (emotional group), with Don Quixote text voice (non-emotional group), and with gratitude synthesized voice (synthesized group). Results are the mean ± standard deviation of three independent experiments (12 replicates per plate). ** p-value = 0.007. AU, arbitrary units. (d) Nuclear luminance values per pixel analyzed on a cell-by-cell basis for Ki-67 expression in the control and emotional conditions (n = 127 cell nuclei samples were analyzed in the control condition, and n = 172 in the emotional condition). Results are the mean ± standard deviation of three independent experiments. **** p = 0.000007. AU, arbitrary units.
Applsci 14 09400 g006
Disclaimer/Publisher’s Note: The statements, opinions and data contained in all publications are solely those of the individual author(s) and contributor(s) and not of MDPI and/or the editor(s). MDPI and/or the editor(s) disclaim responsibility for any injury to people or property resulting from any ideas, methods, instructions or products referred to in the content.

