Article

Evaluation of Petrographic and Geomechanical Properties of Inzari Formation Rocks for Their Suitability as Building Materials in the Nizampur Basin, Pakistan

1
Department of Geotechnical Engineering, Tongji University, Shanghai 200092, China
2
Key Laboratory of Geotechnical and Underground Engineering of Ministry of Education, Tongji University, Shanghai 200092, China
3
College of Civil Engineering, Tongji University, Shanghai 200092, China
*
Author to whom correspondence should be addressed.
Appl. Sci. 2024, 14(20), 9395; https://doi.org/10.3390/app14209395
Submission received: 13 September 2024 / Revised: 4 October 2024 / Accepted: 11 October 2024 / Published: 15 October 2024

Abstract

:
This study focuses on the petrographic and geomechanical properties of the Inzari Formation rocks in Tar Khel Village, District Swabi, Khyber Pakhtunkhwa, Pakistan, on their suitability as building materials for structures such as bridges, buildings, and roads. Five fresh samples from various areas of this formation were analyzed and identified as siliciclastic mudstone through petrographic analysis. The results of physical properties (water absorption, specific gravity, and porosity) and mechanical properties (unconfined compression strength, unconfined tensile strength, Schmidt hammer test, and shear strength) indicate the Inzari Formation rocks have unconfined compressive strengths ranging from 23 to 94 MPa, specific gravity values ≥2.78, and low porosity and water absorption values (<1%), suggesting their excellent potential as building materials. Comparatively, the unconfined compressive strength values of the Inzari Formation rocks are similar to those of the NikanaiGhar limestone, which averaged 93.348 MPa, further confirming their suitability for construction. Additionally, the low porosity values of the Inzari Formation rocks align with the porosity range of 0.31% to 0.41% reported in the NikanaiGhar limestone study. Based on these findings, the Inzari Formation rocks are appropriate for use as fine aggregate in concrete, asphalt, and other construction materials.

1. Introduction

Rock aggregates have been used in numerous construction industries. Geological studies on rocks can help to enhance the quality, life expectancy, and security of civil structures such as bridges, highways, passageways, and dams. The strength of rock is primarily determined by its mechanical and physical characteristics. The geomechanical actions of rock as building materials have been extensively investigated [1,2]. The geomechanical characteristics of rock are often the consequence of multiple related factors, including petrology, mineralogy, texture and form, erosion, permeability, and fractures [3]. When rocks are used in building construction, they must meet to several physical and mechanical criteria of the building industry. The main factors that determine the physical characteristics of rock are its texture, petrological characteristics, geological structures, and surrounding conditions. Additionally, petrographic characteristics affect the geotechnical reactions of building materials [4]. To comprehend their behavior, it is necessary to consider how rocks react to various petrographic features, which include grain size, shape, orientation, and fractures. When classifying rocks, the aforementioned petrographic traits are rarely taken into consideration [5]. The current study also investigates how they affect the strength of rocks. The term ‘index properties or parameters that govern the composition of rock to support its classification’ refers to the physical characteristics of rock. The mechanical feature referred to as strength comprises the parameters or attributes that tell us about a rock’s strength and durability under specific circumstances like humidity, temperature, and loading conditions. In addition to the rock’s inherent physical and chemical characteristics, non-technical methods of rock excavation used in the construction industry have an impact on the strength of rock. The properties of building materials differ based on the kind of rock and are significantly impacted by the processes involved in the creation of rock in addition to the outside influences that exist all through the rock’s metamorphism [6].
A geologist is needed to assess the characteristics and quality of rock during extraction and to determine whether it will be feasible to use it for a particular construction project. As a result, evaluating an aggregate’s quality is crucial to deciding whether or not it can be utilized for engineering purposes [7]. It is required to subject rock aggregates to a variety of tests in accordance with international and local regulations in order to determine their suitability for any engineering-related purpose. These tests include the uniaxial compressive stress test (UCS), tensile strength, Brazilian test, Schmidt’s hammer test, point load index (PLI), SD test, total core recovery (TCR), and rock quality designation (RQD), in addition to testing for porosity, water absorption, specific gravity, and density. The nature of rock often is examined using microscopic analysis (polarizing and scanning electron microscopes) and physical and chemical studies. In addition to being utilized as building materials, rock aggregates are employed in the construction of railways, roads, and dams, as well as for concrete aggregate and asphalt base courses.
As a result, a lot of academics have attempted to investigate how certain petrographic and rock fabric characteristics affect the mechanical qualities of rocks [8]. Rock fabric and petrographic factors such as grain size, form, degree of cementation, type of cementation between grains, and mineralogical composition all affect mechanical properties. Soil and rocks are the two categories of earth materials that are studied in engineering geology [9]. Soil and rocks can be utilized as building materials in surface excavations such as railroad cuts, roadways, dams, and canals. Both can be utilized as sources of raw materials for construction products (aggregates, decorative stones, building stones, etc.). Margala limestone has been utilized as aggregate by Pakistan’s National Highway Authority (NHA) for the building of motorways and highways in major projects. Margala limestone has been used as an aggregate resource for the making of roads as well as a general building material.
In this study, the primary goal is to determine whether Inzari Formation rocks in the Nizampur Basin are suitable for construction thorough the petrography and physical–mechanical studies of the acquired rock samples. This study will also aid new economic and major infrastructural growth throughout the area, particularly as such projects connect to the China–Pakistan Economic Corridor (CPEC).

2. Geological Setting

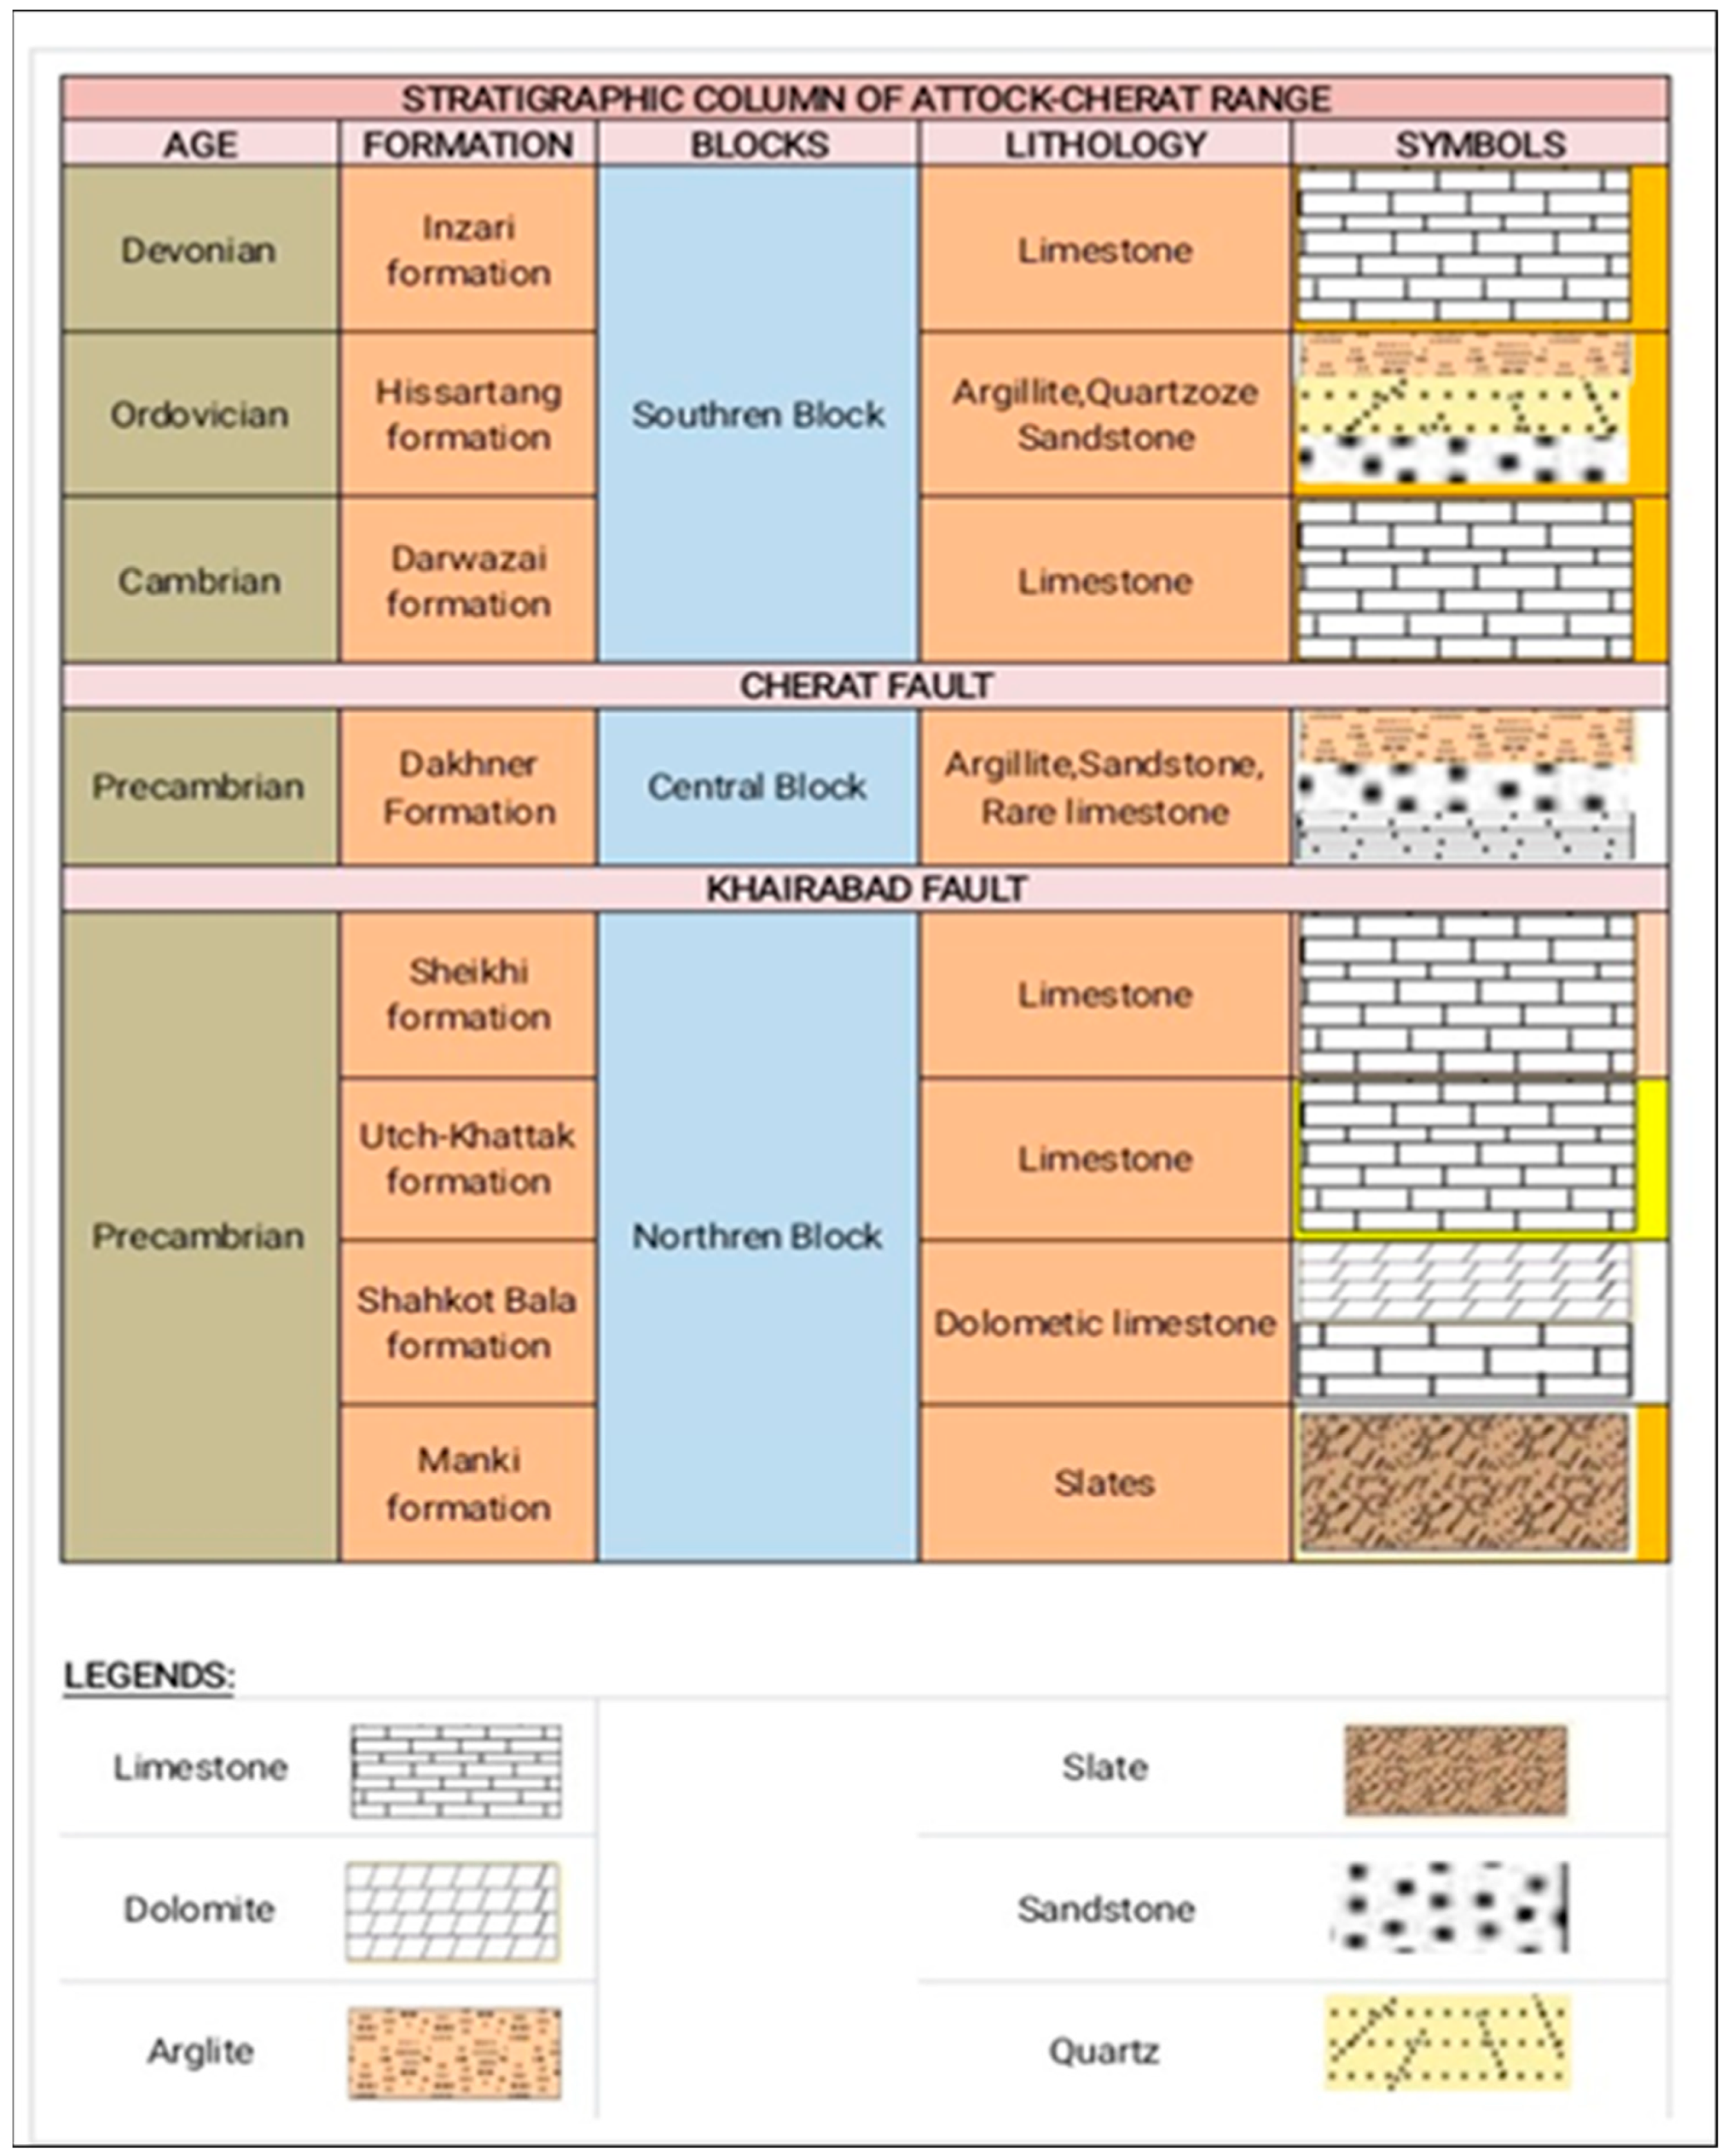
The study area (shown in Figure 1) is situated at Tar Khel Village in District Nowshera, Pakistan, where here is also a typical Inzari Formation See Figure 2. It is located at latitude 33°50′31.69″ N and longitude 72°09′10.48″ E. It is situated about 97 km from Peshawar and about 135 km from Islamabad. Geologically, three different tectonic plates exist in northern Pakistan Figure 3, and the ellipse shows the location of the study area in Figure 3 which includes the Eurasian Plate, the Kohistan Island Arc (KIA), and the Indian Plate. During the early Cretaceous period (130 million years ago), the Kohistan Island A(KIA/KLIA), an intra-oceanic arc inside the Tethys Ocean, first collided with the Eurasian Plate via the Main Karakoram Thrust (MKT), also known as the Shyok Sutures or Northern Suture Zone [10]. The Indus Suture Zone, also known as the Main Mantle Thrust, was created by the beginning to the mid-Eocene collision of the KIA with the Indian Plate (MMT). This collision resulted in the KIA being hidden or abducted onto the Indian Plate rocks. Despite being an intra-oceanic island, the KIA is joined to the Asian/Eurasian Plate along its northern suture and the Indo-Pakistan Plate along its southern suture. The evolution of KLIA/KIA is well acknowledged and understood.
The exact moment of the KLIA’s collision with the Asian Plate and Indo-Pakistan remains debatable, nonetheless. Pakistan has several large thrust faults extending from north to south. The thrust system that divides the Kohistan Island Arc (KIA) complex in the south from the deformed meta-sedimentary and igneous rocks of the Asian land mass in the north is headed by the Main Karakoram Thrust. The Kohistan Island Arc is constrained through the Main Mantle Thrust [11]. The Hazara–Kashmir Syntaxis is a prominent bend produced by the Main Boundary Thrust that extends east–west along the vast majority of the foreland basin before turning northward west of the Jhelum River. The Hazara and Murree Faults, which border the northern edges of the Kala Chitta and Hazara Categories, are thought to be associated with the Main Boundary Thrust.
Figure 3. Geological map of the study area, indicating the different rock formations present. The map highlights the Inzari Formation, along with adjacent geological units, providing an understanding of the regional geology and the distribution of rock types that influence the overall structural integrity of the area [12].
Applsci 14 09395 g003
The Hisartang Fault divides the Indian Plate into two distinct zones. The term “internal metamorphosed zone” refers to the northern region between the Hisartang Fault and the MMT, whereas the term “external unmetamorphosed zone” or “low-grade metamorphic zone” describes the southern region. These strata are separated from Tertiary foreland basin deposits further to the south by the Main Boundary Thrust (MBT). The Himalayas are split into the Tethys Himalayas, Higher Himalayas, Lesser Himalayas, and Outer Himalayas according to their north to south orientation. Between the Kala Chitta Range to the south and the Peshawar Basin to the east is the Attock-Cherat Range (ACR). The Hisartang Thrust in the Nizampur Basin, which separates the southern slab of the ACR from the Kala Chitta Range, marks the border between the ACR and the range. The ACR and Kala Chitta Range rocks cracked because of movement along the Hisartang Thrust. Sediments from the Paleocene Pre-Cambrian outcrop in the ACR.
The Kahi Gorge is located in Khyber Pakhtunkhwa, in northwest Pakistan, in the foothills of the Himalayas in the Nizampur Valley. The Kala Chitta Range (KCR) is a segment of the active Himalayan Foreland Fold-and-Thrust Belt, which has been gradually thrust southward along the Main Boundary Thrust (MBT) in a sequence of top-to-south thrust imbricates, creating the Northern Pakistani region’s fault system [13].

3. Methodology

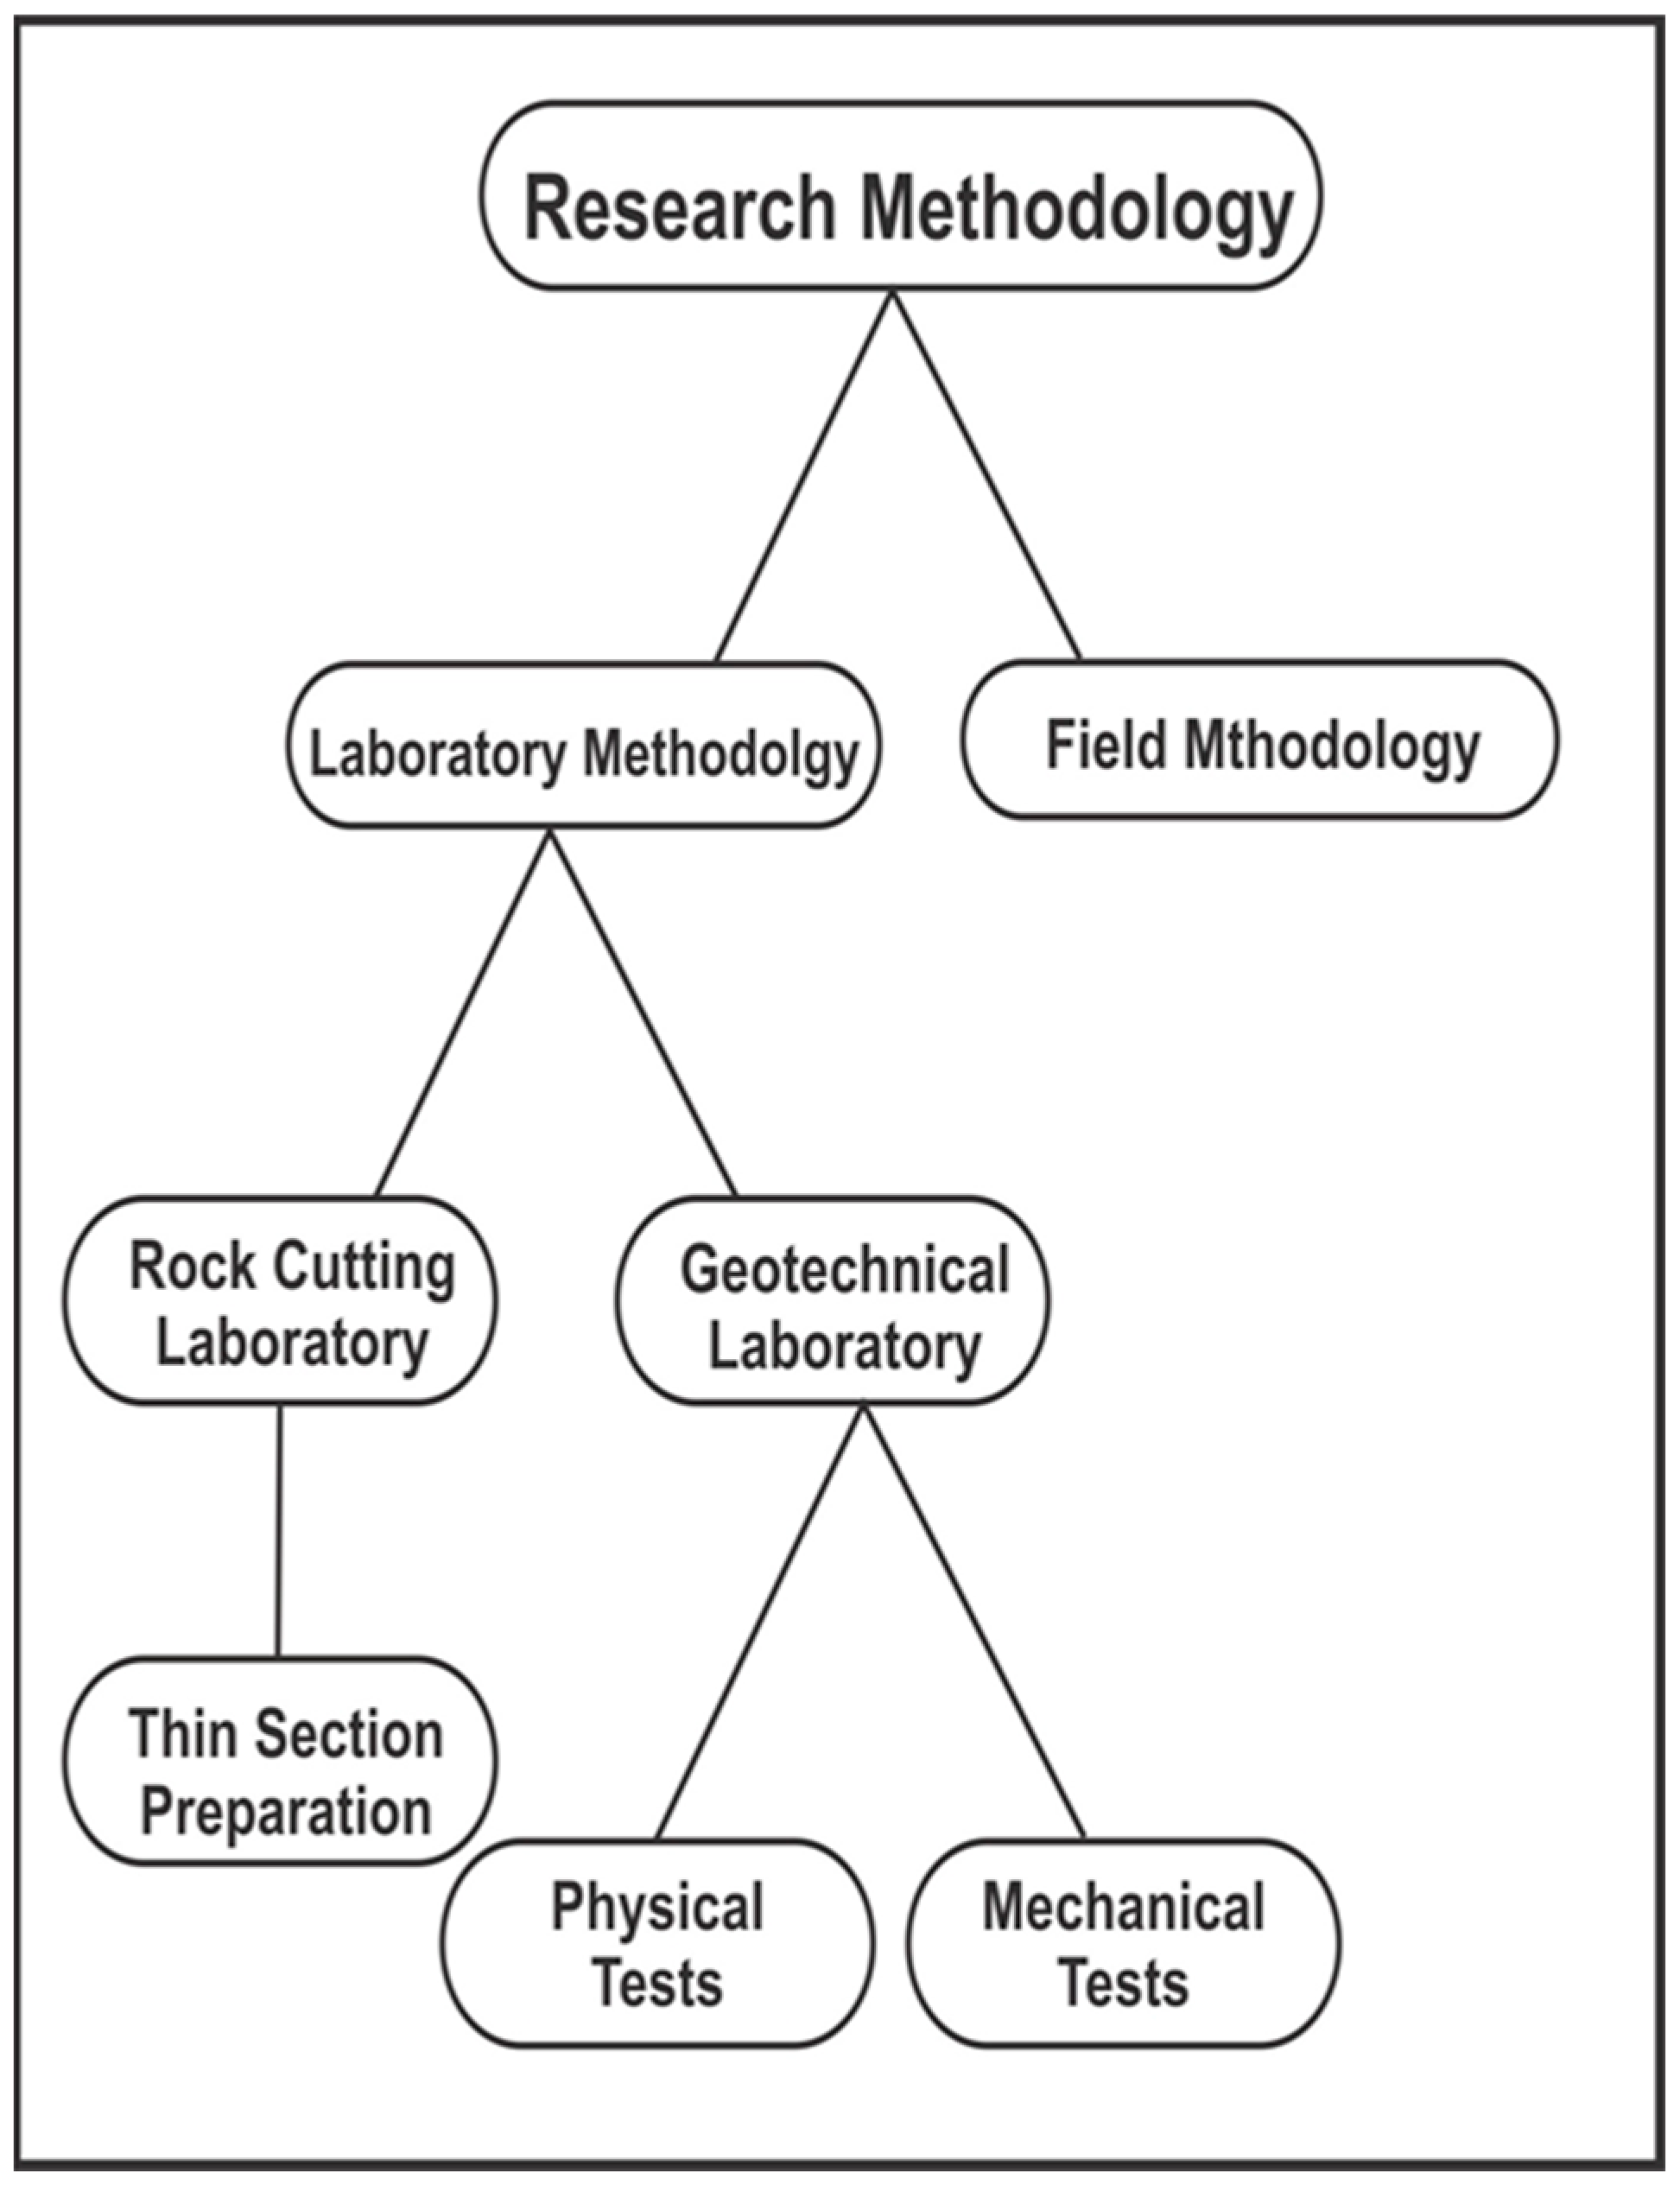
The methodology and techniques used in this study are shown in Figure 4.

3.1. Field Work

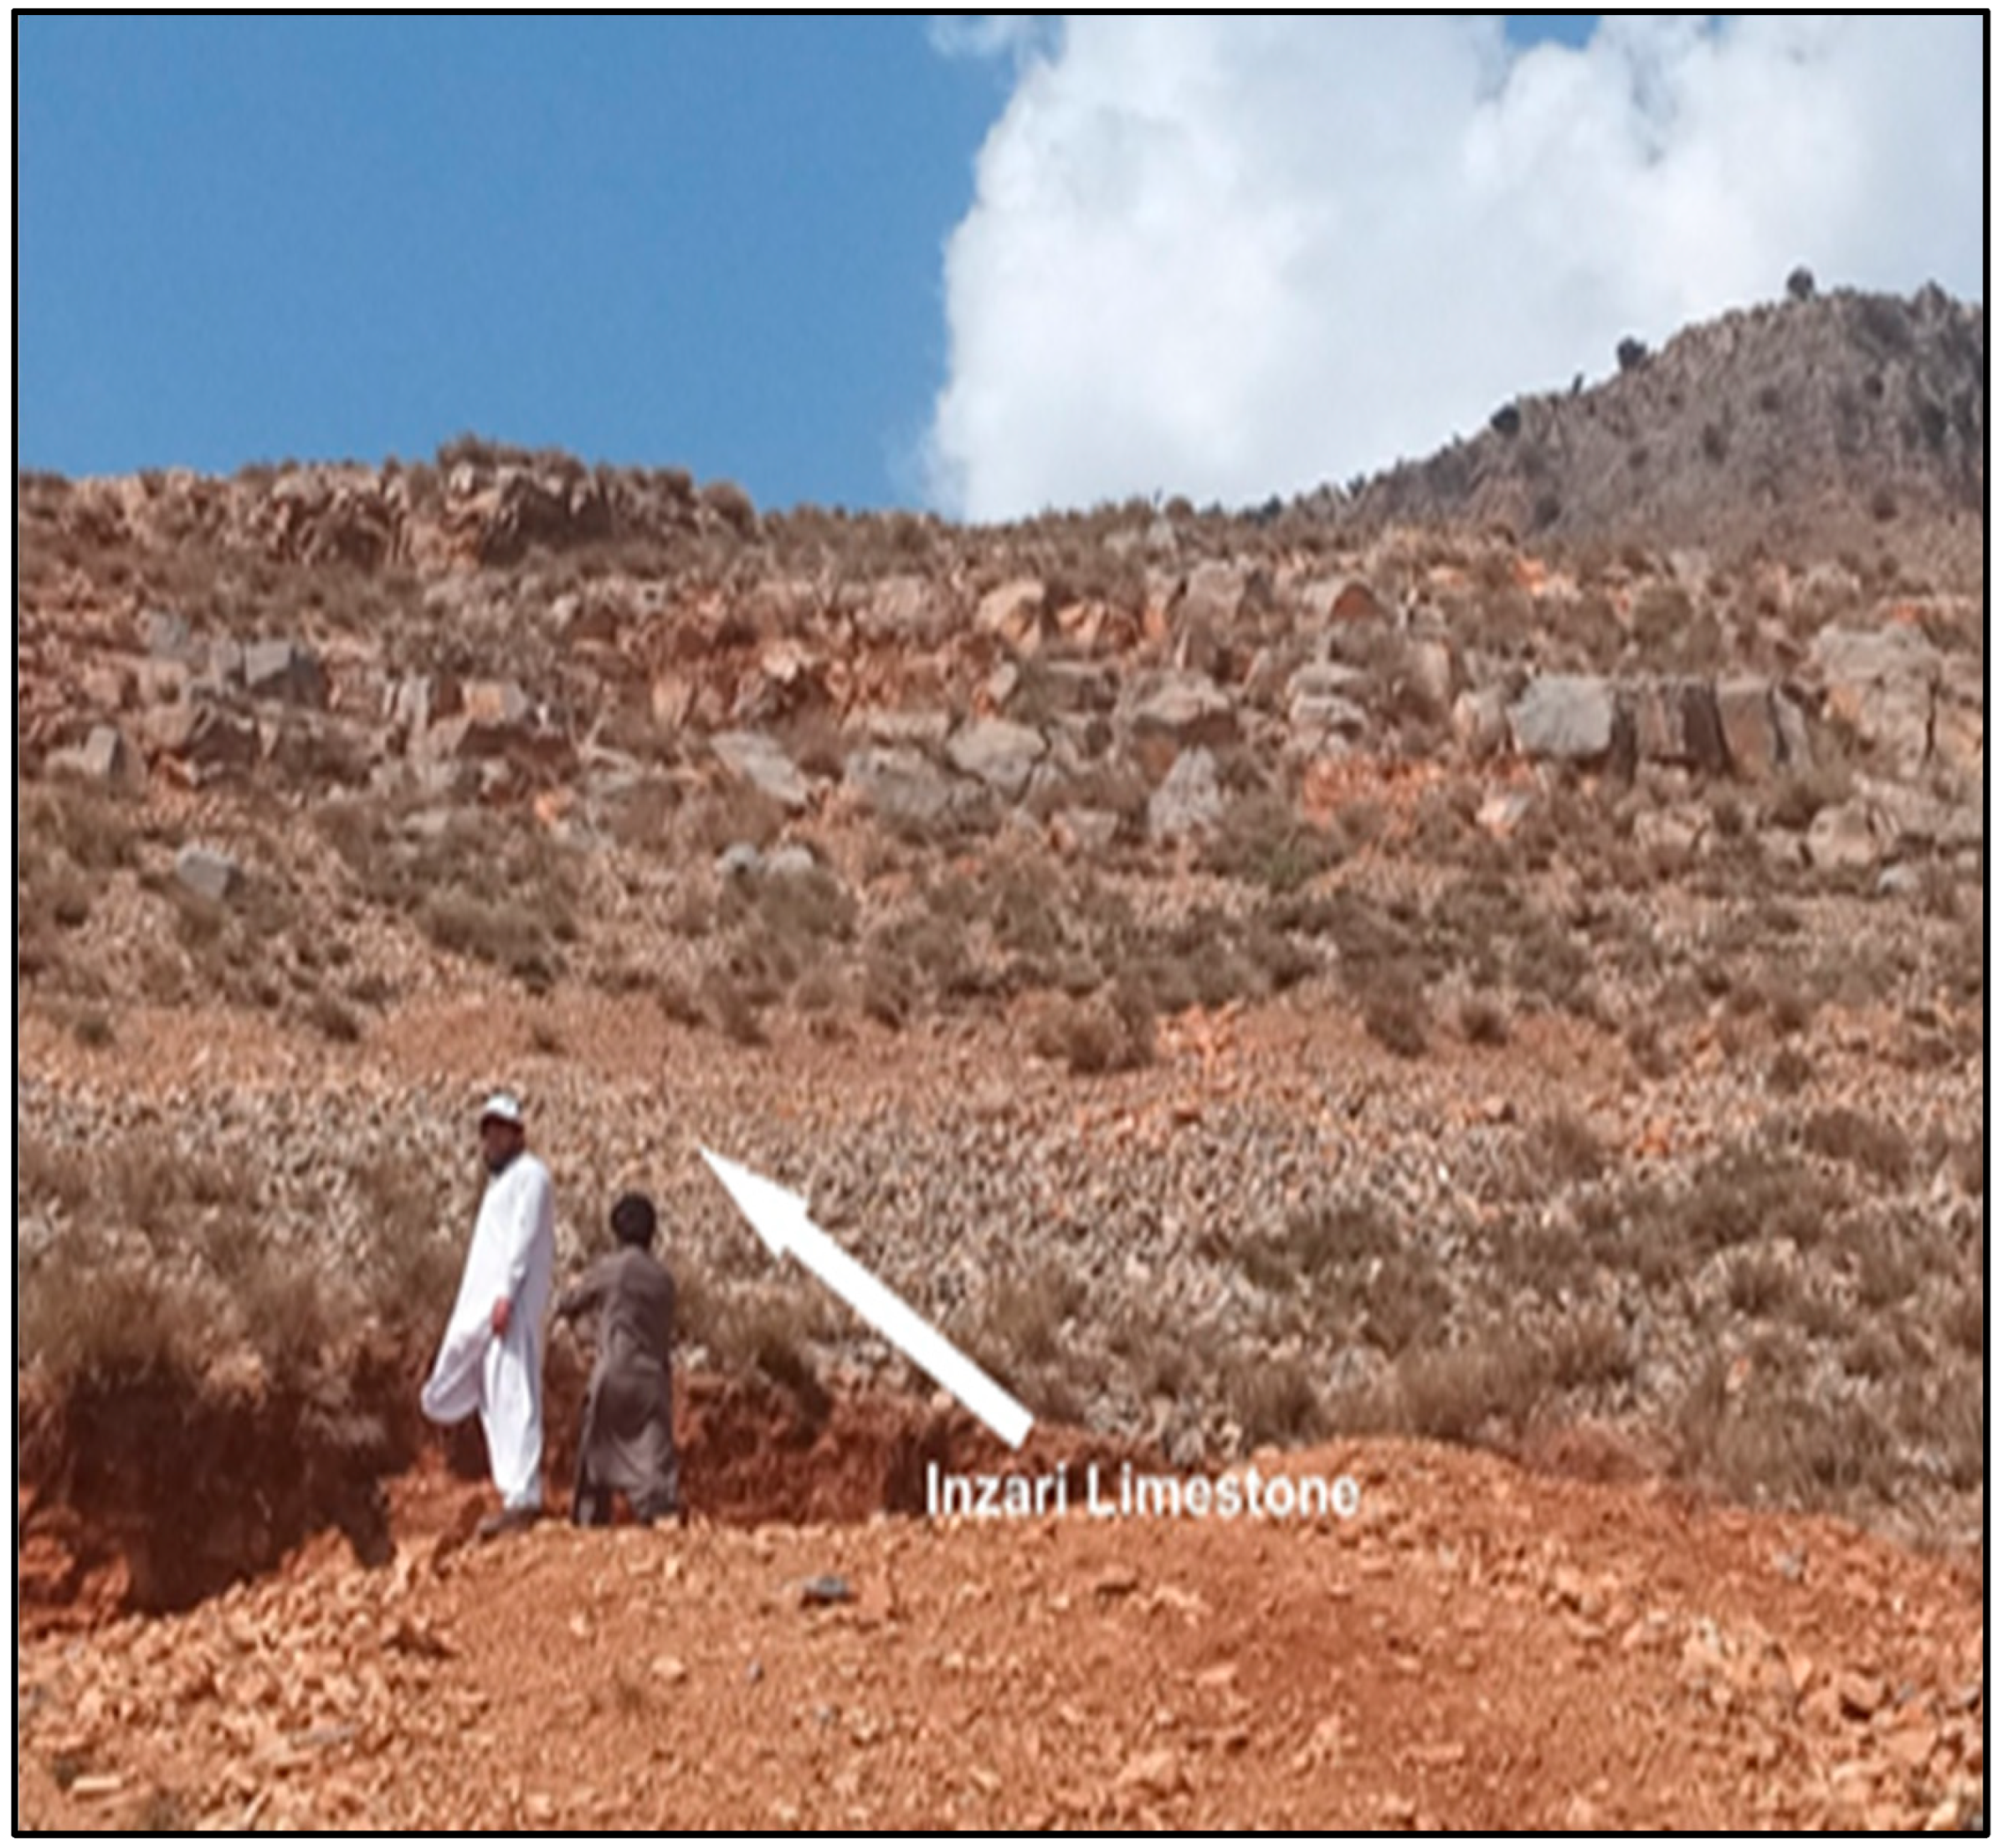
The typical Inzari Formation, which is situated in Nizampur Village in District Nowshera, Pakistan, was the site of a geological field study (see Figure 5). These rocks are located close to Cherat and Nowshera at the base of the Khattak Mountain Range. To the northeast lies the village of Hisartang. Five fresh 20–30 kg bulk samples were gathered from various locations. The bulk samples were gathered to ascertain the petrographic and physicomechanical characteristics of the Inzari Formation rocks. Every sample’s location was recorded via GPS. Approximately one kilogram of random specimens was taken for a detailed physical–mechanical and petrographic investigation of the exposed lithology of the Inzari Formation [14]. To conduct more analysis, the materials were moved to the rock cutting.

3.2. Lab Work

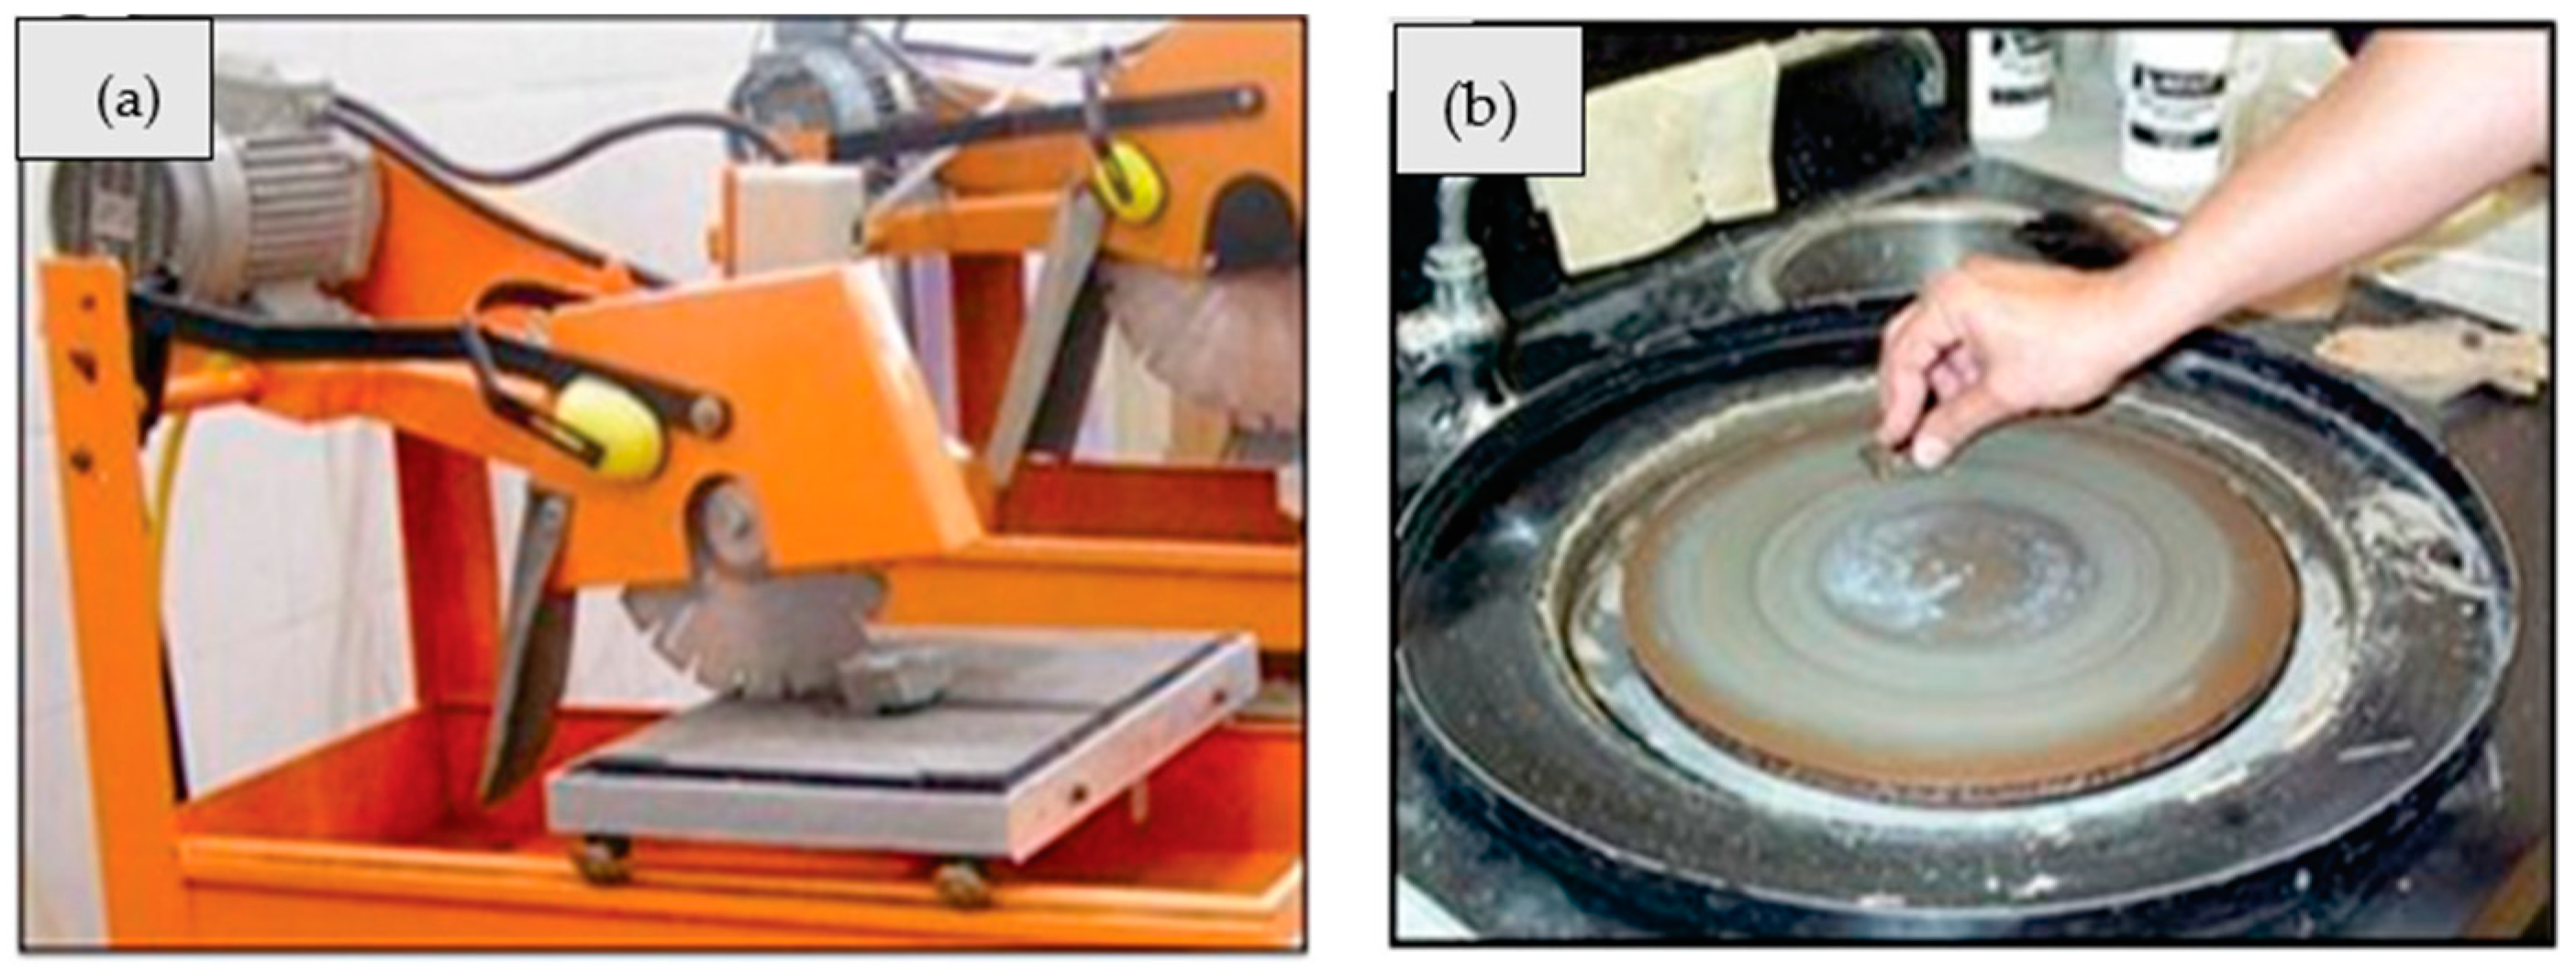
Five bulk rock specimens collected in the field were sent to the lab to be analyzed geotechnically and petrographically. The ASTM requirements were followed in the preparation of the sample cores (see Figure 6). Uniaxial compressive strength, unconfined tensile strength (UTS), shear strength, absorption of water, Schmidt hammer, specific gravity, and water absorption were among the engineering characteristics of the selected samples that were assessed [15].

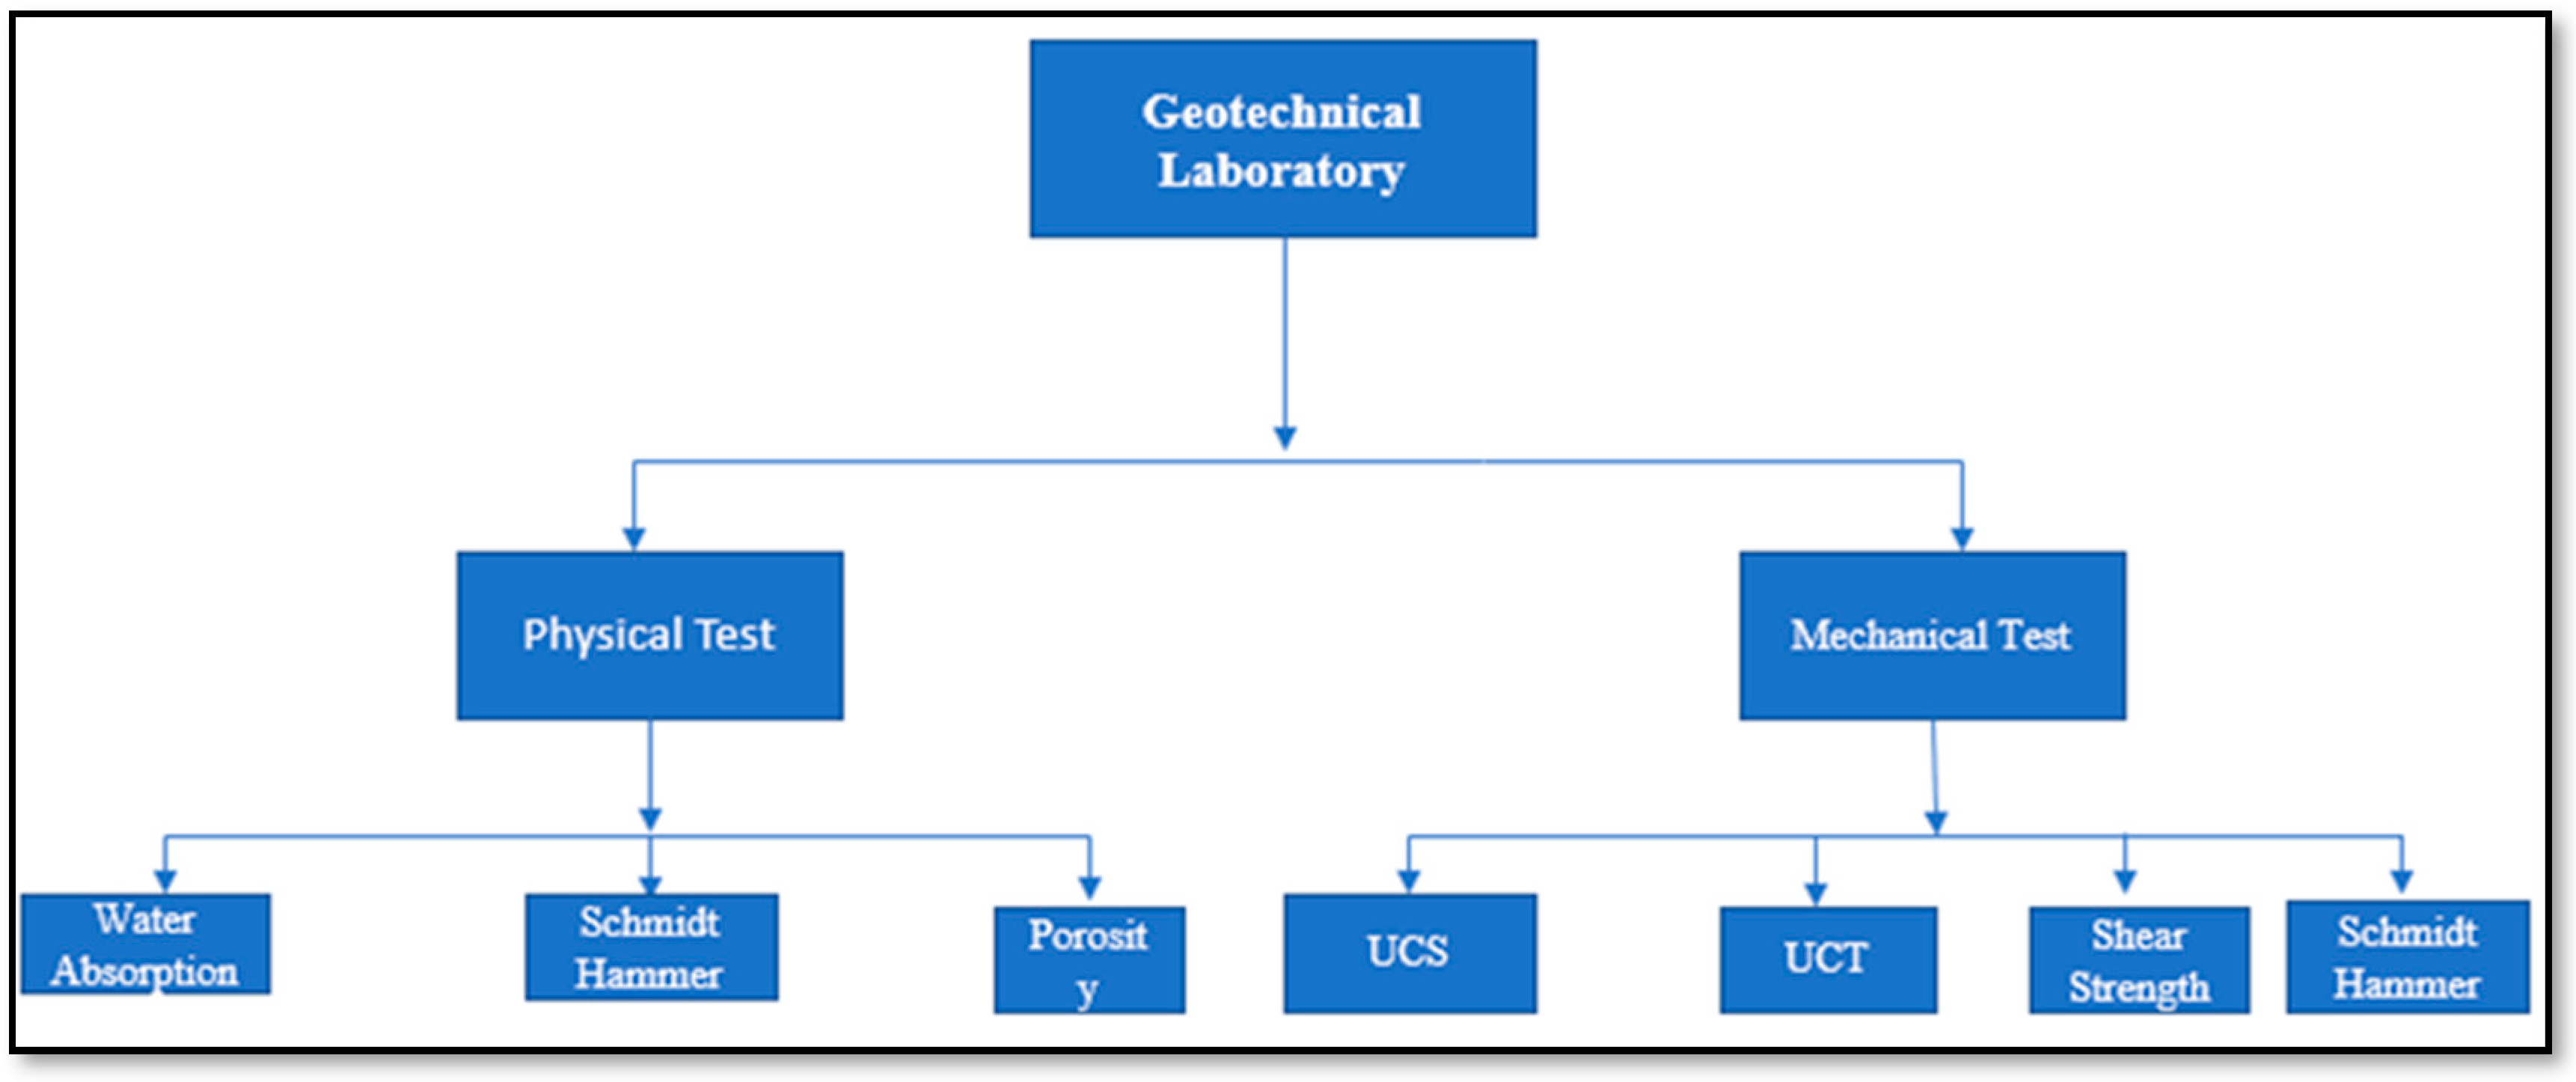
3.3. Geotechnical Laboratory

Rock strength was determined by conducting experiments of undamaged and undisturbed materials [16]. According to the process shown in See Figure 7, the physical and mechanical tests of rocks were carried out on specimens in the laboratory.

4. Results and Discussions

4.1. Physicomechanical Properties

4.1.1. Unconfined Compressive Strength or Uniaxial Strength

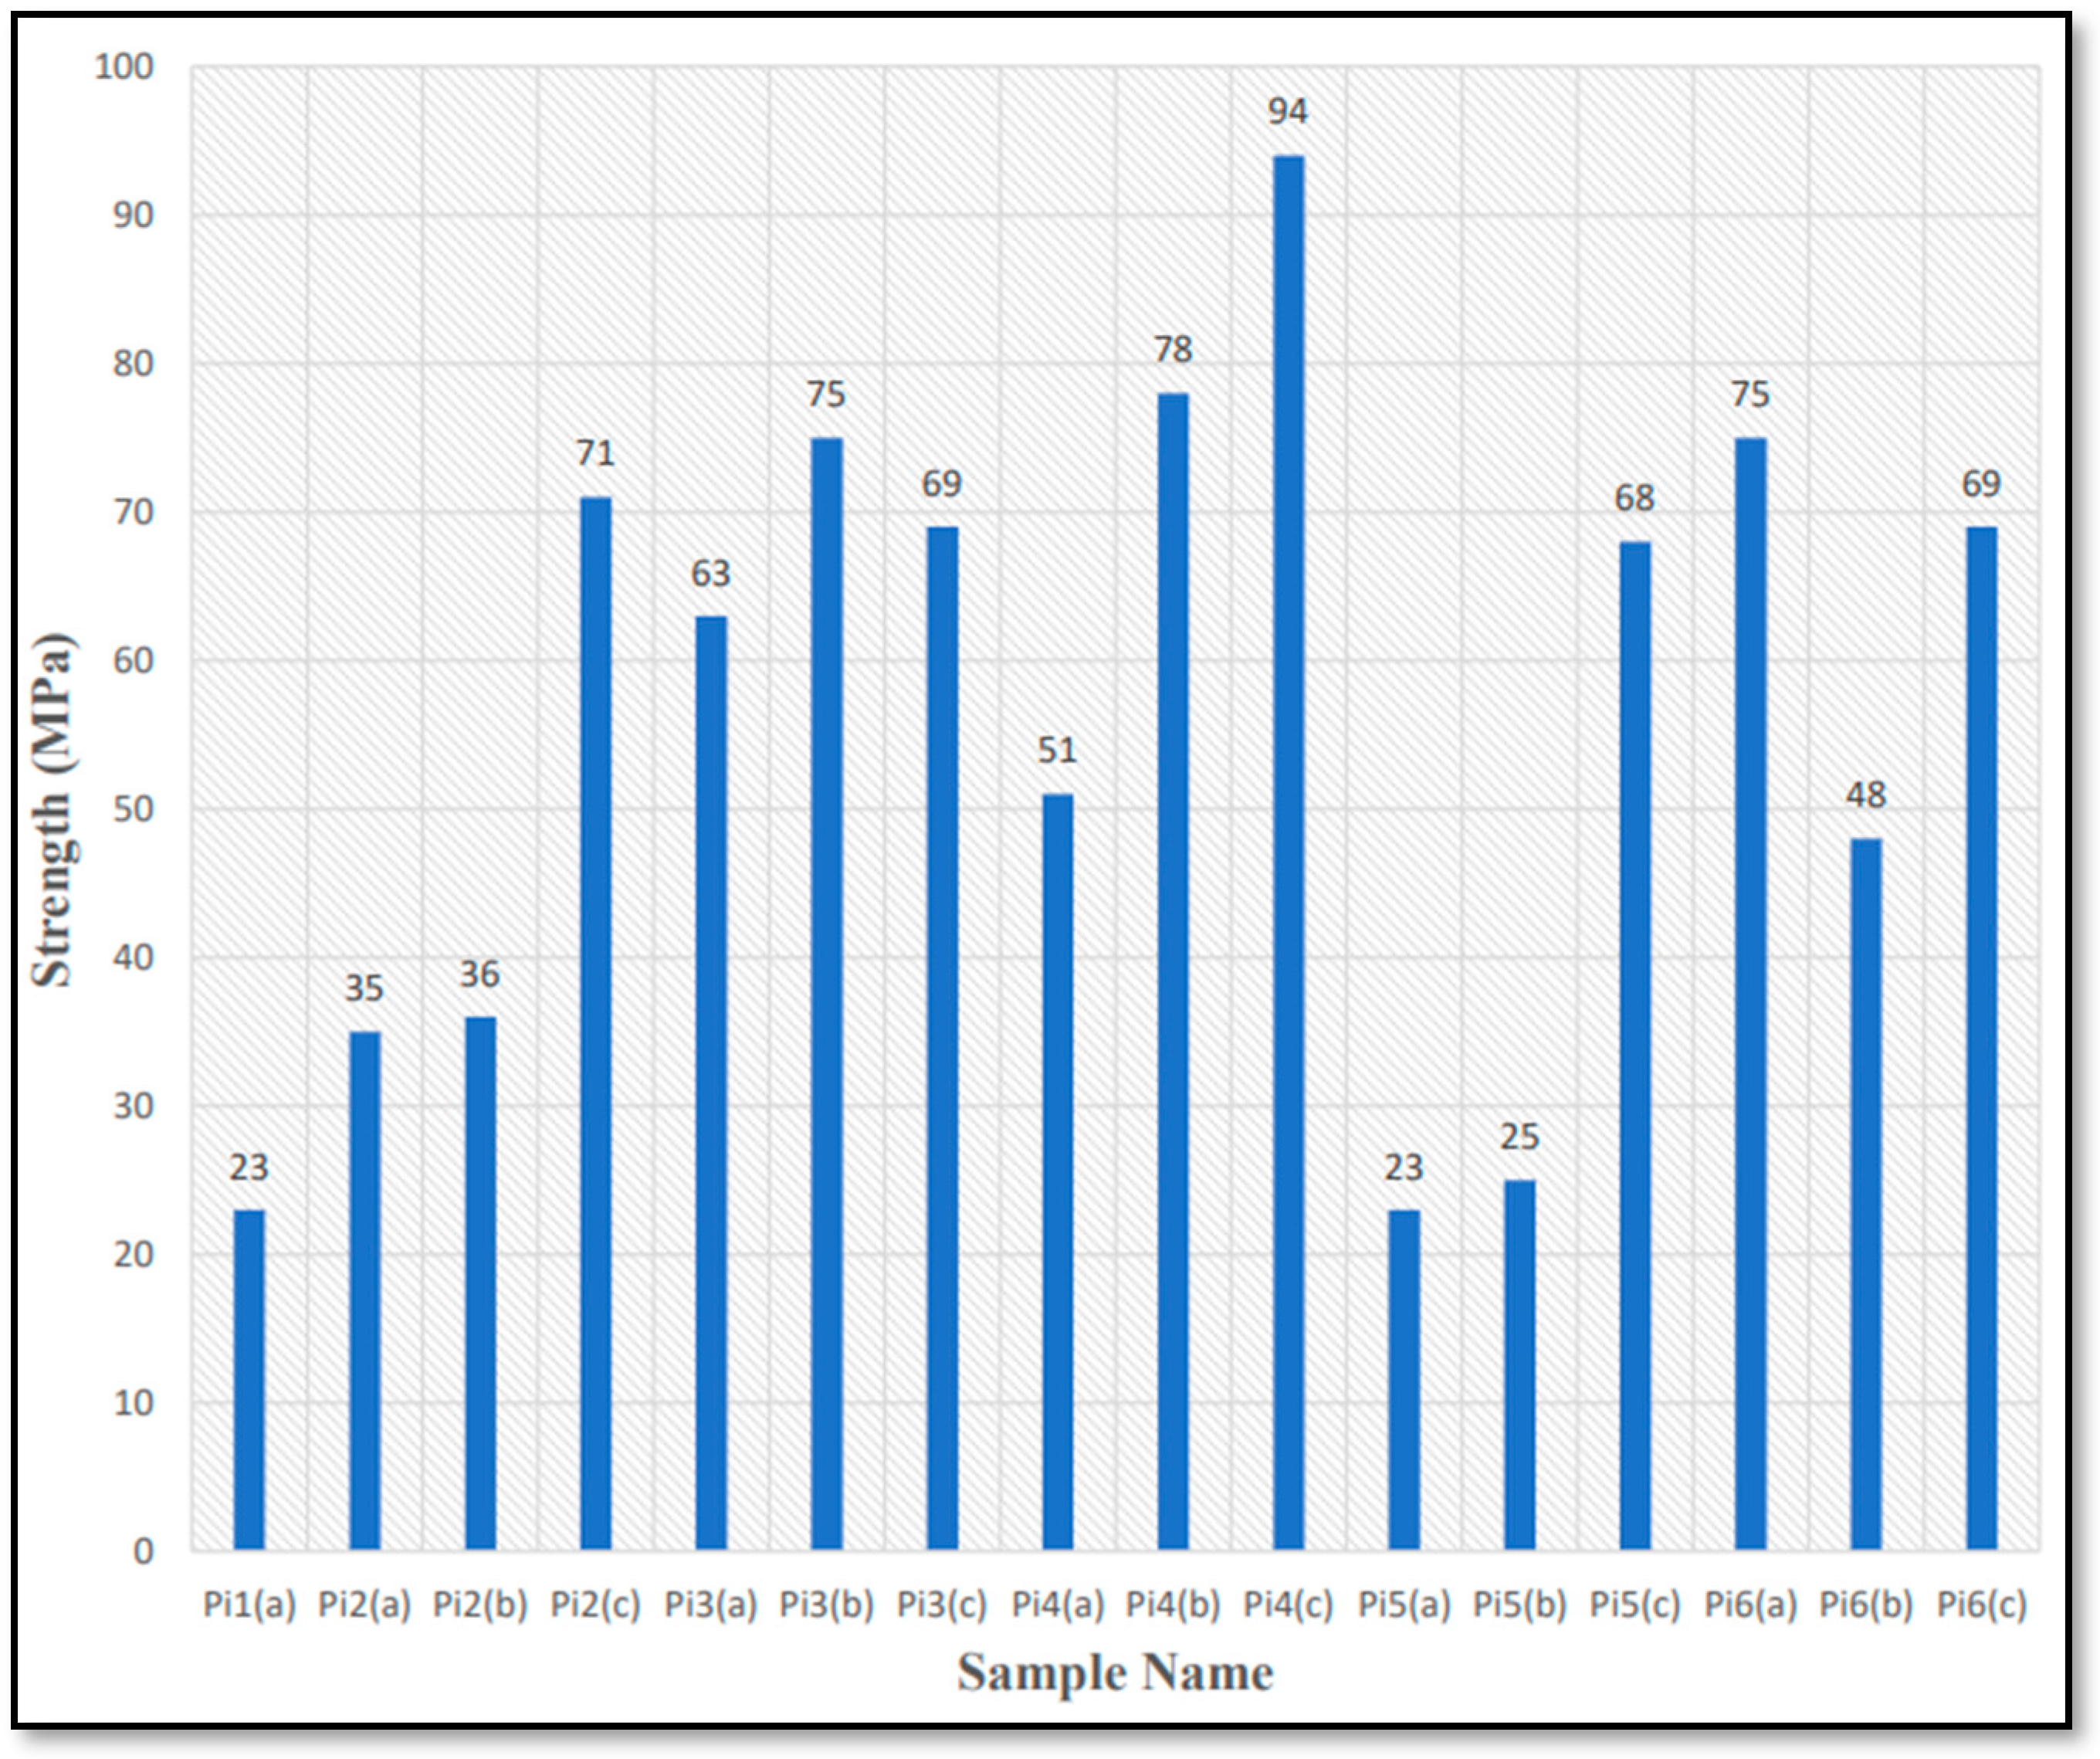
The unconfined compressive strength (UCS) is the maximum stress a specimen can endure before failure, and it is determined by applying unidirectional stress to a rock sample, as shown in Formula (1). UCS is a key factor in assessing the suitability of a rock as a construction material, as it indicates the rock’s toughness—its ability to resist weathering while maintaining its original size, shape, strength, and appearance over time. It is generally accepted that rocks with a UCS of at least 35 MPa are appropriate for use as building stones. In this study, the UCS of the tested rock samples was measured using a direct approach with a strength-testing machine. Cube samples, each measuring 3 inches in both width and length, were used for the tests. For each bulk sample, UCS tests were conducted on three specimens. The rock samples were placed into the strength-testing apparatus, and a continuous force was applied without causing shock waves, as shown in Figure 8. The results of these UCS tests are provided in Table 1 and Figure 9.
The UCS values for the Inzari Formation rocks indicate they fall within the “strong” category for construction use. This is consistent with the findings from the NikanaiGhar limestone study, where UCS values averaged 93.348 MPa. Such results further demonstrate the suitability of Inzari Formation rocks as reliable materials for construction. Rocks with finer-grain textures tend to be stronger than those with coarser textures. Since the majority of the tested rock samples have fine grains, they provide high strength values.
UCS = P / A
where
  • P = load of rock failure (kN).
  • A = rock sample cube’s cross-sectional area ( m 2 ).

4.1.2. Porosity

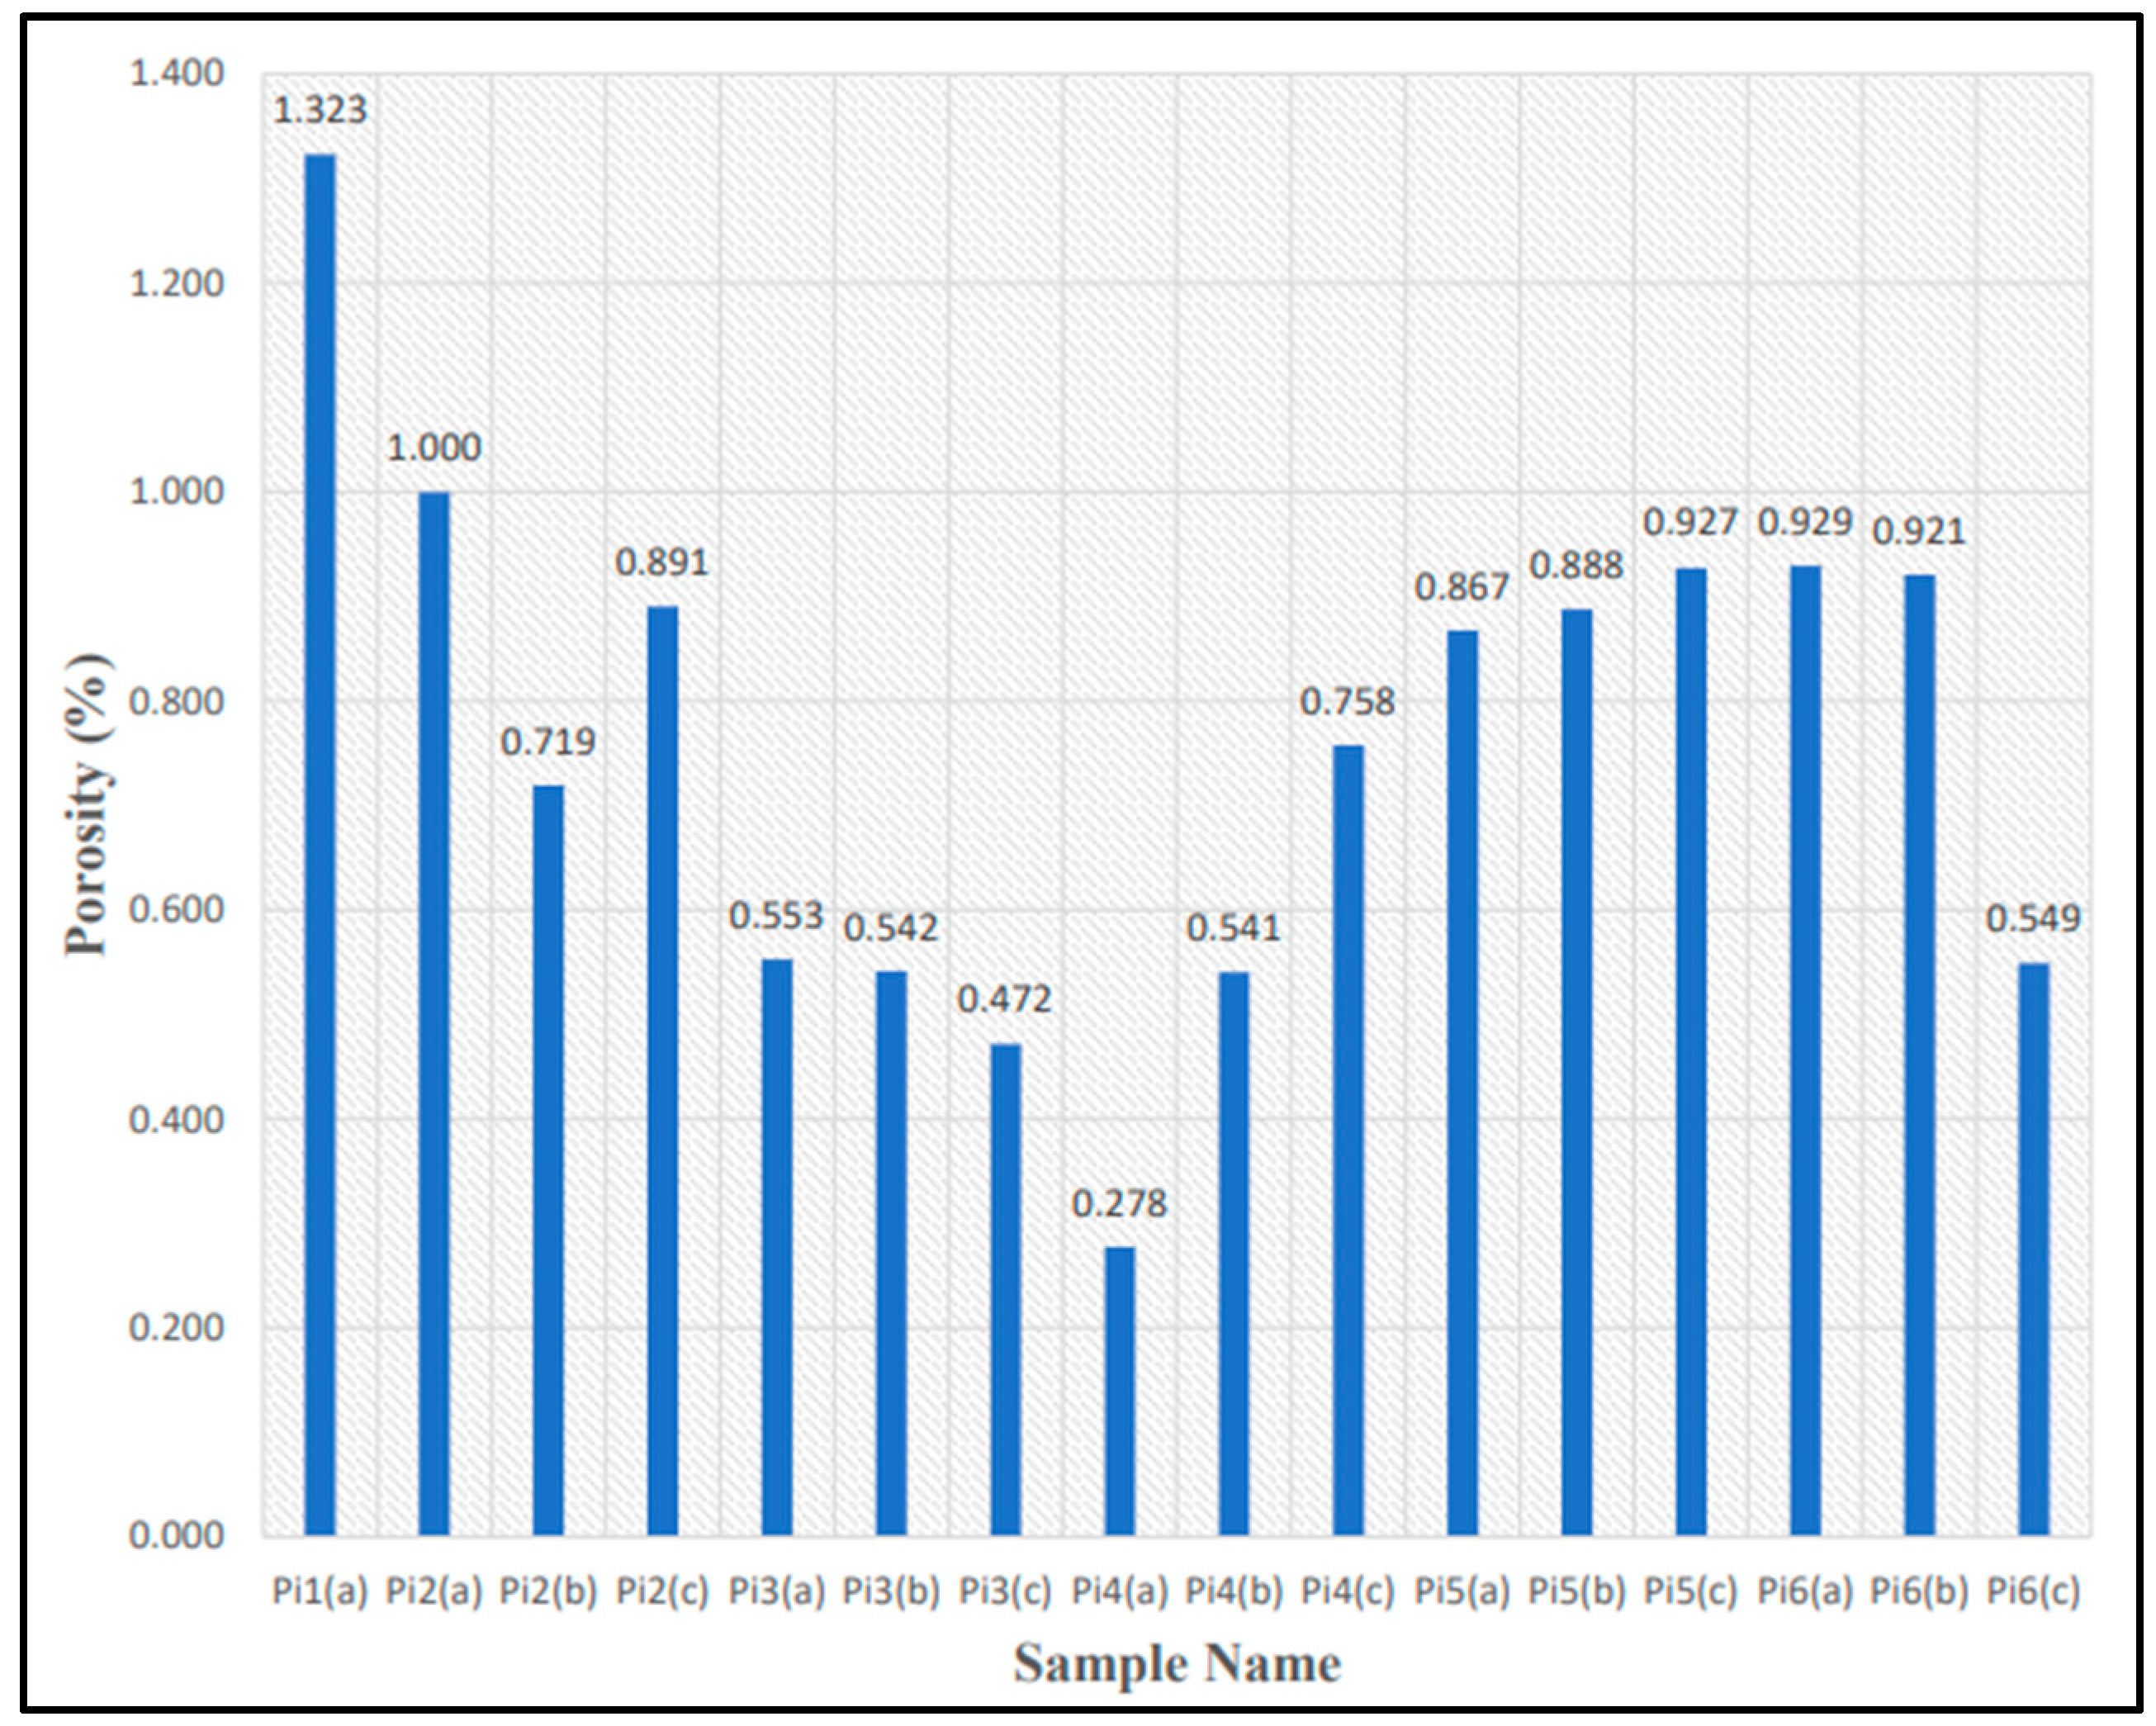
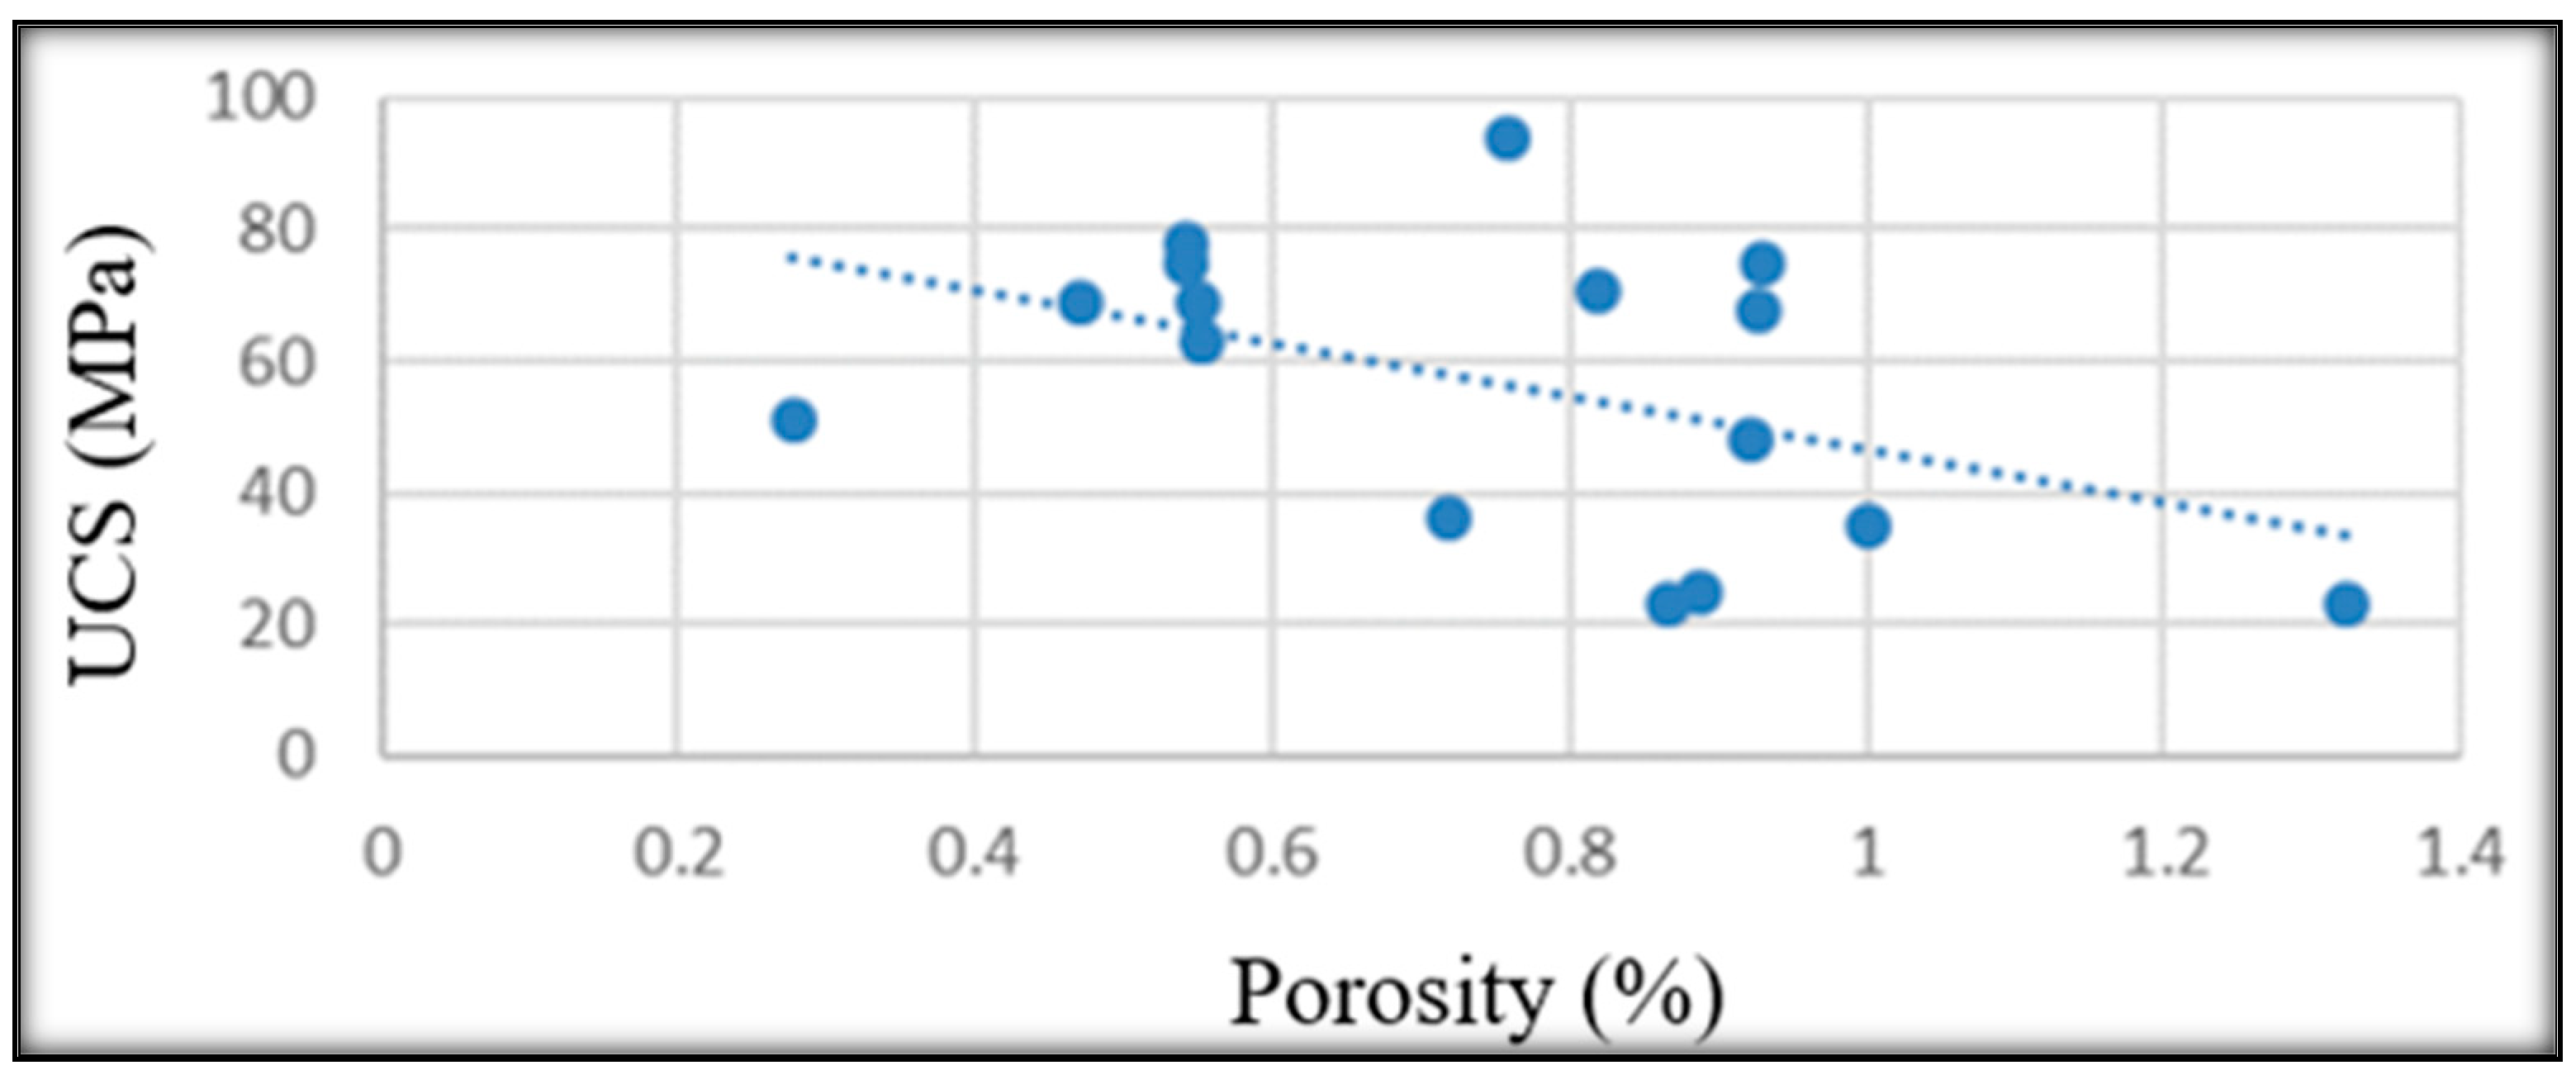
Porosity, one of the key physical properties of rocks, significantly influences their strength and deformation. It is defined as the volume of voids and pores within a rock. The porosity of rocks is affected by factors such as the size, shape, and mineral composition of the grains, with clay minerals having the most notable impact [17]. As porosity increases, rock strength tends to decrease. Additionally, porosity is often inversely related to specific gravity and directly related to water absorption. In the studied samples, porosity values ranged from 0.27% to 1.32% (see Figure 10 and Table 2). The porosity was determined using the saturation method, and calculations were made using Formula (2). Similarly, our study reported low porosity, which aligns with the findings where porosity values ranged from 0.31% to 0.41%. Both studies show that low porosity contributes to higher rock strength, making the materials suitable for construction use. Rock strength decreases as porosity increases. Therefore, we can infer that the low porosity values in these samples contribute to their higher strength and suitability as construction materials.
Porosity = w 1 w 3 w 1 w 2 × 100
where
  • w 1 = weight in the air.
  • w 2   = weight in water.
  • w 3 = oven-dried weight.

4.1.3. Water Absorption

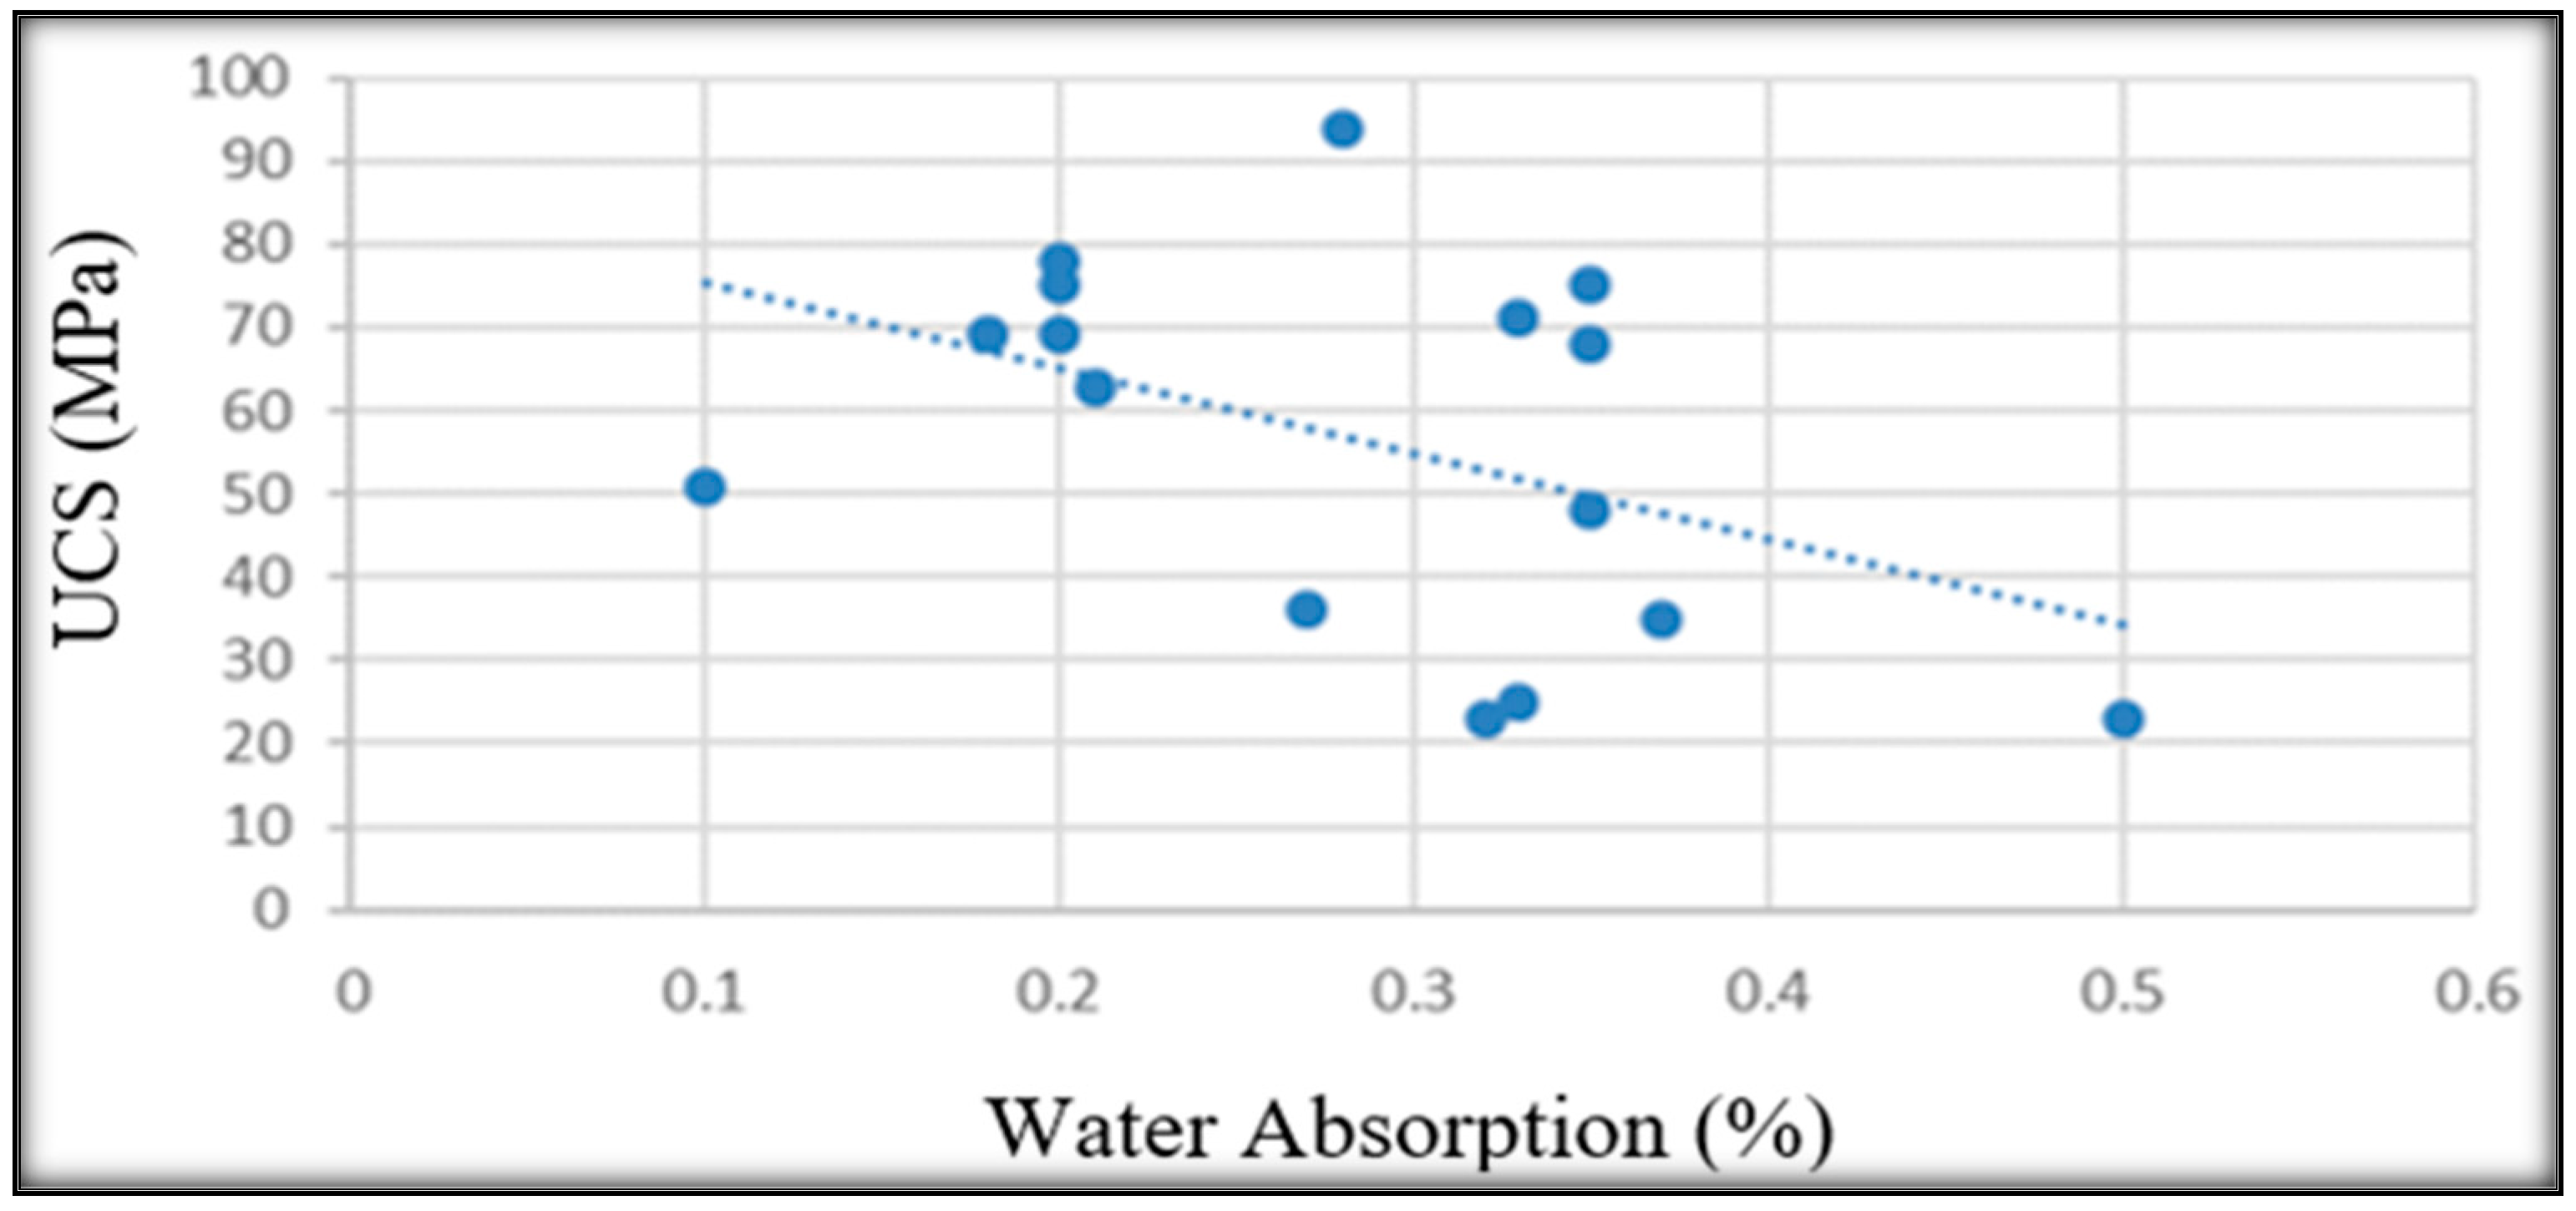
One of the most important physical features in determining the aggregate’s quality is its ability to absorb water. The amount of water a rock can absorb in one day is commonly called the water absorption [18]. It is used to adjust the weight of aggregates as a result of water collected in pore spaces. When it exceeds the acceptable limit, the material’s characteristics may alter. The investigated samples’ average absorption of water falls between 0.03 and 0.22, shown in Figure 11 and Table 3. The weight of the rock specimen in the water and its oven-dried weight measured in the laboratory were the two fundamental prerequisites for figuring out how much water it absorbs. The specimens’ absorption capacity was calculated using Formula (3). The maximum amount of water that rock or aggregate can absorb before being used in construction is 2%. Since the water absorption values for these samples are well below this threshold, the rocks are suitable for use as construction aggregate.
Percentage   Absorption = A b s o r p t i o n w 3 × 100
where
  • Absorption =   w 1 w 3 .
  •   w 1 = weight in the air.
  •   w 3 = oven-dried weight.

4.1.4. Specific Gravity

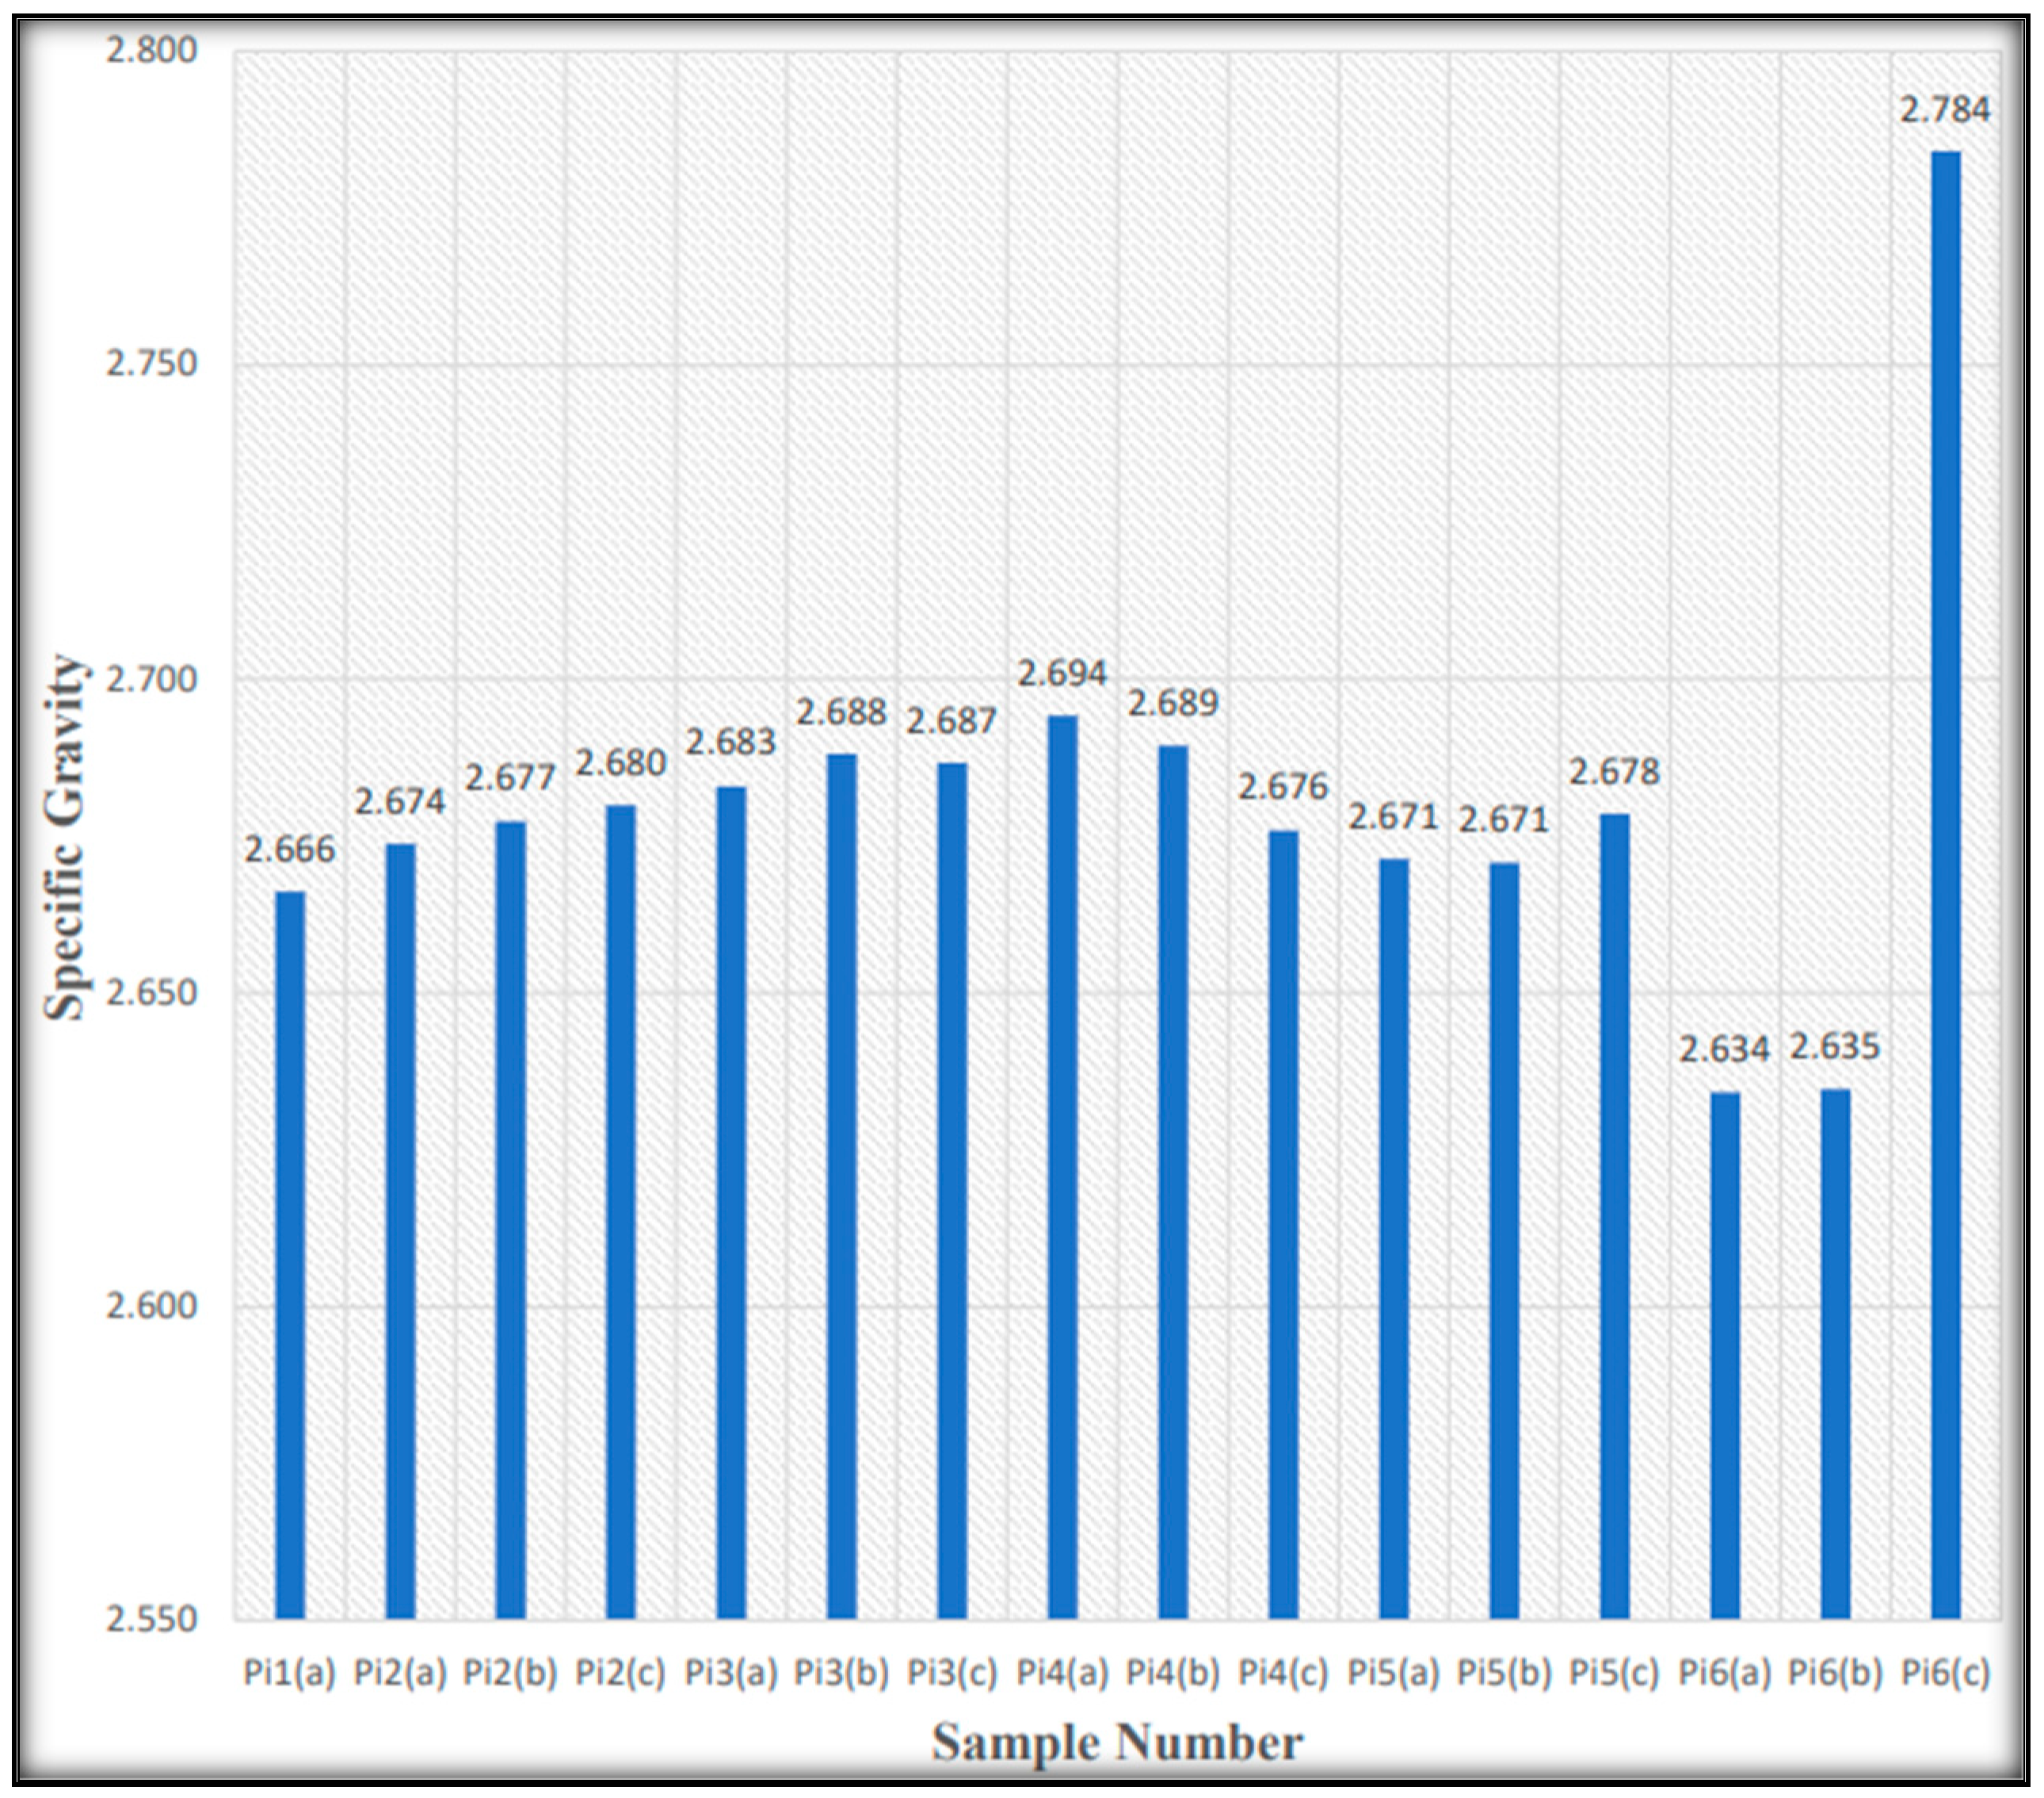
Specific gravity is the ratio of the density of a material (mass per unit volume) to the density of water, indicating its relative density compared to water. Compressive softening tests on various engineering materials have shown that the origin of rock samples influences the degree of softening experienced when submerged in water. Over time, these rocks swell gradually, resulting in a loss of both strength and density [19]. For rocks to be considered suitable as building materials for large structures, their specific gravity typically needs to be greater than 2.55. The specific gravity values of the tested samples are presented in Table 4 and Figure 12.
From Table 4 and Figure 12, it is evident that the specific gravity values of the samples range between 2.81 and 2.86, suggesting that they are well suited for intensive construction tasks. The specific gravity of rock samples is calculated using two key measurements: the weight of the specimen in water and its weight after drying in the oven. These measurements were used to determine the specific gravity using Formula (4). Additionally, the specific gravity values of the Inzari Formation rocks, which range from 2.81 to 2.86, are comparable to those of the NikanaiGhar limestones, which were reported to have values between 2.71 and 2.81, further supporting the suitability of Inzari Formation rocks for construction purposes.
Specific   gravity = w 3 w 2 w 3 × 100

4.1.5. Schmidt Hammer Test

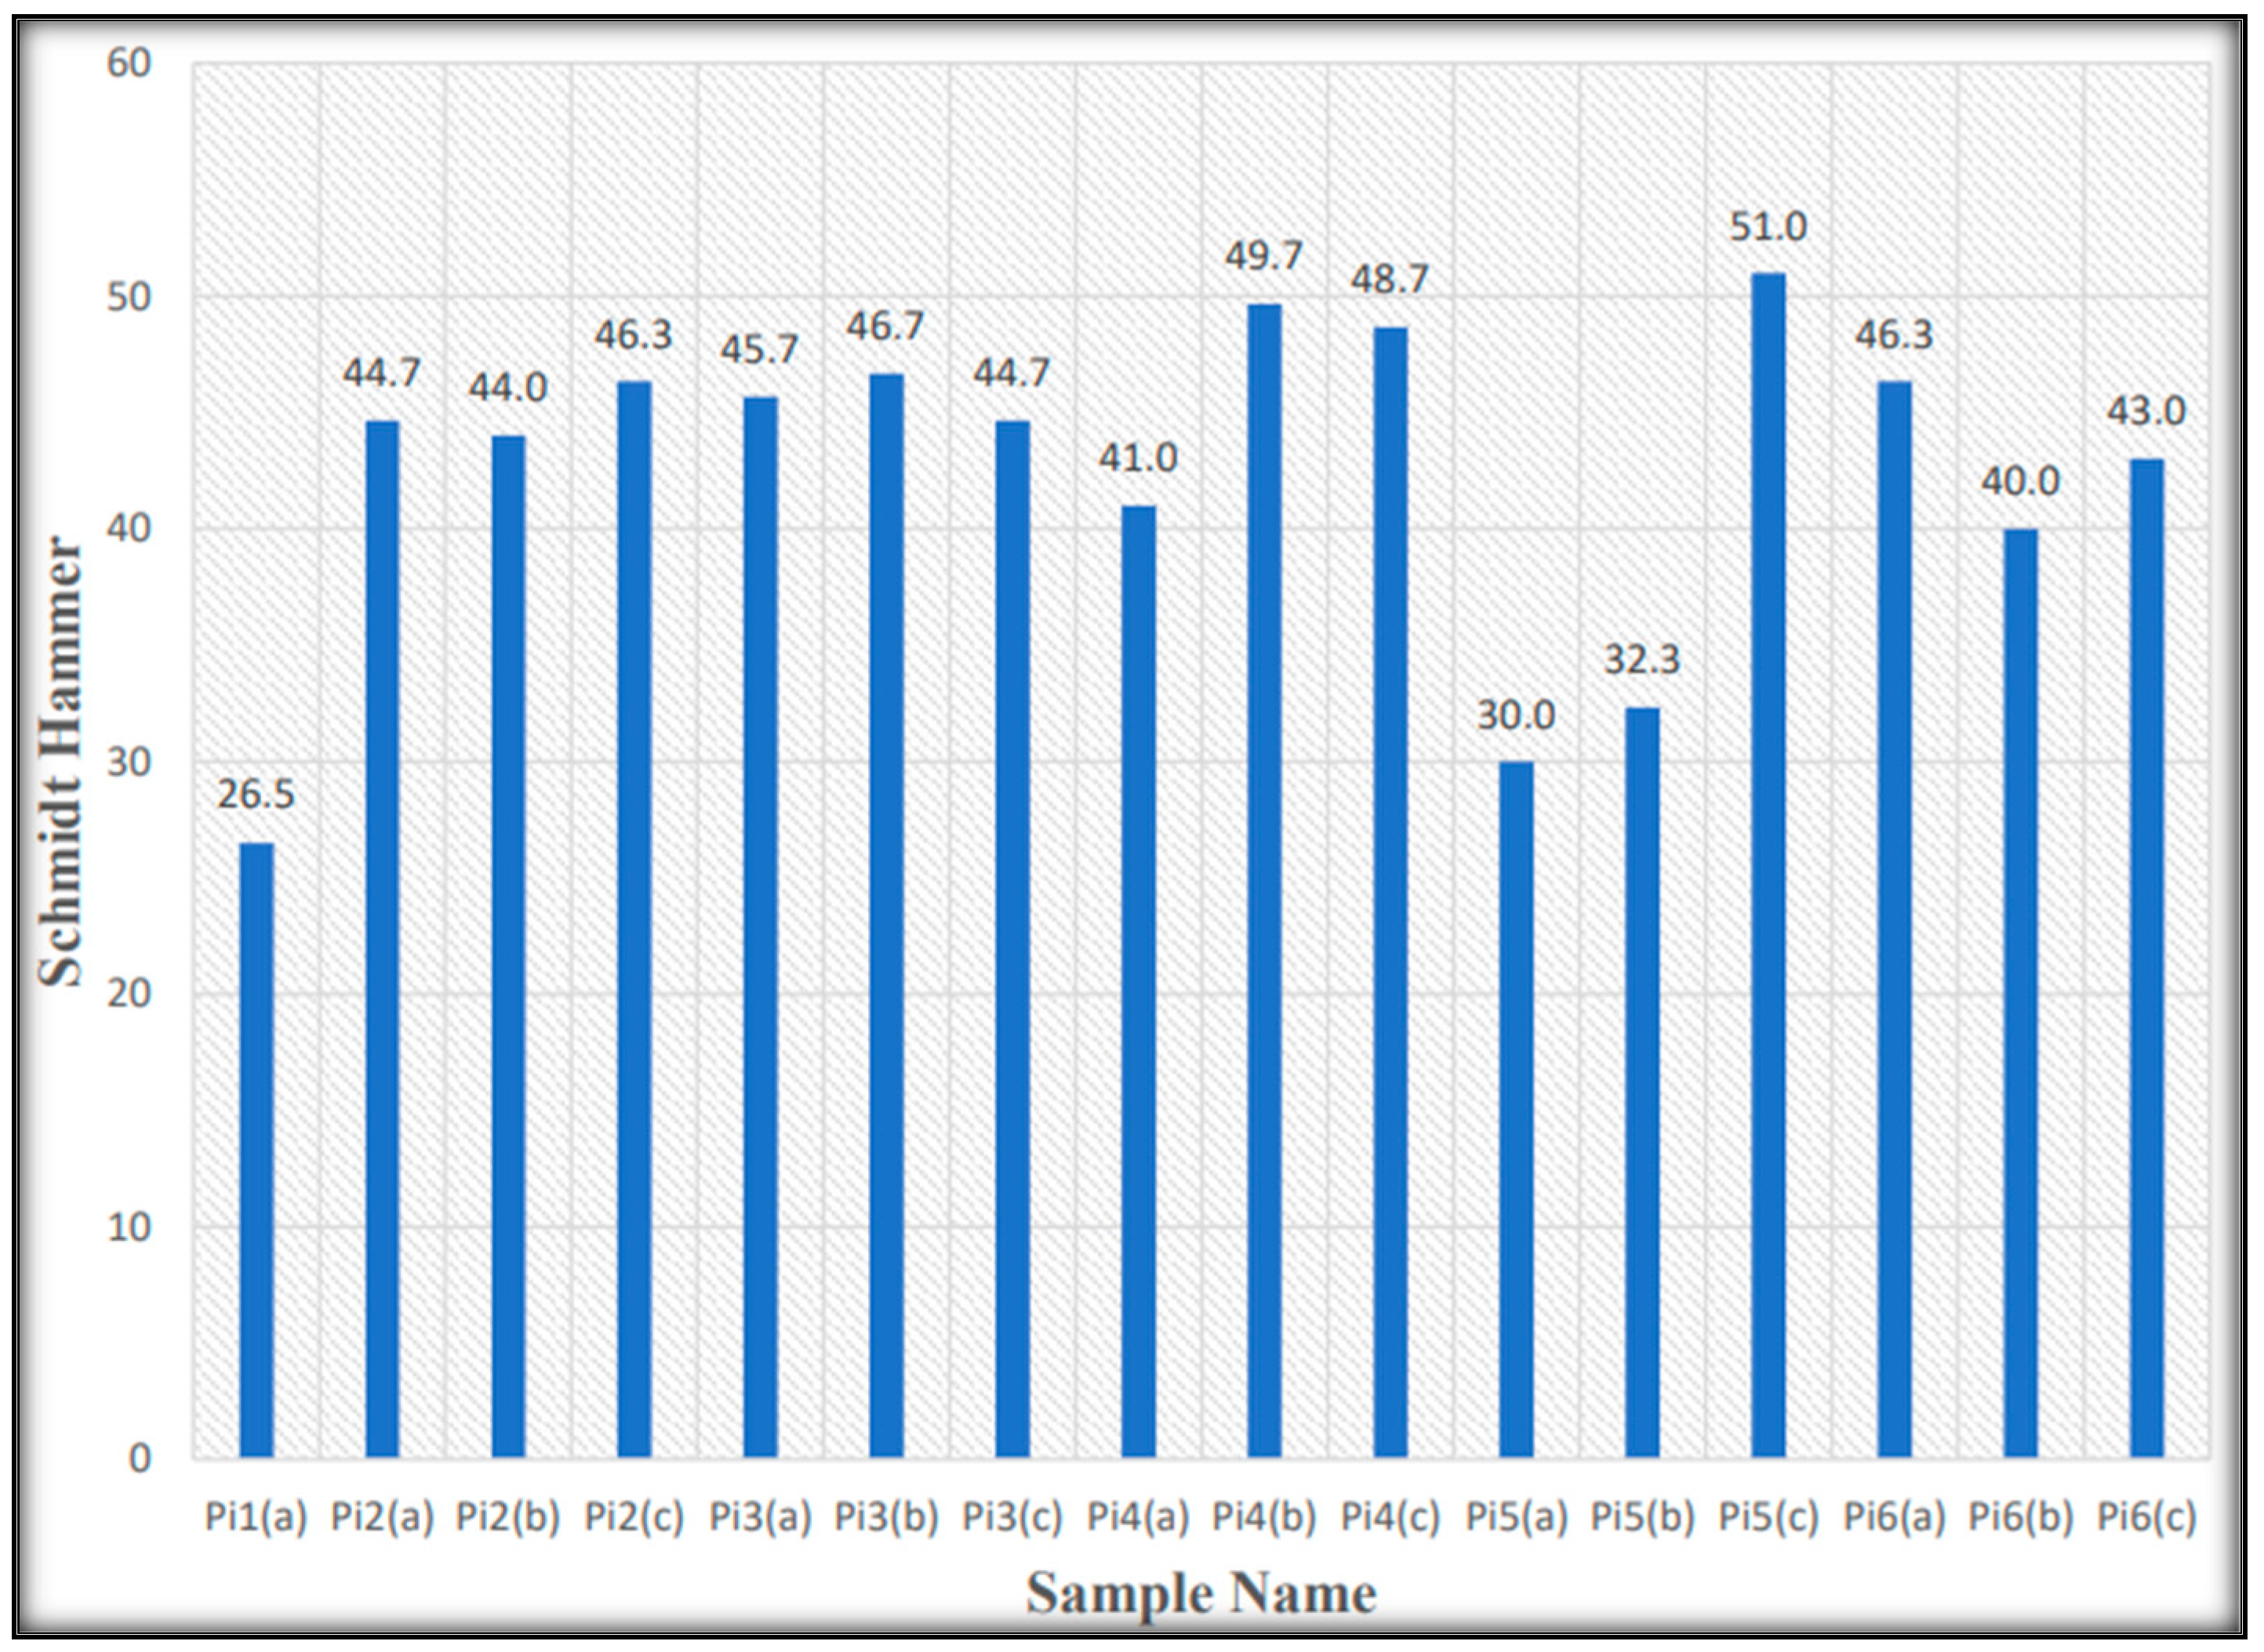
The Schmidt hammer test is an established technique to determine the mechanical characteristics of rock material because it offers a rapid, inexpensive, and accurate way to quantify the material hardness. The “Schmidt Hammer Rebound Index” test was designed for testing concrete. It is also used to measure the strength of rock. This inexpensive, non-destructive test additionally offers information about the compressive properties of rock material [20]. The test value is recorded after the Schmidt hammer is released by springing against the rock surface. The range of the average value is 26.5 to 51.0 MPa, shown in Table 5 and Figure 13.

4.1.6. Shear Strength

The maximum resistance that rock can provide against deformation when it is continuously sheared owing to shearing action is known as its shear. Torsion testing in a laboratory setting is usually used to evaluate the shear strength of rock specimens. Torsion tests are now a commonly used technique to determine the shear strength of rock samples in labs. For a particular rock, the unconfined tensile strength (UTS) reading was recorded along the negative x-axis, and the uniaxial compressive stress (UCS) reading was recorded along the positive x-axis according to the scale. Based on the UCS and UTS data, separate Mohr circles were created, and then a shared tangent was drawn between the resulting circles. The two primary factors used for calculating shear strength are cohesiveness (C) and the angle of internal friction ( φ ).

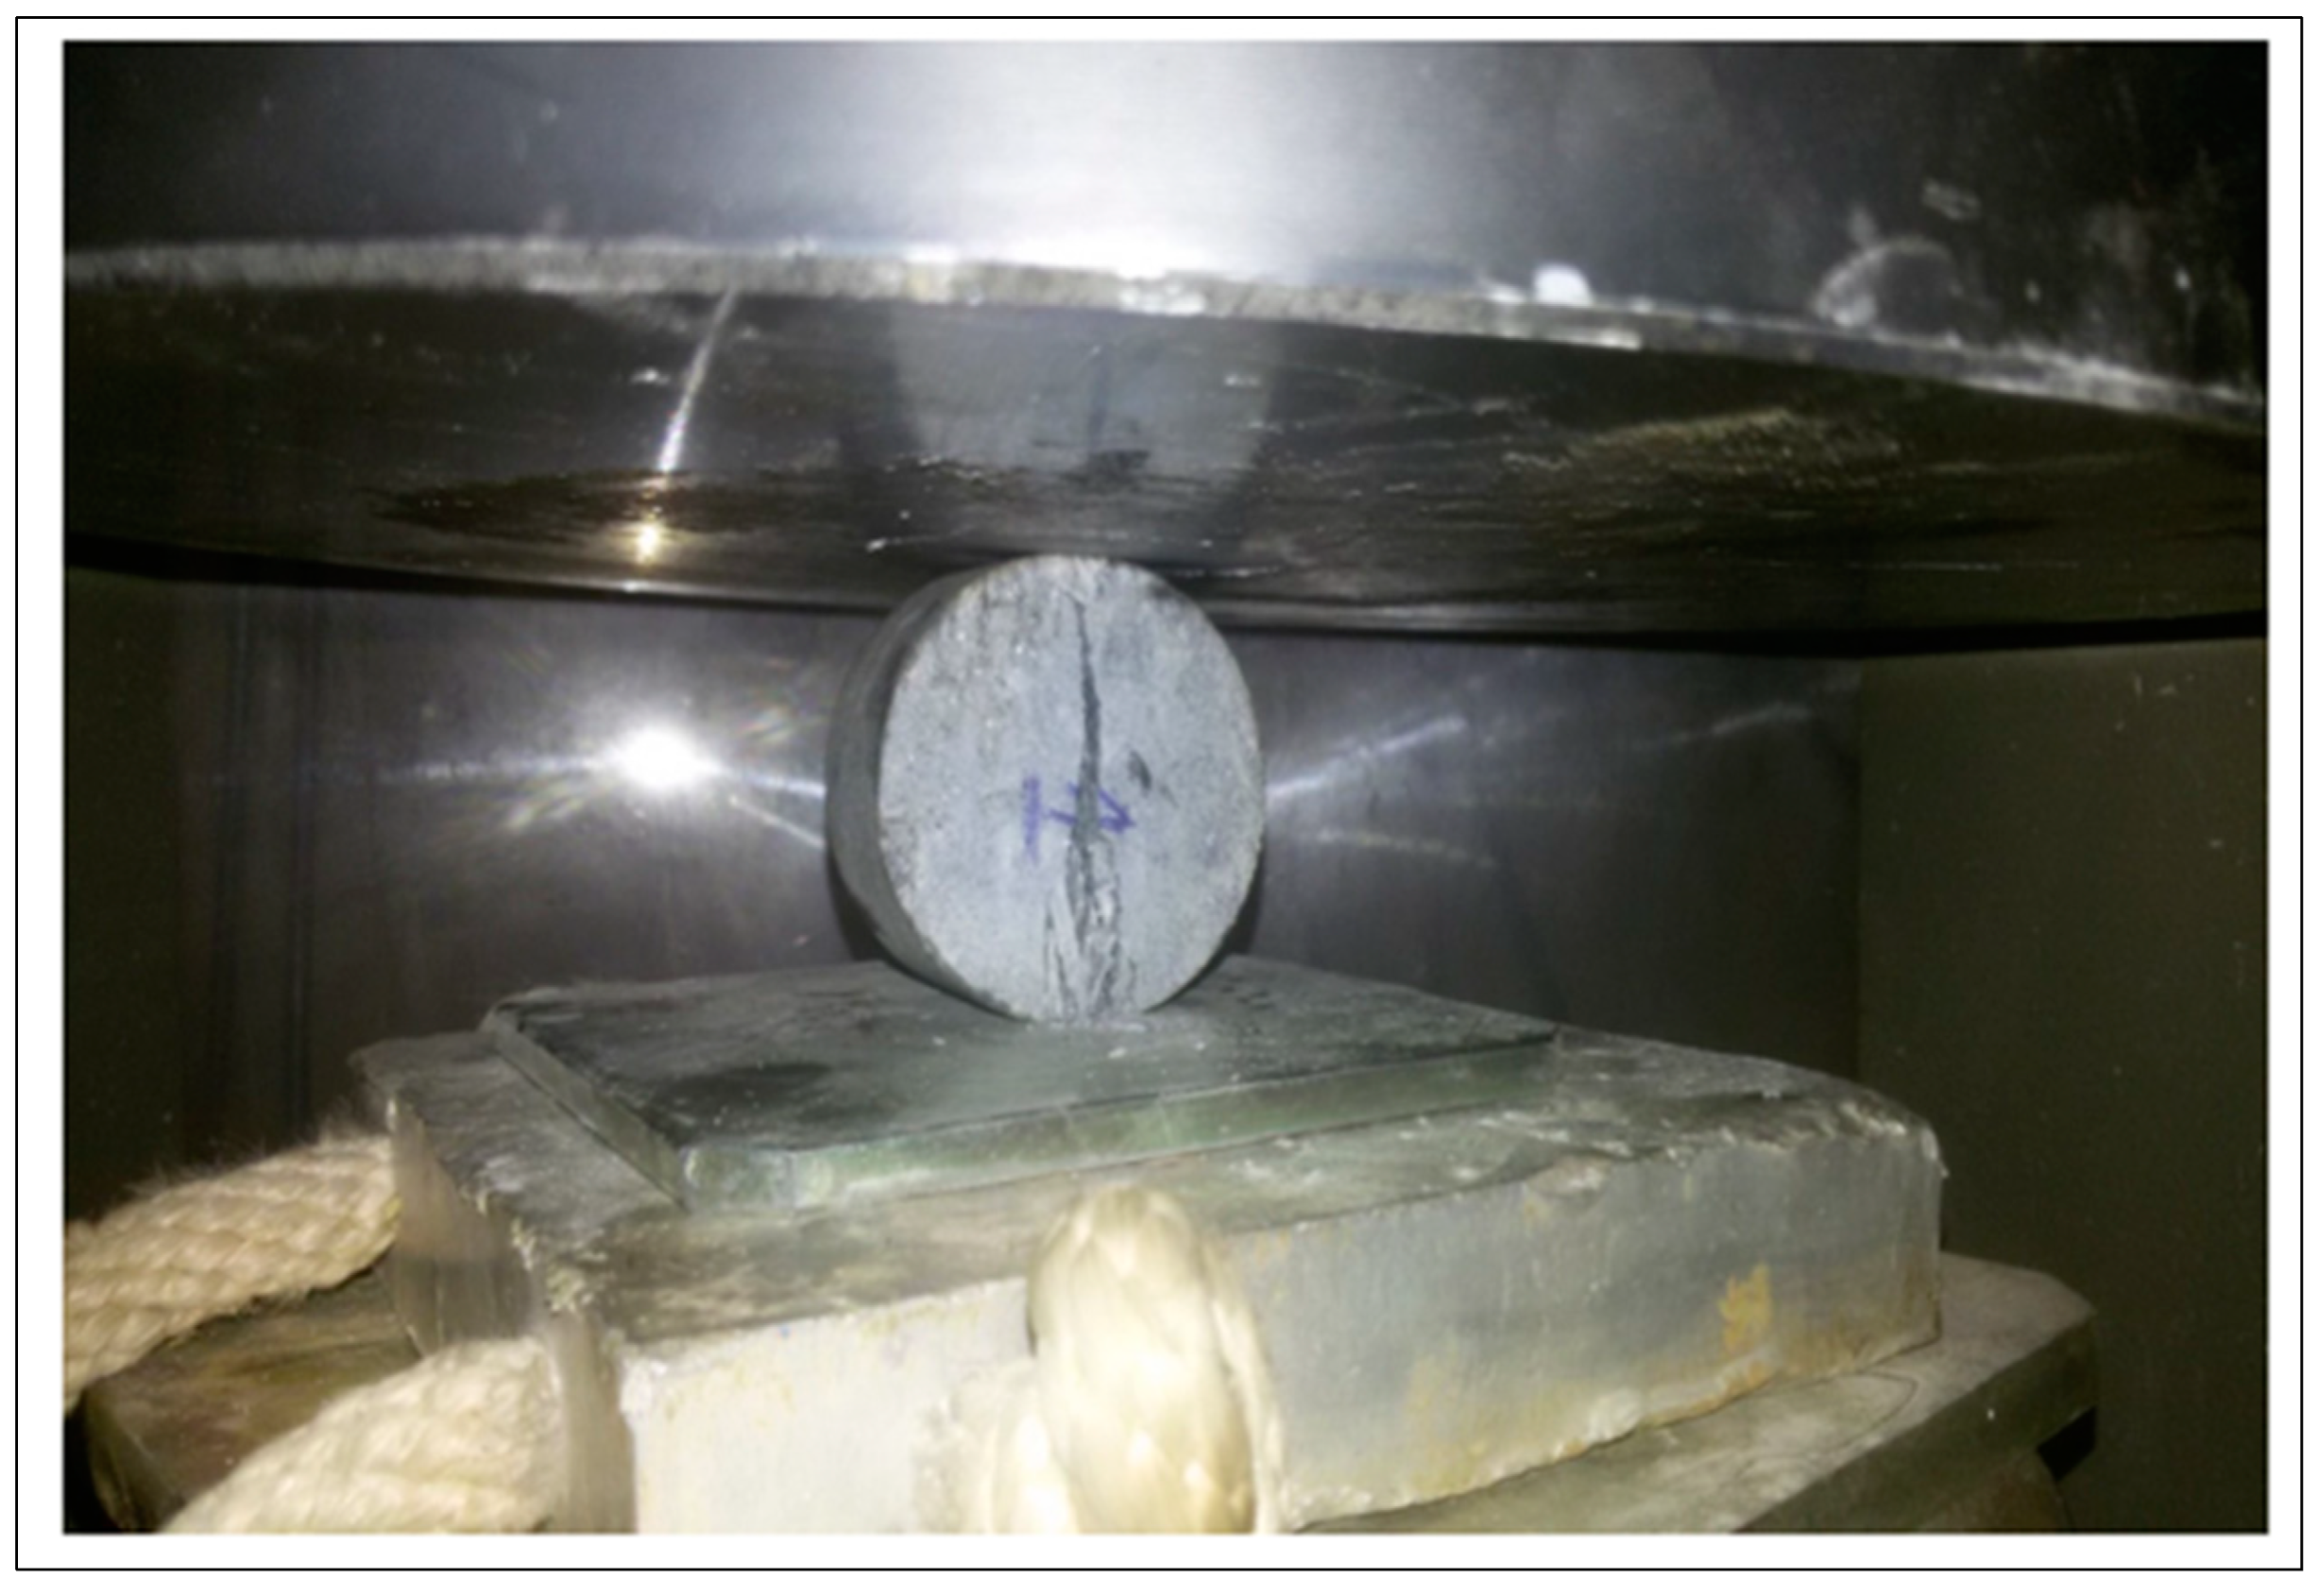
4.1.7. Unconfined Tensile Strength (UTS)

The UTS test is conducted by applying a vertical force to create tension along the diameter of a rock disc that is being compressed Figure 14. UTS can be used to evaluate the tensile strength. It is noteworthy that rocks have greater compression strength than tensile strength. The inability to grasp the specimen securely without generating bending forces has frequently made it impossible to quantify tensile strength directly. The ultimate tensile strength (UTS) is calculated by Formula (5).
UST = 2 P π D T
where
  • P = load (kN).
  • D = the rock core’s diameter.
  • T = the rock core’s diameter (m).

4.2. Relationship between the Inzari Formation’s Mechanical and Physical Characteristics

To investigate any potential relationships between the various samples of the Inzari Formation, their mechanical and physical characteristics were displayed against one another. A significant reduction in the strength of rocks occurs when their void capacity increases. A notable mechanical effect can result from a slight change in the volume of pores [21]. From (Figure 15, Figure 16 and Figure 17), and Table 6, we noted that it is typical and predicted for there to be a decrease in porosity and the quantity of water absorbed as the compressive strength rises and an increase in Schmidt hammer as the compressive strength rises.

4.3. Petrographic Analysis of the Inzari Formation

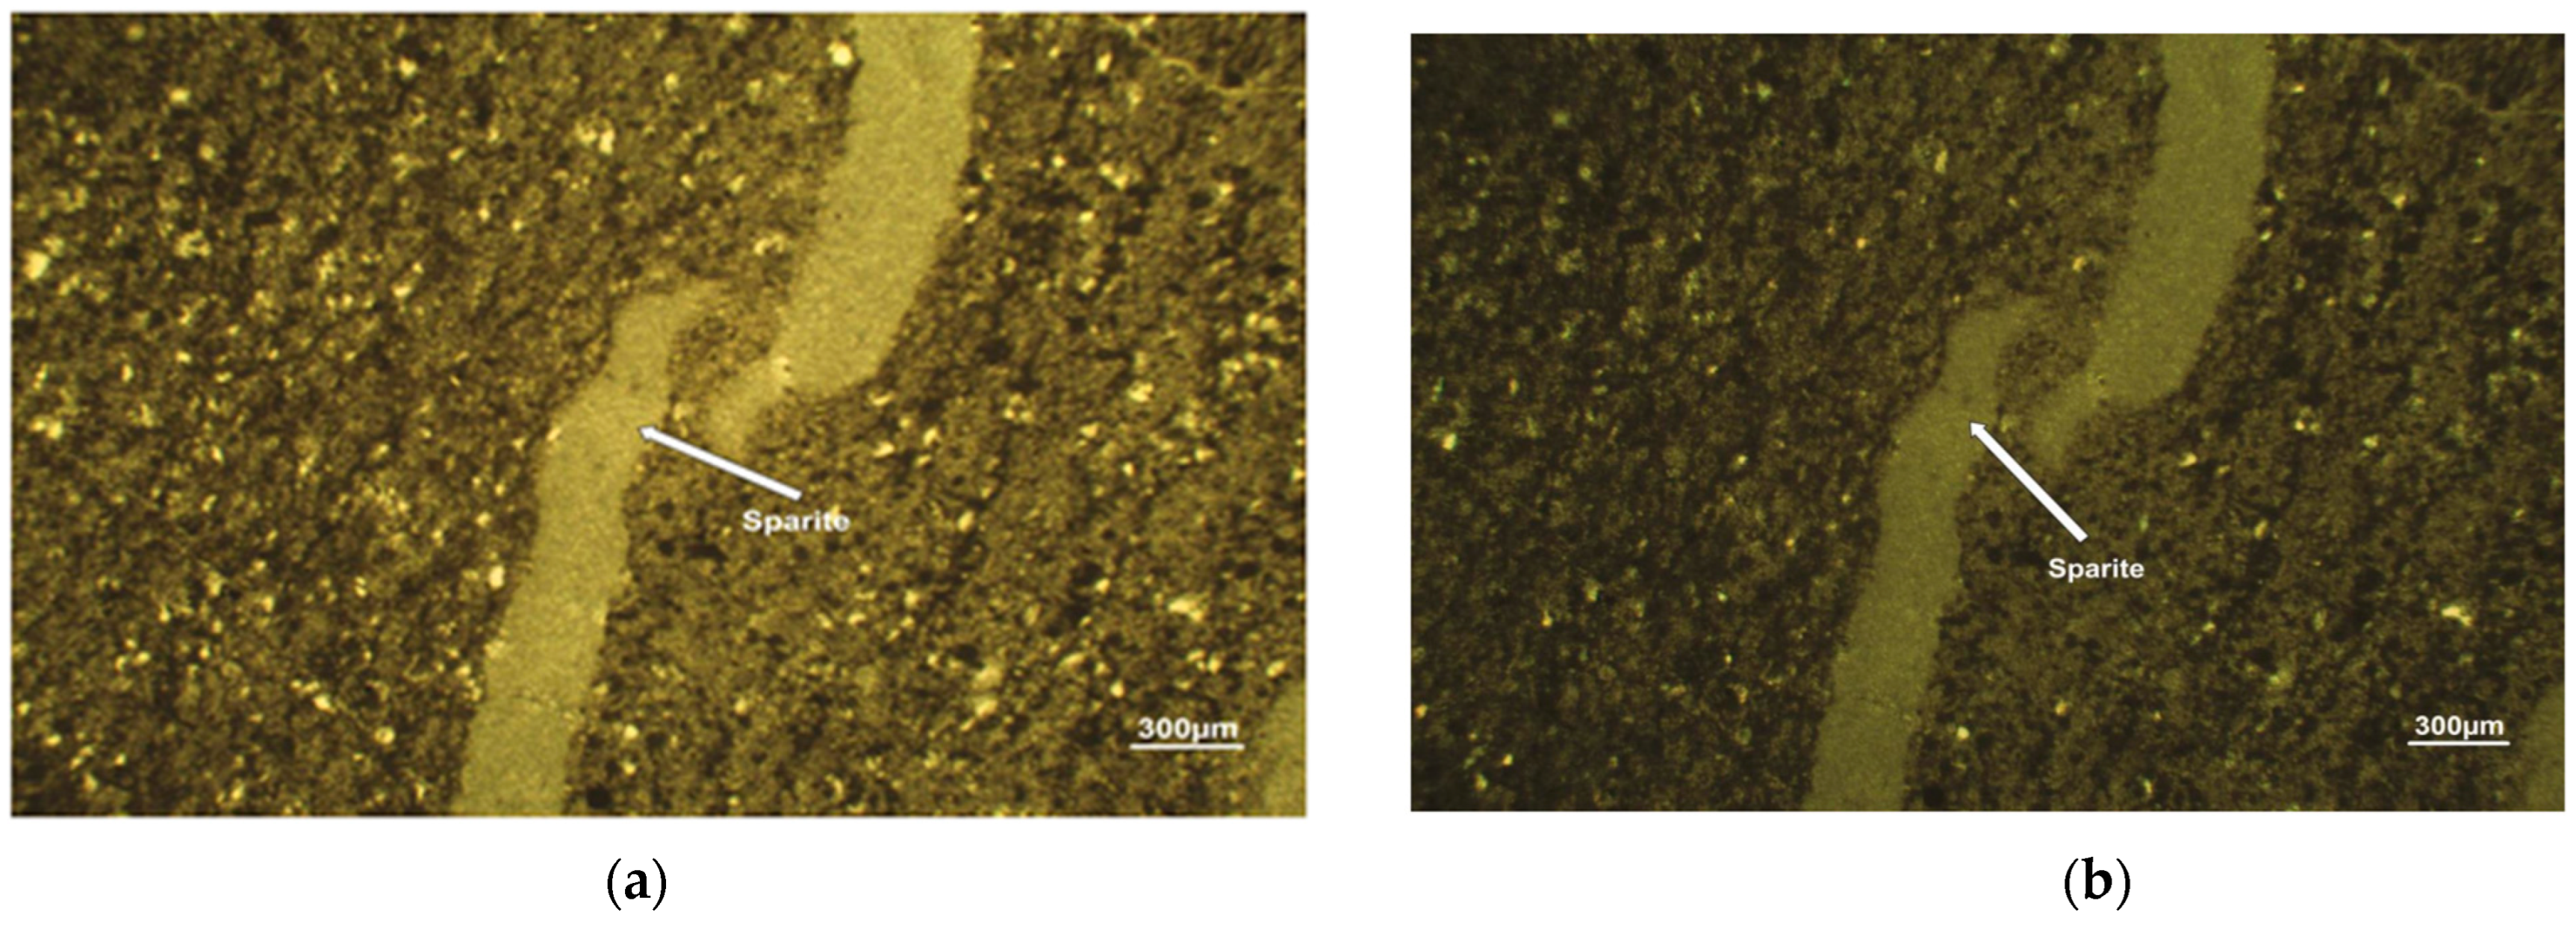
The systematic description and classification of rocks by microscopic analysis is known as petrography [22]. Under a polarized microscope, the petrographic laboratory investigated the petrographic characteristics of the rocks belonging to the Inzari Formation. Based on the gathered petrographic data, rocks are classified. In specimens, the rocks of the Inzari Formation range in hue from pale gray to dark gray. Alizarin red stain solution was used to color each thin segment [7]. Calcite gave off a pale pink to crimson color during the staining test; however, dolomite did not show any staining.
The classification of limestone is determined based on the framework of depositional, biological, and diagenetic factors, shown in Figure 18.
According to the staining data, the majority of the studied rocks are made of calcite. In accordance with Dunham’s classification, the dolomite samples were categorized [23]. For carbonate minerals, the Dunham’s classification is based on the following three textural features:
(i)
Binding during deposition, a feature that sets bound stone apart from fine-grained carbonate rocks;
(ii)
The characteristic that sets grain stone apart from muddy carbonates: the presence of sparry calcite cement in fine-grained carbonate minerals;
(iii)
Grains are abundant in muddy carbonates, allowing for their division into mudstone, wacke stone, and pack stone. After the rock thin sections were analyzed for the petrographic description, these rock specimens were classified as “a siliciclastic mudstone” based on their texture, calcite cement (diabase), and mud matrix (micrite) [10]. The mineralogical composition of the studied samples is shown in Table 7.

4.3.1. Fractures

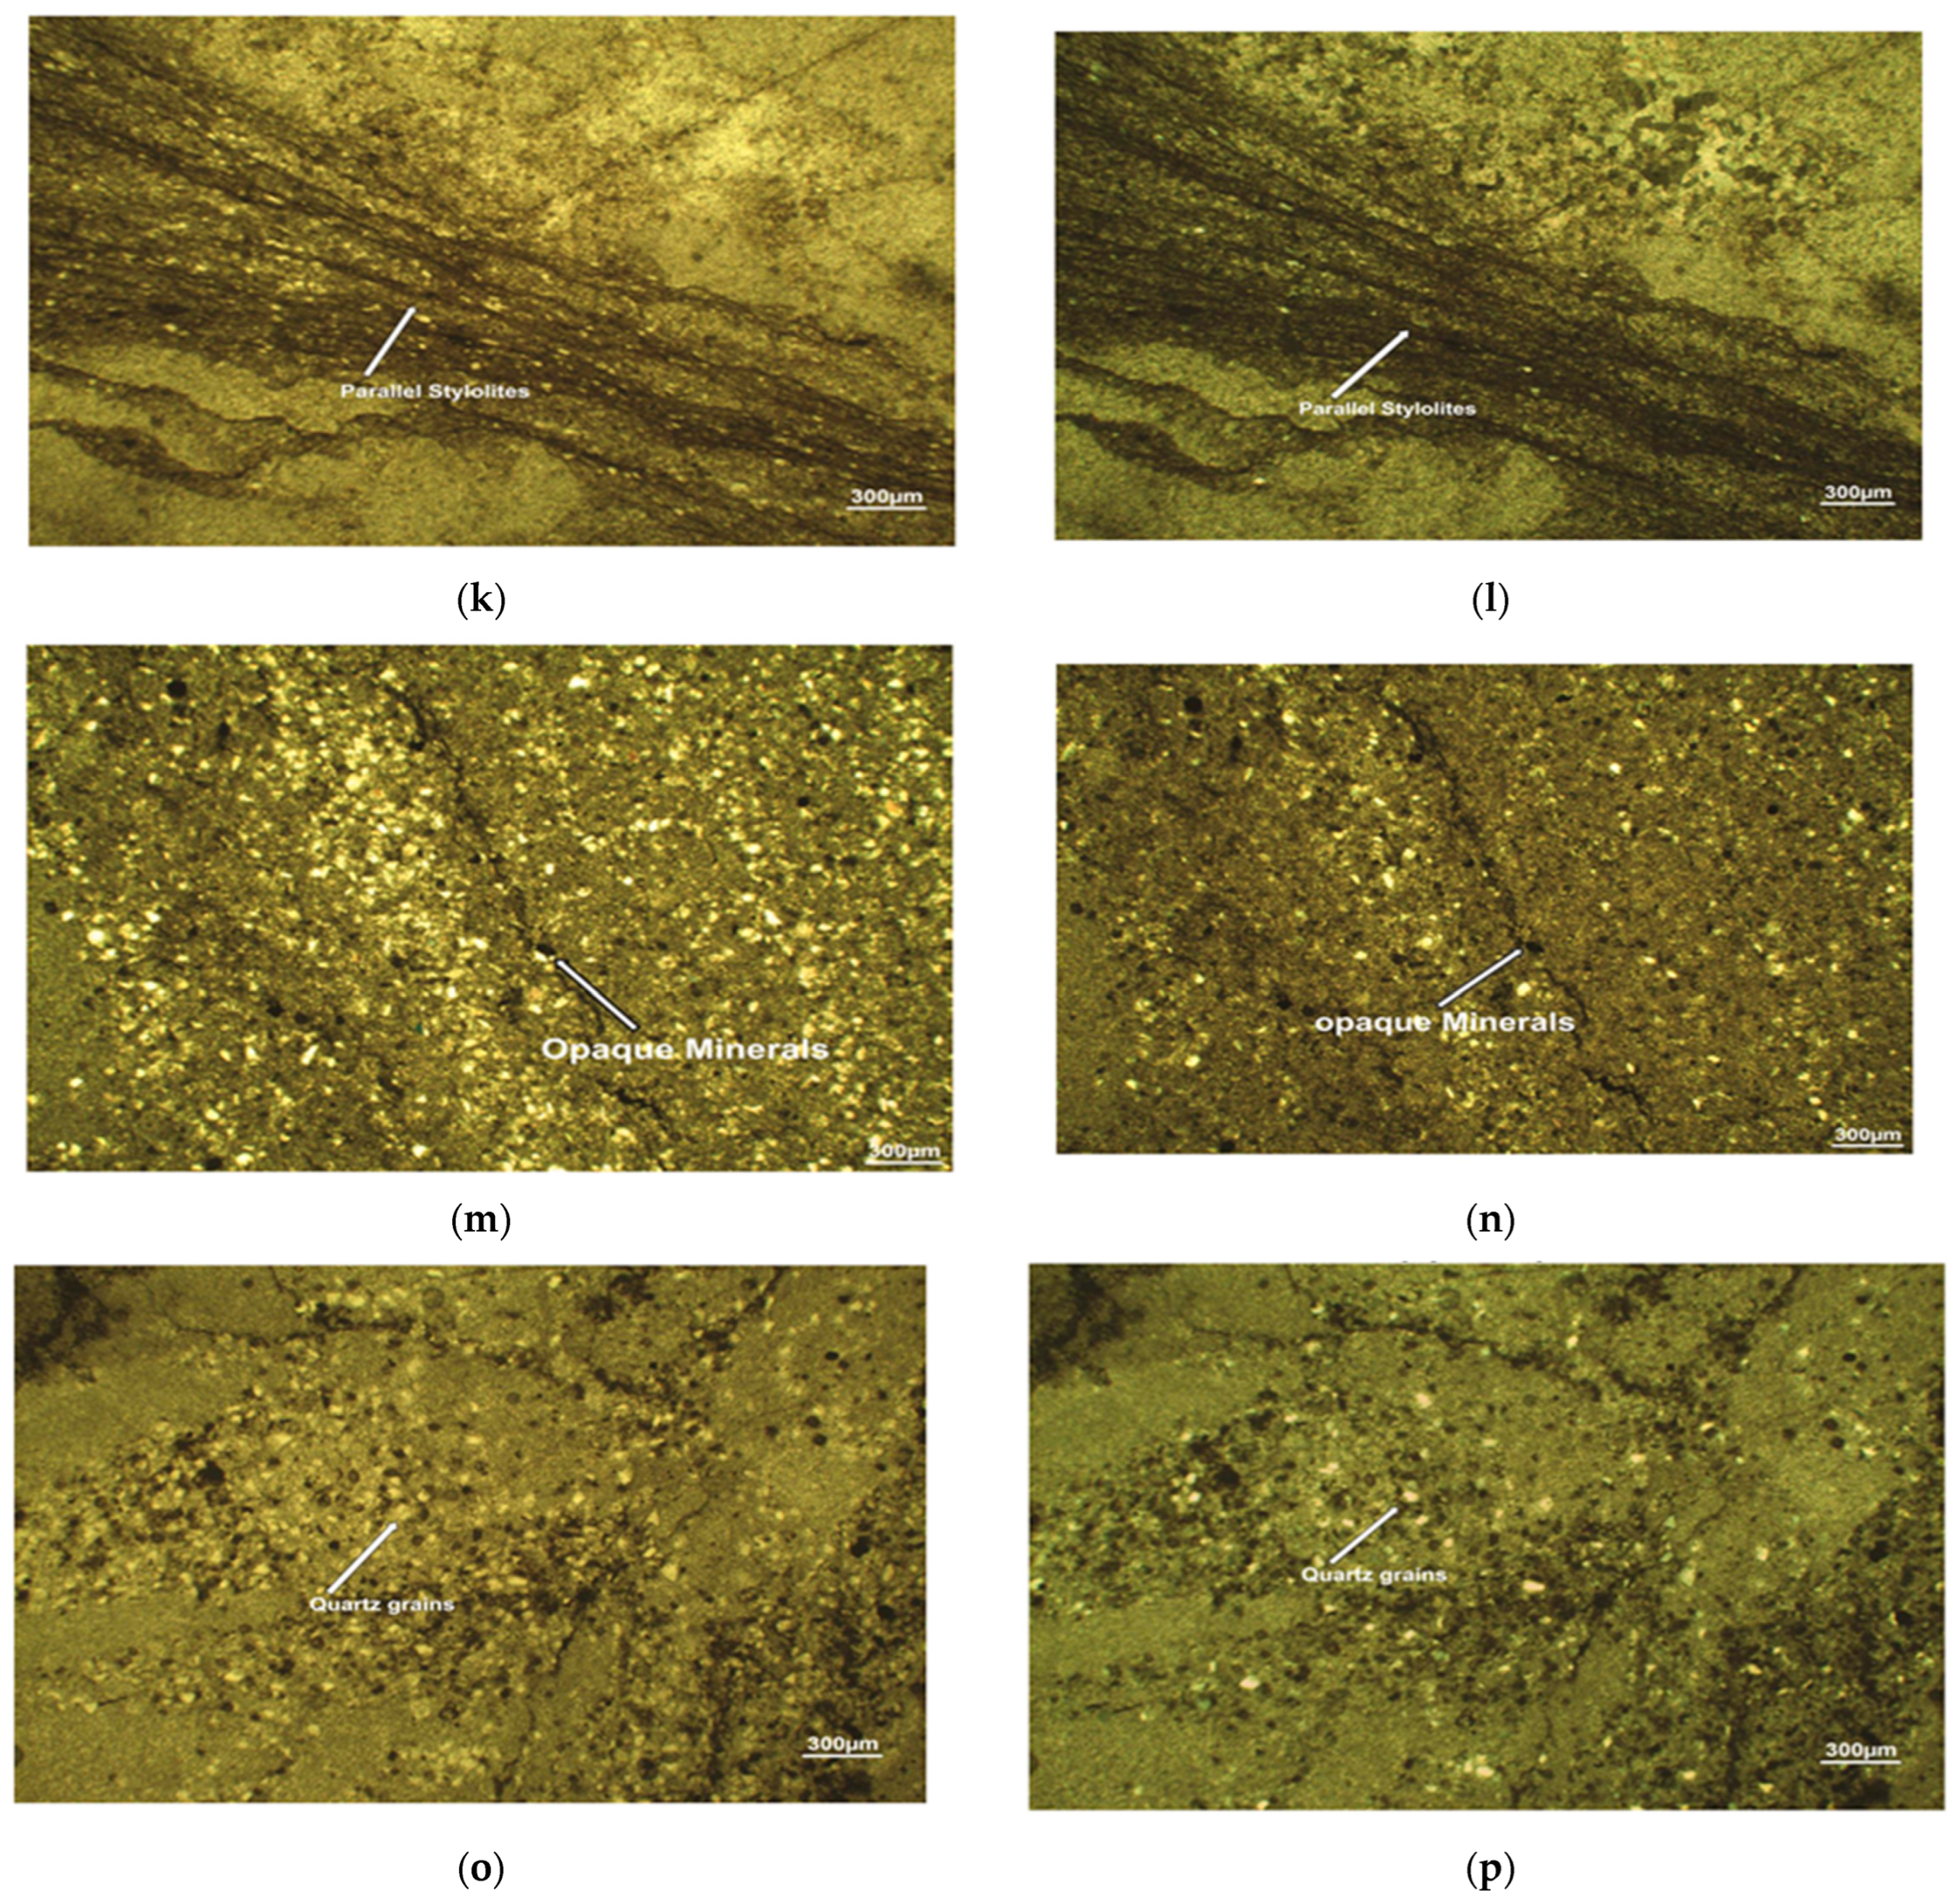
Almost every thin section had visible microfractures and bigger fractures. And smaller amounts of big fractures are also visible in some thin sections in Figure 19. The majority of these fractures run parallel to one another, but at certain points, they cross, forming a pattern of crisscross fractures [24]. They are nearly entirely composed of common minerals like silver and quartz. While some fractures contain quartz and spar, others mostly contain calcite cement. Some opaque minerals fill in some fissures.

4.3.2. Porosity

The porosity of the limestone samples in this study is significantly low, with a value of less than one (porosity < 1), as detailed in Table 2. Pores in rock samples generally appear along fractures, which is known as fracture porosity. Pores are colorless in plane-polarized light (PPL) and give a dark black color in cross-polarized light (XPL) in Figure 19i,j.

4.3.3. Microstylolites

One kind of secondary (chemical) sedimentary structure is the microstylolite; these were also found in these rocks [25]. They are irregular suture-like connections that are created when pressure dissolves rocks in deep burial settings. They have concentrations of insoluble components and look like narrow, jagged, and tooth-like seams. The direction of the maximal primary stress is perpendicular to the stylolite. The stylolites in the studied thin sections are of an irregular form (plate) and are parallel to one another, known as a parallel set of stylolites (see Figure 19k,i), and they occasionally cross over one another, known as an irregular anatomizing set of stylolites.

4.3.4. Classification of the Studied Rocks

According to petrographic analyses, most of the rocks in the Inzari Formation are fine-grained. Dunham’s classification places the investigated rocks in the category of “siliciclastic mudstone”. We use an alizarin red stain solution to furtherly distinguish the studied rocks. Based on this identification result, these rocks are classified as mudstone because they contain a significant amount of mica minerals.
The occurrence of fractures and their orientations, the presence of microstylolites, the cementation along the fractures, and the modal mineralogical composition of the rocks are mostly responsible for these differences in the strength values. However, because calcite and quartz mineral grains commonly fill these cracks, their strength values often are within an appropriate range for building.
In the case of thin and closed stylolites, a strength decrease is anticipated [26]. The destabilizing effect of stylolites should be considered in geotechnical applications, especially in carbonate rocks where they are abundant. This is because water can permeate the rock and dissolve part of the stylolites’ components, which makes them expand.

5. Conclusions

The petrographic and geomechanical analysis of the Inzari Formation in the Nizampur Basin demonstrated that these rocks possess favorable characteristics for construction purposes. The unconfined compressive strength (UCS) values of the Inzari Formation samples fall within the range of 23 to 94 MPa, which indicates that these rocks are suitable for use in load-bearing structures. This finding is consistent with similar studies on the NikanaiGhar limestone, where UCS values averaged 93.348 MPa, further supporting the potential of these formations for use as building materials. The porosity of the Inzari Formation rocks, ranging between 0.27% and 1.32%, is also comparable to the NikanaiGhar limestone study, which reported porosity values of 0.31% to 0.41%. These low porosity values suggest that the Inzari Formation rocks have a high density and durability, making them suitable for construction in environments where long-term strength and stability are required. Additionally, the specific gravity of the Inzari Formation rocks, ranging from 2.81 to 2.86, aligns with the findings from similar formations, where specific gravity values generally range from 2.71 to 2.81. The higher specific gravity of the Inzari rocks indicates their robustness, further reinforcing their suitability for large-scale construction projects. In comparison to other studies, such as those conducted on the NikanaiGhar limestone and other similar formations, the Inzari Formation exhibits comparable or superior geomechanical properties. These similarities strengthen the argument that the Inzari Formation is a reliable source of construction material, particularly for projects requiring high durability and compressive strength.
In conclusion, the results of this study affirm that the Inzari Formation rocks have significant potential as a construction material, with properties that are on par with other well-documented formations in the region. Future studies may focus on further testing under different environmental conditions to explore the full range of their practical applications in the construction industry.

Author Contributions

Conceptualization, H.A. and J.X.; validation, M.U.A.; formal analysis, H.A. and M.U.A.; investigation, S.A.; investigation, M.U.A.; writing—original draft preparation, H.A. and J.X.; writing—review and editing, J.X.; supervision, J.X.; All authors have read and agreed to the published version of the manuscript.

Funding

The research work in this paper was supported by the grants from the National Natural Science Foundation of China–Yalong River Joint Fund (No. U1765110) and the Fundamental Research Funds for the Central Universities (22120180312).

Data Availability Statement

The data presented in this study are available on request from the corresponding author.

Acknowledgments

We thank Junaid Ali for his contribution to the manuscript.

Conflicts of Interest

The authors declare no conflict of interest.

References

  1. Khan, N.; Rehman, K. Petrophysical evaluation and fluid substitution modeling for reservoir depiction of Jurassic Datta Formation in the Chanda oil field, Khyber Pakhtunkhwa, northwest Pakistan. J. Pet. Explor. Prod. Technol. 2019, 9, 159–176. [Google Scholar] [CrossRef]
  2. Amuda, A.; Uche, O.; Amuda, A. Physicomechanical Characterization of Basement Rocks for Construction Aggregate: A Case Study of Kajuru Area, Kaduna, Nigeria. IOSR J. Mech. Civ. Eng. 2014, 11, 46–51. [Google Scholar] [CrossRef]
  3. Wang, J.; Jung, W.; Li, Y.; Ghassemi, A. Eomechanical characterization of Newberry Tuf. Geothermics 2016, 63, 74–96. [Google Scholar] [CrossRef]
  4. Ghobadi, M.; Babazadeh, R. Experimental Studies on the Effects of Cyclic Freezing–Thawing, Salt Crystallization, and Thermal Shock on the Physical and Mechanical Characteristics of Selected Sandstones. Rock Mech. Rock Eng. 2015, 48, 1001–1016. [Google Scholar] [CrossRef]
  5. Tomassi, A.; Trippetta, F.; de Franco, R.; Ruggieri, R. How petrophysical properties influence the seismic signature of carbonate fault damage zone: Insights from forward-seismic modelling. J. Struct. Geol. 2023, 167, 104802. [Google Scholar] [CrossRef]
  6. Aksoy, C.; Ozacar, V.; Demirel, N.; Ozer, S.; Safak, S. Determination of instantaneous breaking rate by Geological Strength Index, Block Punch Index and power of impact hammer for various rock mass conditions. Tunn. Undergr. Space Technol. 2011, 26, 534–540. [Google Scholar] [CrossRef]
  7. Ademila, O. Engineering geological evaluation of some rocks from Akure, Southwestern Nigeria as aggregates for concrete and pavement construction, Geology. Geophys. Environ. 2019, 45, 31. [Google Scholar]
  8. Přikryl, R. Assessment of rock geomechanical quality by quantitative rock fabric coefficients: Limitations and possible source of misinterpretations. Eng. Geol. 2006, 87, 149–162. [Google Scholar] [CrossRef]
  9. Aligholi, S.; Lashkaripour, G.R.; Ghafoori, M. Estimating engineering properties of igneous rocks using semi-automatic petrographic analysis. Bull. Eng. Geol. Environ. 2018, 78, 2299–2314. [Google Scholar] [CrossRef]
  10. Shah, S.A.; Qadir, A. Fracture Analysis of Rocks for Slope Stability Assessment in SiriKot Area, District Haripur, Khyber Pakhtunkhwa, Pakistan. Int. J. Econ. Environ. Geol. 2020, 11, 53–56. [Google Scholar]
  11. Tenze, D.; Braitenberg, C.; Sincich, E.; Mariani, P. Detecting the Elevated Crust to Mantle Section in the Kohistan-Ladakh Arc, Himalaya, from GOCE Observations. GOCE Obs. 2014, 141, 299–307. [Google Scholar]
  12. Yeats, R.S.; Hussain, A. Timing of structural events in the Himalayan foothills of northwestern Pakistan. Geol. Soc. Am. Bull. 1987, 99, 161–176. [Google Scholar] [CrossRef]
  13. Fahad, M.; Iqbal, Y.; Riaz, M.; Ubic, R.; Redfern, S.A. Metamorphic temperature investigation of coexisting calcite and dolomit e marble––examples from Nikani Ghar marble and Nowshera Formation. J. Earth Sci. 2016, 27, 989–997. [Google Scholar] [CrossRef]
  14. Iqbal, J.; Ullah, I.; Razzaq, A.M.; Ghaffar, A.; Murad, F.; Ahmed, J. Petrographic and sem-edx characterization of mafic-felsic plutonic rock of washapikaur west Raskoh Arc, Pakistan. J. Mt. Area Res. 2022, 7, 23–36. [Google Scholar] [CrossRef]
  15. Anjum, M.N.; Shah, M.T.; Ali, F.; Hussain, E.; Ali, L. Geochemical studies of fluoride in drinking water of Union Council Ganderi, district Nowshera, Khyber Pakhtunkhwa, Pakistan. World Appl. Sci. J. 2013, 27, 632–636. [Google Scholar]
  16. Nisar, U.B.; Ehsan, S.A.; Farooq, M.; Pant, R.R.; Khan, N.G.; Qaiser, F.U.R.; Butt, F.M. Integrated Geoelectrical and Geological Investigation of a Quaternary Paleo-Depositional Environment in the Haripur Basin, Northern Pakistan. Implications for Groundwater System. Geofluids 2023, 2023, 1057457. [Google Scholar] [CrossRef]
  17. Bubeck, A.; Walker, R.; Healy, D.; Dobbs, M.; Holwell, D. Pore geometry as a control on rock strength. Earth Planet. Sci. Lett. 2017, 457, 38–48. [Google Scholar] [CrossRef]
  18. Wang, J.; Vandevyvere, B.; Vanhessche, S.; Schoon, J.; Boon, N.; Belie, N. Microbial carbonate precipitation for the improvement of quality of recycled aggregates. J. Clean. Prod. 2017, 156, 355–366. [Google Scholar] [CrossRef]
  19. Malham, I.; Bureau, L. Density effects on collapse, compression, and adhesion of thermoresponsive polymer brushes. Langmuir. ACS J. Surf. Colloids 2009, 26, 4762–4768. [Google Scholar] [CrossRef]
  20. Son, M.; Kim, M. Estimation of the Compressive Strength of Intact Rock Using Non-Destructive Testing Method Based on Total Sound-Signal Energy. Geotech. Test. J. 2017, 40, 643–657. [Google Scholar] [CrossRef]
  21. Fereidooni, D.; Khajevand, R. Determining the Geotechnical Characteristics of Some Sedimentary Rocks from Iran with an Emphasis on the Correlations between Physical, Index, and Mechanical Properties. Geotech. Test. J. 2018, 41, 555–573. [Google Scholar] [CrossRef]
  22. Li, Z.; Zhang, X.; Wei, Y.; Ali, M. Experimental Study of Electric Potential Response Characteristics of Different Lithological Samples Subject to Uniaxial Loading. Rock Mech. Rock Eng. 2020, 54, 397–408. [Google Scholar] [CrossRef]
  23. Wright, V. A revised classification of limestones. Sediment. Geol. 1992, 76, 177–185. [Google Scholar] [CrossRef]
  24. Gomez, L.A.; Laubach, S.E. Rapid digital quantification of microfracture populations. J. Struct. Geol. 2006, 28, 408–420. [Google Scholar] [CrossRef]
  25. Stockdale, P. Stylolites, primary or secondary? J. Sediment. Res. 1943, 13, 3–12. [Google Scholar]
  26. Afolagboye, L.; Talabi, A.; Akinola, O. Evaluation of selected basement complex rocks from Ado-Ekiti, SW Nigeria, as source of road construction aggregates. Bull. Eng. Geol. Environ. 2016, 75, 853–865. [Google Scholar] [CrossRef]
Figure 1. Location map of the study area within Pakistan. This map highlights District Nowshera in the Khyber Pakhtunkhwa region, where the Inzari Formation is situated. The map also shows major landmarks and geographical features surrounding the study site, providing context for the geotechnical investigation conducted in this region.
Applsci 14 09395 g001
Figure 2. Geological features observed in the study area. A close-up view of exposed rock outcrops in the Inzari Formation. Natural faults visible in the formation. A Stratification observed in the rock layers. These geological features are critical for understanding the structural composition and the potential behavior of rocks under mechanical testing.
Applsci 14 09395 g002
Figure 4. Flowchart illustrating the research methodology. This chart outlines the step-by-step process followed in this study, starting from the collection of rock samples in the field to the laboratory testing and data analysis stages, ensuring a systematic approach to evaluating the petrographic and geomechanical properties of the Inzari Formation.
Applsci 14 09395 g004
Figure 5. Petrographic analysis of the Inzari Formation rocks. The images show thin-section photomicrographs of the rock samples under polarized light, highlighting the mineral composition, grain structure, and textural characteristics. These petrographic observations provide insights into the mineralogical makeup of the rock, which impacts its mechanical behavior.
Applsci 14 09395 g005
Figure 6. Sample preparation for laboratory testing. (a) Representative rock samples being prepared for the unconfined compressive strength (UCS) test. (b) Samples being cut and shaped into standardized dimensions for accurate mechanical testing. Proper sample preparation is essential for ensuring reliable and consistent test results.
Applsci 14 09395 g006
Figure 7. Flowchart of rock physical and mechanical tests.
Applsci 14 09395 g007
Figure 8. Unconfined compressive strength (UCS) test setup and results. (a) Representative 3-inch cube samples prepared for UCS testing. (b) Cube sample placed in the strength-testing machine, which applies unidirectional stress, showing the setup used to determine the UCS of the rock specimens. (c) Image of a core sample during the fracturing process, indicating the failure stage during the UCS test. These tests were conducted to assess the suitability of Inzari Formation rocks as construction materials based on their mechanical strength properties.
Applsci 14 09395 g008
Figure 9. Results of the unconfined compressive strength (UCS) tests for the Inzari Formation rock samples. This figure displays the compressive strength values for each sample tested. The results are critical in determining the suitability of the rocks for construction use, as compressive strength directly correlates with the rock’s ability to withstand loads.
Applsci 14 09395 g009
Figure 10. Porosity results for the Inzari Formation rock samples. This graph presents the range of porosity values obtained from the tested specimens. Lower porosity values indicate a denser rock, which is typically associated with higher mechanical strength, making the rocks more suitable for construction applications.
Applsci 14 09395 g010
Figure 11. Water absorption test results for the Inzari Formation rock samples. This figure shows the water absorption capacity of the samples, measured as a percentage increase in weight after submersion. The data are essential for assessing the durability of the rocks, as higher water absorption can lead to weakening over time.
Applsci 14 09395 g011
Figure 12. Specific gravity results for the Inzari Formation rock samples. The specific gravity values, which range between 2.81 and 2.86, are shown here. Higher specific gravity values indicate denser rock material, supporting the conclusion that these rocks are suitable for large-scale construction projects.
Applsci 14 09395 g012
Figure 13. Schmidt hammer test results of the studied sample.
Applsci 14 09395 g013
Figure 14. Core sample loading for the unconfined tensile strength (UTS).
Applsci 14 09395 g014
Figure 15. Relationship between UCS (Unconfined Compressive Strength) and porosity. The circles represent individual data points, indicating measured UCS values at corresponding porosity levels. The dashed line represents a trend line or linear regression line, showing the overall trend in the relationship between UCS and porosity, with UCS generally decreasing as porosity increases.
Applsci 14 09395 g015
Figure 16. Relationship between UCS (Unconfined Compressive Strength) and water absorption (%). The circles represent individual data points, showing measured UCS values at corresponding water absorption levels. The dashed line represents a trend line or linear regression line, indicating the general trend where UCS tends to decrease as water absorption increases.
Applsci 14 09395 g016
Figure 17. Relationship between UCS (Unconfined Compressive Strength) and Schmidt hammer values. The circles represent individual data points, indicating measured UCS values at corresponding Schmidt hammer readings. The dashed line represents a trend line or linear regression line, showing a positive correlation where UCS tends to increase with higher Schmidt hammer values.
Applsci 14 09395 g017
Figure 18. Classification framework of limestone.
Applsci 14 09395 g018
Figure 19. Photomicrograph showing of the studied samples. (a) Photomicrograph shoing sparite (PPL, 4×). (b) Photomicrograph showing sparite (PPL, 4×). (c) Photomicrograph showing quartz vein (PPL, 4×). (d) Photomicrograph showing quartz (XPL, 4×). (e) Photomicrograph showing calcite (PPL, 4×). (f) Photomicrograph showing calcite (XPL, 4×). (g) Photomicrograph showing parallel set of fractures (PPL, 4×). (h) Photomicrograph showing parallel set of fractures (XPL, 4×). (i) Photomicrograph showing Vigus pores (PPL, 4×). (j) Photomicrograph showing Vigus pores (XPL, 4×). (k) Photomicrograph showing a parallel set of stylolites (PPL, 4×). (l) Photomicrograph showing a parallel set of stylolites (XPL, 4×). (m) Photomicrograph showing opaque mineral (PPL, 4×). (n) Photomicrograph showing opaque mineral (XPL, 4×). (o) Photomicrograph showing quartz cluster (PPL, 4×). (p) Photomicrograph showing quartz cluster (XPL, 4×).
Applsci 14 09395 g019aApplsci 14 09395 g019bApplsci 14 09395 g019c
Table 1. Unconfined compressive strength test result of the studied samples.
Sample NumberCube SampleDiameterAreaLoadStrength
inmin2m2IbftonpsiMPa
Pi1Pi1 (a)2.250.054.00.00213,2356.61330923
Pi2Pi2 (a)3.280.088.50.00543,59021.79512835
Pi2 (b)3.280.088.50.00544,21222.10520136
Pi2 (c)3.280.088.50.00587,93043.9610,34571
Pi3Pi3 (a)3.280.088.50.00578,17939.08919863
Pi3 (b)3.280.088.50.00592,52646.2610,88575
Pi3 (c)3.280.088.50.00585,56742.7810,06769
Pi4Pi4 (a)3.280.088.50.00563,28431.64744551
Pi4 (b)3.280.088.50.00595,64047.8211,25278
Pi4 (c)3.280.088.50.005115,50157.7513,58894
Pi5Pi5 (a)2.220.054.00.00213,4356.71335923
Pi5 (b)2.220.054.00.00214,2247.11355625
Pi5 (c)3.280.088.50.00584,32242.16992068
Pi6Pi6 (a)3.280.088.50.00592,49046.2410,88175
Pi6 (b)3.280.088.50.00559,68729.84702248
Pi6 (c)3.280.088.50.00585,11442.5510,01369
Table 2. Porosity of the studied samples.
Sample NumberCube SampleWeight in Air (W1)Weight in Water (W2)Oven-Dried Weight (W3)Porosity
Pi1Pi1 (a)370.26232.27368.751.323
Pi2Pi2 (a)905.80569.24903.951.000
Pi2 (b)961.49604.15960.210.719
Pi2 (c)931.97585.99929.890.891
Pi3Pi3 (a)942.35592.35941.240.553
Pi3 (b)959.33603.47957.890.542
Pi3 (c)963.07605.55961.880.472
Pi4Pi4 (a)961.24605.09960.670.278
Pi4 (b)961.92604.79959.720.541
Pi4 (c)944.91593.34943.130.758
Pi5Pi5 (a)395.1247.94394.240.867
Pi5 (b)940.53590.23938.520.888
Pi5 (c)923.13580.71921.590.927
Pi6Pi6 (a)939.93585.34938.190.929
Pi6 (b)910.19567.51909.560.921
Pi6 (c)923.15593.15922.780.549
Table 3. Water absorption values for the studied sample.
Sample NumberCube
Sample
Weight in Water (W1)Oven-Dried Weight (W3)Water
Absorption
Water
Absorption (%)
Pi1Pi1 (a)232.27368.751.830.50
Pi2Pi2 (a)569.24903.953.380.37
Pi2 (b)604.15960.212.580.27
Pi2 (c)585.99929.893.090.33
Pi3Pi3 (a)592.35941.241.940.21
Pi3 (b)603.47957.891.930.20
Pi3 (c)605.55961.881.690.18
Pi4Pi4 (a)605.09960.670.990.10
Pi4 (b)604.79959.721.930.20
Pi4 (c)593.34943.132.670.28
Pi5Pi5 (a)247.94394.241.280.32
Pi5 (b)590.23938.523.120.33
Pi5 (c)580.71921.593.190.35
Pi6Pi6 (a)585.34938.193.310.35
Pi6 (b)567.51909.563.180.35
Pi6 (c)593.15922.781.820.20
Table 4. Specific gravity values for the studied samples.
Sample NumberCube SampleWeight in Water (W2)Oven-Dried Weight (W3)Specific Gravity
Pi1Pi1 (a)232.27368.752.666
Pi2Pi2 (a)569.24903.952.674
Pi2 (b)604.15960.212.677
Pi2 (c)585.99929.892.680
Pi3Pi3 (a)592.35941.242.683
Pi3 (b)603.47957.892.688
Pi3 (c)605.55961.882.687
Pi4Pi4 (a)605.09960.672.694
Pi4 (b)604.79959.722.689
Pi4 (c)593.34943.132.676
Pi5Pi5 (a)247.94394.242.671
Pi5 (b)590.23938.522.671
Pi5 (c)580.71921.592.678
Pi6Pi6 (a)585.34938.192.634
Pi6 (b)567.51909.562.635
Pi6 (c)593.15922.782.784
Table 5. Schmidt hammer test results for the studied rock samples.
Sample NumberCube SampleSchmidt Hammer Values
Pi1Pi1 (a)26.5
Pi2Pi2 (a)44.7
Pi2 (b)44.0
Pi2 (c)46.3
Pi3Pi3 (a)45.7
Pi3 (b)46.7
Pi3 (c)44.7
Pi4Pi4 (a)41.0
Pi4 (b)49.7
Pi4 (c)48.7
Pi5Pi5 (a)30.0
Pi5 (b)32.3
Pi5 (c)51.0
Pi6Pi6 (a)46.3
Pi6 (b)40.0
Pi6 (c)43.0
Table 6. Comparison between UCS, water absorption, and specific gravity.
Sample NumberCube SampleUCS (MPa)Water Absorption (%)Specific Gravity
Pi1Pi1 (a)230.502.666
Pi2Pi2 (a)350.372.674
Pi2 (b)360.272.677
Pi2 (c)710.332.680
Pi3Pi3 (a)630.212.683
Pi3 (b)750.202.688
Pi3 (c)690.182.687
Pi4Pi4 (a)510.102.694
Pi4 (b)780.202.689
Pi4 (c)940.282.676
Pi5Pi5 (a)230.322.671
Pi5 (b)250.332.671
Pi5 (c)680.352.678
Pi6Pi6 (a)750.352.634
Pi6 (b)480.352.635
Pi6 (c)690.202.784
Table 7. Mineralogical composition of the studied samples.
Sample NameCore SampleMicrite (%)Sparite (%)Calcite (%)Quartz (%)Opaque Minerals (%)
Pi1Pi1 (1)60151492
Pi1 (2)56191393
Pi2Pi2 (1)62131663
Pi2 (2)592010101
Pi3Pi3 (1)611413102
Pi3 (2)55201393
Pi4Pi4 (1)60211252
Pi4 (2)59199103
Pi5Pi5 (1)61151482
Pi5 (2)59181571
Disclaimer/Publisher’s Note: The statements, opinions and data contained in all publications are solely those of the individual author(s) and contributor(s) and not of MDPI and/or the editor(s). MDPI and/or the editor(s) disclaim responsibility for any injury to people or property resulting from any ideas, methods, instructions or products referred to in the content.