Abstract
The prediction of rock bursts is of paramount importance in ensuring the safety of coal mine production. In order to enhance the precision of rock burst prediction, this paper utilizes a working face of the Gengcun Coal Mine as a case study. The paper employs a three-year microseismic monitoring data set from the working face and employs a sensitivity analysis to identify three monitoring indicators with a higher correlation with rock bursts: daily total energy, daily maximum energy, and daily frequency. Three subsets are created from the 10-day monitoring data: daily frequency, daily maximum energy, and daily total energy. The impact risk score of the next day is assessed as the sample label by the expert assessment system. Sample input and sample label define the data set. The long short-term memory (LSTM) neural network is employed to extract the features of time series. The Bayesian optimization algorithm is introduced to optimize the model, and the Bayesian optimization–long short-term memory (BO-LSTM) combination model is established. The prediction effect of the BO-LSTM model is compared with that of the gated recurrent unit (GRU) and the convolutional neural network (1DCNN). The results demonstrate that the BO-LSTM combined model has a practical application value because the four evaluation indexes of the model are mean absolute error (MAE), mean absolute percentage error (MAPE), variance accounted for (VAF), and mean squared error (MSE) of 0.026272, 0.226405, 0.870296, and 0.001102, respectively. These values are better than those of the other two single models. The rock explosion prediction model can make use of the research findings as a guide.
1. Introduction
Rock burst is a dynamic phenomenon that occurs when the elastic deformation energy of coal (rock) is released suddenly and severely around a coal mine roadway or working face [1]. This often results in the simultaneous occurrence of displacement, throwing, a loud noise, and an air wave of coal (rock). As the depth of coal mining operations and the intensity of mining activities continue to increase, the number of coal mines experiencing rock bursts in China is on the rise. These incidents are becoming more frequent and severe, placing a significant strain on the safety of coal mine production [2]. In response to these challenges, the state has developed a comprehensive four-in-one rock burst prevention and control technology: prediction, monitoring, prevention and control, and effect test.
Among the various forms of monitoring, rock burst monitoring plays a pivotal role in the prevention and control of rock bursts [3,4,5]. It serves as the foundation for enhancing the efficacy of prevention and control measures. Currently, a growing number of monitoring methods are being employed in rock burst monitoring, including microseismic, ground sound, electromagnetic radiation, and other methods that have gained popularity in major mines [6,7,8,9]. Among these, microseismic monitoring stands out due to its resilience to environmental factors and its capacity to provide long-distance, dynamic, three-dimensional, and real-time monitoring. The most significant advantage of microseismic monitoring technology is its capacity for real-time and dynamic monitoring of the dynamic disaster process in mines [10].
A significant number of scholars from both domestic and international academic institutions have conducted extensive research on the prediction of rock bursts based on microseismic energy changes. Tian et al. [11] proposed a quantitative-trend early warning method for rock burst risk based on the maximum daily microseismic energy and the total number of microseismic energy/frequency deviations, analyzing the microseismic precursor information law of rock bursts. Yuan Ruifu [12] used microseismic monitoring system to collect microseismic signals before and after the occurrence of rock bursts, analyzed the time series characteristics of microseismic signals, and used the FFT method and fractal geometry principles to study the spectrum characteristics and distribution variation in microseismic signals. It can be observed from the aforementioned research that the prevailing methodologies for monitoring rock bursts through microseismic energy frequently employ empirical analogy or mathematical statistics to identify early warning indicators and discriminant criteria, thereby enabling the prediction of the risk of rock bursts [13,14]. Nevertheless, the general mathematical statistics method is inadequate for mining the extensive monitoring data set, and the prediction accuracy of rock burst risk necessitates further improvement.
Deep learning represents a significant branch of artificial intelligence [15]. Its effectiveness is contingent upon the availability of a substantial quantity of data, which is then employed to train the model [16]. Deep learning exhibits a robust capacity for adaptive feature learning, rendering it an optimal choice for the analysis of rock burst monitoring data within the context of big data. Long et al. [17] developed an intelligent prediction model for coal and gas outbursts based on data mining, and validated the efficacy of the system using microseismic monitoring data from the heading face. The results indicate that the early warning level is largely consistent with the actual situation.
The change in microseismic energy is affected by nonlinear factors, and thus, artificial intelligence algorithms are at a disadvantage in nonlinear analysis of high-dimensional data sets [18]. The most commonly utilized methodologies for anticipating rock bursts are convolutional neural networks (CNNs), extreme gradient boosting models (XGBoost), random forests (RFs), long short-term memory (LSTM), and lightweight gradient boosters (LightGBM) [19]. Given that the predictive accuracy of a single algorithmic model is insufficient for the analysis of nonlinear data, the study and application of algorithmic combination models has become a widely researched and applied field [20]. The results demonstrate that Li et al. [21] proposed a microseismic signal recognition method based on LMD energy entropy and a probabilistic neural network (PNN) by analyzing the characteristics of microseismic signals. Yuan et al. [22] used principal component analysis to extract features, used particle swarm optimization to optimize the ELM model, and proposed a rock burst warning model based on the PCA-PSO-ELM combined algorithm. Cao et al. [23] analyzed the variation characteristics of physical indicators before multiple large energy events and statistically analyzed the shortcomings of impact risk prediction indicators driven only by physical indicators and proposed a time series prediction method for rock bursts driven by the fusion of physical indicators and data features. Ullah Barkat et al. [24] established a database using shock ground pressure patterns with multiple impact features in microseismic monitoring events of the Jinping secondary hydropower project. They then used three methods of t-distributed stochastic neighbor embedding (t-SNE), K-means clustering, and extreme gradient boosting (XGBoost) to predict the short-term shock ground pressure risk.
The preceding research findings have been utilized to develop a novel approach for the prediction of rock burst risk. This approach employs a long short-term memory (LSTM) neural network model, which is optimized using a Bayesian algorithm to establish a Bayesian long short-term memory (BO-LSTM) neural network model. This model is capable of processing time series data in accordance with the characteristics of microseismic energy change. The 13,200 working face of Gengcun Coal Mine was selected as the application object for the establishment of an early warning model for rock bursts. This involved the selection of field-measured microseismic monitoring data for the purpose of combining big data prediction with early warning of rock bursts. The prediction of rock bursts in the future is established by obtaining the potential characteristic information of microseismic monitoring data. This improves the prediction accuracy of rock burst risk and provides a new method for monitoring and early warning of rock bursts.
2. Model Principles and Methods
2.1. Establishment of Rock Burst Prediction Model
The BO-LSTM model was selected for predicting rock burst risks due to its advantages in handling time series data:
Characteristics of Time Series Data: The LSTM neural network excels at processing time series data and can effectively capture long-term dependencies within the sequence. Given that microseismic monitoring data are typical time series data, LSTM can identify the temporal dependencies, making it advantageous for predicting the next step in rock burst risk.
Avoiding Gradient Vanishing: Traditional recurrent neural networks (RNNs) tend to suffer from the vanishing gradient problem when dealing with long-term dependencies in sequences. LSTM, with its unique gating mechanisms (forget gate, input gate, and output gate), effectively avoids this issue, making it more robust when handling complex time series data.
Prediction Performance: LSTM has demonstrated superior predictive performance, with experimental results showing that it outperforms single models like GRUs and 1D-CNNs across multiple evaluation metrics. The optimized BO-LSTM model further enhances prediction accuracy, demonstrating the practical application value of this model.
Below are the specific steps for constructing the dynamic ground pressure warning model proposed in this paper:
1. Collect Microseismic Monitoring Information: Collect on-site microseismic monitoring information. Due to differences in data dimensions, direct importation into the model for training is not feasible and requires data preprocessing.
2. Establish an Expert Judgment System: In order to address the dearth of sample labels in the model, it is necessary to establish an expert judgment system. The use of expert judgments on microseismic monitoring data as data labels is proposed as a means of generating the data set. The system inputs microseismic data for a specific time period, processes the data, and assesses the dynamic pressure hazards for the following day. The combination of expert analysis and empirical experience yields judgment values, which are then output as sample labels. The judgment scores, which range from 0 to 100, correspond to four levels of dynamic ground pressure. The scores are as follows: 0–25 for no dynamic pressure hazard, 25–50 for a weak dynamic pressure hazard, 50–75 for a moderate dynamic pressure hazard, and 75–100 for a strong dynamic pressure hazard.
3. Model Construction: In the model construction process, the time series characteristics of microseismic energy changes are taken into account. Python 3.11 is employed to construct the LSTM network model, which comprises an input layer, a hidden layer, and an output layer. Additionally, a Bayesian optimization algorithm (BO) is utilized to optimize the parameters. The Python programming language was employed to implement the model on the Jupyter platform. The sample data are divided into two distinct sets: a training set and a verification set. The training set is employed to train the model, while the verification set is utilized to test the trained model and optimize the parameters through the Bayesian algorithm until the optimal neural network model is identified.
4. Obtain Predictions from the Optimal Model: The optimal model is evaluated based on the predicted value. The degree of fit between the predicted value and the actual value of the model is evaluated by comparing the curve fitting and statistical indicators, including the mean absolute error (MAE), mean absolute percentage error (MAPE), and the variance accounted for (VAF). This analysis is conducted using field data to verify the accuracy and practical application value of the BO-LSTM model.
5. Further Model Validation: In order to further verify the accuracy of the model prediction, based on the aforementioned methodology for establishing the model, the daily total energy value, daily maximum energy value, and daily frequency are predicted. The actual microseismic data are employed as the sample label for model training. The model prediction accuracy is further verified by observing the fitting effect of the predicted results and the actual values, as well as the evaluation index.
The structure of the rock burst early warning model is depicted in Figure 1.
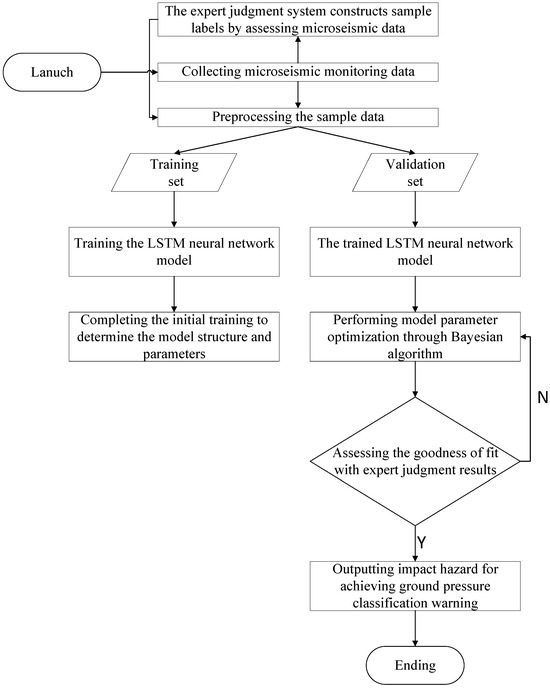
Figure 1.
Rock burst prediction flowchart.
2.2. The Basic Principles of the Long Short-Term Memory (LSTM) Network
LSTM networks are an improved type of recurrent neural network (RNN) that addresses the issues of gradient explosion and vanishing gradient encountered in traditional RNNs. This is illustrated in Figure 2.
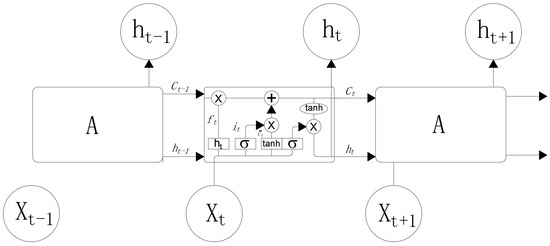
Figure 2.
LSTM network structure.
The first step of the LSTM involves the “forget gate”, which determines the degree of influence of the previous time step’s cell state Ct−1 on the current time step’s cell state Ct. ft represents the output of the forget gate, with the input being the hidden state ht−1 from the previous sequence and the current sequence data xt. The activation function σ (commonly the sigmoid function), the bias vector bf, and the weight matrix Wf are used in the computation of the forget gate [25].
The computational formula is as follows:
The second step, “input gate”, consists of two parts, and the computational formula is as follows:
In the equation, it determines the necessary information to be updated into the cell state; Ct represents the new cell state at time t; Wc is the weight matrix for the input gate; bc is the bias vector for the input gate; and the activation function tanh denotes the hyperbolic tangent function.
The third step, “output gate”, controls the influence of Ct on ht, and its update formula is as follows:
In the equation, ot determines the output portion of the cell state; bo is the bias vector for the output gate; Wo is the weight matrix for the output gate; and ht represents the hidden layer state value of the corresponding unit at time t.
2.3. Bayesian Optimization Principle
Bayesian optimization is an approximate method that employs various probabilistic surrogate models such as Gaussian processes, random forests, etc., to model the relationship between hyperparameters and model performance, ultimately identifying the optimal hyperparameter combination [26].
In Bayesian optimization, the probabilistic surrogate model refers to substituting the objective function with a certain probability model. The update formula for the posterior probability is as follows:
In the equation, D = {(x1,f1),(x2,f2),(xn,fn)} represents the collected sample points; p(f) is the prior distribution, which can be computed using the Bayesian formula to obtain the posterior distribution of f.
Bayesian optimization surrogate models can be broadly categorized into three types: Tree Parzen Estimator (TPE), Sequential Model-based Algorithm Configuration (SMAC) using random forest regression, and Gaussian Processes (GPs). This paper employs TPE, a non-standard Bayesian optimization algorithm based on a tree-structured Parzen density estimator. In comparison to other models, TPE demonstrates superior performance in high-dimensional spaces, with significantly improved speed.
The configuration space for TPE parameters is tree-shaped, primarily modeling p(x) and p(y). The preceding parameters determine which parameters to select subsequently and the range of values for these parameters.
TPE defines the following two probability densities:
In the equation, l(x) represents the probability density of {xi} corresponding to f(xi) being less than the threshold y*, and g(x) represents the probability density of {xi} corresponding to f(xi) being greater than the threshold y*.
By repeatedly measuring the objective function at different locations, more information can be obtained to estimate the distribution of the objective function. This enables the search for the optimal measurement location, aiming to achieve the optimal function value. To assess whether a location is optimal, function evaluations are collected. In the optimal location, the function attains its maximum value. In TPE, the acquisition function for collecting functions is the Expected Improvement (EI), which represents the expectation of being below the threshold. It performs well in most situations, and the formula is as follows:
In the equation, the model p is the posterior Gaussian distribution over the observation domain.
In the framework of TPE, let and ; then, the following relationships hold:
Equation (9) signifies that l(x) identifies values with higher probabilities, and g(x) identifies values with lower probabilities, resulting in a larger Expected Improvement (EI). Both l(x) and g(x) are represented in a tree structure, facilitating the collection of samples to obtain more refined information. In each iteration, the algorithm returns the value x* with the maximum EI.
2.4. DCNN Principle
One-dimensional convolutional neural networks (1DCNNs) are commonly employed for processing sequential data by integrating the well-known convolution operation with neural networks. The network parameters are updated through the backpropagation algorithm. Its architecture primarily includes an input layer, convolutional layer, pooling layer, fully connected layer, and output layer [27,28].
The input layer is responsible for receiving raw data, and the convolutional layer performs convolution operations on the data. Subsequently, non-linearity is introduced through the ReLU activation function. The pooling layer is utilized to reduce data feature dimensions, thereby decreasing computational complexity. Finally, the fully connected layer and output layer transform the extracted features into the ultimate output results.
The ReLU function is defined as follows:
2.5. GRU Principle
The GRU (gate recurrent unit) is a type of recurrent neural network introduced to address the issue of exploding gradients in RNNs, similar to LSTM (long short-term memory). The GRU model introduces two gates on top of the basic RNN architecture: namely, the update gate and the reset gate. The structure is depicted in Figure 3.
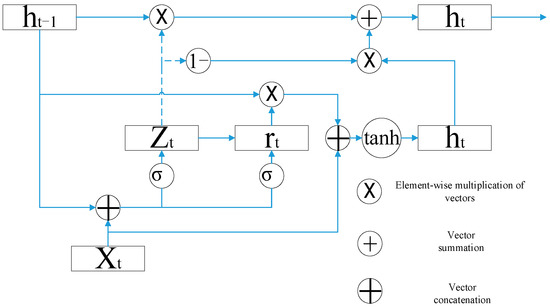
Figure 3.
GRU unit structure diagram.
In the diagram, zt and rt represent the update gate and reset gate, respectively. Their mathematical expressions are as follows:
In the equations, ωr represents the weight for the reset gate, ωz represents the weight for the update gate, tanh denotes the hyperbolic tangent function, and σ represents the sigmoid function. The parameters , , and ω0 are trainable parameters in the model [29,30].
3. Data Analysis and Model Training
3.1. Engineering Background
This paper selects the 13,200 working face of Gengcun Coal Mine of the Yimei Group as an example, which is representative of a typical rock burst coal mine. The mining thickness of the working face is 13 to 38 m, with an average thickness of 19.3 m. The southwestern part of the working face is situated within the nappe influence zone of the F16 fault. The F16 fault is a regional thrust fault with a strike that is nearly east–west, and the tendency is slightly east–south. The shallow dip angle is 70°, while the deep dip angle is generally 15° to 35°. The mining method employs the long-wall retreat mining method, while the natural caving method is utilized to manage the roof.
The 13,200 upper roadway is accessed from the external yard of the 13,200 upper roadway at an orientation of 254°52′ and is excavated along the 2–3 coal floor. The total length of the upper roadway is 875.9 m, with the layer section extending from a depth of −65 m to a depth of 25 m. The 13,200 lower roadway is opened from the 13,200 lower roadway yard, with an orientation of 83°, and is excavated along the 2–3 coal floor. The total length is 820.5 m, with the lower roadway passing through the layer section from −42 m to 160 m.
The microseismic data were selected from the 600-day microseismic monitoring data of the 13,200 working face from June 2021 to January 2023, as shown as Table 1.

Table 1.
Microseismic monitoring data.
3.2. Sensitivity Analysis
It is reasonable to posit that monitoring indicators should exhibit a stronger correlation with the risk of rock burst. Consequently, prior to the establishment of the model data set, data that are unrelated to the risk of impact should be excluded. The Pearson correlation coefficient method and the Spearman correlation coefficient method were employed to analyze the correlation between the monitoring data and the risk of rock burst. The Pearson correlation coefficient is defined as follows [31]:
In the aforementioned Formula (14), E is the mathematical expectation; D is the variance; and Cov (X,Y) is the covariance in the sum of random variables, which is used to measure the overall error between the two variables. ρXY is the value of the quotient of covariance and standard deviation between two variables, also known as the correlation coefficient between variables X and Y. The closer ρXY is to 1, the greater the correlation between the two variables is, and when it is equal to 0, the two variables are not related.
The Spearman correlation coefficient is defined as follows [32]:
ρ represents the Spearman correlation coefficient. For values of ρ between −1 and 1, the closer the absolute value of |ρ| is to 1, the greater the correlation. When the absolute value of |ρ| is equal to 0, the correlation is 0. D represents the difference between two data sequences, while N denotes the number of data points.
The correlation coefficient diagram calculated by Pearson correlation coefficient and Spearman correlation coefficient is shown as Figure 4. It can be seen that the daily total energy, daily frequency, and daily maximum energy are positively correlated with the impact risk, and the correlation between the daily average energy and the impact risk is close to 0. Therefore, the model in this paper selects daily total energy, daily frequency, and daily maximum energy to establish a data set.
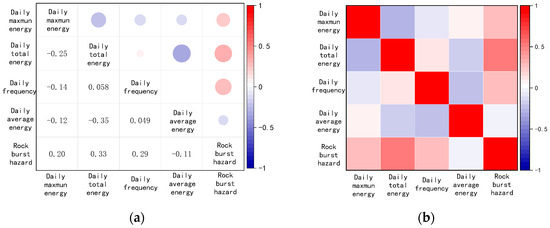
Figure 4.
Correlation charts: (a) Pearson correlation charts; (b) Spearman charts diagram.
3.3. Data Processing
The rock burst early warning model employs a supervised learning method to predict by constructing a mapping between features and label information. The data set comprises both sample features and sample labels. The Pearson and Spearman correlation coefficients indicate that the three indexes of daily total energy, daily frequency, and daily maximum energy are positively correlated with the risk of impact. Accordingly, the sample characteristics are selected as the model inputs: the maximum microseismic energy of n days before time t, the total daily energy of n days before time t, and the frequency of n days before time t, as illustrated in Figure 5a–c. The sample label is established through the expert evaluation system, based on the evaluation results of the microseismic monitoring data. The results are obtained by impact pressure researchers scoring the impact risk at time t in the historical data.

Figure 5.
Microseismic monitoring data: (a) the daily maximum energy value of the first 10 days at time t; (b) the daily total energy value of the first 10 days before the time of t; (c) the daily maximum frequency of the first 10 days at time t.
- (1)
- Handling Missing Values
Due to network signal interference during the transmission of microseismic data, missing or abnormal data may occur, which may subsequently be filtered out. Therefore, it is necessary to handle missing values in the collected microseismic data. If the amount of missing data is small and the missing values are randomly distributed, the records with missing values can be deleted. However, in microseismic data, the missing parts often contain critical information, and deleting them may affect the completeness and accuracy of the model. As a result, linear interpolation and spline interpolation methods will be used to fill in the missing values.
Linear interpolation: If the missing value is assumed to lie between two data points that exhibit linear variation, it can be filled using linear interpolation.
Spline interpolation: For a smoother interpolation, particularly suited for complex, non-linear variations in data, spline interpolation will be applied.
- (2)
- Normalized Processing
The selected data set exhibits dimensions between different features. In order to enhance the stability of the model and reduce the computational burden, it is necessary to normalize the data [33]. The MAX-MIN function was selected as follows:
The normalized value, denoted by X*, is the arithmetic mean of the original data set, x. The maximum value of the data in each feature, denoted by max, is the largest value observed in the data set. The minimum value, denoted by min, is the smallest value observed in the data set.
- (3)
- Sliding Window Approach:
A sliding window approach was used to create time series sequences for LSTM. The window size was set to 10, meaning each input to the model consists of data from the past 10 days, and the step size was set to 1. This resulted in 600 data sequences for model training.
Each sequence includes the daily energy values and frequencies from the past 10 days, predicting the risk of rock burst for the next day.
- (4)
- Data Splitting
The prepared data were split into a training set (85% of the data) and a validation set (15%). The training set was used to train the LSTM model, while the validation set was employed to evaluate and fine-tune the model performance.
3.4. Indicators for Model Evaluation
In order to objectively evaluate the comprehensive performance of the model, it is necessary to consider the fact that this study is essentially a regression problem. In order to accomplish this, MSE (mean square error), MAE (mean absolute error), MAPE (mean absolute percentage error), and VAF (variance ratio) are used to evaluate the comprehensive performance of the model. The mean squared error (MSE) and mean absolute error (MAE) are employed to quantify the discrepancy between the actual and observed values. A smaller value indicates greater accuracy. MAPE is a measure of the average size of the prediction error relative to the true value. The smaller the value, the more accurate the prediction. The variance ratio (VAF) is employed to assess the extent to which the variance in the model’s observed data is interpreted. The value of VAF ranges from 0% to 100%. When the VAF is close to 100%, the model is able to explain the variance in the observed data to a high degree of accuracy. When the VAF is close to 0%, the model’s ability to fit the observed data is severely limited, and the variance in the observed data cannot be explained. The calculation formula is as follows:
In this formula, yi represents the actual value, yi’ represents the predicted value, and n represents the total number of samples.
In Equation (20), SSres represents the sum of squares of residuals, which is the variance in the difference between the predicted value of the model and the actual observed value. SStot, on the other hand, is the total sum of squares, which is the variance in the difference between the actual observed value and its mean value.
In Equations (21) and (22), is the ith observed value, is the predicted value of the model for the ith observed value, and is the mean value of the observed value.
4. Model Validation
4.1. Impact Hazard Prediction Effectiveness Analysis
In order to verify the prediction performance of the BO-LSTM model, it is compared with two other models: a GRU (a recurrent neural network model) and a 1DCNN (a one-dimensional convolutional neural network model). It can be seen from Figure 6, Figure 7 and Figure 8, the BO-LSTM model demonstrates the most accurate prediction of impact risk, with precise predictions for the four events of medium and strong impact risk. The GRU model is the second-best performer, with two accurate predictions for the four events of medium impact risk and strong impact risk. The 1DCNN prediction effect is the least accurate, with only one accurate prediction made for the four events of medium impact risk and strong impact risk.
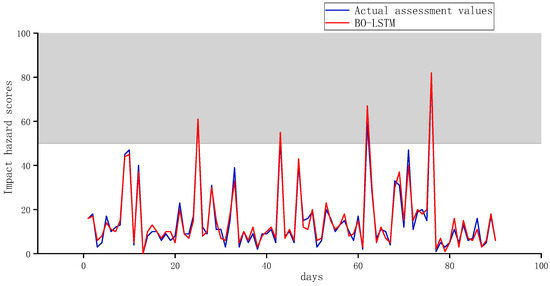
Figure 6.
BO-LSTM model impact hazard prediction results.
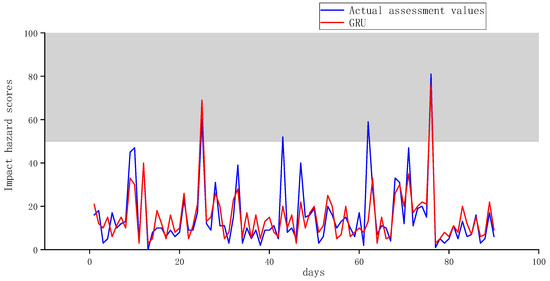
Figure 7.
GRU model impact hazard prediction results.
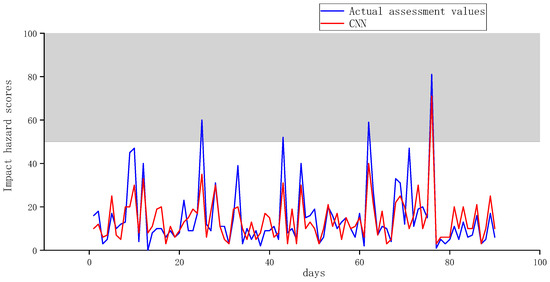
Figure 8.
1DCNN model impact hazard prediction results.
In order to make a more accurate evaluation of the performance of the three neural network models, MAE, MAPE, VAF, and MSE were used to evaluate the prediction results of the impact risk score.
The results of the evaluation are presented in Table 2. The mean absolute error (MAE) and mean absolute percentage error (MAPE) values of the bidirectional long short-term memory (BLSTM) model are the smallest, with values that are 0.038369 and 0.195484 lower than those of the gated recurrent unit (GRU) model and 0.052916 and 0.310299 lower than those of the one-dimensional convolutional neural network (1DCNN) model, respectively. Furthermore, the variance accounted for is closest to 1, indicating that the predicted value of the impact risk and the true evaluation value are well fitted. In the MSE value evaluation, the GRU model outperforms the 1DCNN in the first three evaluation indicators due to the greater susceptibility of the mean square error (MSE) to large errors and the greater sensitivity of the GRU model to outliers. The MSE values of the two models are comparable, yet the evaluation results are inferior to those of the BO-LSTM model. Consequently, the BO-LSTM model is more reliable for impact risk prediction, with a relatively high degree of accuracy.

Table 2.
Performance evaluation of impact hazard prediction.
4.2. Analysis of the Effect of Microseismic Energy Change Prediction
In order to further verify the application value of the BO-LSTM model in microseismic energy prediction of rock bursts, the model is used to predict the daily maximum energy, daily frequency, and daily total energy value and compared with the actual observation value in the field. As illustrated in Figure 9a–c, the model demonstrates an accurate prediction of four microseismic energy events above 105 in the prediction of the maximum energy value and the total daily energy value. The overall fitting effect is deemed to be excellent. In the prediction of daily frequency, although the overall fitting effect is not as good as the other two data sets, it made six accurate predictions among the high-frequency microseismic events, so it also has a certain level of generalizability.

Figure 9.
BO-LSTM microseismic data prediction results: (a) daily maximum energy prediction results; (b) daily total energy prediction results; (c) daily frequency prediction results.
The results of the evaluation are presented in Table 3. The evaluation of the prediction performance of the four evaluation indicators revealed that the MAE of the daily total energy and the maximum energy was less than 0.01, the MAPE was less than 0.3, and the MSE value was less than 0.01. In comparison to the prediction of impact risk, the results demonstrated a more accurate effect, and the variance accounted for was close to 1, indicating that the model exhibited certain generalization. Although the overall assessment of daily frequency is not as favorable as the other two monitoring data points, its mean absolute error (MAE), mean absolute percentage error (MAPE), and mean squared error (MSE) are 0.072, 0.233, and 0.008, respectively. Furthermore, the relative coefficient is greater than 70%. The predictive outcomes retain their utility as a reference point.

Table 3.
Performance evaluation of microseismic energy prediction.
4.3. Experimental Results Validation
In order to further verify the accuracy of the BO-LSTM model prediction, it is compared with the far–near field monitoring and early warning system for rock bursts in the Gengcun Coal Mine. The far–near field monitoring and early warning system of rock burst is shown as Figure 10.
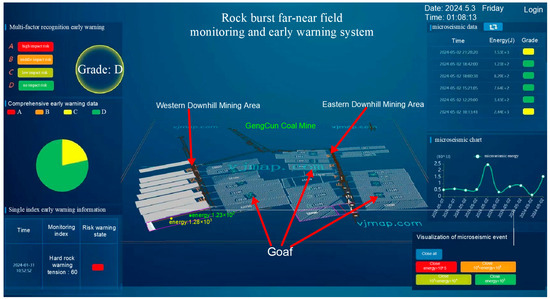
Figure 10.
The far–near field monitoring and early warning system for rock bursts.
The ARAMIS microseismic monitoring system was installed in the Gengcun Coal Mine. The system is capable of monitoring vibration events with a vibration capacity exceeding 100 J, a frequency range spanning 0 to 150 Hz, and a sound pressure level of less than 110 dB. In accordance with the varying monitoring ranges, the system is capable of selecting distinct frequency ranges for the sensors. The data transmission system enables the transmission of three-dimensional vibration rate change signals (X, Y, Z) over long-distance transmission cables. The system employs a 24-bit σ-δ converter to convert and record vibration signals in real time. This enables the system to monitor vibrations continuously and in real time, thereby facilitating the collection of data for subsequent analysis. The monitoring substation is capable of transmitting the monitored data to the ground SQL Server database. Figure 11 depicts the current configuration of ARAMIS microseismic monitoring points in the Gengcun Coal Mine.
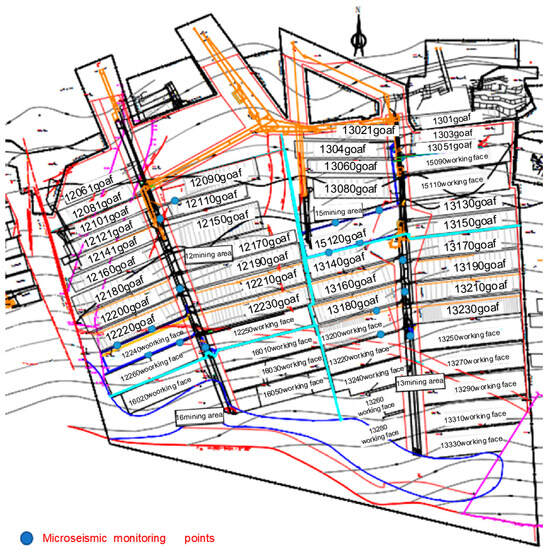
Figure 11.
Gengcun Coal Mine microseismic measuring point layout diagram.
A 90-day monitoring period of microseismic data yielded 105 instances of large energy releases, four of which coincided with an early warning index indicating a medium impact risk. These observations align with the model’s predicted outcomes, substantiating the practical application value of the BO-LSTM combination model.
5. Discussion of Problems
- (1)
- Potential Limitations of Using LSTM for Analyzing Microseismic Data
While LSTM models are powerful tools for analyzing time series data, several limitations may arise when dealing with microseismic data, particularly in the context of nonlinear relationships:
Assumption of Sequential Data: LSTM models excel in capturing temporal dependencies, but they may struggle with nonlinear relationships that are not adequately represented in the training data. If the relationship between microseismic energy and rockfall risk is highly nonlinear, the model may fail to accurately predict outcomes.
Data Quality and Quantity: LSTM requires large amounts of high-quality data to generalize effectively. In mining environments, obtaining sufficient labeled data can be challenging due to the rarity of certain events. Poor-quality or imbalanced data sets can lead to inaccurate predictions and a lack of robustness in the model.
Complexity of Interpretability: The “black box” nature of LSTM makes it difficult to interpret how specific input features influence predictions. This lack of transparency can hinder the practical application of results in critical safety decisions, as stakeholders may be hesitant to trust the model’s recommendations.
Overfitting Risks: LSTMs can overfit to the training data, particularly if the model architecture is too complex for the available data. Overfitting compromises the model’s ability to generalize to unseen data, leading to unreliable predictions in real-world scenarios.
These limitations could affect the study’s results by potentially leading to incorrect assessments of rock impact risks, which may undermine the overall safety of mining operations.
- (2)
- Integration into Existing Mine Safety Monitoring Systems
Integrating the results of LSTM research into existing mine safety monitoring systems presents both opportunities and challenges:
Data Integration: The successful implementation of LSTM models requires seamless integration with existing data sources, including microseismic monitoring systems, geological databases, and real-time sensor inputs. This may involve significant data preprocessing and synchronization efforts.
Real-Time Processing: LSTM models can be computationally intensive, particularly when processing large data sets in real time. Technological challenges may include ensuring that the existing infrastructure can handle the computational load, which may necessitate upgrades or optimizations.
User Training and Adaptation: Personnel may need training to understand and interpret the outputs from LSTM models effectively. This includes recognizing the limitations and appropriate contexts for applying model predictions.
Continuous Monitoring and Model Updating: Mining environments are dynamic; therefore, the LSTM model should be regularly updated with new data to maintain its predictive accuracy. This requires a robust feedback loop between model outputs and ground truth observations.
- (3)
- Risks of Over-Reliance on Machine Learning Algorithms
An over-reliance on machine learning algorithms, such as BO-LSTM, can lead to several critical issues:
Neglect of Traditional Methods: Traditional analysis methods, including empirical studies and domain expertise, provide essential insights that may be overlooked if machine learning is solely relied upon. These methods often incorporate years of expert knowledge, which can be crucial for understanding complex geological conditions.
Potential for Misinterpretation: If decision-makers place undue trust in machine learning outputs without considering traditional methods, they may misinterpret the risks associated with rock impacts, leading to inadequate safety measures.
To mitigate these risks, it is crucial to adopt a hybrid approach that combines machine learning with traditional analysis methods, ensuring a comprehensive understanding of rock impact risks.
- (4)
- Discussion of Risks Associated with Deep Learning in Mine Safety
When applying deep learning methods in critical areas such as mine safety, it is vital to discuss potential risks, particularly if the probability of error has not been properly analyzed:
Error Propagation: In safety-critical applications, errors in predictions can have severe consequences. If the model has not been validated thoroughly, it may produce false positives or negatives, leading to misguided safety protocols.
Lack of Error Analysis: Without proper error analysis, it is challenging to understand the model’s limitations and to identify scenarios where it may fail. This is particularly concerning in mining operations, where the stakes are high.
Regulatory Compliance: Mining operations are subject to strict safety regulations. Failure to demonstrate the reliability and accuracy of machine learning models can hinder compliance with industry standards, affecting operational licenses and safety certifications.
6. Conclusions
- (1)
- In order to enhance the precision of rock burst prediction and to guarantee the security of coal mine production, this paper employs a BO-LSTM combined model to forecast the probability of rock bursts. The predicted value and the actual evaluation value of the model after Bayesian optimization exhibit a high degree of correlation. A comparison of the single model GRU and 1DCNN evaluation indicators reveals that the MAE and MAPE values are the smallest, with a difference of 0.038369 and 0.195484, respectively, in favor of the GRU model and a difference of 0.052916 and 0.310299, respectively, in favor of the 1DCNN model. Moreover, the relative coefficient R is closest to 1, indicating that the prediction accuracy is higher and the effect is more pronounced.
- (2)
- The model presented in this paper was further applied to predict changes in microseismic energy, accurately forecasting microseismic events with energy greater than 105. For high-frequency events within a 10-day period, six accurate predictions were made, and the fitting effect compared to the actual values was excellent.
- (3)
- The model in this paper is compared with the monitoring results of the far–near field monitoring and early warning system for rock bursts in the Gengcun Coal Mine. The model makes a more accurate prediction of large energy events above 105, and the MAE (mean square error) reaches 0.026272 in the prediction of rock burst risk. Compared with the model prediction results used in the system, it is closer, but the addition of the Bayesian algorithm for hyperparameter optimization reduces the number of iterations and reduces the calculation cost, indicating that it has practical application value for microseismic event prediction.
- (4)
- A new method for predicting rock bursts has been developed by combining microseismic energy change and a neural network model. This approach offers a more comprehensive understanding of the phenomenon than previous methods. However, the early warning index is relatively limited in scope. In the future, a multi-parameter early warning model could be constructed by combining indicators such as ground sound, coal body stress, and support resistance. This would further enhance the accuracy of rock burst prediction.
Author Contributions
Conceptualization, X.F. and S.C.; methodology, S.C.; software, S.C.; validation, X.F., S.C. and T.Z.; formal analysis, S.C.; investigation, X.F.; resources, X.F.; data curation, S.C.; writing—original draft preparation, S.C.; writing—review and editing, X.F. and S.C.; visualization, X.F.; supervision, X.F.; project administration, S.C.; funding acquisition, X.F. All authors have read and agreed to the published version of the manuscript.
Funding
This research received no external funding.
Institutional Review Board Statement
Not applicable.
Informed Consent Statement
Informed consent was obtained from all subjects involved in the study.
Data Availability Statement
The data presented in this study are available on request from the corresponding author. The data are not publicly available due to privacy concerns.
Conflicts of Interest
The authors declare no conflicts of interest.
References
- Jiang, Y.-D.; Pan, Y.-S.; Jiang, F.-X. State of the art review on mechanism and prevention of coal bumps in China. J. China Coal Soc. 2014, 39, 205–213. [Google Scholar] [CrossRef]
- Dou, L.; Pan, J. Present situation and problems of coal mine rock burst prevention and control in China. J. China Coal Soc. 2022, 47, 152–171. [Google Scholar] [CrossRef]
- Jv, W.; Pan, J.; Mining Design Division of Tiandi Technology Co., Ltd. Present Situation and Prospect of Monitoring and Early Warning Technology of Coal Mine Rock Burst in China. Coal Min. Technol. 2012, 17, 1–5. [Google Scholar] [CrossRef]
- Tan, Y.; Guo, W.; Xin, H.; Zhao, T.; Yu, F.; Liu, X. Research on key technology of rock burst monitoring and de-danger in deep coal mining. J. China Cola Soc. 2019, 44, 160–172. [Google Scholar] [CrossRef]
- Gui, B.; Zhang, G.; Zhang, S.; Yu, Z.; Jiang, F.; Dong, X. Monitoring and early warning technology and its application in rock burst compaction. Coal Sci. Technol. 2010, 38, 22–24. [Google Scholar] [CrossRef]
- Chen, J.; Gao, J.; Pu, Y.; Jiang, D.; Qi, Q.; Wen, Z.; Sun, Q.; Chen, L. Machine learning method for rock burst prediction and early warning. J. Min. Strat. Control Eng. 2021, 3, 57–68. [Google Scholar] [CrossRef]
- Liu, Y.; Qiu, L.; Lou, Q.; Wei, M.; Yin, S.; Li, P.; Cheng, X. Study on time-frequency characteristics of acoustic and electrical signals in rock failure process under load. Ind. Mine Autom. 2020, 46, 87–91. [Google Scholar] [CrossRef]
- Li, Z.; He, X.; Dou, L.; Wang, G.; Song, D.; Lou, Q. Bursting failure behavior of coal and response of acoustic and electromagnetic emissions. J. Rock Mech. Eng. 2019, 38, 2057–2068. [Google Scholar] [CrossRef]
- Luo, H.; Pan, Y.; Xiao, X.; Zhao, Y.; Jia, B. Multi-parameter risk evaluation and graded early warning of mine dynamic disaster. China Saf. Sci. J. 2013, 23, 85–90. [Google Scholar] [CrossRef]
- Cong, S.; Cheng, J.; Wang, Y.; Fang, Z. Current status and development prospect of coal mine microseismic monitoring technology. China Min. 2016, 25, 87–93. [Google Scholar]
- Tian, X.; Li, Z.; Song, D.; He, Q.; Jiao, B.; Cao, A.; Ma, Y. Study on microseismic precursors and early warning methods of rockbursts in a working face. J. Rock Mech. Eng. 2020, 39, 2471–2483. [Google Scholar] [CrossRef]
- Yuan, R.; Li, H.-M.; Li, H.-Z. Microseismic signal distribution characteristics and precursor information discrimination of coal pillar rock burst. J. Rock Mech. Eng. 2012, 31, 80–85. [Google Scholar]
- Qi, Q.; Li, H.-Y.; Deng, Z.-G.; Zhao, S.K.; Zhang, N.; Bi, Z. Research on the theory, technology and standard system of impact ground pressure in China. Coal Min. 2017, 22, 1–5. [Google Scholar] [CrossRef]
- Li, N.; Wang, E.; Ge, M. Microseismic monitoring technique and its applications at coal mines: Present status and future prospects. J. China Coal Soc. 2017, 42, 83–96. [Google Scholar] [CrossRef]
- Mu, R. A Survey of Recommender Systems Based on Deep Learning. IEEE Access 2018, 6, 69009–69022. [Google Scholar] [CrossRef]
- Hatcher, W.G.; Yu, W. A Survey of Deep Learning: Platforms, Applications and Emerging Research Trends. IEEE Access 2018, 6, 24411–24432. [Google Scholar] [CrossRef]
- Long, N.; Yuan, M.; Wang, G.; Wang, Q.; Xu, S.; Li, X. Research on real-time early warning of coal and gas outburst based on data mining. China Min. Ind. 2020, 29, 88–93. [Google Scholar] [CrossRef]
- Denis, A.; Claire, B.; Umair, B.-W.; Tariq, A.; Chen, G.; Dirk, J.-V.; Verschuur, L.-E. Machine learning in microseismic monitoring. Earth-Sci. Rev. 2023, 239, 0012–8252. [Google Scholar] [CrossRef]
- Li, Y. Research on neural network algorithm in artificial intelligence recognition. Sustain. Energy Technol. Assess 2022, 53, 1388–2213. [Google Scholar] [CrossRef]
- Zhu, R.; Zhong, G.-Y.; Li, J.-C. Forecasting price in a new hybrid neural network model with machine learning. Expert Syst. Appl. 2024, 249, 0957–4174. [Google Scholar] [CrossRef]
- Li, Q.; Li, Y.; He, Q. Mine-Microseismic-Signal Recognition Based on LMD–PNN Method. Appl. Sci. 2022, 12, 5509. [Google Scholar] [CrossRef]
- Yuan, H.; Ji, S.; Liu, G.; Xiong, L.; Li, H.; Cao, Z.; Xia, Z. Investigation on Intelligent Early Warning of Rock Burst Disasters Using the PCA-PSO-ELM Model. Appl. Sci. 2023, 13, 8796. [Google Scholar] [CrossRef]
- Cao, A.; Liu, Y.; Yang, X.; Li, S.; Wang, C.; Bai, X.; Liu, Y. Time series prediction method of rock burst driven by physical index and data feature fusion. J. China Coal Soc. 2023, 48, 3659–3673. [Google Scholar] [CrossRef]
- Ullah, B.; Kamran, M.; Rui, Y. Predictive Modeling of Short-Term Rockburst for the Stability of Subsurface Structures Using Machine Learning Approaches: T-SNE, K-Means Clustering and XGBoost. Mathematics 2022, 10, 449. [Google Scholar] [CrossRef]
- Fang, Y.; Lu, Z.; Ge, J. Stock price prediction of LSTM-CNN model combined with RMSE loss. J. Comput. Eng. Appl. 2022, 58, 294. [Google Scholar] [CrossRef]
- Cui, J.; Yang, B. Predictive Overview of Bayesian Optimization Methods and Applications. J. Softw. 2018, 29, 3068–3090. [Google Scholar] [CrossRef]
- Lu, L.; Yi, Y.; Huang, F.; Wang, K.; Wang, Q. Integrating local CNN and global CNN for script identification in natural scene images. IEEE Access 2019, 7, 52669–52679. [Google Scholar] [CrossRef]
- Nourmohammadi, F.; Parmar, C.; Wings, E.; Comellas, J. Using Convolutional Neural Networks for Blocking Prediction in Elastic Optical Networks. Appl. Sci. 2024, 14, 2003. [Google Scholar] [CrossRef]
- Batur Dinler, Ö.; Aydin, N. An Optimal Feature Parameter Set Based on Gated Recurrent Unit Recurrent Neural Networks for Speech Segment Detection. Appl. Sci. 2020, 10, 1273. [Google Scholar] [CrossRef]
- Jia, P.; Liu, H.; Wang, S.; Wang, P. Research on a Mine Gas Concentration Forecasting Model Based on a GRU Network. IEEE Access 2020, 8, 38023–38031. [Google Scholar] [CrossRef]
- Li, Z.; Yang, Y.; Li, L.; Wang, D. A weighted Pearson correlation coefficient based multi-fault comprehensive diagnosis for battery circuits. J. Energy Storage 2023, 60, 106584. [Google Scholar] [CrossRef]
- Edmundas, K.; Zdravko, N.; Željko, S.; Olega, P. A Novel Rough Range of Value Method (R-ROV) for Selecting Automatically Guided Vehicles (AGVs). Stud. Inform. Control 2018, 27, 385–394. [Google Scholar] [CrossRef]
- Wu, Y.; He, K. Group Normalization. Int. J. Comput. Vis. 2020, 128, 742–755. [Google Scholar] [CrossRef]
Disclaimer/Publisher’s Note: The statements, opinions and data contained in all publications are solely those of the individual author(s) and contributor(s) and not of MDPI and/or the editor(s). MDPI and/or the editor(s) disclaim responsibility for any injury to people or property resulting from any ideas, methods, instructions or products referred to in the content. |
© 2024 by the authors. Licensee MDPI, Basel, Switzerland. This article is an open access article distributed under the terms and conditions of the Creative Commons Attribution (CC BY) license (https://creativecommons.org/licenses/by/4.0/).