The evaluation of the results in this study is divided into two parts. In the first part, experimental results for current and voltage parameters were evaluated for different ambient temperatures (−10 °C, 25 °C, 40 °C), and a statistical analysis (ANOVA) was performed to evaluate the results. The accuracy of the selected parameters in predicting the output points of the battery at different SOC points (SOC 90, SOC 50, SOC 30) was examined and shown statistically by taking RMSE values into consideration. In the second part, the model with the highest accuracy was determined by ANOVA analysis, and then the most suitable model was determined by the genetic algorithm obtaining equivalent circuit models (ECMs) for diverse combinations of these parameters. After the parameters were determined based on the model that minimizes the RMSE value, the EKF algorithm was utilized for SoC estimation; then, this model was tested in real time, and comparisons were made by making SOC predictions.
3.1. Model Validation and ANOVA Results
Figure 4,
Figure 5 and
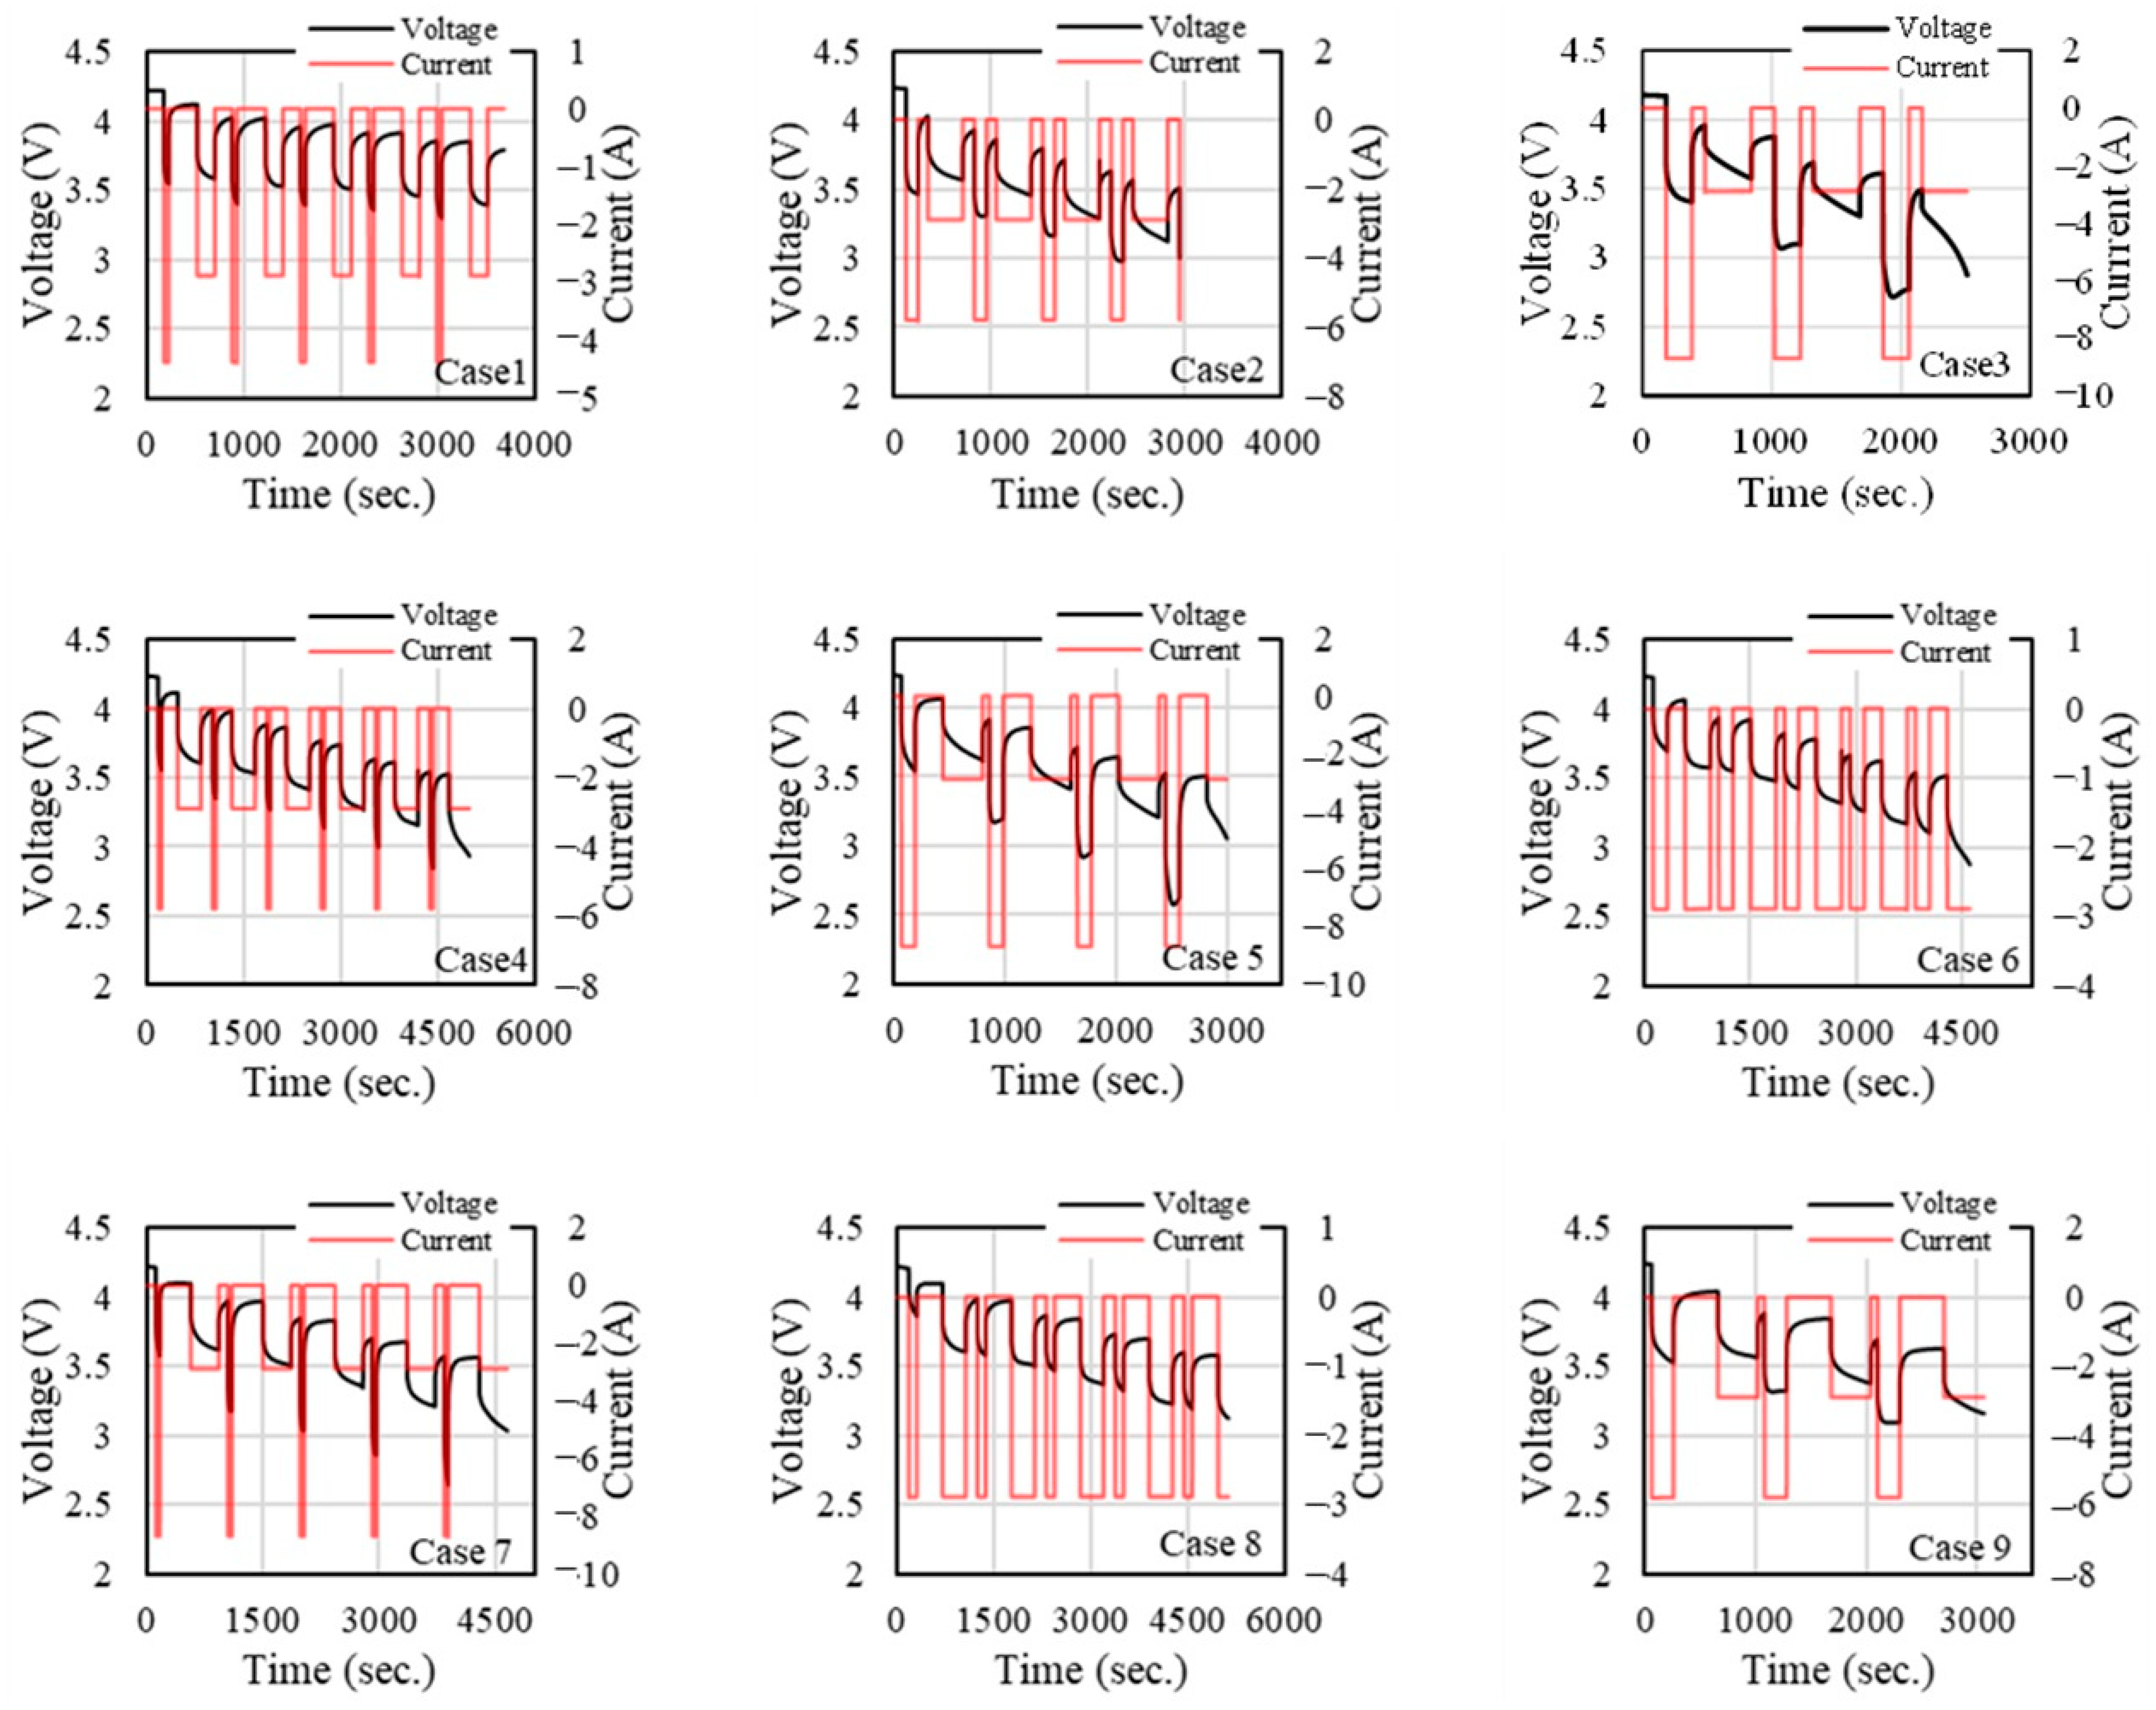
Figure 6 show the current and voltage response over time under various ambient temperatures (−10 °C, 25 °C and 40 °C) across different cases for each temperature condition. In
Figure 4, the voltage remains within the range of approximately 2 to 4.5 V, while the current shows varied patterns of charging and discharging with spikes and drops. The different cases appear to be set up to observe the battery’s response to distinct operating conditions. The voltage profiles seem relatively stable, albeit with small fluctuations, whereas the current profiles exhibit more pronounced variations. In all cases, the voltage generally stays within a narrow band between 3 V and 4.2 V, which is typical for lithium-ion batteries. The relatively stable voltage profiles across all cases indicate that the battery’s State of Charge is being maintained effectively without severe voltage drops, which would suggest significant capacity depletion or over-discharge.
The current profiles are more variable than the voltage profiles, with distinct spikes and drops corresponding to charging and discharging cycles. These variations are likely due to different load conditions applied in each case. Cases 3, 5, and 9 exhibit more extreme current behaviours, with higher peaks or deeper discharges. This could indicate more aggressive charging or discharging scenarios, putting the battery under higher stress. Cases 1 and 7 appear to be more moderate in terms of current fluctuations, which could represent standard or baseline testing conditions where the battery is not overly stressed.
At a lower temperature, the voltage drop becomes more abrupt and steeper across most cases compared to 40 °C. Cold temperatures affect the internal resistance and kinetics of the battery, causing higher voltage drop-offs. This is especially evident in Case 3 and Case 7, where voltage drops sharply after each pulse. The current shows a similar pattern to 25 °C and 40 °C, but the voltage is less stable.
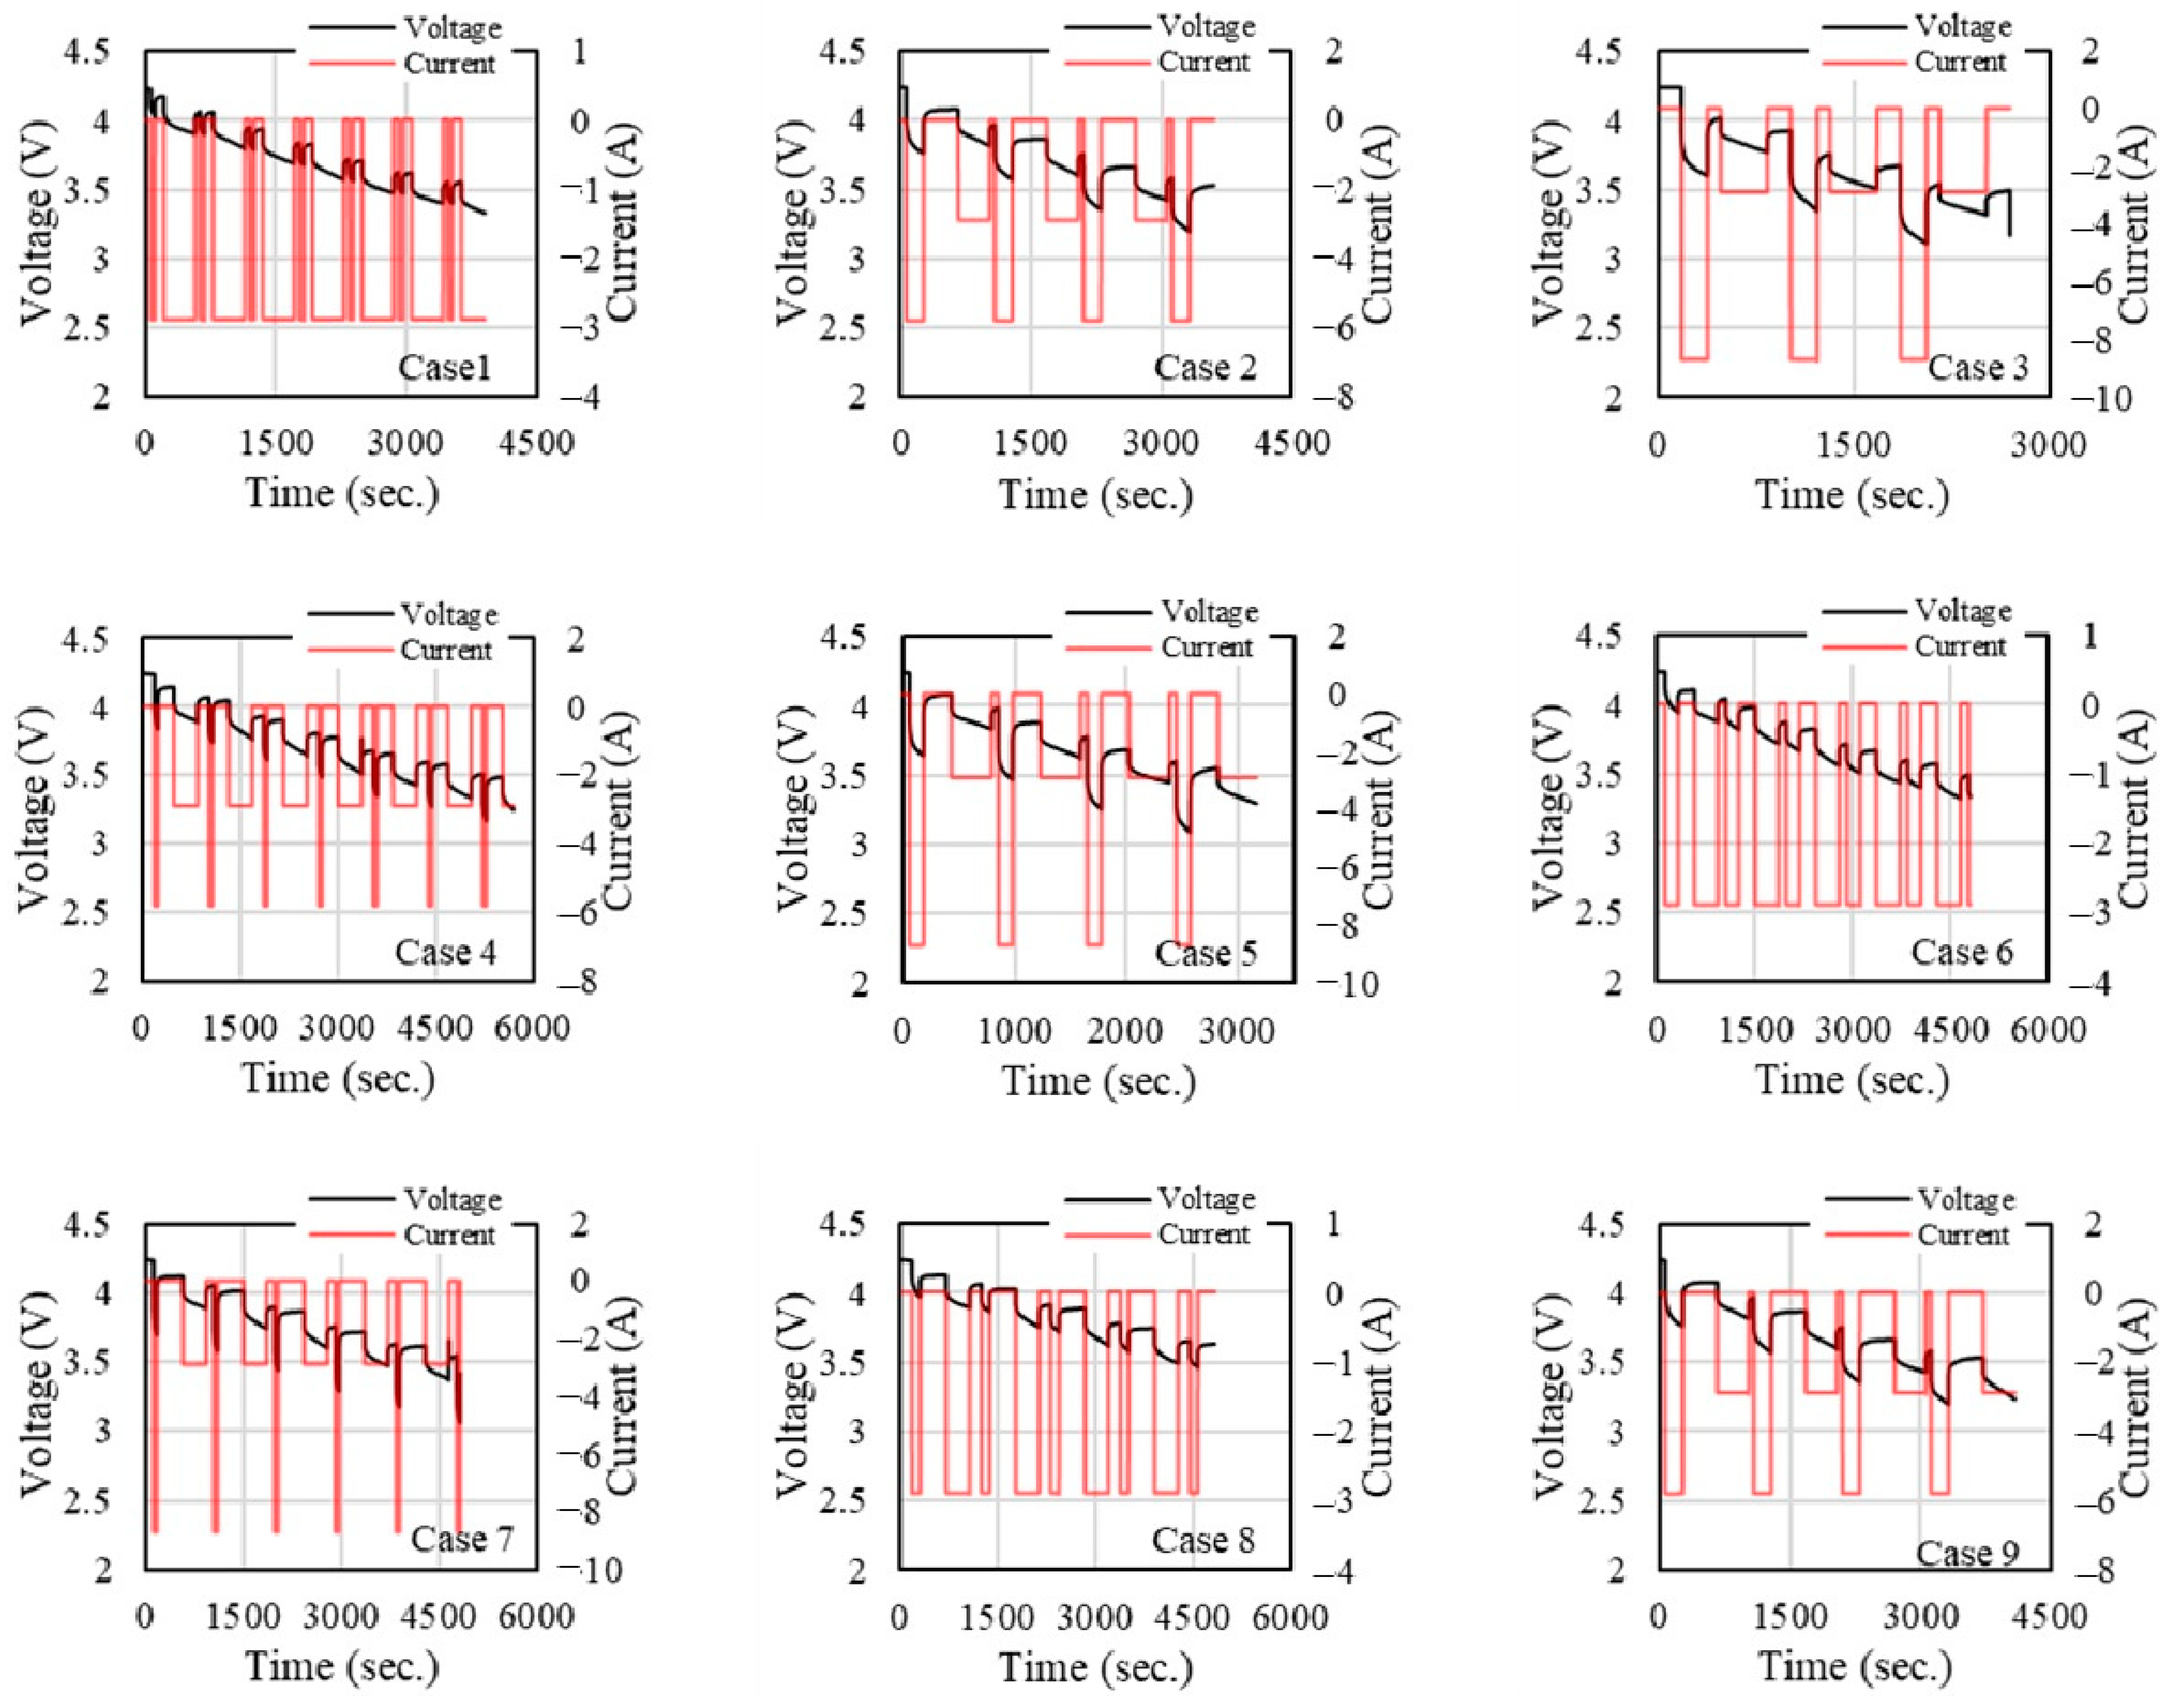
Figure 5 illustrates the current and voltage results for different cases at an ambient temperature of 25 °C. In this condition, the voltage behaviour stabilizes compared to −10 °C. The voltage curves still show stepwise declines, but they are smoother than at lower temperatures. Case 3 and Case 7, with larger current pulses, continue to show significant drops in voltage after current pulses. The current pulses resemble those at 40 °C, but the voltage response is more stable. This suggests that 25 °C may represent a more optimal operating temperature for the battery, where the performance is more predictable, and less stress is imposed on the voltage.
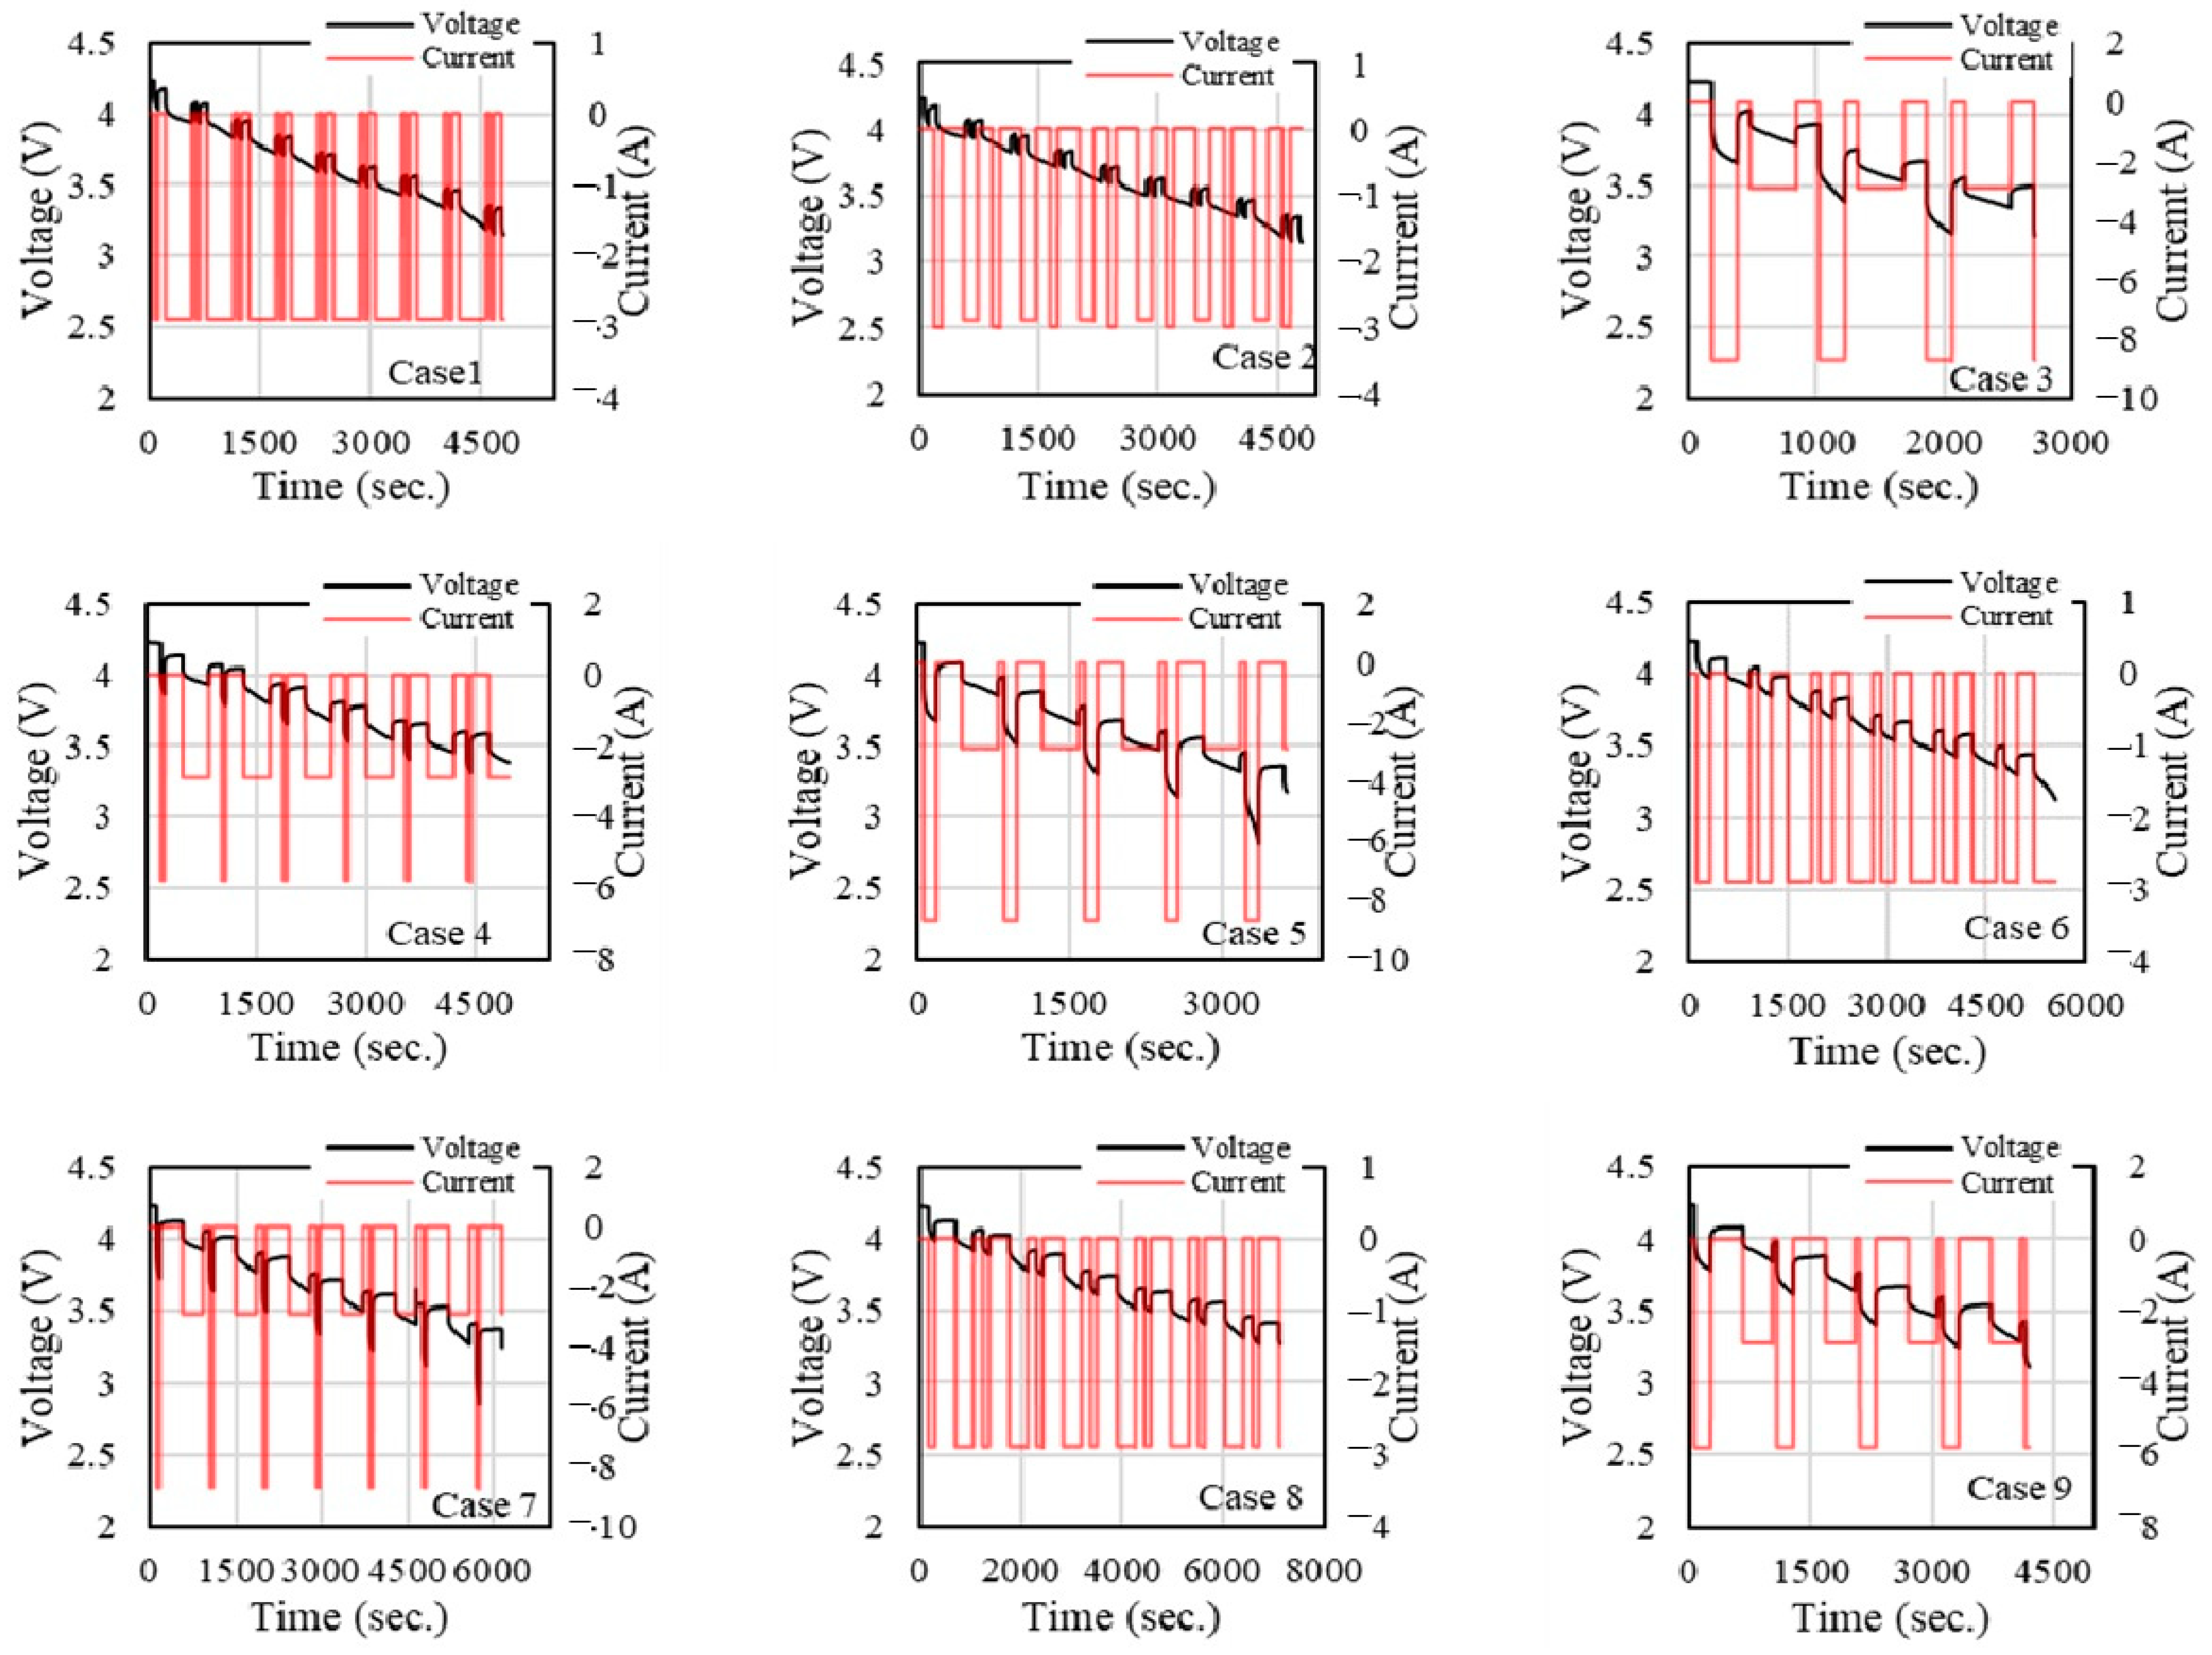
In
Figure 6, for all cases, the voltage shows a gradual decline, but there are consistent steps or reductions following each pulse in the current. Cases with lower current magnitudes (such as Case 2, Case 4, and Case 6) exhibit a smoother voltage drop, while others with higher or more varied current show more abrupt declines (e.g., Case 3 and Case 7). The current has a pulse-type waveform, with various amplitudes. The more significant current pulses (e.g., Case 7, Case 3) correspond to more pronounced voltage drops. Some cases show a lower magnitude of current pulses (e.g., Case 1), indicating a less aggressive charging/discharging profile, while others have alternating positive and negative current pulses, signifying charge/discharge cycling.
While evaluating the temperature effects on voltage response, the experimental results clearly show that temperature plays a critical role in the battery’s voltage response and overall performance. At −10 °C, the sharp voltage drops at this temperature, especially during discharge pulses, are directly tied to a possible increase in internal resistance. These voltage fluctuations demonstrate the difficulty the battery faces in maintaining stable power output under cold conditions, which also increases the RMSE in the SOC estimation. At 40 °C, the electrochemical reactions occur more rapidly, and due to a possible increase in the internal resistance beng lower, the battery is prone to thermal degradation. The results show a smoother voltage curve compared to −10 °C, but over time, high temperatures can lead to faster capacity fading and side reactions within the battery. These thermal effects increase the stress on the system, affecting long-term performance and the accuracy of SOC estimation models.
While discussing the impact of pulse time gap and discharge pulse time, both pulse time gap and discharge pulse time significantly influence the battery’s behaviour across different temperatures. A longer pulse time gap allows the battery to rest and recover, enabling thermal dissipation and charge redistribution within the cells. At low temperatures like −10 °C, this recovery period is crucial as it helps mitigate the effects of high internal resistance, leading to more stable voltage profiles and reduced errors in the SOC estimation. Conversely, at higher temperatures, a longer pulse time gap also helps manage thermal runaway by allowing the battery to cool down between pulses.
At low temperatures, shorter discharge pulses are preferable because longer pulses exacerbate voltage drops due to increased internal resistance. Also, at low temperatures, extended discharge pulses lead to larger deviations in the voltage curve, highlighting the physical strain on the battery’s electrochemical system. At 40 °C, longer discharge pulses also increase the risk of overheating, as shown by the gradual voltage degradation over time in the charts.
The effect of input parameters (pulse time gap, discharge pulse time, discharge pulse C-rate, and rest time) on RMSE values for different ambient temperatures is evaluated in
Figure 7. This figure shows the main effect plot for signal-to-noise (S/N) ratios, using the “Smaller is better” criterion. At the ambient temperature of −10 °C (
Figure 7a), the S/N ratio decreases slightly as the pulse time gap increases from 50 to 200 s, indicating that a larger pulse time gap may not significantly enhance the signal-to-noise performance of the system. However, the decrease is relatively small, suggesting that the influence of pulse time gap on battery parameter identification is minor. The S/N ratio fluctuates in relation to discharge pulse time, initially decreasing from 50 to 125 s but then increasing slightly. This suggests that an optimal discharge pulse time exists, likely between 100 and 150 s. Beyond this range, the performance degrades, possibly due to thermal or internal resistance effects in the battery. While evaluating the discharge pulse C-rate, a decreasing trend is shown from a C-rate of 2.9 to 8.7. This means that higher C-rates negatively affect the signal-to-noise ratio. A lower C-rate is preferable for minimizing parameter variance during identification, likely because high C-rates introduce larger thermal effects and voltage drops, which reduce the precision of parameter estimates. The most significant variation in S/N ratios is observed in the rest time. The ratio drops to its lowest at 120 s and then dramatically increases at 180 s. This indicates that inadequate rest time can degrade the performance of the parameter identification, but beyond a critical rest period, the signal-to-noise ratio improves significantly. A rest time around 180 s appears to provide the best conditions for battery relaxation and more accurate parameter extraction. From the ANOVA, it can be said that rest time has the most pronounced effect on the signal-to-noise ratio, with 180 s offering the best performance. Lower C-rates and moderate discharge pulse times (between 100 and 150 s) are also beneficial. Overall, adjusting the rest time and C-rate can substantially improve the accuracy of battery parameter identification based on the “Smaller is better” criterion.
At an ambient temperature of 25 °C (
Figure 7b), the S/N ratio increases significantly from 50 to 200 s, indicating that increasing the pulse time gap improves the system’s performance. The discharge pulse time has a marked effect on the S/N ratio, as shown by the peak at 125 s. There is a significant rise from 50 to 125 s, followed by a sharp decrease at 200 s. This suggests that the optimal discharge pulse time for achieving better signal-to-noise performance is around 125 s. Any further increase in discharge time might introduce negative effects, such as thermal instability, which degrade the precision of parameter estimation. The C-rate parameter has a relatively flat trend, but there is a slight decline in the S/N ratio as the C-rate increases. In terms of rest time, there is an increase in the S/N ratio from 60 to 120 s, followed by a slight decrease at 180 s.
At an ambient temperature of 40 °C (
Figure 7c), there is a sharp increase in the S/N ratio from 50 s to 125 s, indicating that increasing the pulse time gap significantly improves the precision of the parameter identification. However, after this peak at 125 s, the S/N ratio decreases sharply at 200 s. This suggests that while a pulse time gap of 125 s yields the best performance, extending the pulse time gap to 200 s may introduce detrimental effects, such as reduced accuracy or increased variability. The discharge pulse time exhibits a fluctuating trend. The S/N ratio increases slightly at 125 s, then drops at 200 s. The C-rate shows a relatively flat trend, with only minor variations in the S/N ratio. A slight increase can be observed between 2.9 and 5.8, followed by a decrease at 8.7. The rest time has a similar trend to the previous graphs, showing a drop in the S/N ratio at 120 s and a recovery at 180 s.
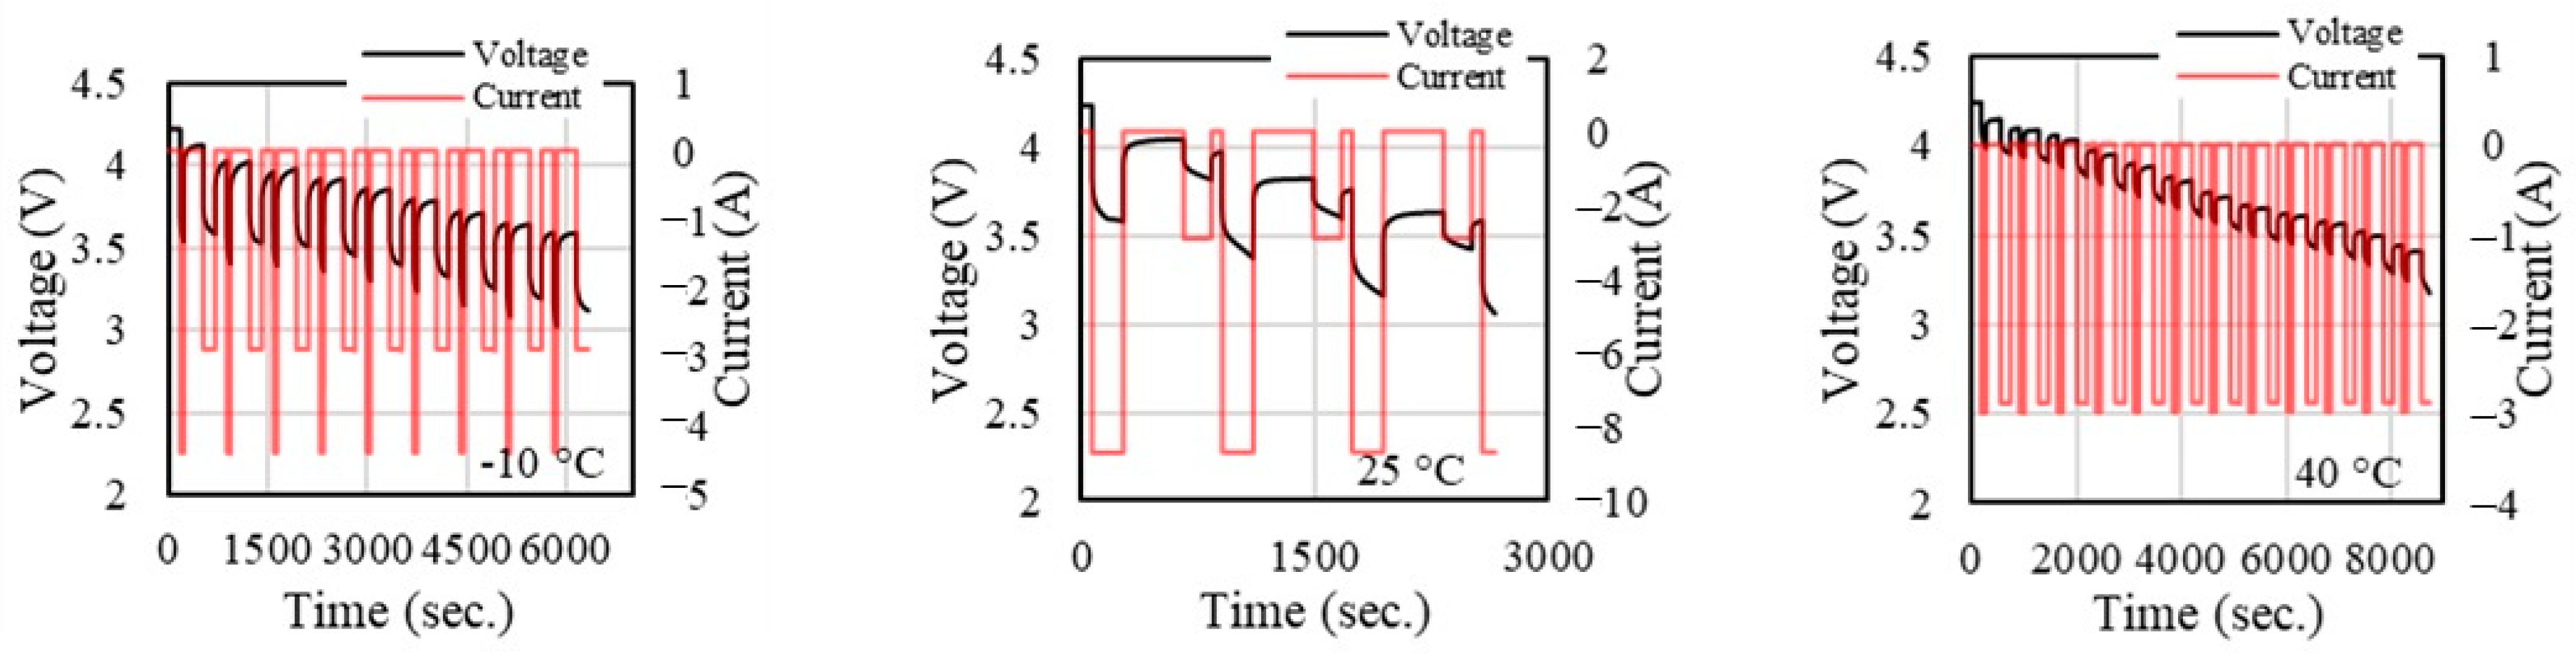
Figure 8 presents the voltage and current profiles of a battery under varying ambient temperatures (−10 °C, 25 °C, and 40 °C), highlighting the optimal experimental parameters under these conditions. At an ambient temperature of −10 °C, both voltage and current experience fluctuations, indicating a performance degradation at low temperatures. At 25 °C, the voltage remains relatively stable, but current fluctuations are more pronounced, with sharp peaks and troughs that may correspond to the optimal operation range under standard conditions. At 40 °C, there is a steady decline in voltage over time, while the current oscillates periodically.
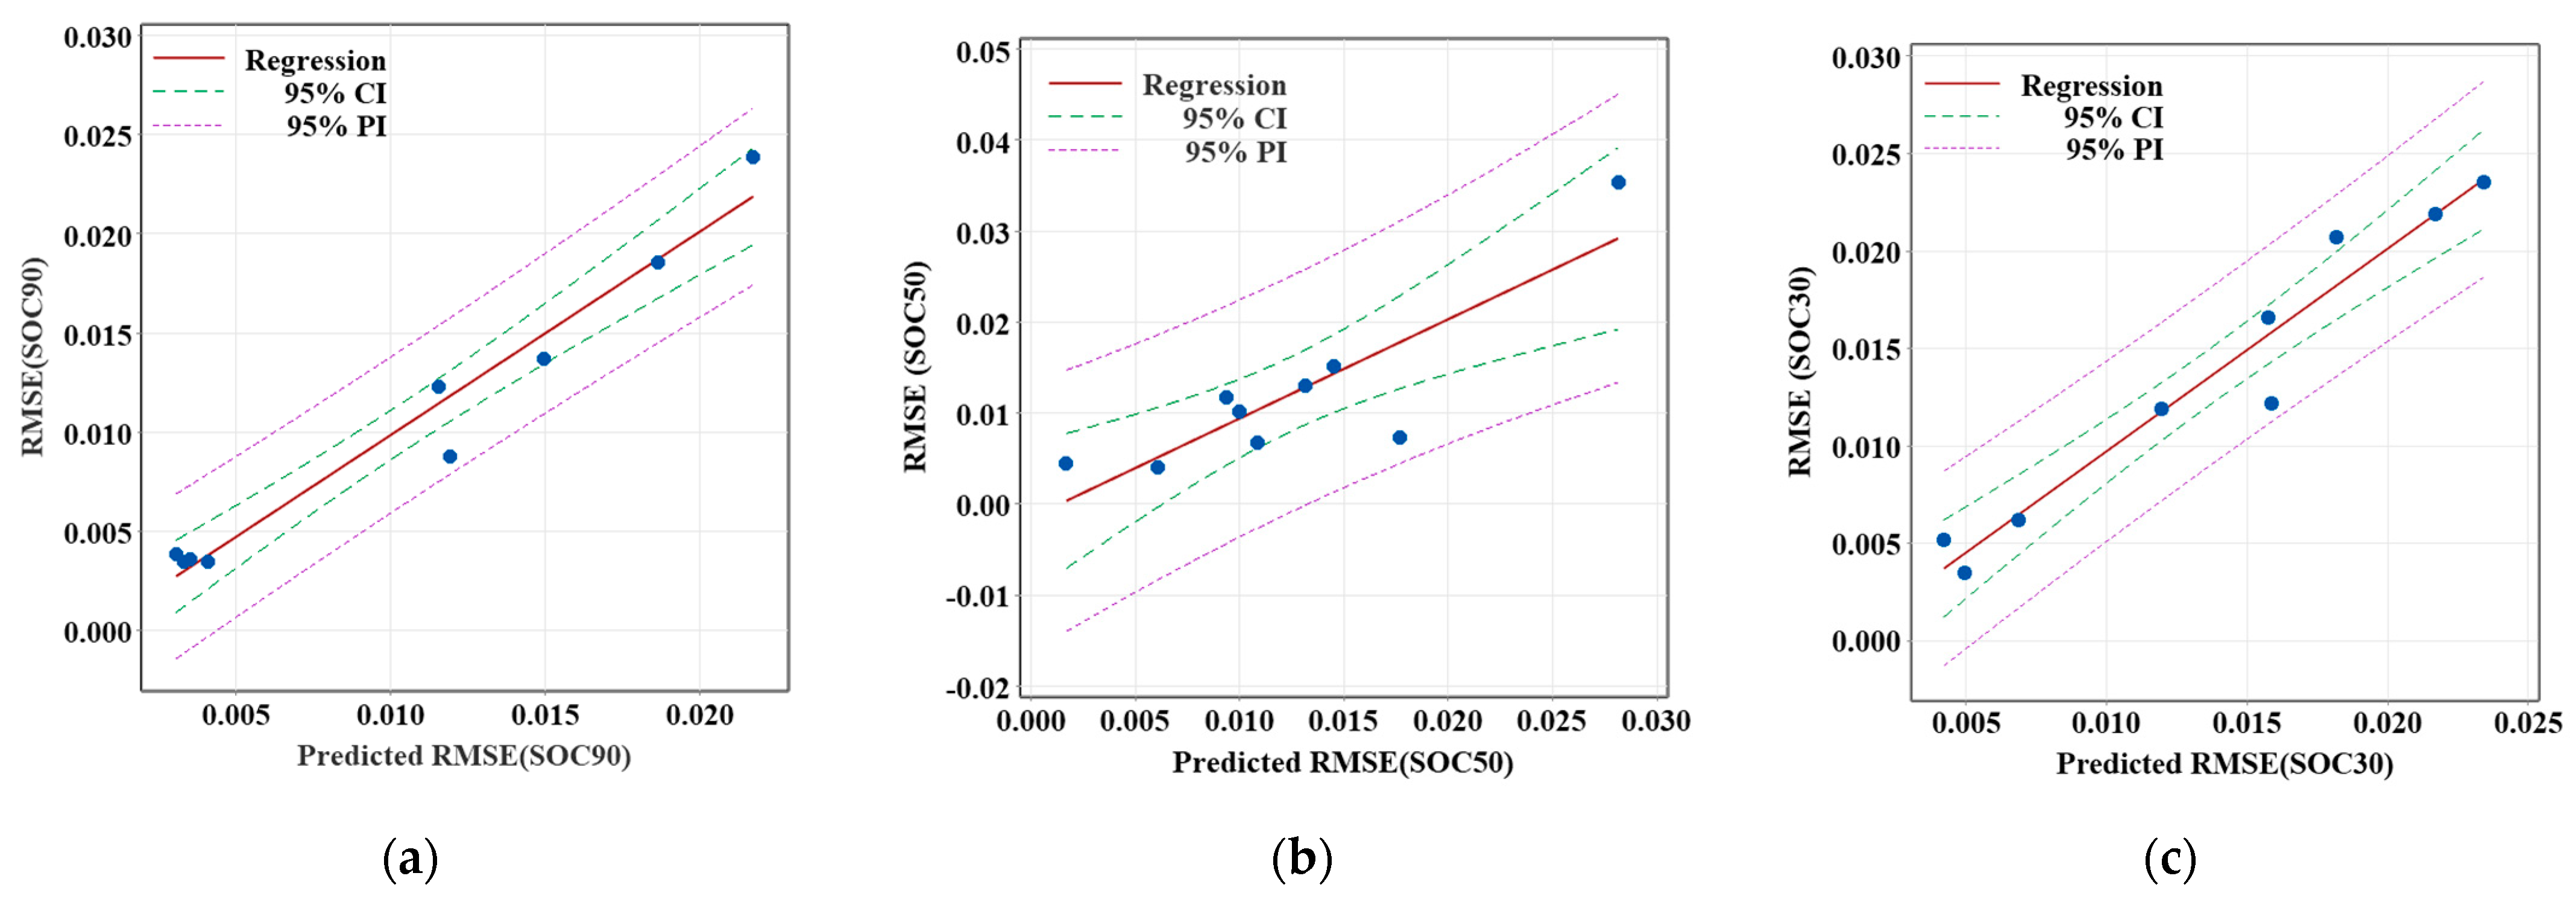
Figure 9 illustrates the regression analysis of the root mean square error (RMSE) for different SOC values at an ambient temperature of −10 °C. The regression lines, along with the 95% confidence intervals (CIs) and 95% prediction intervals (PIs), provide the relationship between the predicted and observed RMSE values for SOC at various stages of the battery’s discharge cycle: SOC90, SOC50, and SOC30. All three issues demonstrate a positive correlation between the predicted and observed RMSE, with the data points generally clustering along the regression lines. The regression model results demonstrated that the SOC estimation method is most reliable in the early stages of discharge at −10 °C but faces challenges in the later stages, where estimation errors increase.
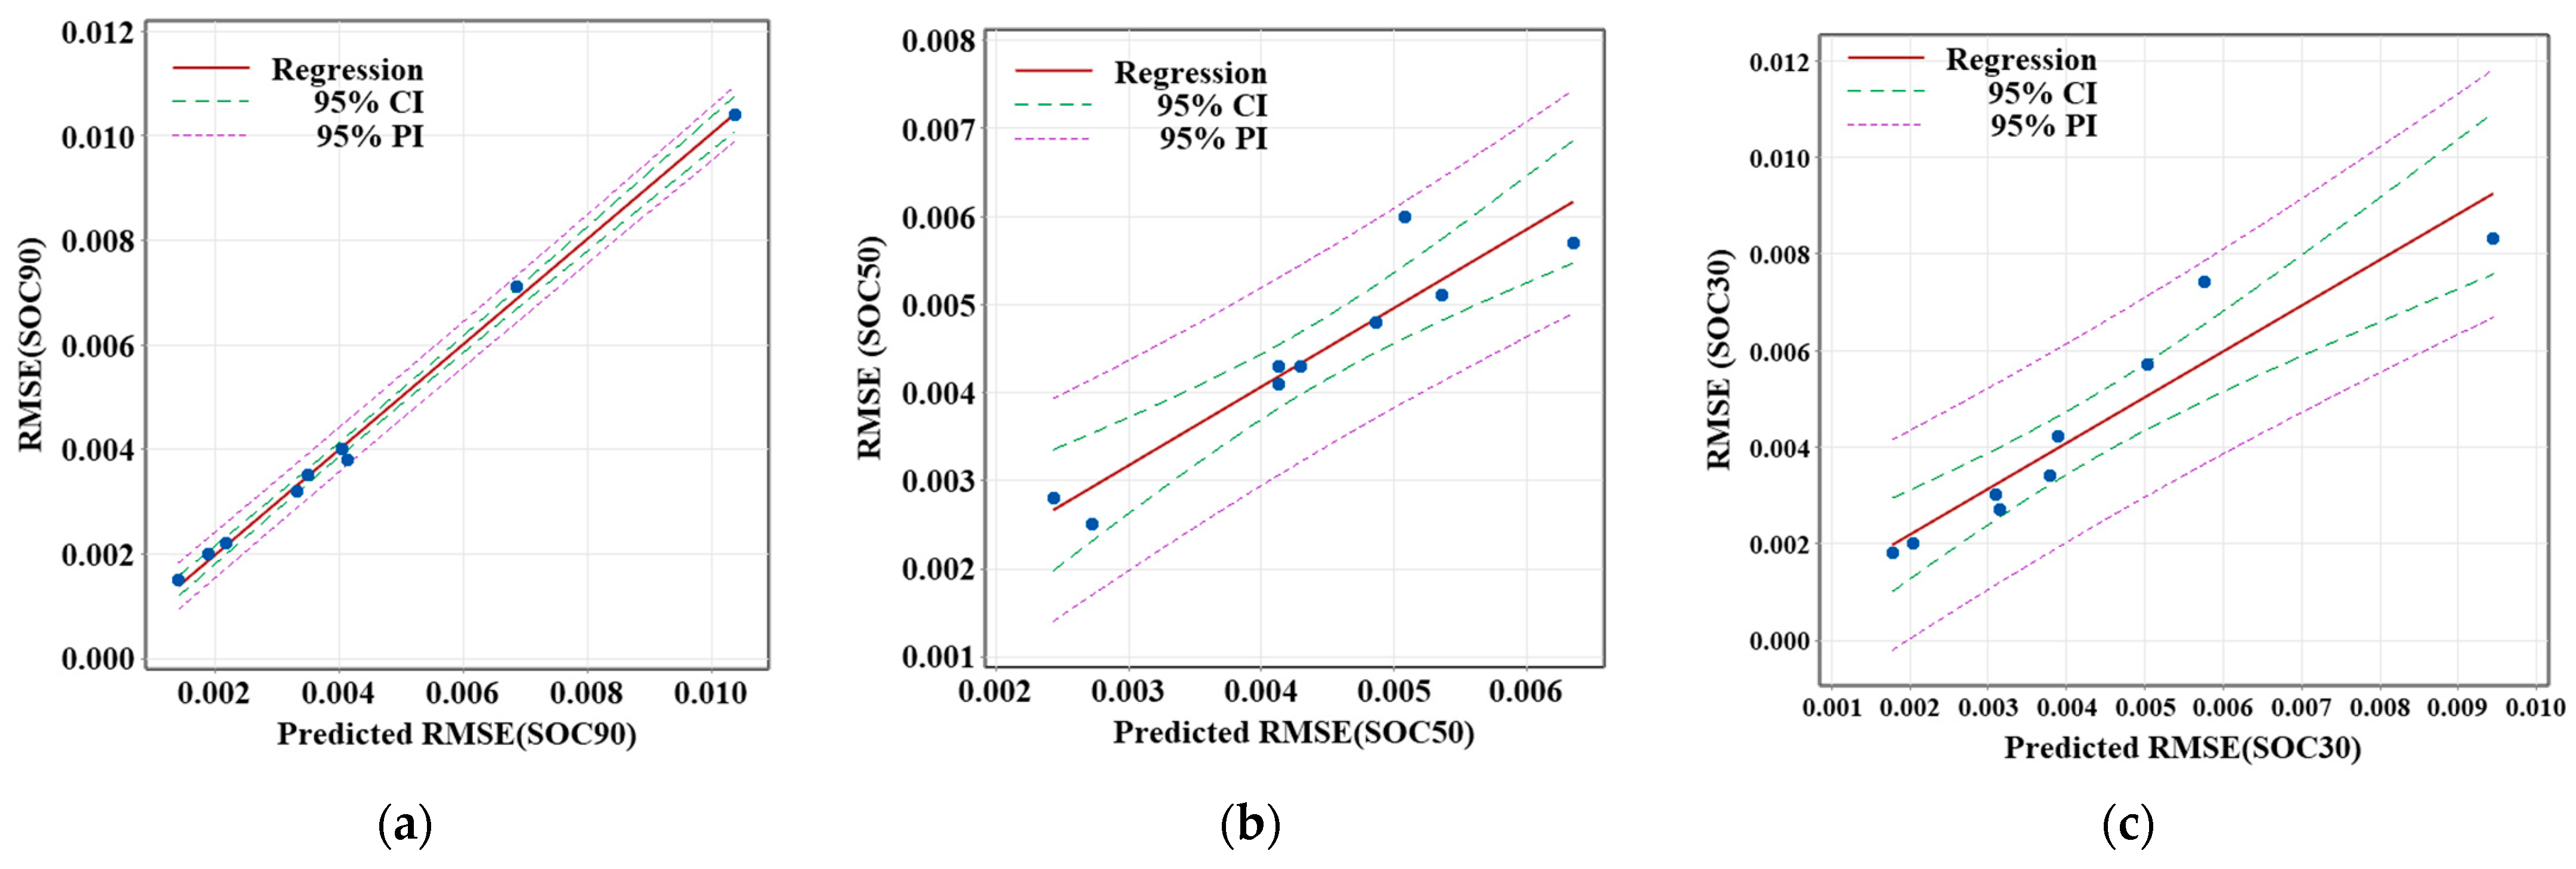
The RMSE values of different SOC values (SOC90, SOC50, and SOC30) at an ambient temperature of 25 °C are shown in
Figure 10. The regression models display positive correlations between the predicted and observed RMSE in all three plots, reflecting consistent model performance across different SOC levels. However, as seen in the −10 °C analysis, variability increases in the later stages of the discharge process, indicated by the widening of confidence and prediction intervals. In summary, the SOC estimation model demonstrates high accuracy at the beginning of the discharge process at 25 °C, but its performance declines in the later stages, particularly as the battery approaches deeper discharge.
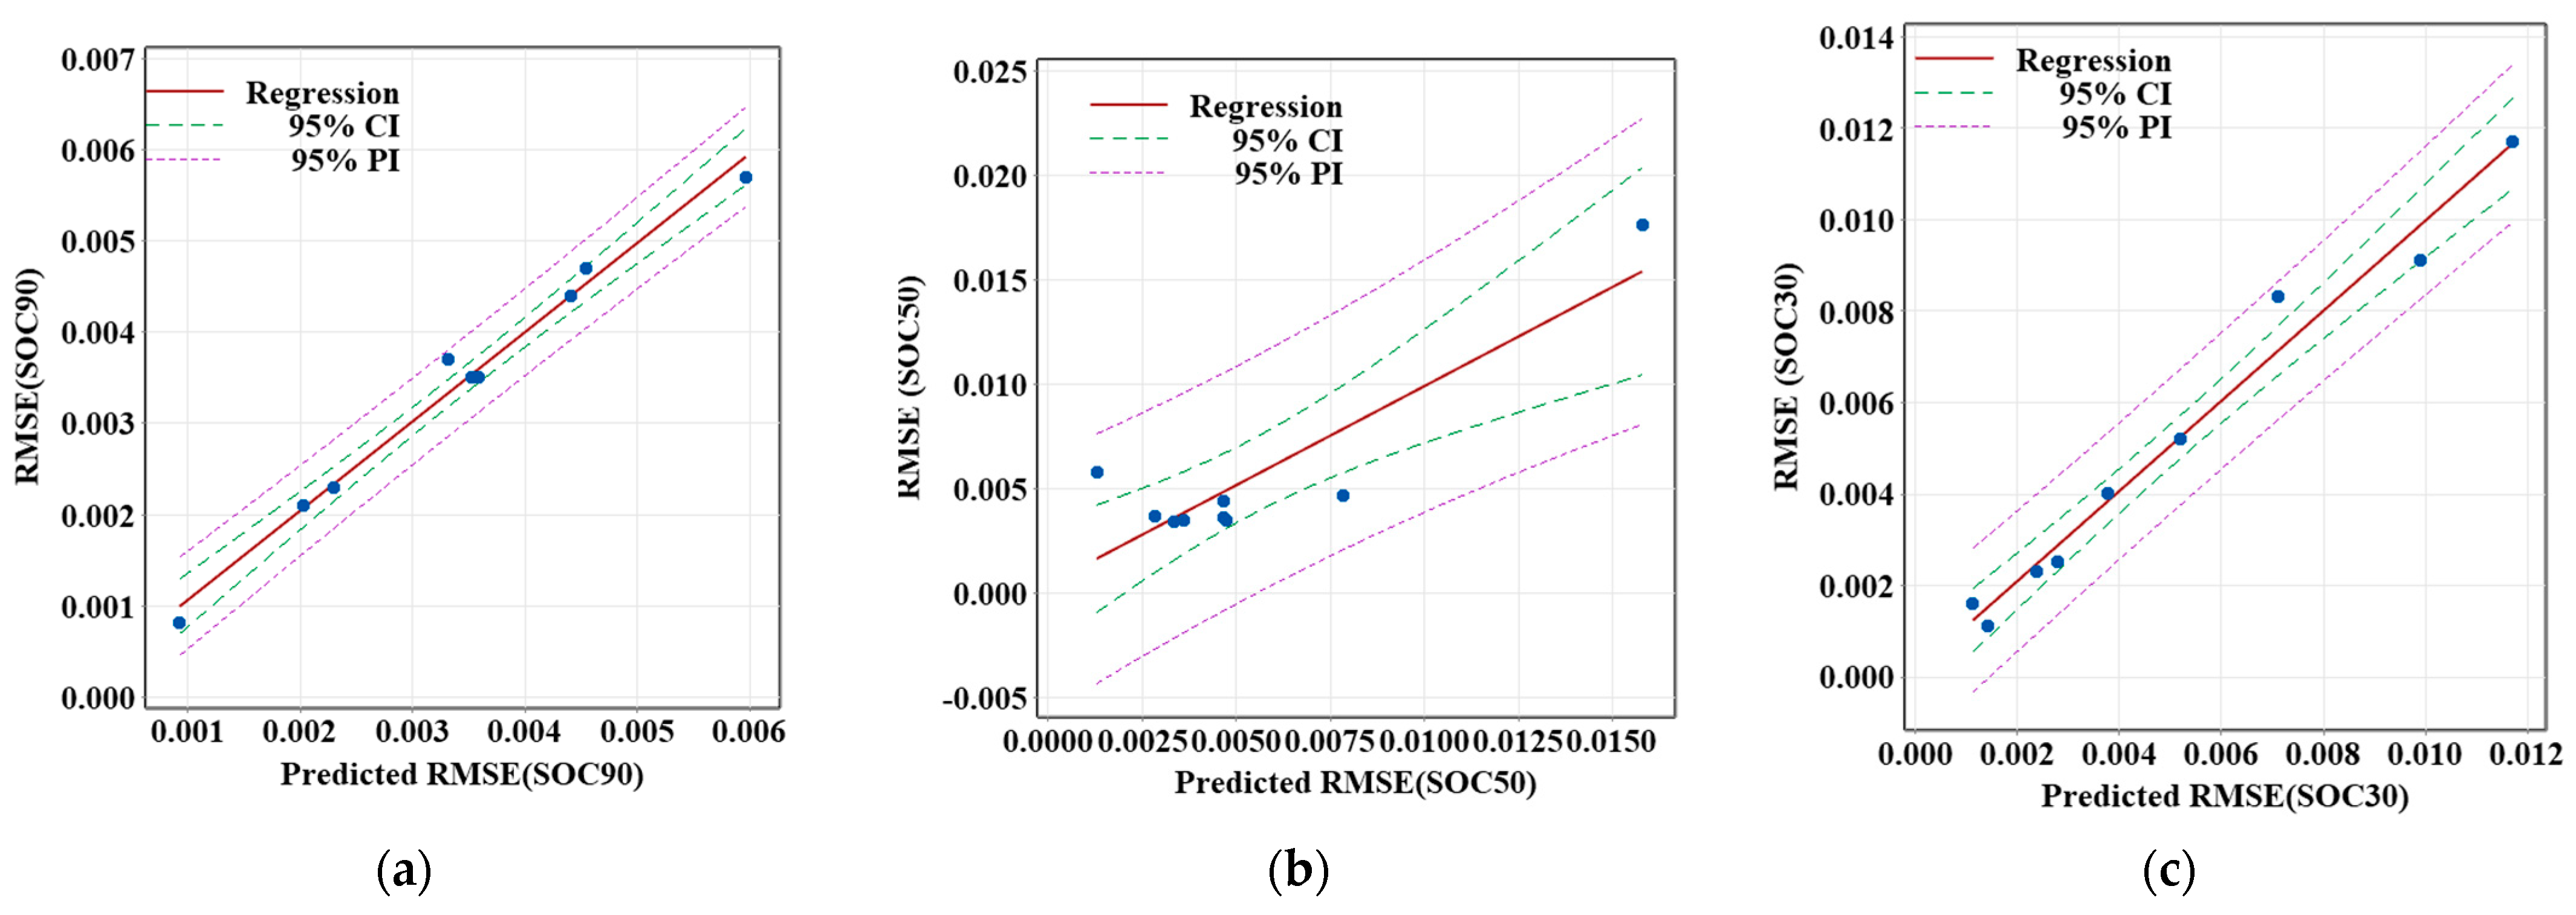
The RMSE values for various SOC values at an ambient temperature of 40 °C are given in
Figure 11. Across all stages (SOC90, SOC50, and SOC30), the data points generally follow a positive correlation, with some scatter. The 95% confidence and prediction intervals show that the accuracy of the SOC estimation decreases slightly as the battery approaches lower charge levels. However, the overall model performance remains nearly stable.
Briefly, at −10 °C, the RMSE is higher due to the increased internal resistance and more pronounced voltage drops. At 40 °C, the RMSE remains relatively low in the early stages but increases as the battery heats up, highlighting the need to account for thermal effects in the model. At lower SOC levels, this resistance increases, causing larger voltage deviations and higher RMSE, which emphasizes the importance of accurate SOC estimation models at different SOC levels.
Table 4 illustrates the ANOVA results for RMSE across different stages of battery discharge (SOC90, SOC50, SOC30) under three distinct ambient temperatures: −10 °C, 25 °C, and 40 °C. Each SOC value is analysed with respect to multiple sources of variation, including regression, pulse time gap, discharge pulse time, C-rate, rest time, and other parameters. The table indicates the percentage contribution of each source to the total variance in RMSE. The regression model consistently contributes the highest percentage to the variance in RMSE across all ambient temperatures and SOC levels, ranging from 90.42% to 99.79%, indicating that the model is the primary driver of SOC estimation accuracy. As the ambient temperature increases from −10 °C to 40 °C, the regression contribution becomes slightly higher in most cases, reflecting better model performance under higher temperatures. This suggests that the estimation model is more stable and accurate at warmer temperatures, particularly at 40 °C. The results also showed that pulse time gap and discharge pulse time significantly affect the RMSE, especially at low and high ambient temperatures (−10 °C and 40 °C). The contribution of these parameters (pulse time gap and discharge pulse time) also varies based on the battery’s SOC levels. At higher SOC levels (SOC 90%), the battery voltage is closer to its maximum, and the electrochemical reactions are more stable. In this state, the battery is less sensitive to changes in pulse time gap and discharge pulse time. However, at extreme temperatures, especially at −10 °C, even at high SOC, increased internal resistance causes the battery to struggle with large pulse durations, resulting in higher RMSE values. At mid SOC levels (SOC 50%), the battery begins to experience more significant voltage drops as the available charge decreases. The effects of both pulse time gap and discharge pulse time become more pronounced in this range, especially at low temperatures, where voltage drops due to increased resistance can be severe if the pulse duration is too long or the time gap between pulses is too short. Similarly, at high temperatures, extended discharge times at mid SOC can cause thermal runaway, impacting RMSE. At low SOC levels (SOC 30%), the battery voltage is already near its cutoff threshold, and any additional stress due to inappropriate pulse durations or insufficient recovery time between pulses can cause sharp voltage drops, increasing the RMSE. At low temperatures, the battery becomes more susceptible to issues with voltage predictions as a result of its elevated internal resistance. Similarly, at high temperatures, the increased electrochemical activity makes the battery more sensitive to pulse time changes.
3.2. SOC Estimation Results
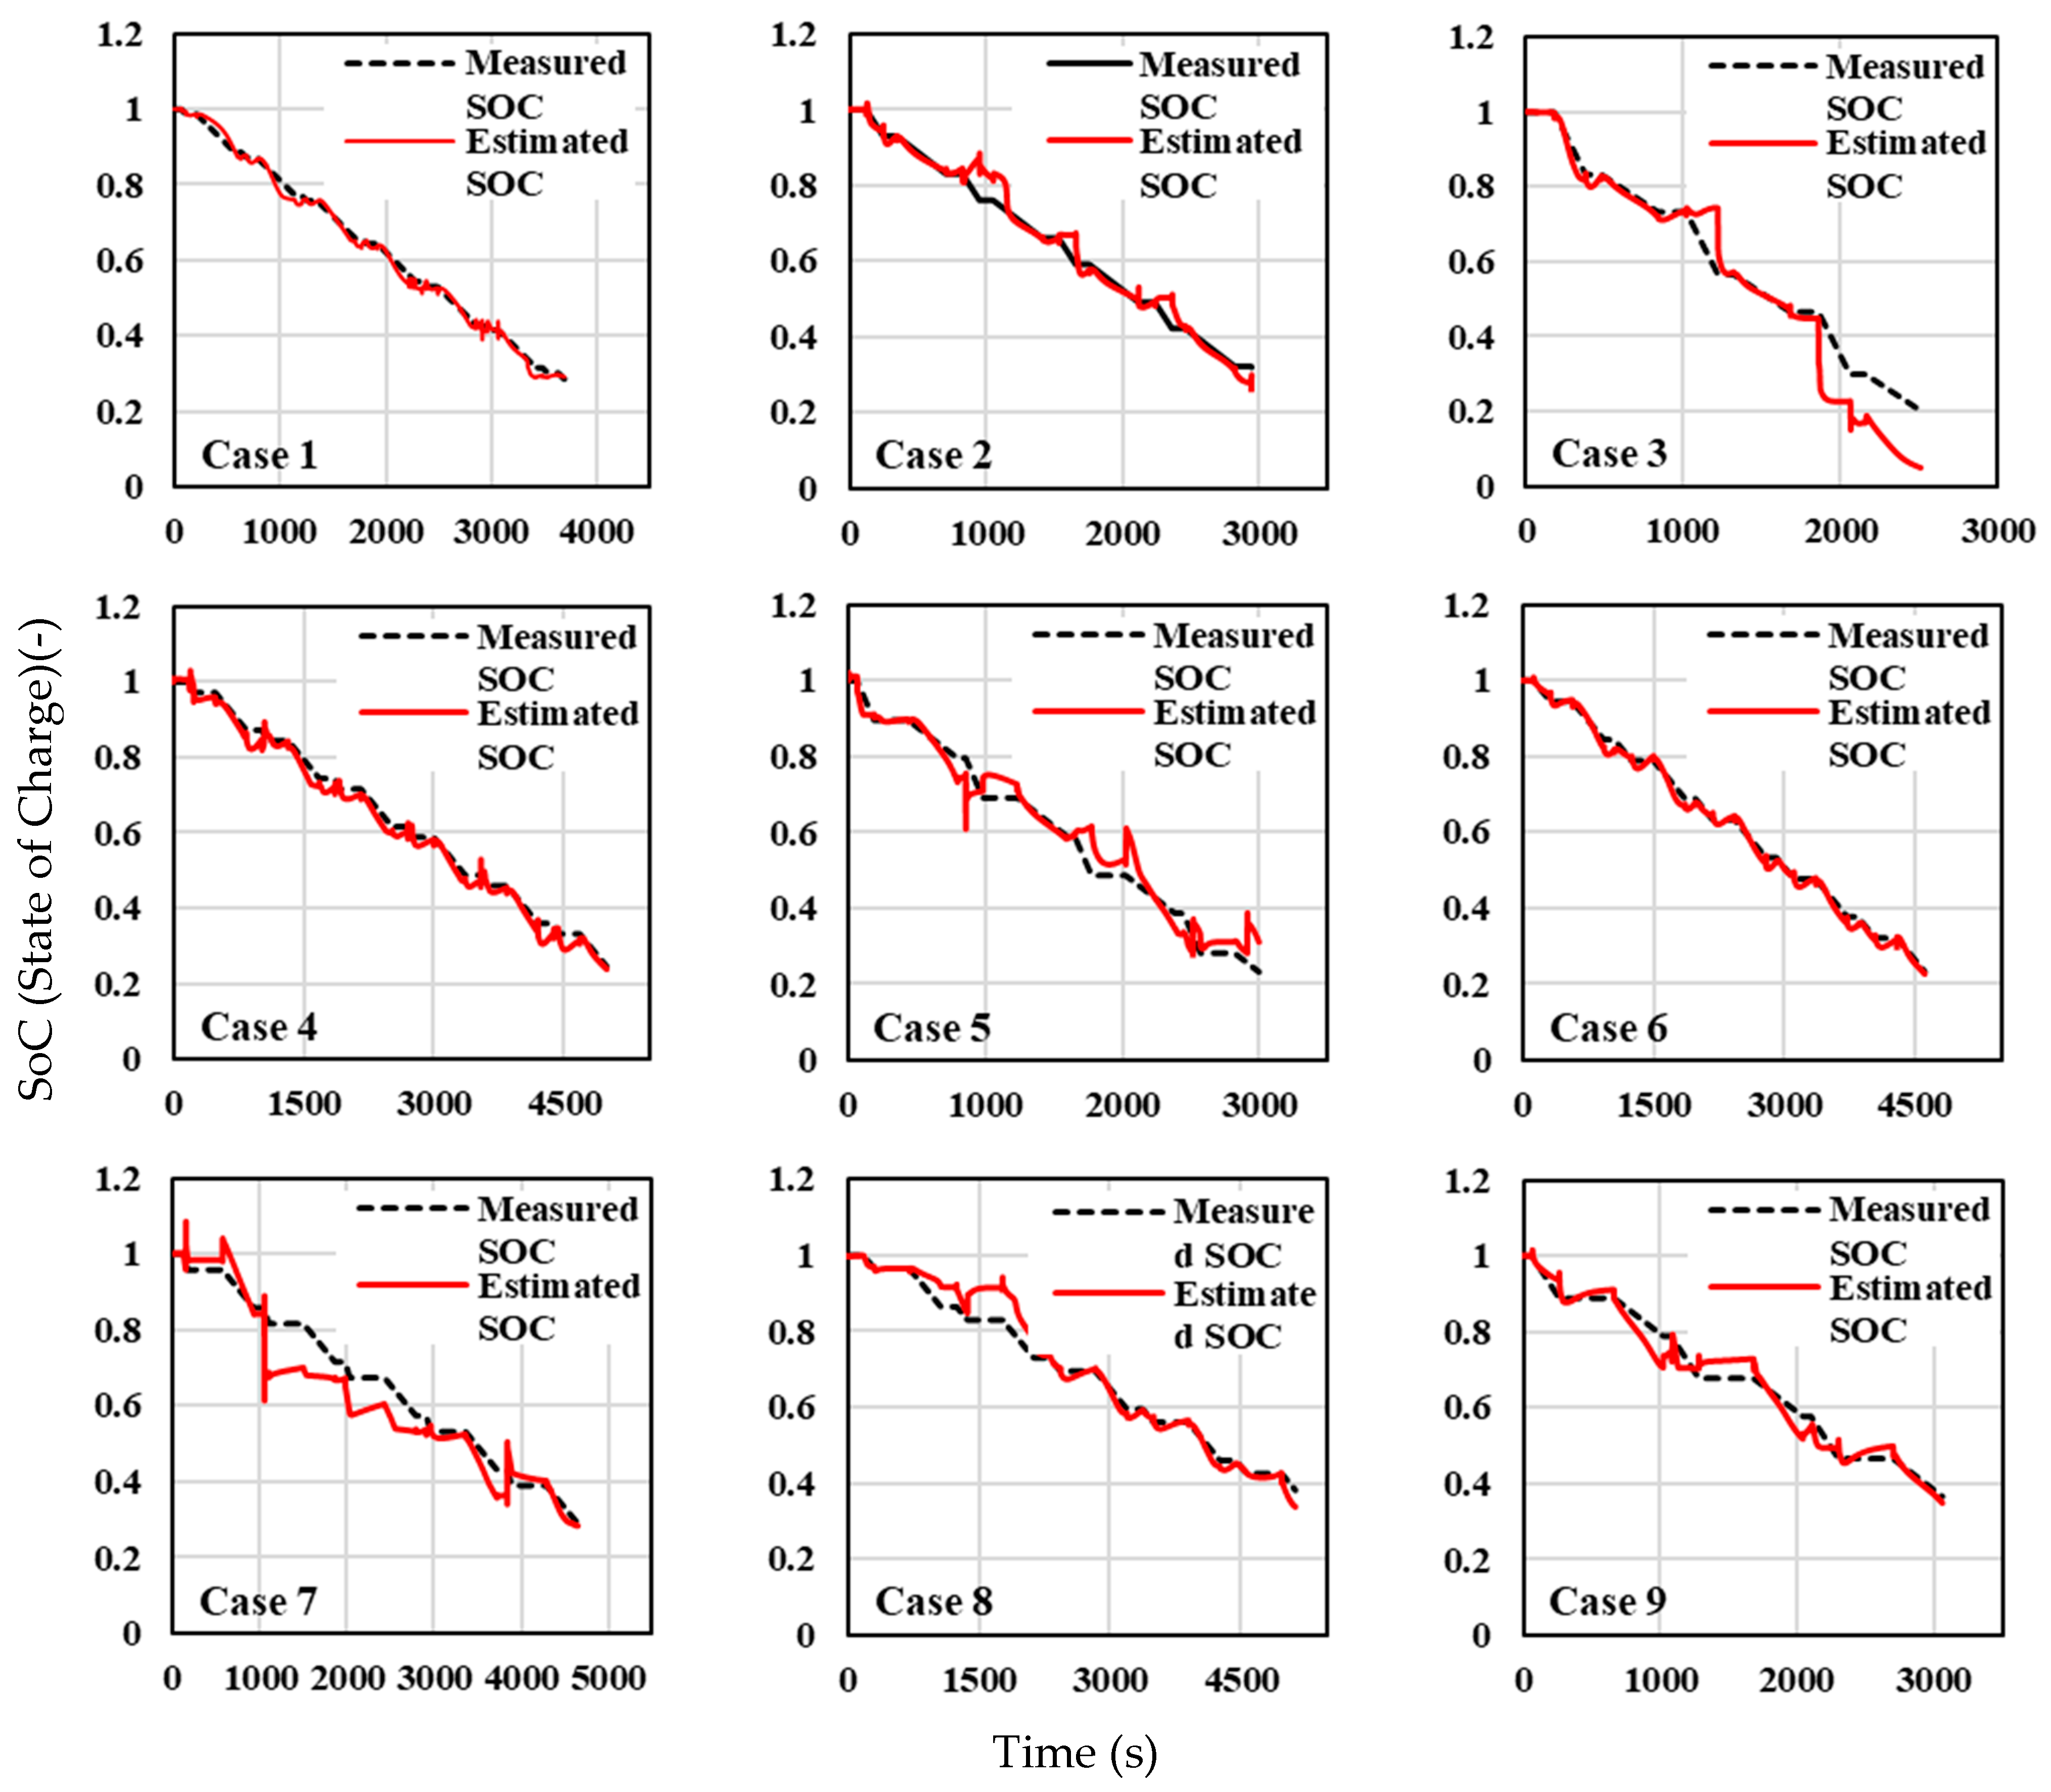
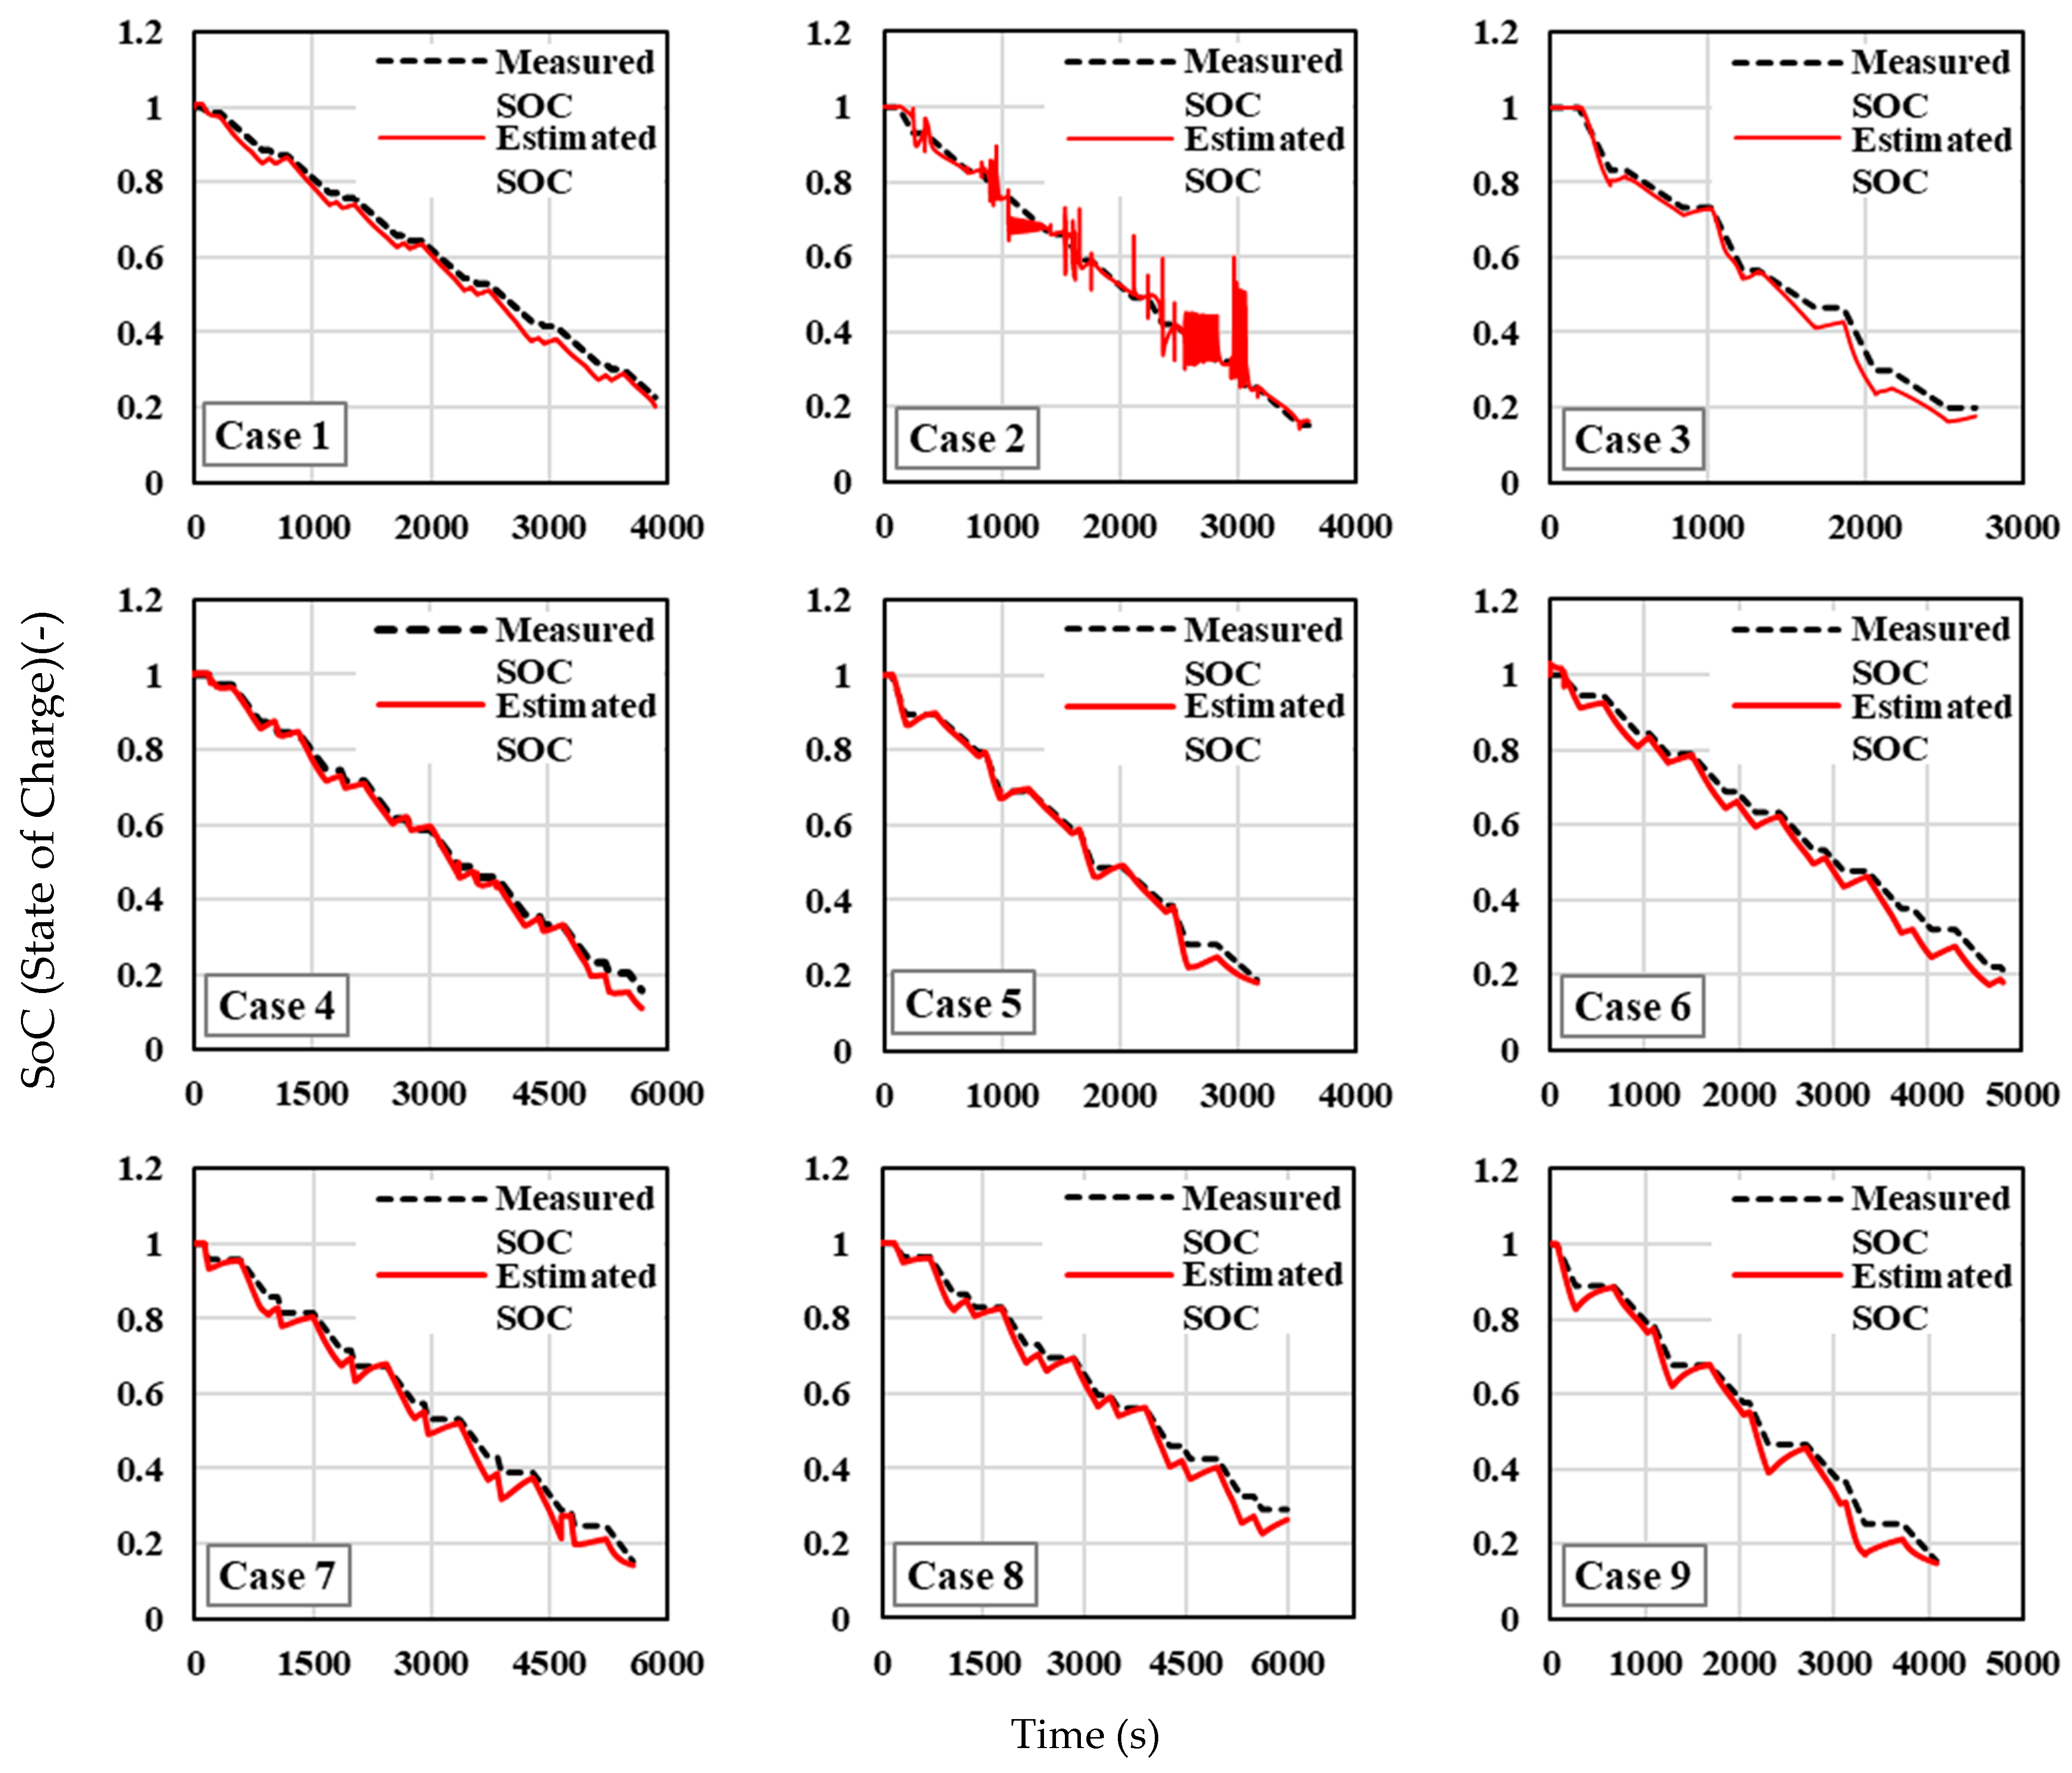
Figure 12,
Figure 13 and
Figure 14 show the SOC estimation compared against the measured SOC values for different test cases under ambient temperatures of −10 °C, 25 °C, and 40 °C, respectively. At an ambient temperature of −10 °C (
Figure 12), across all cases, both the measured and estimated SOC curves display a downward trend as time progresses, indicating that the SOC decreases steadily, consistent with battery discharge behaviour under cold conditions. The estimated SOC generally tracks the measured SOC, though there are deviations in some cases that need closer inspection. The SOC estimation methodology performs reasonably well for the majority of cases, with minimal deviations between the estimated and measured values in many instances, especially at the beginning and middle stages of the discharge process. However, cases, such as Case 2, Case 3, Case 5, and Case 7, exhibit more significant deviations, particularly in the middle and later stages of the discharge cycle, highlighting potential weaknesses in the parameter identification or the effects of extreme temperatures (−10 °C) on battery performance. The recurring deviations at the end of the discharge cycles across several cases suggest that the model’s accuracy could be improved with better handling of SOC dynamics during the final phase of the battery’s discharge.
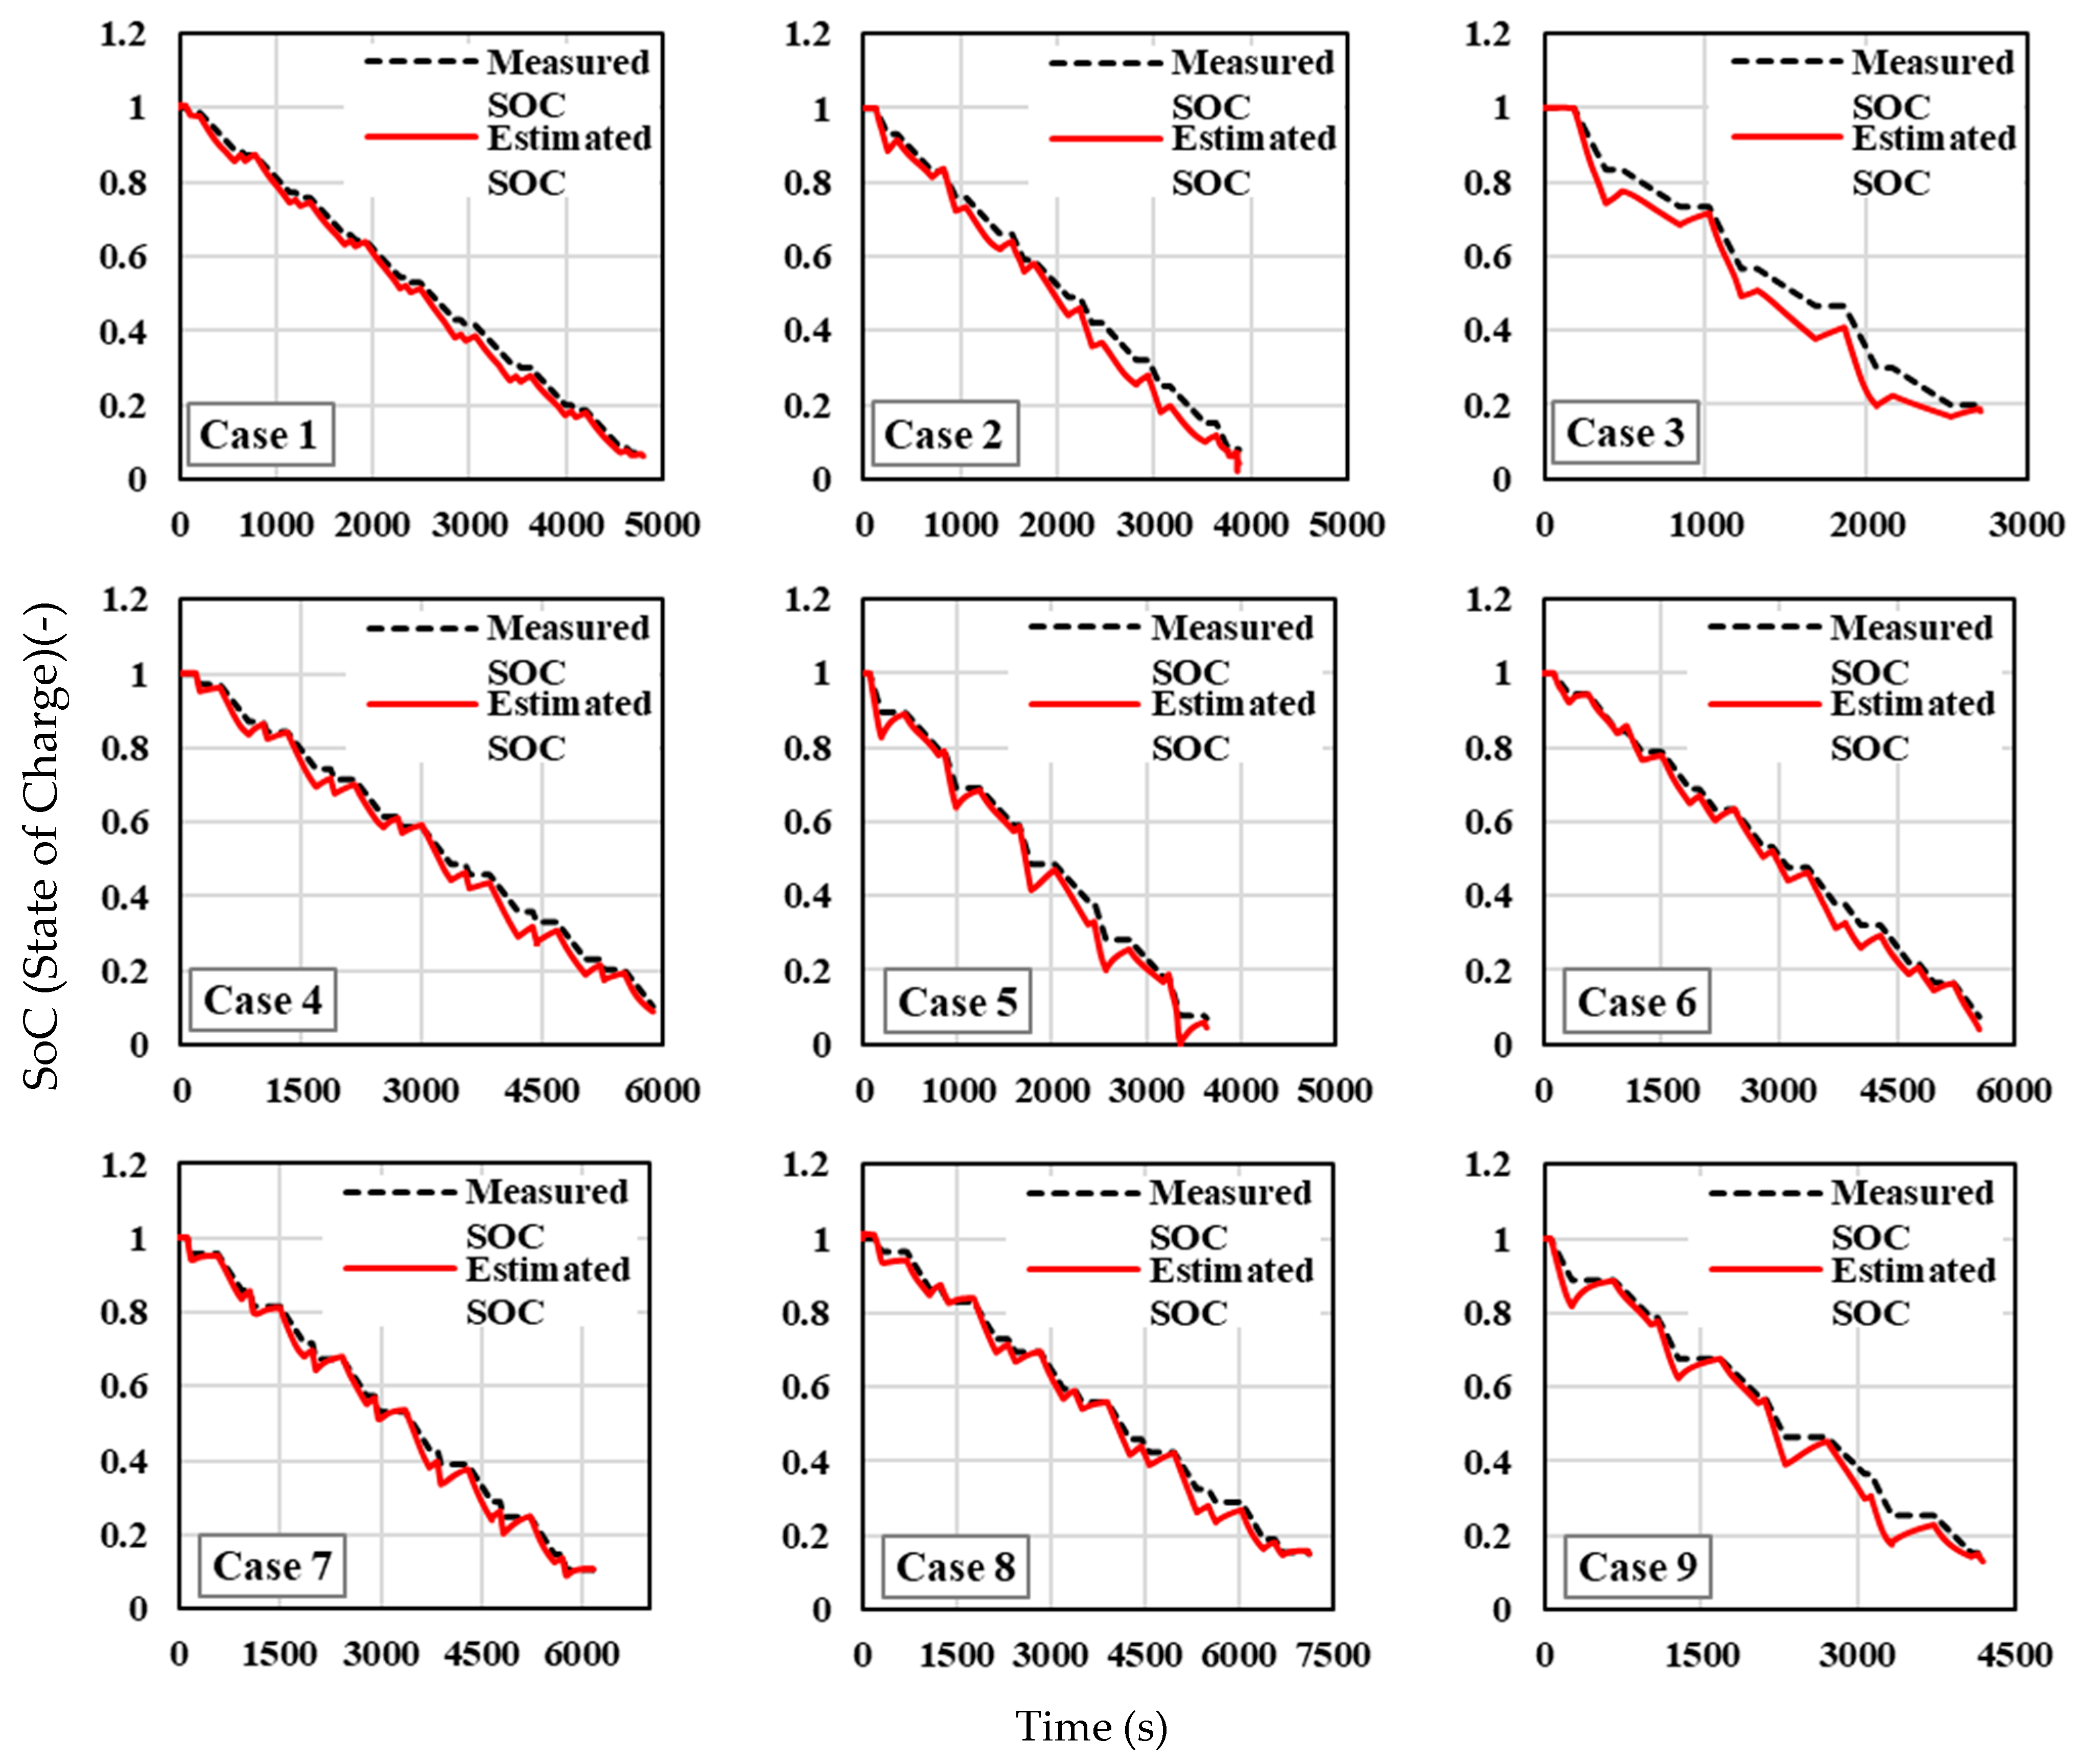
The estimated SOC against the measured SOC for different cases at an ambient temperature of 25 °C is given in
Figure 13. This represents a more moderate, favourable operating temperature for lithium-ion batteries compared to the previous analysis at −10 °C and, as a result, the SOC estimation performance under these conditions is expected to improve due to more stable electrochemical activity in the cells. The estimated SOC curves in most cases are more closely aligned with the measured SOC values, indicating that the parameter identification process is more reliable under these moderate-temperature conditions. However, deviations still exist in certain cases, particularly in dynamic operating conditions. Case 1, Case 4, and Case 5 exhibit nearly perfect SOC tracking, suggesting that the model performs optimally in these scenarios. Case 2 presents an exception, with significant noise or instability in the middle of the discharge process, which may indicate an issue with the sensor data or a model mismatch under certain dynamic operating conditions. For the other cases, the SOC estimation is accurate during the earlier and middle stages, with some deviations towards the end of the discharge cycle.
High ambient temperatures generally accelerate electrochemical reactions in lithium-ion batteries, potentially leading to faster discharge and increased errors in SOC estimation models due to thermal effects. At an ambient temperature of 40 °C, the SOC estimation curves still follow the measured SOC closely, but there are instances where the deviation between the estimated and measured SOC increases, particularly in cases involving significant dynamic variations (
Figure 14).
The SOC estimation model generally performs well, though the higher temperature appears to introduce more noticeable deviations in some cases, particularly during the middle and later stages of the discharge process. Case 1, Case 4, and Case 7 maintain high accuracy throughout the discharge cycle, indicating that the SOC estimation model is robust under high-temperature conditions for certain battery dynamics. Case 2, Case 5, Case 6, and Case 9 show deviations that become more pronounced in the later stages of the discharge. In Case 3, the model shows overprediction, reflecting that thermal effects at 40 °C are not fully accounted for, leading to increased errors during periods of dynamic battery behaviour.
Briefly, during the middle and later stages of discharge, the battery experiences a possible increase in internal resistance due to the polarization of active material. This phenomenon is more pronounced in certain cases where the discharge pulses are more aggressive (e.g., higher C-rates, longer discharge pulse times). As the discharge progresses, especially at lower SOC levels, the accumulation of polarization effects creates voltage drops, which lead to deviations between the measured and estimated SOC values. Additionally, as the SOC decreases, the battery approaches its cutoff voltage, and charge transfer resistance increases. This contributes to the observed deviations in the voltage response during the final discharge stages. The operating temperature plays a significant role in the accuracy of SOC estimation, as said before. In cases where the battery is tested at extreme temperatures (e.g., −10 °C or 40 °C), thermal effects lead to deviations. At low temperatures, the battery’s ionic mobility is reduced, leading to slower reaction kinetics and higher internal resistance, particularly during the final stages of discharge when the battery is already under stress. These combined effects cause the battery voltage to deviate more significantly from the expected behaviour. At high temperatures (40 °C), the battery experiences faster electrochemical reactions and potential thermal degradation, which can cause voltage drifts or inconsistencies in the SOC estimation. The deviations in these cases during the final stages can be attributed to accelerated capacity loss and self-discharge at elevated temperatures. Also, the deviations in cases can also be linked to the rest time allowed between pulses. During rest periods, the battery undergoes charge redistribution and voltage recovery as it equilibrates after a high-power discharge. In cases where the rest time is too short, the battery does not fully recover, leading to deviations in the SOC estimation due to an incomplete relaxation of the battery’s voltage.
Table 5 presents the variation in the measured property across distinct temperature levels (−10 °C, 25 °C, and 40 °C). At −10 °C, the recorded values span from 0.0167 to 0.0802, with Case 3 exhibiting the highest value, implying a greater sensitivity to lower temperatures. At 25 °C, the range becomes narrower, between 0.0207 and 0.0371, indicating more stable behaviour at moderate temperatures. At 40 °C, a moderate increase in variability is noted, with values ranging from 0.0231 to 0.0611, where once again, Case 3 registers the highest measurement.
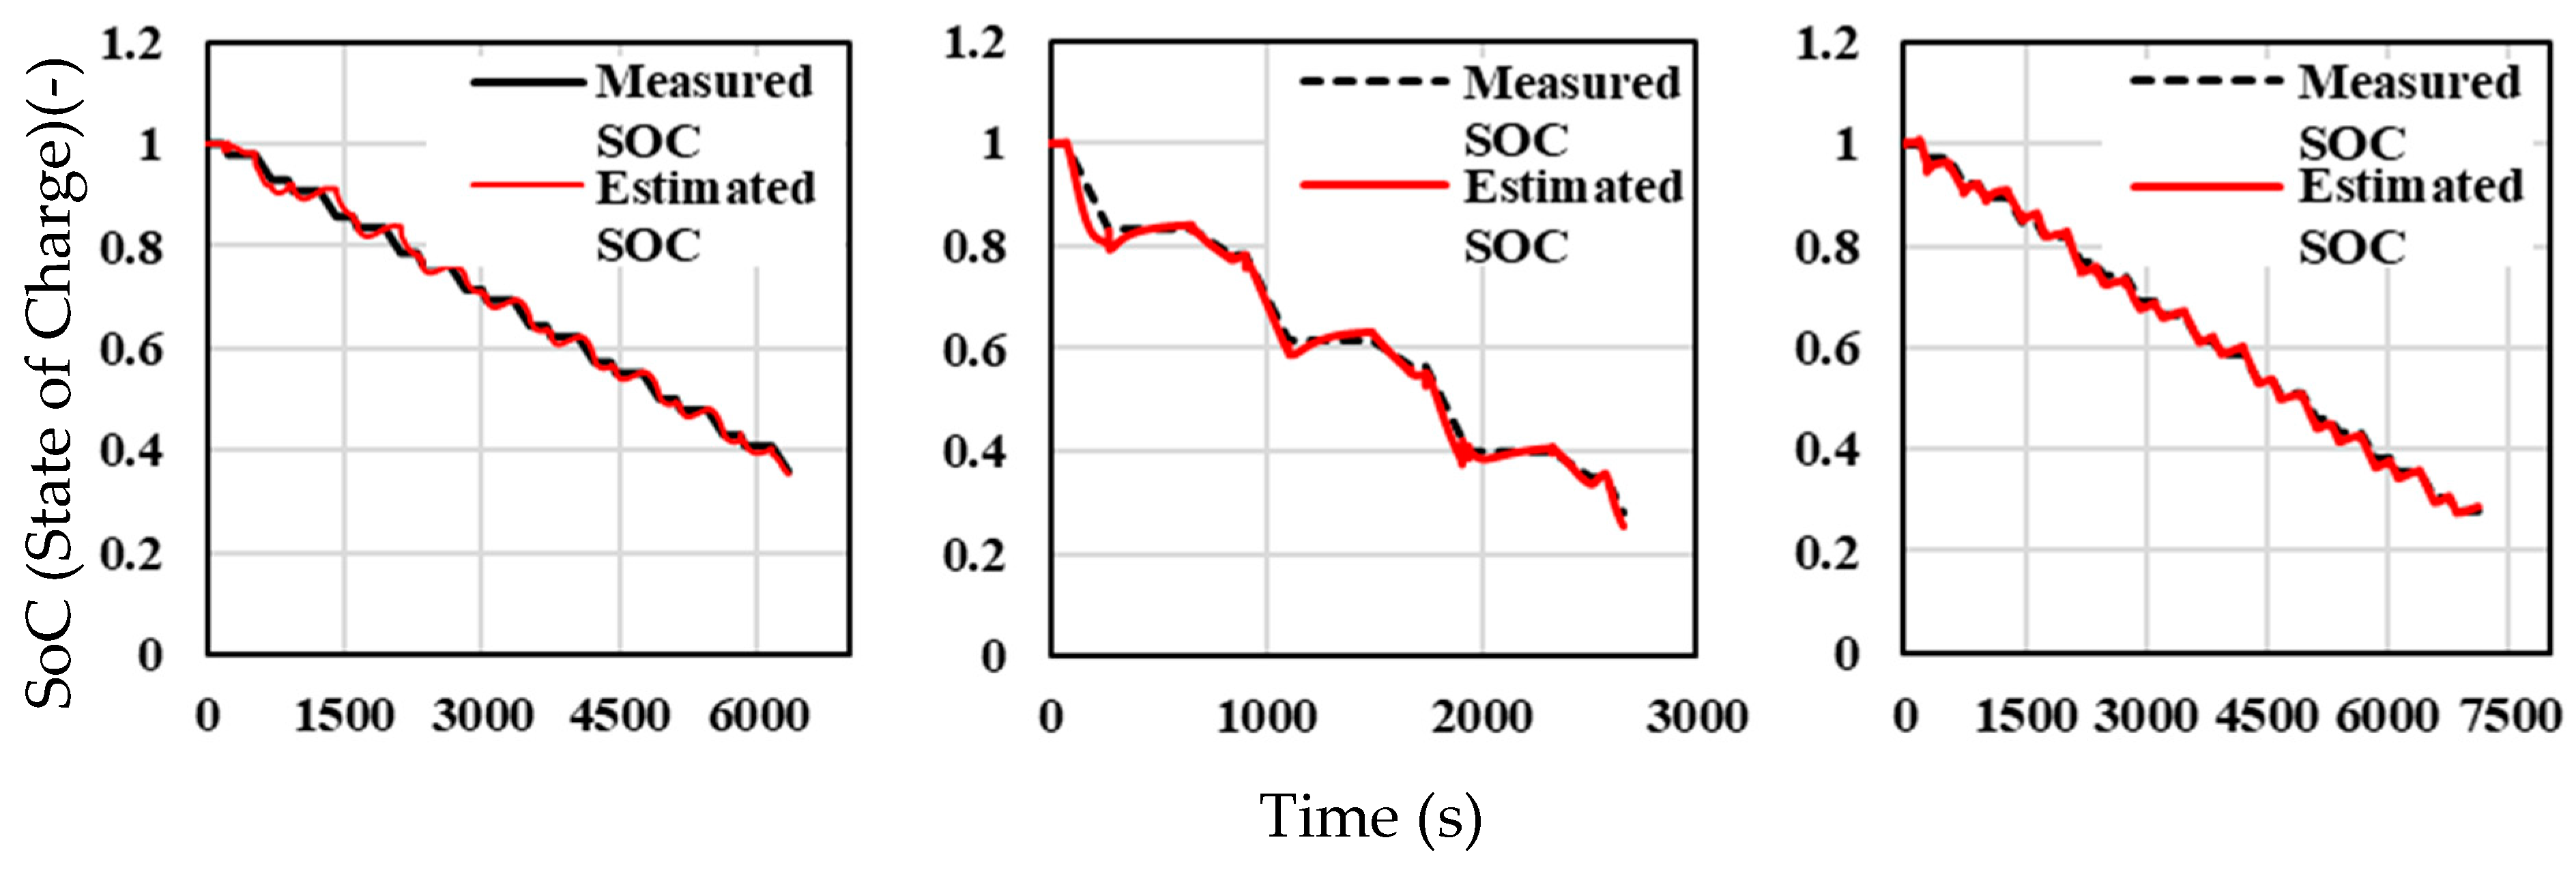
Figure 15 presents the SOC estimation performance under optimal input conditions at three distinct ambient temperatures. Across all three temperature conditions, the SOC estimation follows the general trend of the measured SOC with good alignment. The SOC estimation model performs optimally at 40 °C, with strong alignment between the estimated and measured SOC. This suggests that the model functions well under conditions where the battery experiences higher levels of electrochemical activity.
The RMSE values corresponding to the three temperature levels (−10 °C, 25 °C, and 40 °C) are presented in
Table 6. The data reveal that the error is lower at −10 °C (0.0144) and 40 °C (0.0105), with a moderate increase observed at 25 °C (0.0197). In comparison with the results shown in
Table 5, there is a significant reduction in RMSE, indicating improved performance under optimized conditions. This reduction in error underscores the enhanced reliability of the system across varying temperature conditions following optimization. These findings highlight the critical role of optimization in minimizing fluctuations and improving the overall stability of the system.
The SOC estimation model developed for a single lithium-ion cell can be scaled to battery packs, which are composed of many cells connected in series and parallel configurations. However, larger battery packs introduce non-uniformities between individual cells, which can affect SOC accuracy. These non-uniformities arise due to differences in cell aging, temperature gradients, and manufacturing tolerances, leading to deviations in the performance of individual cells within the pack. If the SOC estimation model is applied without accounting for cell balancing and cell-to-cell variability, the SOC predictions at the pack level may be inaccurate. For example, under dynamic loading conditions or extreme temperatures, certain cells within the pack may experience higher internal resistance or capacity fade than others, causing the pack-level SOC estimation to deviate from the true state of the individual cells. Temperature gradients are more pronounced in larger battery packs because cells in the centre of the pack may heat up more quickly due to limited cooling, while cells near the edges may stay cooler. As temperature significantly affects the internal resistance, polarization, and overall electrochemical behaviour of lithium-ion cells, this introduces additional complexities in maintaining accurate SOC estimation across the pack. Also, cell balancing becomes more crucial in large battery packs to maintain consistent SOC across all cells. Passive and active balancing strategies can be employed to equalize the SOC and voltage drift between cells. If the SOC estimation model and HPPC parameters are scaled up without considering the balancing mechanisms, the deviations between individual cells’ SOC values can accumulate, leading to inaccurate pack-level SOC predictions.
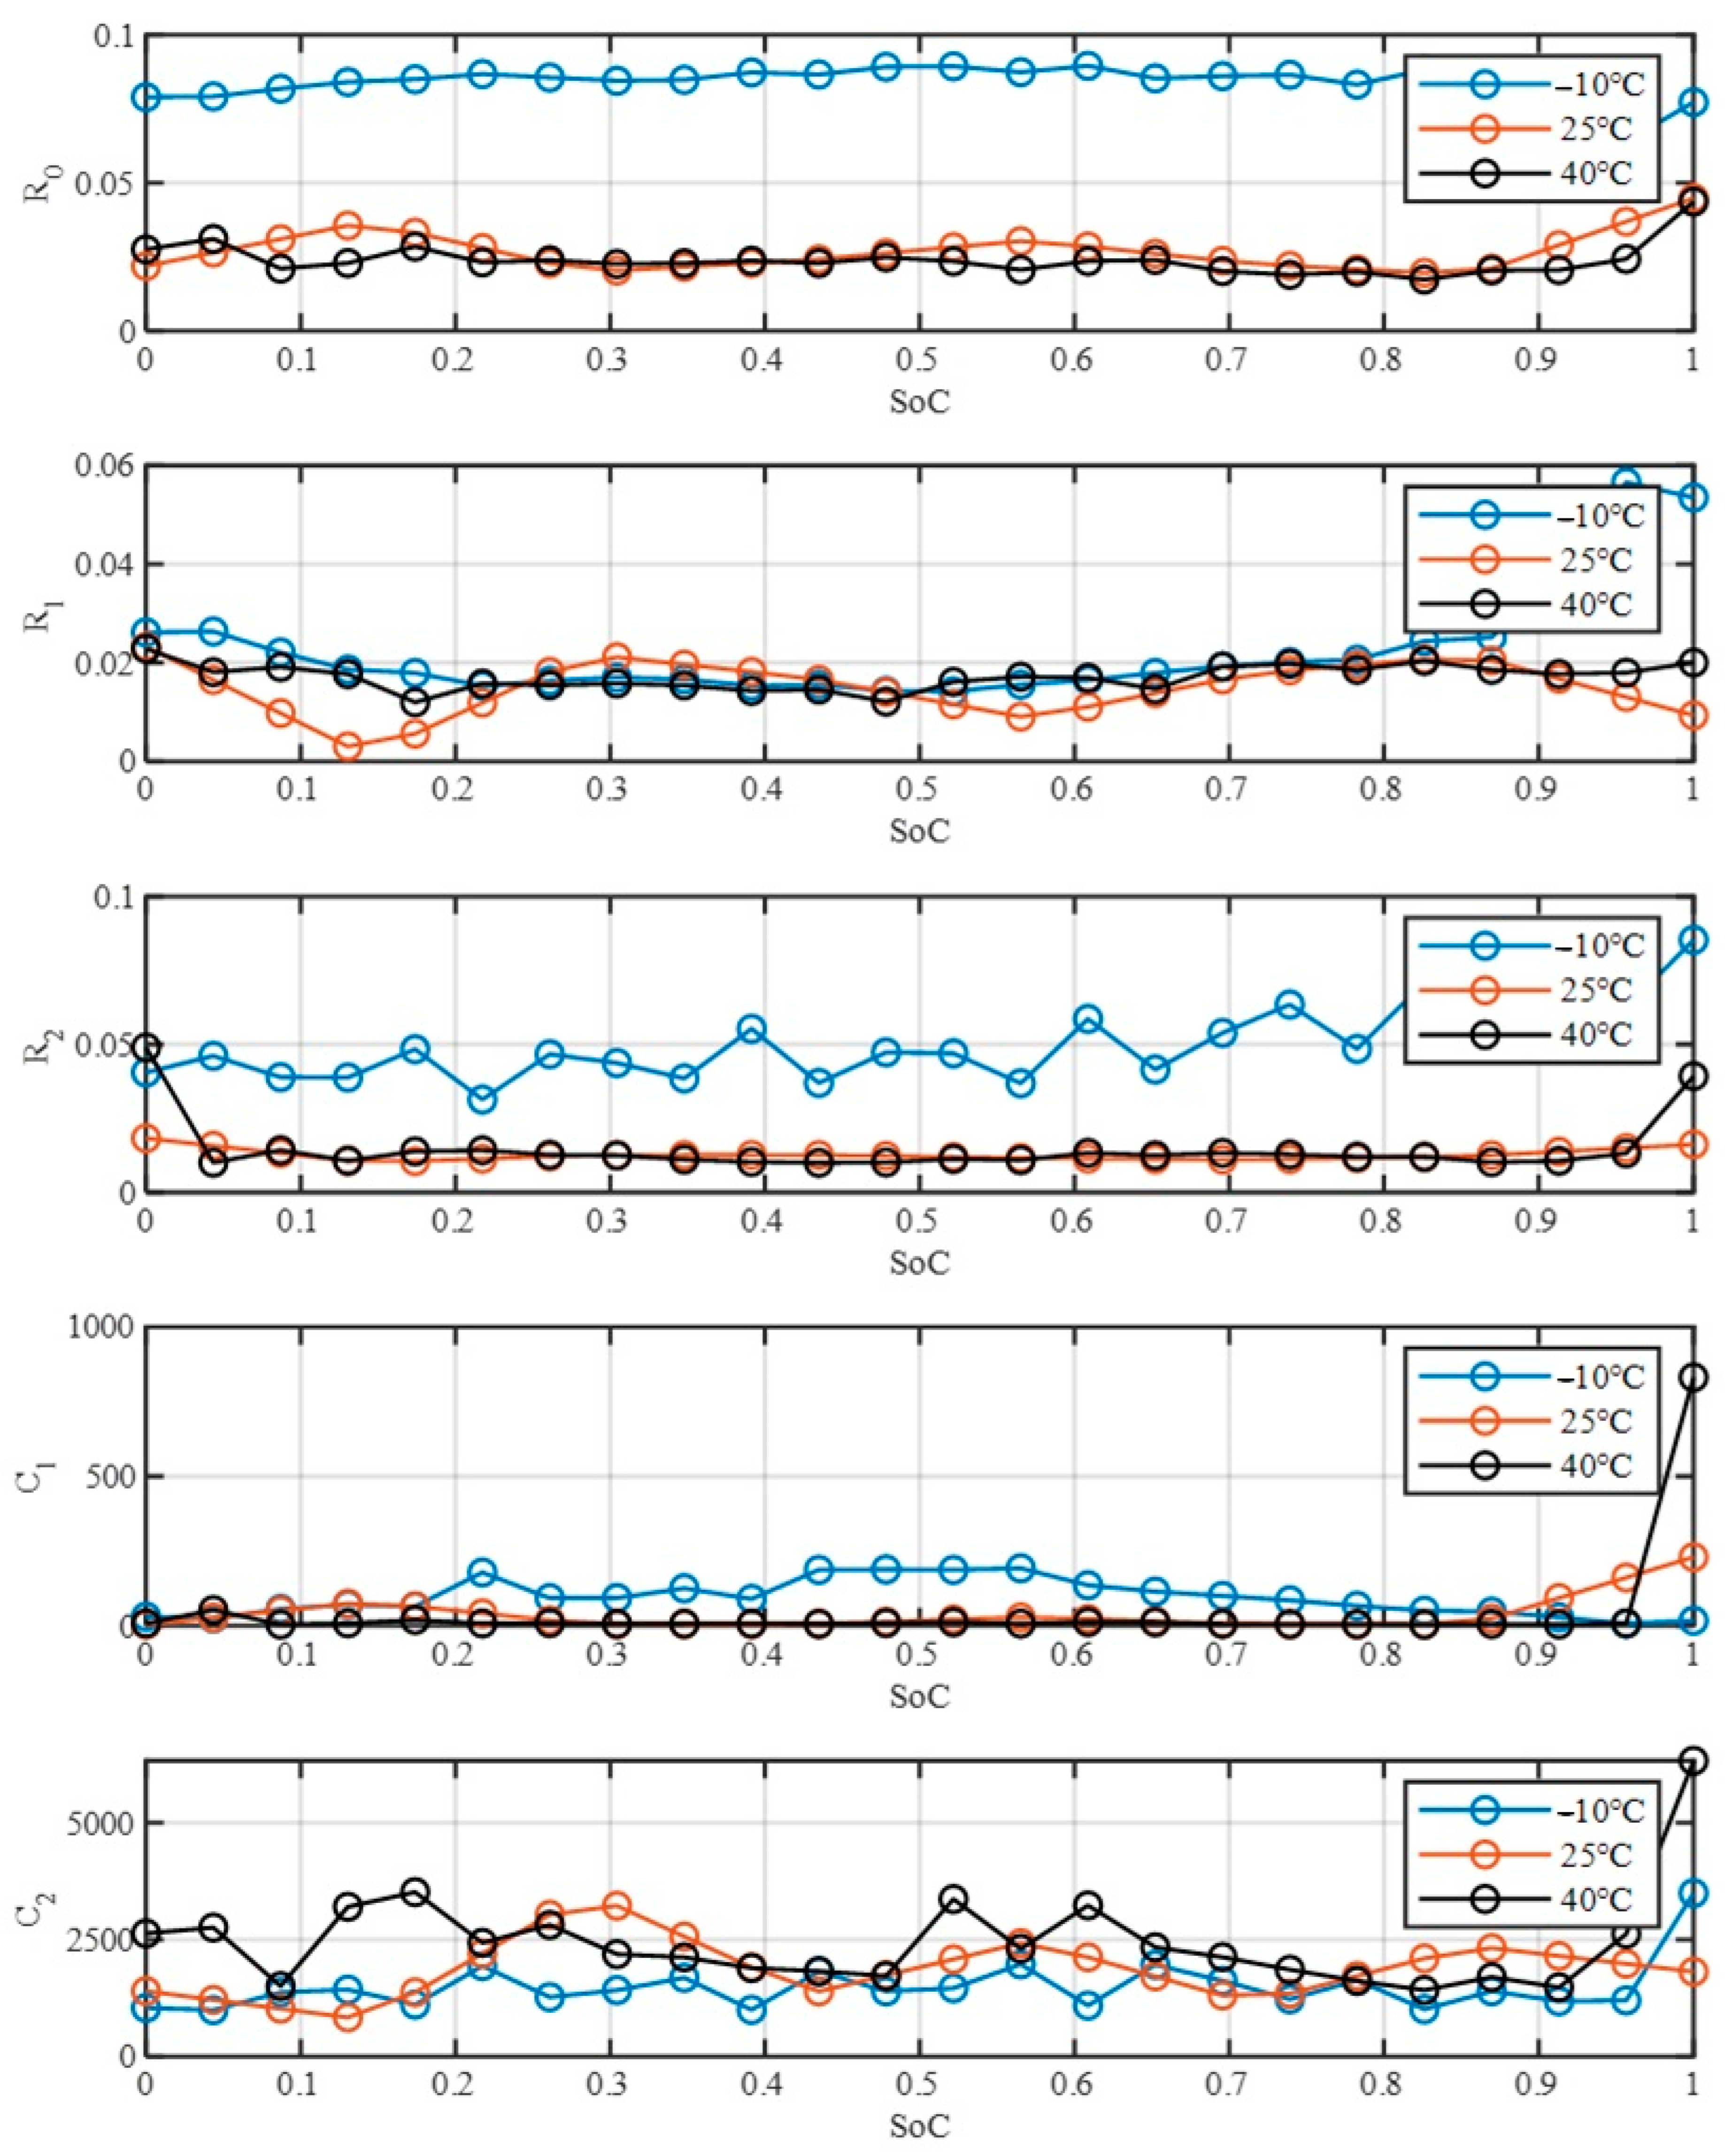
Figure 16 illustrates the variation in electrical parameters (R
0, R
1, R
2, C
1, and C
2) of ECM as a function of SoC for three different temperature conditions: −10 °C, 25 °C, and 40 °C. It is evident from the plots that temperature significantly affects the parameters, particularly at lower SoC levels, with R₀ and R₁ demonstrating more pronounced fluctuations under different temperatures. The capacitive components, C
1 and C
2, exhibit relatively larger magnitudes but appear to be less sensitive to temperature variations compared to the resistive components.


