1. Introduction
The integration of shared bicycles with public transportation has effectively addressed unmet travel needs and alleviated the pressure on public transit systems. This service model is particularly important in urban transportation because it provides convenient feeder services from residential areas to main public transit lines, especially where there are large intervals between long-haul transit stations. Research suggests that the development of shared bicycle systems has provided a strong complementary feeder service to public transportation, forming a multilevel and three-dimensional transportation network together with short-distance buses, enhancing the flexibility and efficiency of urban transportation [
1]. However, as the market becomes increasingly saturated, competition among shared bicycle operators becomes more intense [
2,
3,
4]. To capture a larger market share in the competition and maximize profits, operators need to continuously optimize their operational strategies. Therefore, studying the competitive dynamics among shared bicycle operators is of great significance.
The development of the shared bicycle market can be traced back to Europe in 2007, and it rapidly expanded in China. Mobike, Ofo, and other companies have rapidly emerged and obtained a large amount of financing. However, excessive advertising has led to oversupplies in the market, high operating costs, and many companies are facing financial difficulties or even bankruptcy. Currently, the three brands of Meituan Bike, Hello Bike, and Qingju Bike are gradually emerging, forming a three-legged competitive landscape in China. According to the latest market research data, Meituan Bike leads with a selection rate of 64.52%, followed closely by Hello Bike and Qingju Bike with selection rates of 57.32% and 47.22%, respectively [
5]. An interesting phenomenon is that between residential areas and the nearest bus or subway stations, there are often only two types of shared bicycles providing services. These two types of shared bicycles are usually affiliated with different operators, and their competition can increase market share, improve service quality, and may also lead to some market adjustments and optimizations. The existing market players mainly achieve sustainable operation and profit maximization by improving service quality, optimizing scheduling, and reducing operating costs.
Profit maximization is one of the fundamental goals of shared bicycle operators and a core concept in microeconomics. According to classical economic theory, businesses adjust the production factors and resource allocation to achieve maximum profits [
6]. In the field of shared bicycles, factors affecting profits mainly include the quantity of bicycles deployed, user demand, the maintenance and management costs of the bicycles, pricing strategies, etc. However, excessive competition in quantity may lead to issues such as resource waste, increased pressure on urban management, and a decline in user experience. Scholars and researchers have recognized the issue of rampant competition in the shared bicycle industry and suggested that government oversight and regulatory measures should be employed to curb this excessive rivalry [
3,
7,
8]. It appears that a more effective approach might lie in enhancing the self-awareness of companies within the industry to avoid market disorder preemptively, thus preventing the negative consequences that often arise from unbridled competition.
This paper assumes that there are only two types of shared bicycles available between residential areas and the nearest subway or bus stations. The main difference between the two types of shared bicycles is their comfort level, such as whether there are insulation pads on the seats. And the operator’s revenue only considers self-ticket revenue. An operator is trying to attract more potential users through discounts. This paper aims to delve into the complex dynamics of a nonlinear duopoly game, with a focus on how the participating operators, as the players, leverage demand as a central factor in their strategic decision-making process. By constructing a nonlinear duopoly game model, the research treats demand as the key decision variable for operators. It also incorporates the effects of discounts and comfort loss costs on both the operators and the broader shared bicycle market. Finally, it provides suggestions for shared bicycle operators that are exploring more sustainable and orderly development.
This paper presents the following key contributions in terms of methodology and policy recommendations. This study is one of the first studies to explore the dynamic competitive effects in the field of shared bicycles. When constructing a model of potential user demand in the duopoly market of shared bicycles, we innovatively included discounts and comfort loss costs as part of the generalized travel costs for passengers. Furthermore, this study analyzed the, as well as the impact of comfort loss costs, discounts, passenger travel time costs, and travel distance on system stability through bifurcation diagrams. Ultimately, we also examined the impact of operators’ dynamic adjustment strategies on market competitiveness. The results reveal that excessively high discounts and comfort loss costs may disrupt the stability of the shared bicycle market, and operators’ overly rapid adjustment speeds can also lead to market chaos. In addition, this study also discovered a new chaotic phenomenon—the shared bicycle attractor, which provides a new perspective for the dynamic analysis of the shared bicycle market.
The organization of this paper is as follows.
Section 2 provides an overview of the relevant literature.
Section 3 describes the basic model and gives an analysis of the equilibrium point.
Section 4 reveals the complex dynamics characteristics of the Cournot duopoly model.
Section 5 discusses the findings and potential avenues for future research. Finally, in
Section 6, we end our work with conclusions.
2. Literature Review
In this section, we review the relevant literature, with a focus on the competition between shared bicycle operators and shared bicycles with other public transportation.
The competition among operators in the shared bicycle market can be seen as a noncooperative game. Under this framework, operators make strategic decisions in multiple aspects such as price setting, price incentives, and service quality improvement. Since the shared bicycle industry has formed characteristics of market monopoly through economies of scale and brand effects, it can be analyzed using competitive models in economics, such as price competition (Bertrand game model) and quantity competition (Cournot game model) [
9,
10,
11]. Tan et al. [
12] employed game theory and differential calculus techniques within the context of oligopolistic markets to determine the Nash equilibrium between two competing supply chains, further enhanced by data simulation methods to emulate shared bicycle market competition. Research conducted by Hua et al. [
13] confirmed the efficacy and applicability of the Cournot oligopoly competition model in analyzing the strategic placement of shared bicycles within the market. Therefore, the research on the competitive dynamics of shared bicycle operators in this paper is mainly based on the Cournot model.
The current research on the competitiveness of shared bicycles mainly focuses on the competition and cooperation behavior between shared bicycles and other public transportation modes. For example, Wei and colleagues [
14] focused on the relationship between bike-sharing systems and public transportation and categorized bike-sharing data into three patterns that coordinate with public transit: competition, integration, and complementation. Liu et al. [
15] constructed a game matrix where cooperation and noncooperation served as the strategic options, derived the pure strategic Nash Equilibrium and the mixed strategic Nash Equilibrium solutions, and explored the conditions conducive to a collaborative partnership between the two entities. Faghih and others [
16] explored the possibility of bicycles being a viable alternative to cars for travel time efficiency in densely populated urban environments. Zhang and Zhou [
17] explored the concept of coopetition between public bus and bike-sharing services and Luo et al. [
18] revealed a degree of competition between bus services and public bicycle systems. Jin et al. [
19] identified the competitive and cooperative effects of shared bicycles on public transit by examining the shifts in public transit travel distances preceding and following the bicycle-sharing boom. Tang et al. [
20] identified three modes of interaction between dockless bike-sharing (DBS) and metros: strong competition, weak competition, and feeder relationships. Subsequently, based on these relationships, the analysis focuses on distance, spatiotemporal patterns, and the scope of DBS activities. By examining the predictive factors related to planning and policy interventions for bicycle commuting, Braun and colleagues [
21] have provided evidence of modal competition between cycling and public transport. The competition is reflected in the presence of public transport stops and the provision of travel demand incentives oriented towards public transport. The aforementioned literature serves as a valuable reference for delving into the competitive dynamics among operators within the shared bicycle sector.
While the existing literature has revealed the duopoly game phenomenon of shared bicycles and developed models to analyze their strategic interactions, most of it is static models and pays little attention to user experience. For example, Dai, Zeng, and Liu [
22] have delved into the competitive dynamics by establishing a game model that captures the developmental stages of shared bicycle companies. Similarly, Li et al. [
23] have contributed to the field by proposing a service network equilibrium model that accounts for government incentives and quality preferences within a closed-loop supply chain system. Wang et al. [
3] have also advanced understanding by creating an integrated economic model to assess the duopoly competition between bike-sharing firms on both pricing and bike deployment strategies. Furthermore, Wang et al. [
24] have provided a nuanced perspective on the rivalry between Ofo and Mobike, segmenting the competition into distinct phases and modeling it with a dynamic differential game for the initial phase and a static Hotelling game for the later stage. Habib [
25] and Wu et al. [
26] emphasized that in order to improve customer retention and satisfaction, shared bike services must prioritize the importance of customer experience. Indeed, comfort and discounts are also among the key factors that significantly influence customer choices.
In summary, the most of research focuses on the competition and collaboration between shared bicycles and other public transportation modes. Although some studies have touched upon competition among shared bicycles, they are often limited to the analysis of static models and rarely extend to predicting the dynamics of the shared bicycle market. In the present paper, we introduce a nonlinear duopoly game model with comfort loss costs and discounts. We also investigate the dynamic competitive outcomes of shared bicycles based on profit maximization.
Table 1 highlights the innovation points of this study compared with other related research.
3. Model Description
In this section, we concentrate on an economic model defined by two shared bicycle operators, and . The competition is predominantly observed in the last mile of commuter journeys, exemplified by the rivalry between Hellobike and Meituan Bike near subway stations, bus stops, and residential complexes. Such competition is characterized as a duopoly market game. The key distinction between these two shared bicycles is the disparity in comfort. Additionally, to attract more users, the shared bicycle operator utilizes discount strategies. In addition, we assume that the shared bicycle operators involved in the game can be considered as noncooperative games with complete information. The APPs provided to users are public, and both sides can easily obtain information about each other’s deposits and fees. It assumed that there is no collusion between the two parties, and their competition is noncooperative. The services provided by both parties are highly substitutable. Both provide users with dockless shared bicycles, allowing users to unlock and use the bikes through a mobile APP, picking up and dropping off at any time and place, to meet their own short-distance transportation needs.
Assume that the generalized travel cost of passengers choosing shared bicycle operator
, denoted as
, consists of travel time cost
k, comfort loss cost
, and fare
. Specifically, the generalized travel cost for passengers choosing
will remove the discounts
S provided by operator 2 to attract more passengers. Then,
can be expressed as
In line with the literature [
30], we adopt the utility function as shown in the Equation (
3):
where
is the number of passengers who chose shared bicycle operator
.
is used to measure the degree of substitutability between services provided by two shared bicycle operators. If
, then the services are perfect substitutes and
is the case of independent markets. Hence, parameter
g can be considered as indicating the degree of substitutability between operators in a particular market sector.
By maximizing the consumption surplus defined in Equation (
4),
We can obtain the inverse demands from the first-order condition as follows:
Then, from Equations (
5) and (
6), the direct demand for the services of the two shared bicycle operators can, respectively, be obtained by
In accordance with the model established in [
31,
32], the costs
in Equation (
9) for two shared bicycle operators are assumed to have a symmetric structure and linearly increase with the number of passengers and the number of passenger per km (
), with a fixed cost term
f:
where
, and
are cost conversion coefficients.
D refers to the distance between subway stations or bus stops and residential complexes.
Then, the profit for each shared bicycle operators
, can be obtained in Equation (
10) using the demand functions in Equations (
5)–(
8) and the cost functions in (
9).
3.1. Cournot Model with Profit Maximization
This section examines the demand competitive market among bike-sharing operators. This scenario involves both participants fully comprehending the oligopoly market, meaning the two bike-sharing operators have rational expectations, but this is highly unlikely [
33]. In reality, the true nature of the duopoly’s monopolistic evolution in the bike-sharing market can only be exhibited in a dynamic setting. Therefore, this article posits that operators are endeavoring to employ a more practical approach, that is, bounded rationality. This paper will analyze the marginal profits
/
of bike-sharing operators
i under the framework of bounded rational expectations. The demand for
in
period is dictated by the marginal profit achieved in the
t period. If the shared bicycle operator
achieves a marginal profit of
/
(<0) during period
t, then operator
will either increase (decrease) deployed in the subsequent period
. If operator
achieves a marginal profit where
during period
t, then its deployed will remain unchanged in the following period
. If the operator implements a bounded rationality adjustment mechanism, the dynamic equation for this game can be represented as (
11)
where
represents the adjustment speed of shared bike operator
i, reflecting their responsiveness to the shared bicycle market. In this study, it is hypothesized that during each
t period, bike-sharing operator
will anticipate the number of passengers that its competitors might serve in the subsequent
period, thereby determining its own potential maximum passenger count for the next
time period
.
When two shared bicycle operators maximize their profits through quantity competition, and thus their objective functions can be modeled as
The conditions required to achieve optimal demand by maximizing the profit of operators are:
and
. Therefore, the conditions for profit maximization can be obtained:
Then, we can construct and study the dynamic characteristics of the Cournot game as
3.2. Stability Analysis of Cournot Competition
Let
; by solving nonlinear algebraic systems (
15)
we can obtain four equilibrium points of the system (
14):
,
,
and
.
It is evident that the aforementioned system (
14) possesses two stable equilibrium points,
and the other two equilibrium points are all unstable.
The Jacobian matrix of system (
14) is
Theorem 1. The equilibrium point is an unstable equilibrium point.
Proof. The Jacobian matrix of the system (
14) at equilibrium point
is
and the corresponding eigenvalues are
therefore,
is an unstable equilibrium point. □
Theorem 2. The equilibrium point is a stable equilibrium point if Proof. The Jacobian matrix of the system (
14) at equilibrium point
is
The corresponding eigenvalues are
,
. When
and
, the Equation (
16) can be obtained. □
Theorem 3. The equilibrium point is an unstable equilibrium point.
Proof. The Jacobian matrix of the system (
14) at equilibrium point
is
The corresponding eigenvalues are and . Since , we have , . Therefore, is a stable equilibrium point. □
Theorem 4. The equilibrium point is a stable equilibrium point if Proof. The Jacobian matrix of the system (
14) at equilibrium point
is
Let
denote the trace of the Jacobian matrix
and
denote the determinant of the Jacobian matrix
, then
Based on the Jury condition [
34,
35], the local stability of the equilibrium point must meet the following criteria:
By substituting the expressions of
and
into Equation (
18), stability condition (
17) for equilibrium point
can be obtained. □
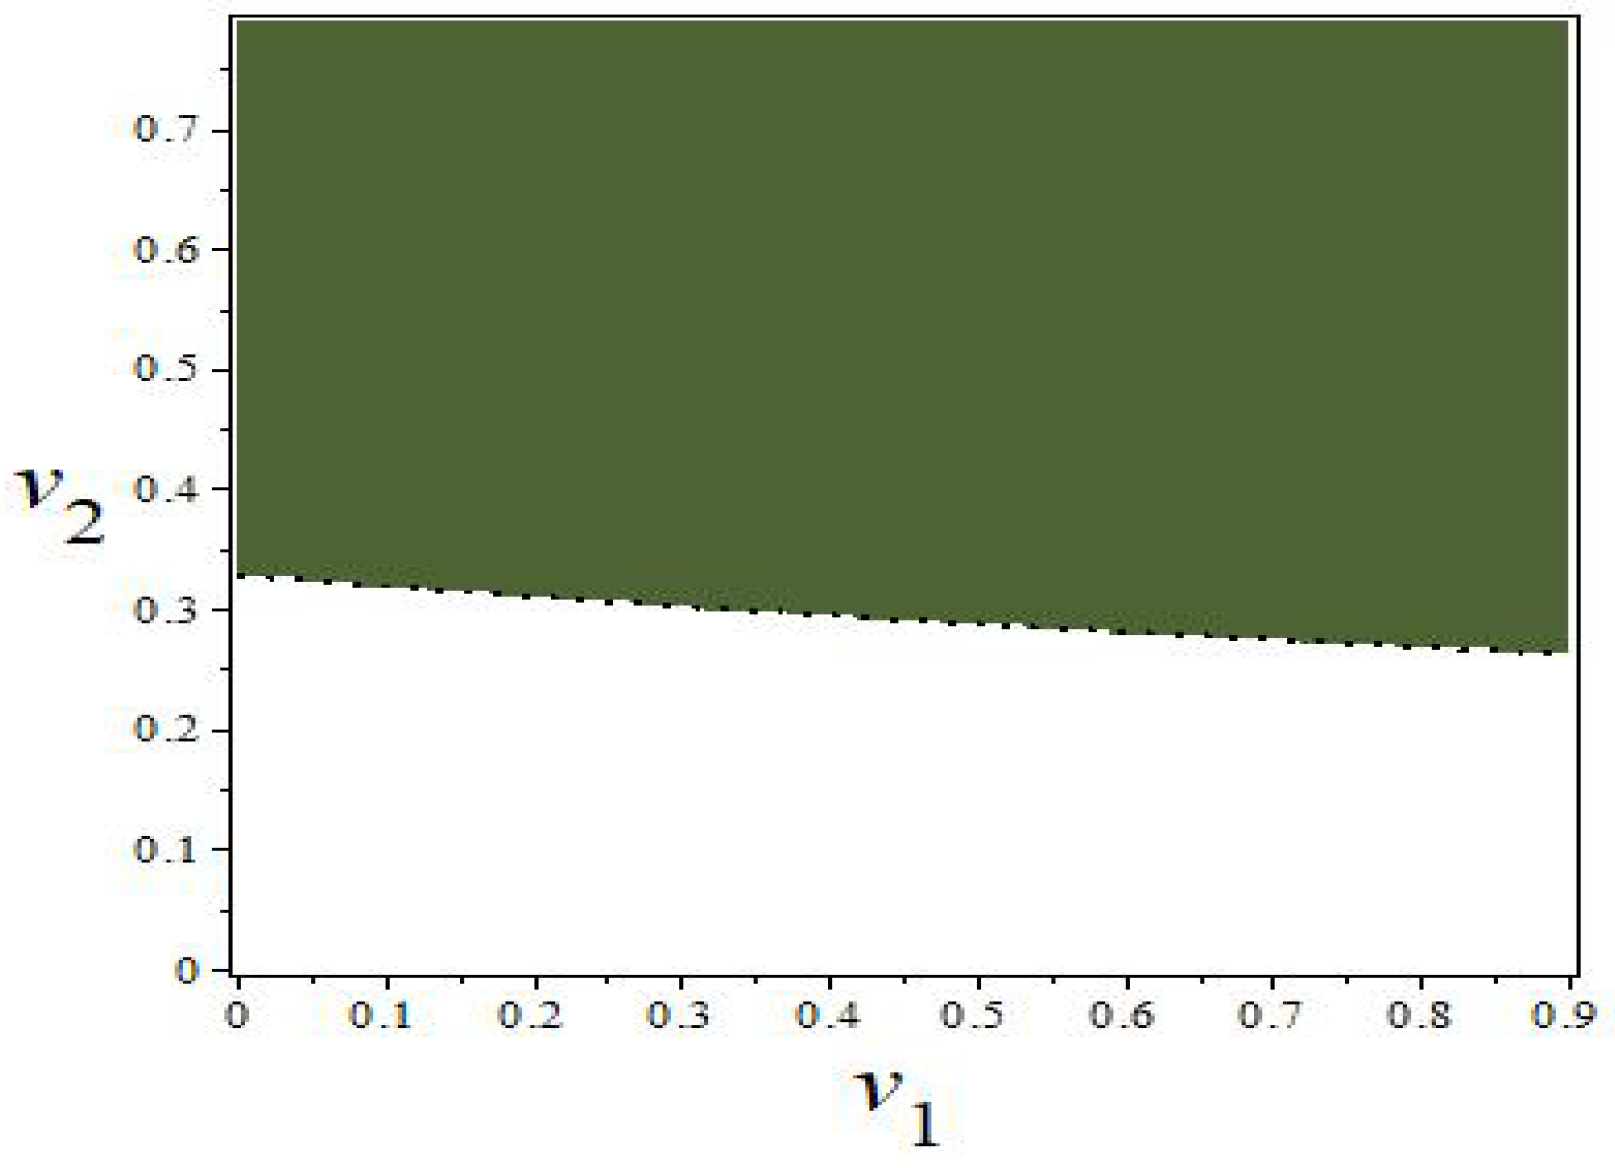
The stability region of
is situated in the upper half of the two-dimensional parameter plane, denoted as (
,
), as illustrated in
Figure 1. The white area signifies the instability region of
, while the boundary between the two regions is the bifurcation line of system (
14). As parameter
decreases, the system transitions from the white region to the green region via the hyperbranched line, leading to a period-doubling bifurcation.
4. Numerical Simulation
To study the dynamic behavior of system (
14), the simulations presented in this paper were conducted using MATLAB R2017a. Specific parameter values were chosen to analyze the system’s dynamic behavior using a one-dimensional bifurcation diagram, the basin of attraction of the stable period, and attractor coexistence. In addition, time series are used to verify the sensitivity of the system’s initial values. In this section, we employed a method of random selection for data to ensure the representativeness and reliability of the simulation results. Specifically, in
Section 3, we set reasonable ranges for system parameters and randomly generated parameter values within these ranges to simulate operational conditions under different market scenarios. Through this randomized data selection method, we can reveal the behavior of the model under different random conditions, providing a more comprehensive and in-depth understanding of the dynamics of the shared bicycle market.
4.1. System Bifurcation and Attractive Basin of Equilibrium Point
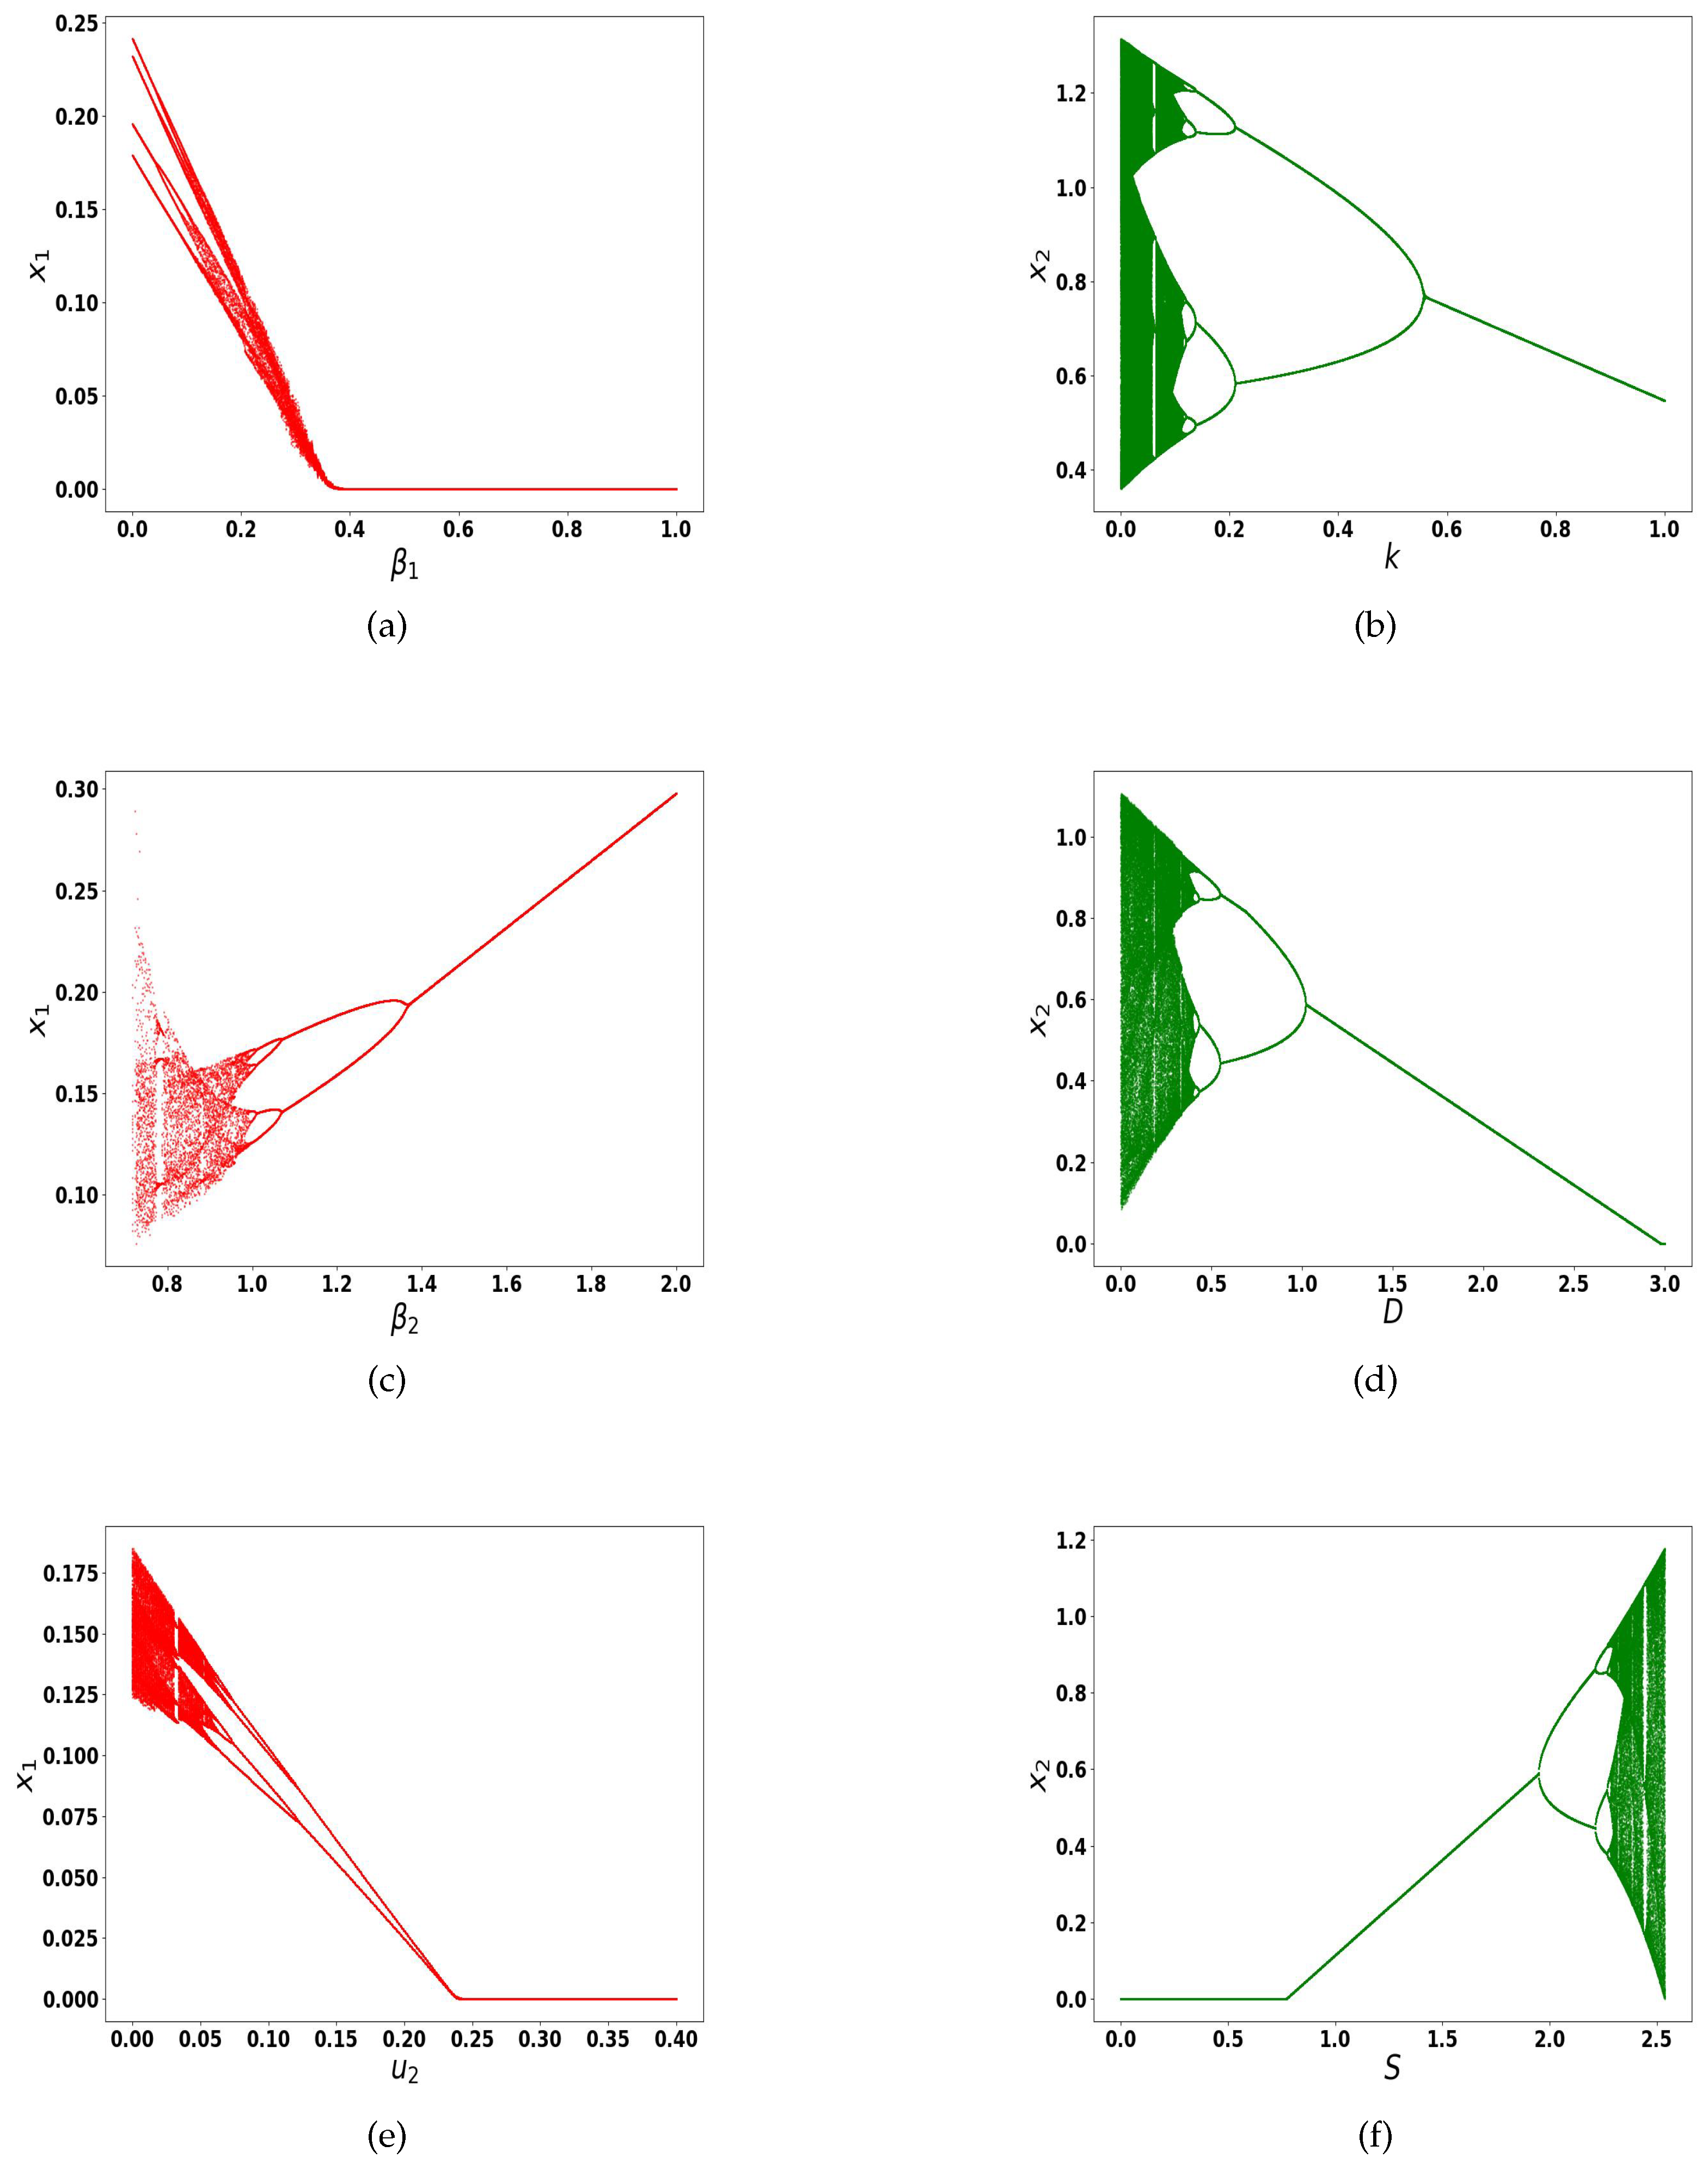
Fix the system parameters, then the impact of the time cost, comfort loss cost, discount, and cost conversion coefficient of shared bike attractor operators
and
on the system, as illustrated in
Figure 2.
Figure 2 comprises six subplots, each illustrating the impact of different factors on the demand of the operator. Subplot (a) presents the impact of comfort loss cost
on the demand of operators
. Subplot (b) presents the impact of the time cost
k on the demand of operators
. Subplot (c) presents the impact of the comfort loss cost
on the demand of operators
. Subplot (d) presents the impact of travel distance
D on the demand of operators
. Subplot (e) presents the impact of cost conversion coefficient
on the demand of operators
. Subplot (f) presents the impact of discounts
S on the demand of operators
.
In
Figure 2, the dynamic adjustment speed of shared bicycle operators is fixed at
,
, and the initial demand value of the operators is (
) = (
). From subplot (a), one can see clearly with the increase in comfort loss cost
, the demand for operator
changes from a period-doubling bifurcation and finally reaches a stable state in the region. Once the cost of comfort loss exceeds
, the demand for operator
will decrease to zero, leading to operator
’s exit from the market. On the contrary, as the comfort loss cost
increases, the demand for operator
will shift from a chaotic state to a period-doubling bifurcation and eventually to a stable state, and the demand for operator
will gradually increase (see subplot (c)). Correspondingly, subplot (e) shows the increase in cost conversion coefficient
also causes the demand for operator
to change from a chaotic state to a period-doubling bifurcation, ultimately stabilizing at 0, resulting in operator
exiting the market. The results of subplot (d) indicate that as the distance increases, the demand for operator
stabilizes, despite the discount incentives offered by the operator. This is because longer distances make passengers more inclined to opt for public transportation such as buses or subways. Empirical evidence from various studies, as referenced in the literature [
18,
36], demonstrates a negative correlation between the frequency of shared bicycle rentals and the distances traveled. Furthermore, the research presented in [
19] underscores a strong correlation between the decline of short-distance public transit services within a 3 km radius and the increased utilization of shared bicycles. The increase in time cost
k and travel distance also leads to a decrease in demand for operator
, while the system also achieves a period-doubling bifurcation process with the time cost increases from
to
and distance increase from
to
. When discounts
S increase, the demand for operator
eventually becomes chaotic (see subplot (f)). This indicates that substantial discounts can plunge the system into chaos, which is detrimental to market development. To maintain market competitiveness, discounts must remain within a specific range. Similar research findings are also mentioned in the literature [
22], which indicates that an excessive competitive strategy of preferential subsidies can lead to overdelivery and result in destructive competition.
Attractor coexistence is an important indicator of the multiple stability of a system, indicating that the system can shift its solution after numerous iterations when subjected to varying initial values or parameters. This coexistence of solutions is reflected in the attractor’s behavior. The region associated with the attractor is known as the attractor basin [
37,
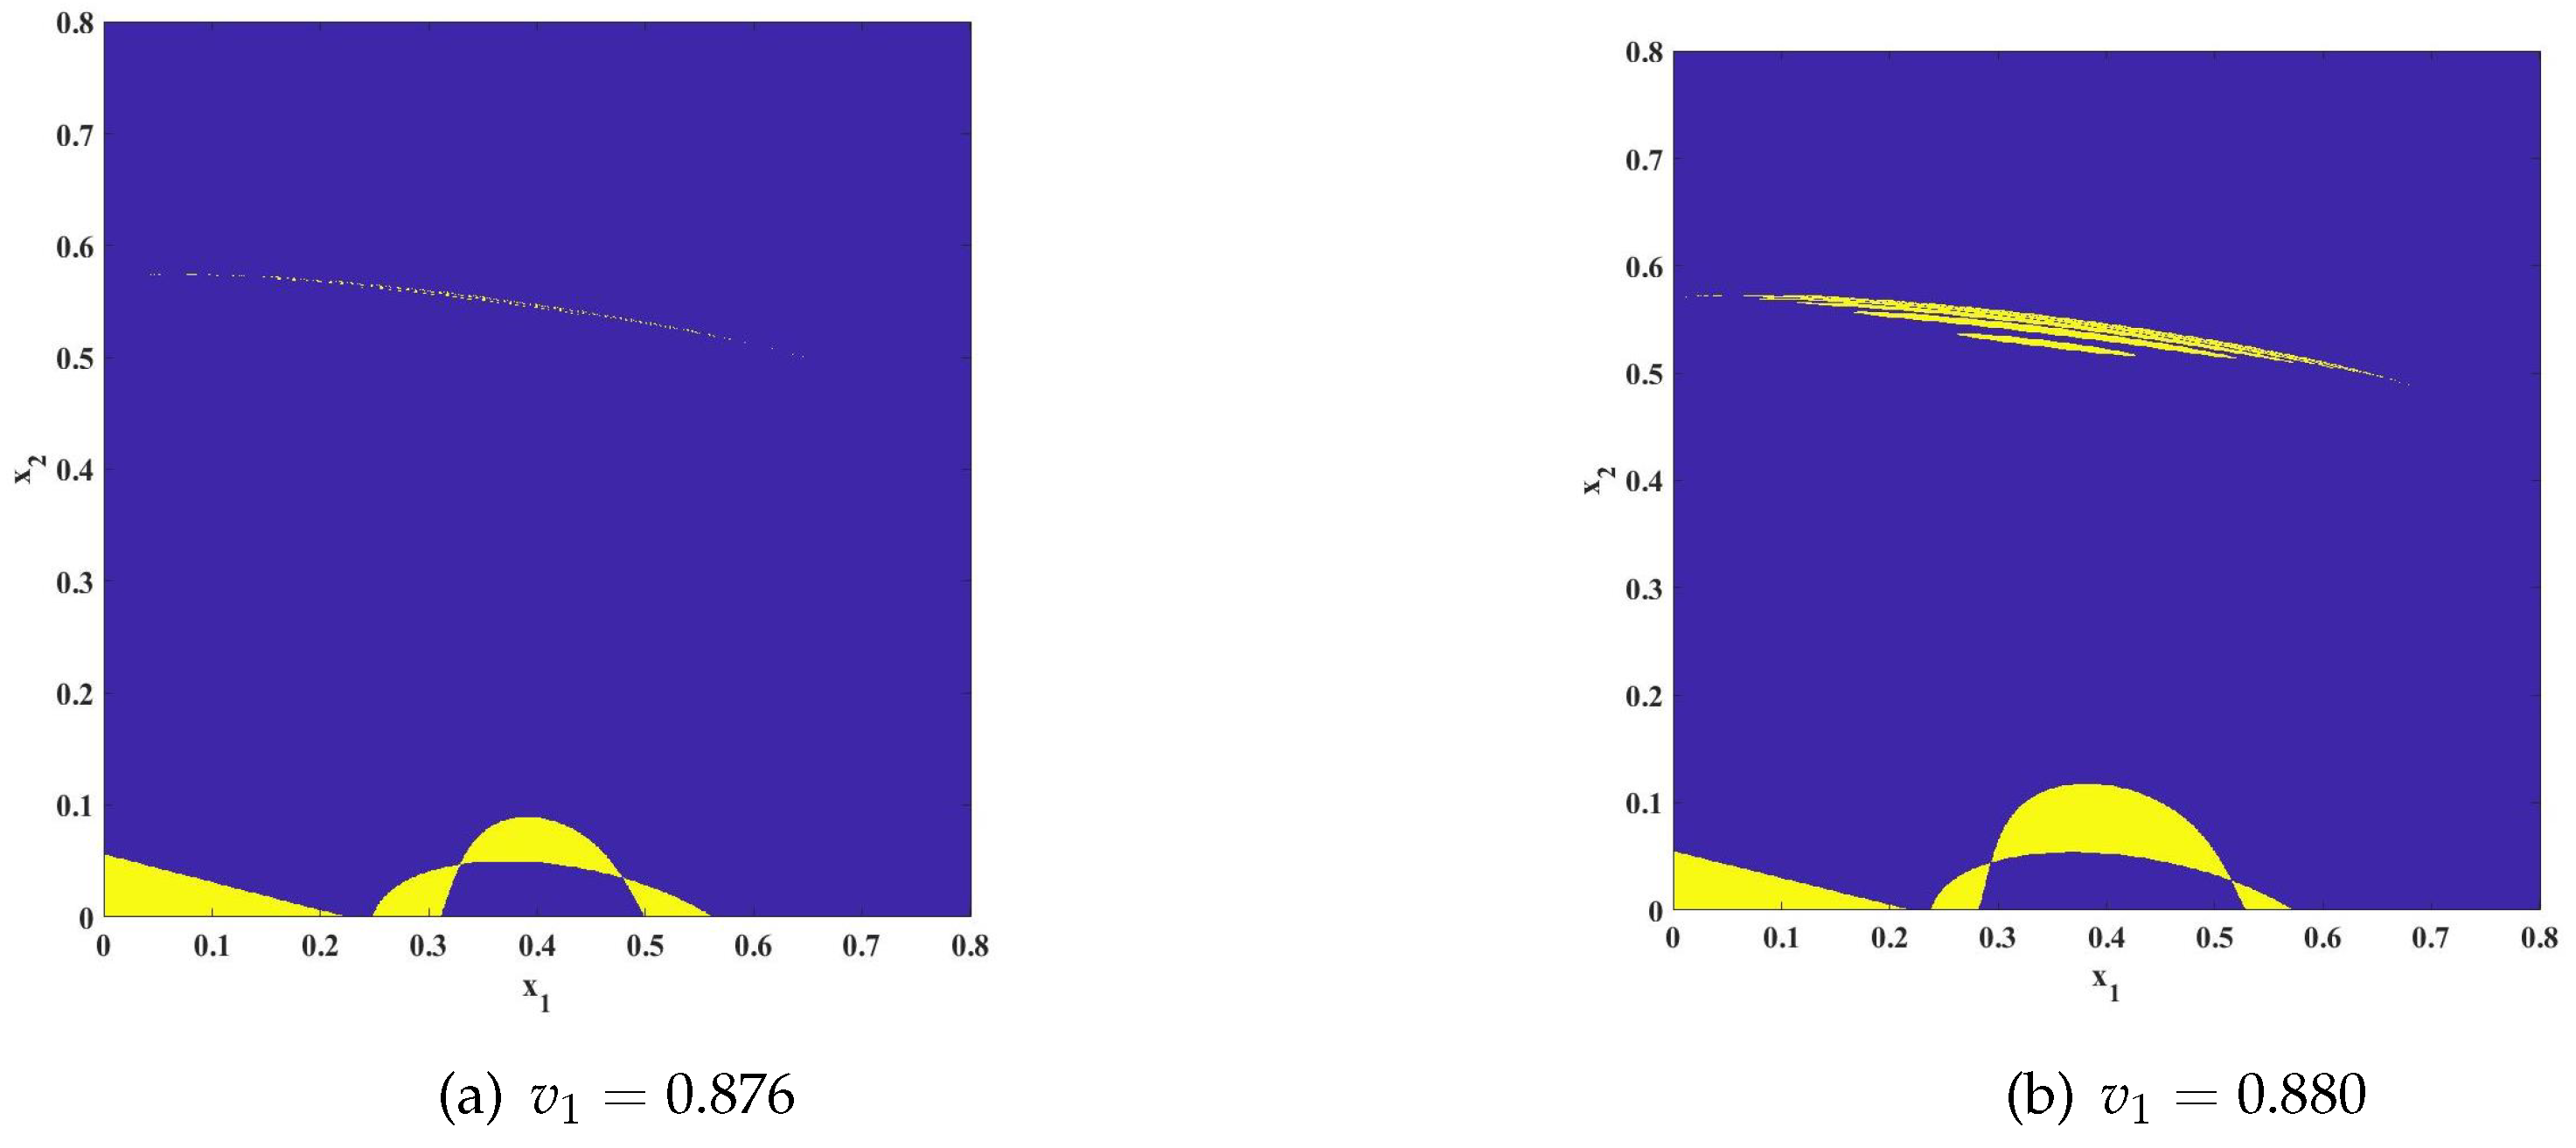
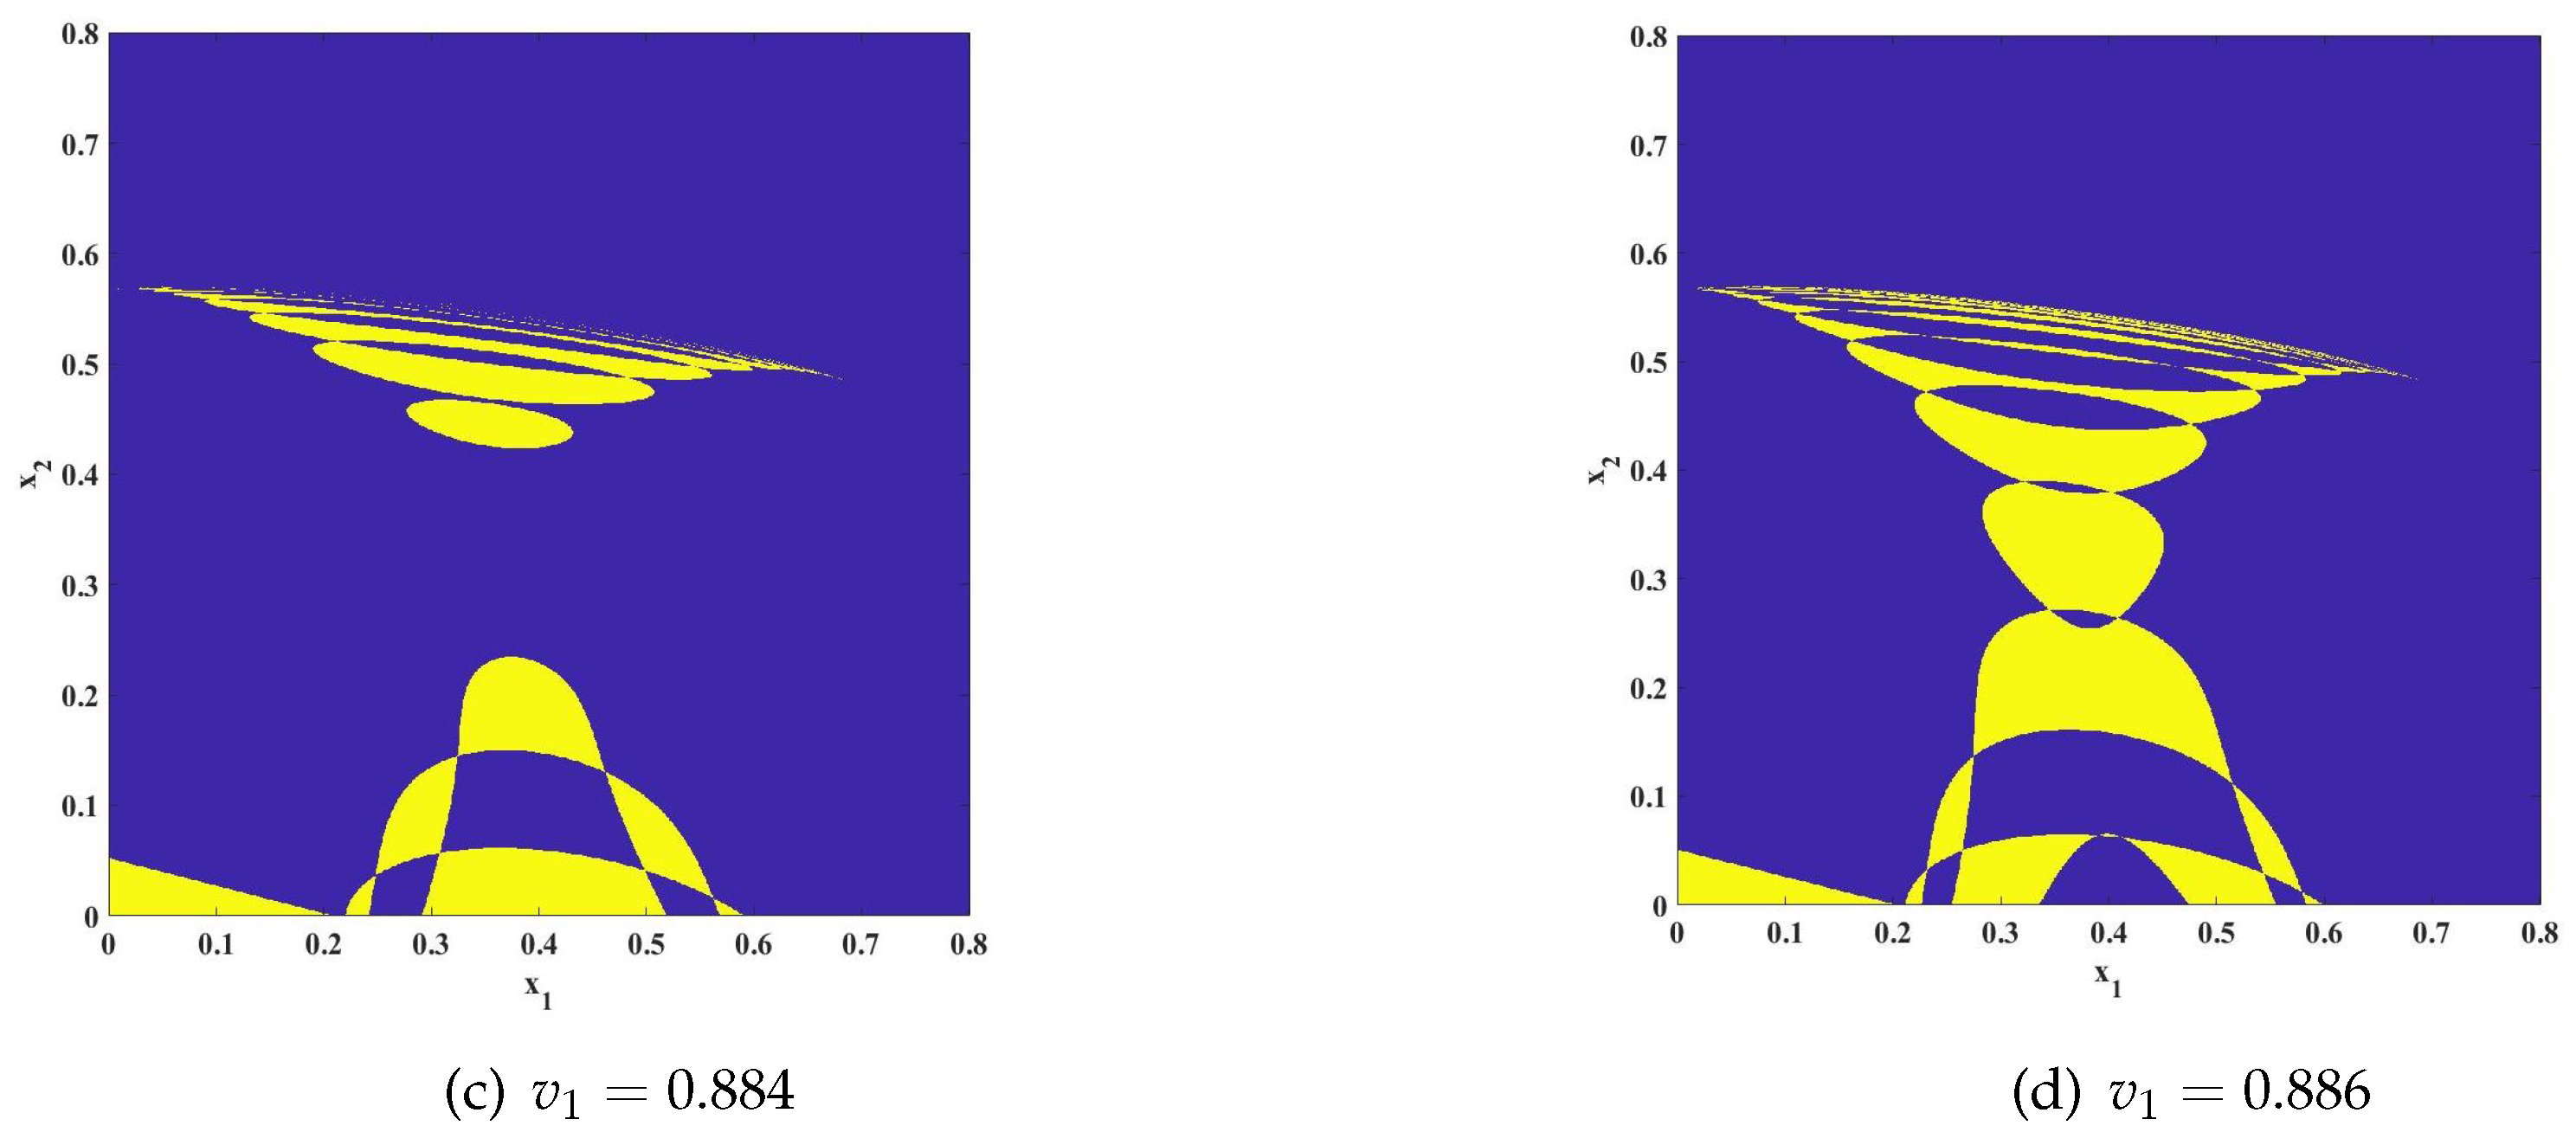
38], which is influenced by the path taken. When the initial value falls within the attractor’s domain, it will ultimately converge towards the attractor’s location. To illustrate the system’s various periods, we depict the evolution of the chaotic attractor basin, as illustrated in
Figure 3.
Figure 3 comprises four subplots. Observing the transition from subplots (a) to (d), one can see that there are only two colors: blue indicates the divergent region, while yellow represents the bifurcation region resulting from the loss of stability at the equilibrium point. It is observed that as the adjustment speed
increases, the yellow region expands concurrently with a contraction in the blue area. Throughout this process, the other parameters were set as follows:
,
,
,
,
,
,
,
,
.
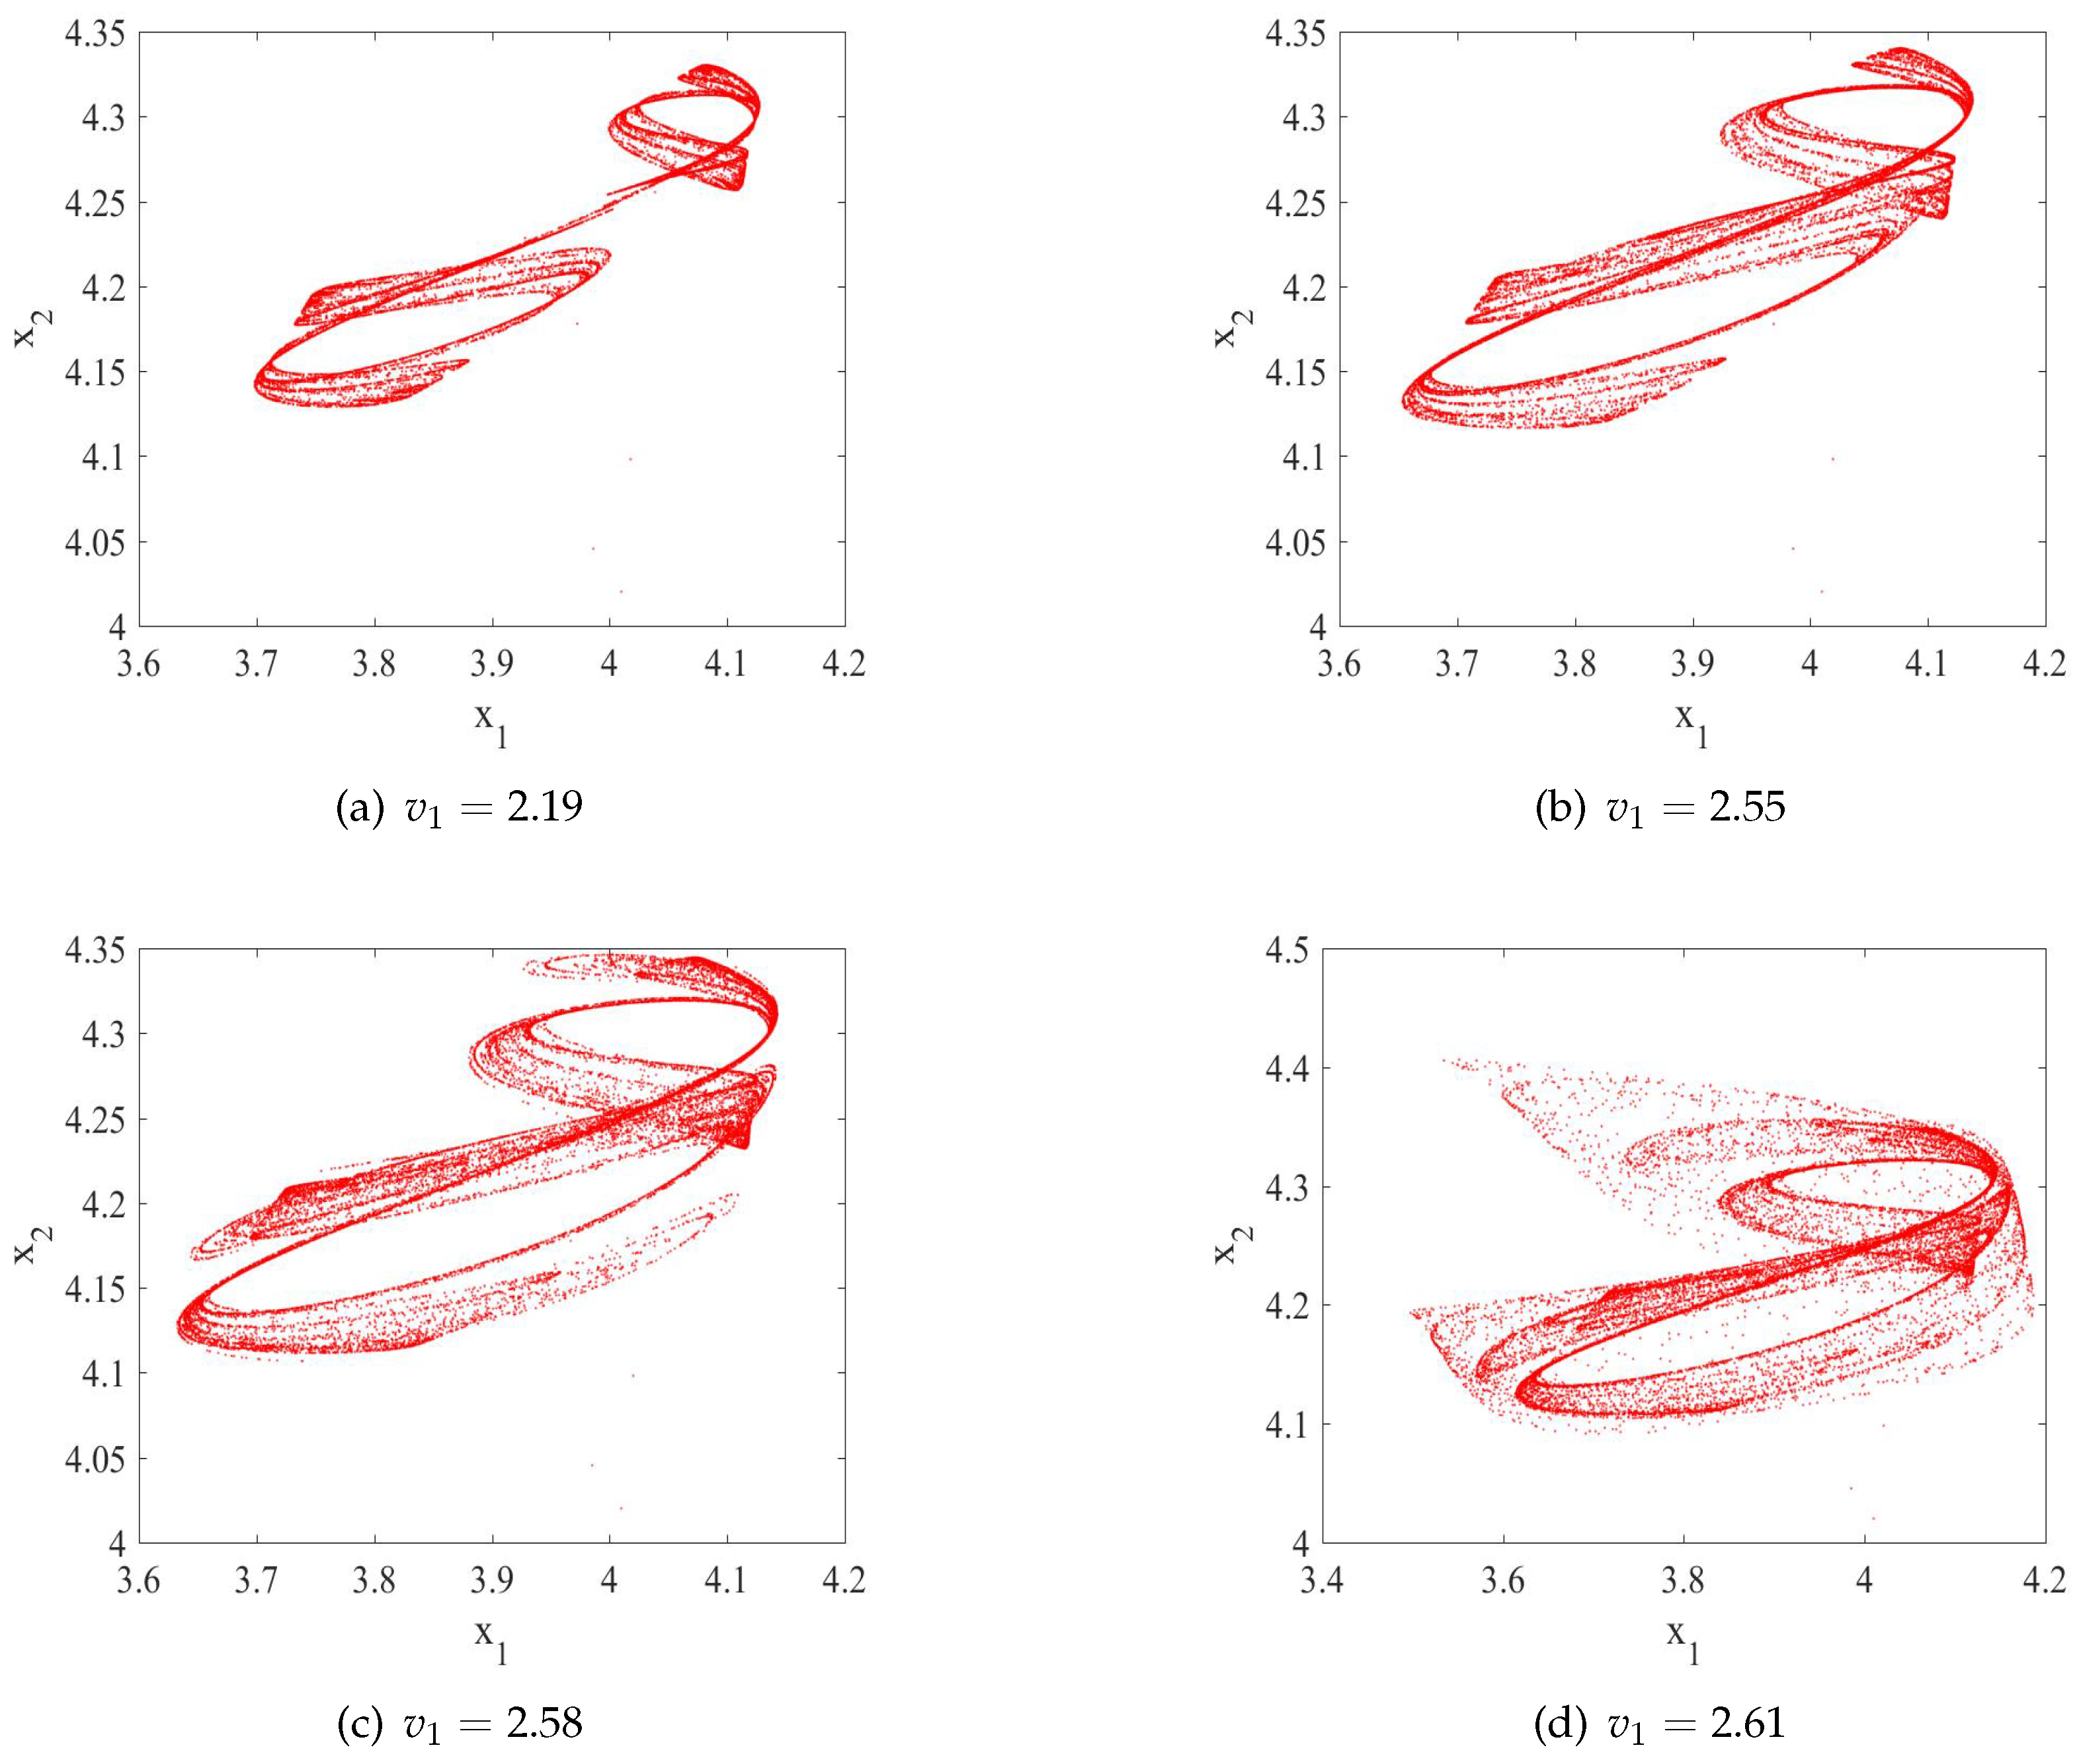
4.2. Shared Bike Attractor
The strategic adjustment speed of shared bike operators is crucial for the development of the business, and it is necessary to focus on it. In this section, by varying the parameter
and keeping the system parameters fixed as follows,
,
,
,
,
,
,
,
,
, a new type of chaotic attractor is obtained (see
Figure 4), which this paper describes as the “shared bike attractor”. It can be seen that as the adjustment speed of operator
increases, the phenomenon of chaos becomes increasingly apparent. This also implies the chaos of the oligopoly competition market for shared bicycles. At this juncture, it may be necessary to implement certain policy measures [
21] that would allow operators to reasonably adapt their operational strategies, thereby facilitating the return to a healthy trajectory for the shared bicycle market.
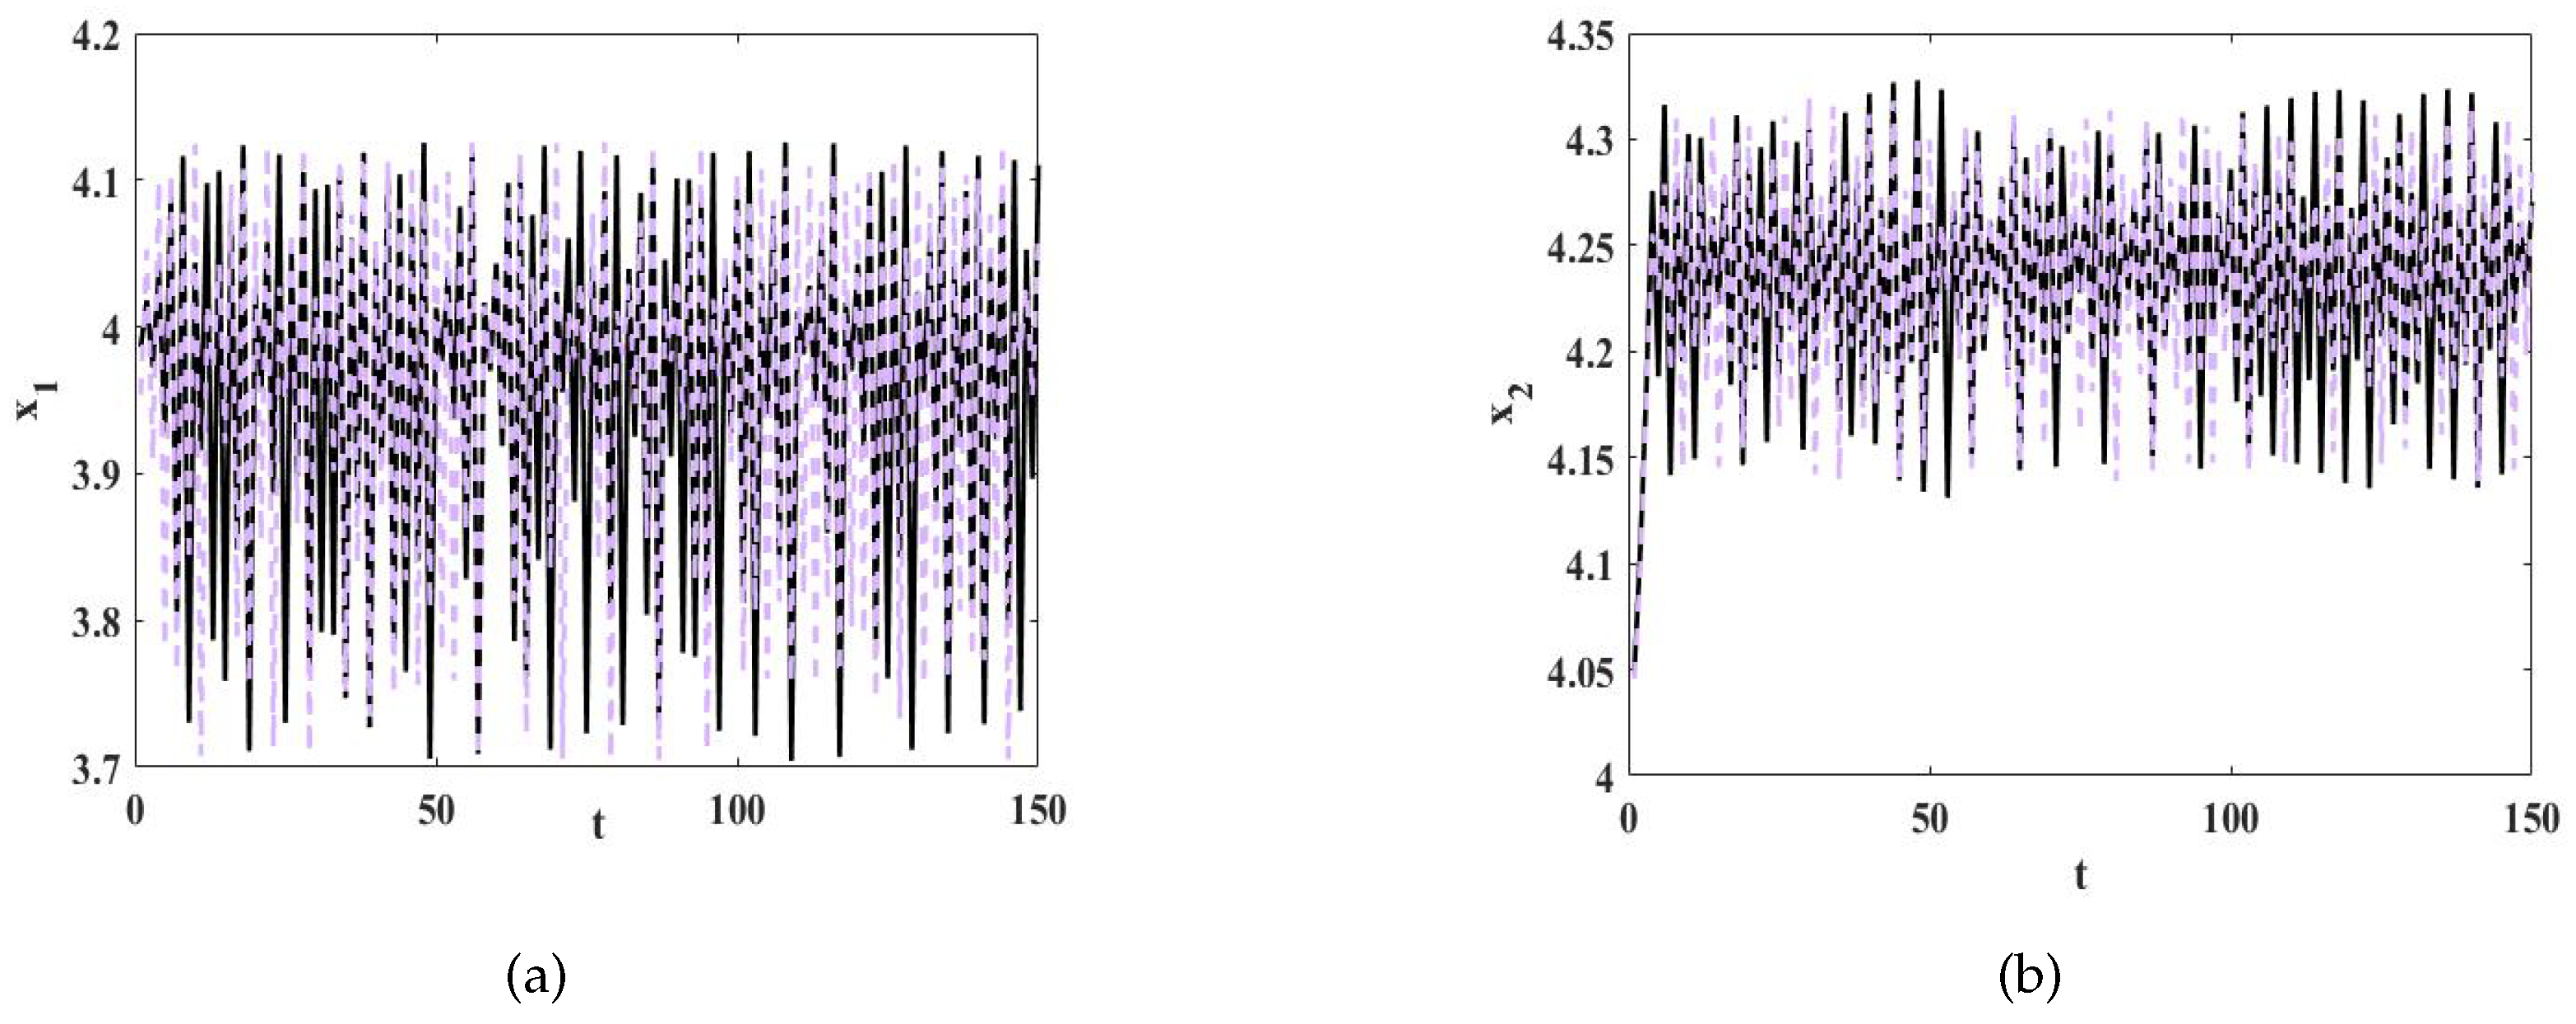
Taking the parameters shown in
Figure 4, when the initial demand changes slightly, the demand for two operators changes with time, as shown in
Figure 5. The black curve in
Figure 5a,b represents the demand for operators
and
when
,
. The purple dot curve represents the demand for operators
and
when
,
. As shown in
Figure 5, the two sets of sequences basically coincide at the beginning, and with the passage of time, the difference becomes gradually obvious and finally becomes two sets of different sequences, thus verifying the sensitive dependence of the system on the initial value. Therefore, the oligopolistic competition system in the shared bicycle market is highly sensitive to initial conditions, implying that the behavior or output of the system can change significantly with minor variations in the initial state. This undoubtedly highlights the importance of operators in formulating accurate demand forecasts and pricing strategies. The correct initial strategy and timely adjustments are crucial for ensuring the healthy development of the market and avoiding potential destabilizing factors.
5. Discussion
Given the reality that there are typically two types of shared bicycles available between residential areas and the nearest bus or subway stations, this paper has constructed a dynamic adjustment model aimed at maximizing the profits of shared bicycle operators.
One of the most intriguing discoveries of our research is the identification of a novel chaotic attractor, which we have termed the “shared bicycle attractor”. This finding suggests that overly rapid adjustments by operators can lead to a chaotic state within the market, which can be detrimental to the long-term growth and stability of the operators. This insight underscores the importance of strategic planning and the need for operators to consider the potential systemic effects of their decisions.
The complexity of the shared bicycle market is further highlighted by our numerical simulations, which have underscored the intricate and sometimes unpredictable nature of the system. These simulations have been instrumental in visualizing the potential outcomes of different strategic decisions by the operators.
Our exploration of the market impact of comfort loss costs, discounts, and distance has revealed that these factors can significantly influence an operator’s competitive position. The findings indicate that substantial discounts and comfort-related costs can erode an operator’s market share. This underscores the necessity for relentless technological innovation and user comfort enhancement to maintain a competitive edge.
Our study presented modeling processes and analytical methods not limited to the specific context of shared bicycles. These methodologies are designed to be versatile, allowing for their application to other goods or services that exhibit substitutability. By employing these methods, researchers and practitioners can effectively analyze the impact of operator discounts, as well as other market factors, on competitive dynamics.
Although the model proposed in this paper provides some useful insights for the profit maximization decision making of shared bicycle operators, the following assumptions should be relaxed in further research:
(1) The model considers all users as homogeneous, but user behavior may vary based on personal preferences, income levels, and usage habits. Future research can introduce heterogeneity in user behavior to improve the predictive ability of models.
(2) In the construction of the model, this paper only considers the competition between two shared bicycle operators, but in fact, it is possible for three operators to coexist. Future research can extend to the impact of operators’ decisions on the system when three operators compete.
(3) This study examines the outcomes of competition in the potential demand for shared bicycles. Future research could extend its scope to explore scenarios involving price competition and collusion.
6. Conclusions
In this study, we have developed a duopoly quantity competition model for the shared bicycle market. Our analysis has delved into the intricate dynamics of a nonlinear duopoly scenario characterized by Cournot competition, shedding light on the complex interplay between competing entities. The comfort loss costs of the two shared bicycle operators are different, and Shared Operation 2 attracts passengers through discount incentives. We have utilized the eigenvalues of the Jacobi matrix at the equilibrium point, in conjunction with the Jury criterion, to ascertain the conditions for the stability of the equilibrium point. This approach has been applied to our meticulously crafted model of shared bicycle quantity competition, enabling a comprehensive analysis of both local and global stability. Numerical simulations underscored the system’s inherent complexity. Our research has further explored the market impact of comfort loss costs, discounts, and substitution relationships within the shared bicycle sector. The findings indicate that substantial discounts and comfort-related costs can significantly diminish an operator’s competitive edge. By examining the operators’ adjustment speeds, we have identified a novel chaotic attractor, termed the “shared bicycle attractor”. This discovery suggests that overly rapid adjustments can precipitate a chaotic state within the shared bicycle market, which is counterproductive to the growth and stability of operators. In addition, our analysis, supported by time series diagrams, has confirmed the system’s pronounced sensitivity to initial conditions, highlighting the intricate dynamics at play in the shared bicycle market.
To avoid the chaotic phenomena in the shared bicycle market and to promote its healthy development, while providing users with more convenient and diverse travel options, we propose the following suggestions:
(1) Operators can use scientific models to predict market demand and implement total quantity control.
(2) Relevant departments should enhance the supervision and management of shared bicycle operators, using technology to dynamically monitor information on bike deployment, parking, and updates, ensuring orderly market operations.
(3) Introducing a variety of shared bicycle types, such as e-assist bikes and leisure bicycles, can increase market vitality and meet the needs of different users.
(4) Shared bicycle operators can establish cooperative relationships with public transportation systems, for example, by offering joint-use discount plans to encourage users to switch seamlessly between public transit and shared bikes, thereby improving overall traffic efficiency.


