Article

Heat Release Rates of Straight Soybean and Diesel Oil Blends in a Compression Ignition Engine

by
Nury A. Nieto Garzón
*,
Amir A. Martins Oliveira
and
Edson Bazzo
Laboratory of Combustion and Thermal Systems Engineering—LabCET, Mechanical Engineering Department, Federal University of Santa Catarina, Florianópolis 88040-900, SC, Brazil
*
Author to whom correspondence should be addressed.
Appl. Sci. 2024, 14(20), 9215; https://doi.org/10.3390/app14209215
Submission received: 30 May 2024 / Revised: 15 September 2024 / Accepted: 26 September 2024 / Published: 10 October 2024

Abstract

:
Straight soybean and diesel oil blends are proposed as alternatives for electricity generation in isolated regions. The compression ignition engine is considered the prime mover and has the attractive potential to distribute electricity generation for supply in isolated regions, as well as for small applications demanded by the agro-industrial sector. The heat release rate evaluation of straight soybean blends is the main focus of this paper. A single-cylinder compression ignition engine with a nominal power of 14.7 kW/2200 rpm fueled with blends of 50% and 80% v/v straight soybean oil with commercial diesel oil was tested on a dynamometer bench. The heat release rate and ignition delay were determined from in-cylinder pressure measurements using zero-dimensional modeling. The experimental results showed a promising performance and coherent behavior with the physicochemical fuel properties and load conditions tested. The highest fraction of vegetable oil led to a combustion delay, characterized by high diffusive and residual combustion phases, although the fuel oxygen content favored the combustion. Finally, this work allowed observation of the development of the heat release rate of straight soybean blends in a diesel engine, understanding the influence of the fuel properties and in-cylinder gas properties on the combustion process.

1. Introduction

Global climate change and worldwide dependency on fossil fuels have encouraged the study of alternative energy sources. Biofuels are an interesting alternative for energy production in countries with an agricultural basis, such as Brazil, who presents the availability of land for energy crops, favorable climatic conditions, and well-established infrastructure for crop production, transport, and processing. In this context, straight vegetable oils offer opportunities for the distributed electricity generation in the energy, agriculture, and agro-industrial sectors. They are the preferred choice for replacing diesel oil in isolated regions, where the perils of transporting and storing diesel oil are an environmental and social hazard [1,2].
Currently, vegetable oil is converted into biodiesel through the transesterification process and is used in defined proportions in drop-in fuels for transportation. The diesel oil used in Brazil carries 13% (vol.) of biodiesel in its formulation [3]. However, in distributed energy production, straight vegetable oil (SVO) can be used directly in compression ignition engines, thus reducing costs and providing fuel availability in remote areas, such as the Brazilian rainforest. Worldwide, different vegetable oils have been used, either directly or after conversion to biodiesel, as compression engine fuel. Examples include soybean oil in the USA, rapeseed and sunflower oils in Europe, and palm, jatropha, and coconut oils in Asia and Africa [4,5,6,7]. In Brazil, soybean and palm oils have been widely used in the production of biodiesel.
Most studies on the use of SVO in compression ignition engines have focused on dynamometer-based bench and thermodynamic analyses of compression ignition engines operating with different vegetable oils. The main technological challenge addressed is associated with the differences in the physicochemical properties of vegetable oils in comparison with diesel oil. The larger molecular structure, higher viscosity, and lower volatility of SVOs compared to diesel oil significantly influence the atomization and combustion processes [8]. Heating and blending are normally used to approximate the properties of SVOs to those of diesel oil [9,10]. The comparable performance of diesel oil in relation to thermal efficiency and other performance parameters has been reported in the literature [7,10,11,12,13,14,15]. Additionally, studies based on pressure readings to calculate the heat release rate have increased in the last decade for several pure vegetable oils and blends [16,17,18,19,20,21,22,23,24,25,26,27,28,29,30,31,32,33]. Results regarding the performance, emissions, and combustion parameters are compared in relation to diesel oil.
This work focuses on the heat release rate of straight soybean and diesel oil blends as fuels in compression ignition engines. Soybean oil was chosen for this study because of its availability in the Brazilian market. Tests were carried out measuring the dynamic pressure in the combustion chamber of a single-cylinder engine. The heat release rate was estimated from the transient pressure measurements using a well-known zero-dimensional approach [34,35]. The main objective of this work was to understand the influence of the physicochemical fuel and in-cylinder gas properties on the combustion process in order to contribute to further studies concerning the development of a combustion model for the analysis and design of electricity generation systems using straight vegetable oils in compression ignition engines.

2. Experimental Procedure

2.1. Fuels

The fuels tested were diesel oil and two blends of soybean and diesel oil. The blends tested were 50/50% v/v soybean and diesel oils and 80/20% v/v soybean and diesel oils. Table 1 shows the fuels tested with their respective label and temperature for testing. The blend of 50/50% v/v was tested at two temperature levels. The high level (85 °C) was determined in order to obtain a similar break-up regime to diesel oil at 25 °C. This condition was evaluated following the criterion for the onset of jet atomization reported by Reitz and Bracco [36]. Density, dynamic viscosity, and surface tension are significant physical properties in the atomization process. These properties were tested for diesel and soybean oils and their blends at different temperatures ranging from 25 °C to 85 °C. Subsequently, correlations were proposed as a function of the temperature and volume fraction of soybean oil, allowing the calculation of the fuel properties at different injection conditions. These correlations were previously reported by Garzón et al. [37], and some measurements of the physical properties tested are presented in Table 2, including the respective expanded uncertainties. One can observe the increase in the density, dynamic viscosity, and surface tension with an increase in the percentage of vegetable oil in the blend, as well as the effect of heating on the reduction in these properties.
Soybean oil tested suffered no refining or transesterification, only filtering. Vegetable oils are composed of fatty acid triglycerides, which determine the different physical and chemical properties of each vegetable oil. The diesel oil tested was commercial Brazilian diesel oil (known as diesel S10). The commercial Brazilian diesel oil used had a volumetric addition of 8% of biodiesel in accordance with national regulations. Currently, the commercial Brazilian diesel oil carries 13% (vol.) of biodiesel in its formulation [3]. The higher heating value (HHV), lower heating value (LHV), and elemental chemical composition were measured for soybean and diesel oils, and the respective results are presented in Table 3. In relation to LHV, the highest content of carbon and hydrogen in diesel oil influences its LHV, which is about 13% higher than the LHV of soybean oil. An empirical formula of soybean oil was calculated from the content of carbon, hydrogen, and oxygen. The molecular formula of soybean oil was estimated from its empirical formula and the assumption of soybean oil as a triglyceride (a molecule with six atoms of oxygen). Diesel oil was modeled as dodecane.

2.2. Experimental Setup

The experimental setup consists of a 14.7 kW, 4-stroke single-cylinder, direct injection diesel engine (Yanmar, model YT22E, Yanmar Co., Ltd., Osaka, Japan) coupled to an electromagnetic dynamometer (Schenk, model W70, Schenck RoTec GmbH, Darmstadt, Germany). The dynamometric bench is equipped with a fuel supply system, a measurement system of the in-cylinder pressure, an air measuring system, and a control and data acquisition system. Figure 1 shows a schematic diagram of the experimental setup. Technical specifications of the direct injection diesel engine are shown in Table 4.
An electric heater comprising an aluminum tube (12.7 mm diameter), electrical resistance of 119 Ω, and ceramic insulation was manufactured to heat the vegetable oil blend before it entered the engine. An electromagnetic 3/2 valve was installed to switch to the fuel employed. This enables the passage of diesel oil from the original tank or the fuel under test. The fuel consumption was measured using an electronic balance (Marte, model AD5000) with serial communication. The instant reading of the data allowed the calculation of the fuel flow. The engine torque was measured with an extensometer-type load cell installed on the dynamometer arm. The speed was measured with an incremental encoder 360 pulses/revolution (Autonics, model E40S, Seoul, Republic of Korea).
The inducted air mass was measured with a hot-film mass air-flow meter (Bosch, model HFM 2, Gerlingen, Germany). An air reservoir was coupled between the intake manifold and the air-mass meter to ensure uniformity of the flow and the measurement of the air-mass rate. Temperature and relative humidity of the air inducted were measured through a humidity sensor and a temperature sensor installed before the mass air-flow meter. A thermocouple was installed in the intake manifold, close to the intake valve, to register the air temperature inducted. Additionally, a set of thermocouples was installed at the engine cooling water outlet, the exhaust manifold, the heater outlet, and the injection pump inlet. An electronic control and data acquisition system was developed with LabVIEW software 2011 [38] using two acquisition boards to register the different variables.

Experimental Testing

The tests were performed at the maximum flow rate of the injection pump. In each test, the engine operation was started with diesel fuel until the heating period was completed, i.e., when the cooling water temperature reached 60 °C. The diesel oil was then replaced by the fuel under test. After achieving stable operation with the new fuel (steady readings), the brake process was started with the dynamometer. The load was applied to accomplish 1800 and 2100 rpm, which correspond to the conditions of high load and maximum power, respectively. Measurements of torque, speed, power output, fuel consumption, and air flow mass were recorded at the steady-state condition. The measurements were registered at intervals of five seconds.
Additionally, a piezoelectric pressure sensor (Kistler, model 6041B, Winterthur, Switzerland) was used to measure the in-cylinder pressure. The sensor was installed in the cylinder head, according to technical specifications, and its signal was synchronized with the incremental encoder to register the pressure values each 0.5° CA (crank angle). The pressure sensor was connected to a charge amplifier (Kistler, model 5018A), and its signal was registered through a data acquisition system (National Instrument, model SCB-68, Austin, TX, USA). The in-cylinder pressure readings were recorded at the frequency of 10,000 S/s.
For each test condition, the in-cylinder pressure readings were processed to obtain a representative pressure curve as a function of the crank angle. It was verified that a sample of 50 cycles is a representative sample to calculate the pressure curve without disturbing the accuracy of the results. This data processing consisted of the spurious data elimination, cycles averaging, filtering, and fitting of average pressure data. The complete description of the in-cylinder pressure data processing is presented in Garzón et al. [39].

2.3. Determination of Ignition Delay

The time interval between the start of the injection and the start of the combustion, related to the ignition delay, was here determined using the method proposed by Reddy et al. [40].
The method is based on the analysis of the pressure curve as a function of the crank angle, considering that the behavior of the pressure is influenced by the injection and the burning of the fuel. As soon as the fuel is injected, the rate of pressure rise inside the combustion chamber decreases due to evaporation of the fuel, which reduces the in-cylinder temperature and slows down the rate of pressure rise. This phenomenon represents an inflection point in the pressure curve and a maximum point on the corresponding first derivative curve. At the beginning of the combustion, an inverse phenomenon occurs. The release of energy by combustion produces a sudden rise in temperature and pressure, representing a new inflection point on the pressure curve and a minimum point on the first derivative curve. The inflection points represent maximum or minimum points on the first derivative curve and, therefore, zero values on the corresponding second derivative curve. Following this analysis, the injection and ignition angles were determined as the crank angles where the second derivative of the pressure with respect to the crank angle was zero in the time interval analyzed. The complete description of the determining of ignition delay is presented in Garzón et al. [37].

2.4. Experimental Heat Release Rate

The post-processing of pressure measurements is known as the heat release rate analysis, and it is performed during the compression and expansion strokes, while the valves remain closed. The combustion chamber is modeled according to zero-dimensional modeling proposed by Krieger and Borman [34] applied to the control volume defined by the engine cylinder. The only mass flow across the boundary is the fuel injected, assuming no leaks through possible gaps in the cylinder. The energy and the mass conservation equations for this control volume are
d ( m u ) d t = d Q d t p d V d t + h f d m f d t
d m d t = d m f d t
where d Q / d t represents the heat transfer rate through system boundaries, p d V / d t is the work rate performed by the system due to system boundary displacement, d m / d t is the mass flow rate across the system boundary, u is the specific internal energy of the gas inside the system boundary, h f is the fuel enthalpy, and d m f / d t is the mass fuel flow rate.
Following the hypothesis that fuel injection is the only mass changing in the cylinder and that the single combustion model assumes a complete burning instantaneously as it enters the combustion chamber, and also that the thermodynamics states of the working fluid are affected by the chemical energy release, the term d m f / d t can be considered as the mass burning rate of the fuel.
The equivalence ratio ϕ at each instant is
d ϕ d t = 1 m a ( F A ) s d m f d t
where (FA)s corresponds to the stoichiometric fuel/air ratio and m a to the mass air. Since the properties of the gases in the cylinder are a function of T, p, and ϕ, the internal energy u and the gas constant R g can be expressed as
d u d t = u T d T d t + u p d p d t + u ϕ d ϕ d t
d R g d t = R g T d T d t + R g p d p d t + R g ϕ d ϕ d t
The equation of state is also considered in the analysis as an ideal gas mixture. Thus, in a differential form,
1 V d V d t + 1 p d p d t = 1 T d T d t + 1 R g d R g d t + 1 m d m d t
The temperature variation as a function of time and the fuel burning rate is obtained from Equations (1)–(6). Thus,
d T d t = [ 1 V d V d t + ( 1 p 1 R g R g p ) d p d t ( 1 R g m a ( F A ) s R g ϕ + 1 m ) d m f d t ] 1 T + 1 R g R g T
d m f d t = d Q d t ( m V D + p ) d V d t [ m D ( 1 p 1 R g R g p ) + m u p ] d p d t u h f + m m a ( F A ) s u ϕ D m D R g m a ( F A ) s R g ϕ
where
D = u T ( 1 T + 1 R g R g T ) 1
The volume variation is calculated from the geometrical relations of the engine. The pressure values and the corresponding first derivative were obtained from experimental data collected from the in-cylinder pressure readings. The thermodynamic properties and the corresponding partial derivatives related to the temperature, pressure, and equivalence ratio are determined by using the routines proposed by Olikara and Borman [41].
The heat transfer to the walls was modeled considering heat exchange by convection and radiation, using the Hohenberg correlation for calculating the heat transfer coefficient [42] and the gas global emissivity as reported by Watson and Janota [43].
Equations (7) and (8) are solved numerically to obtain the mean gas temperature and the fuel mass burned. It is a nonlinear ordinary differential equations system, in this work, solved by the Runge–Kutta method using MATLAB software 2013 [44].
The heat release rate is calculated from the fuel burning rate and its lower heating value (LHV), so that
d Q f d t = L H V d m f d t

3. Results and Discussion

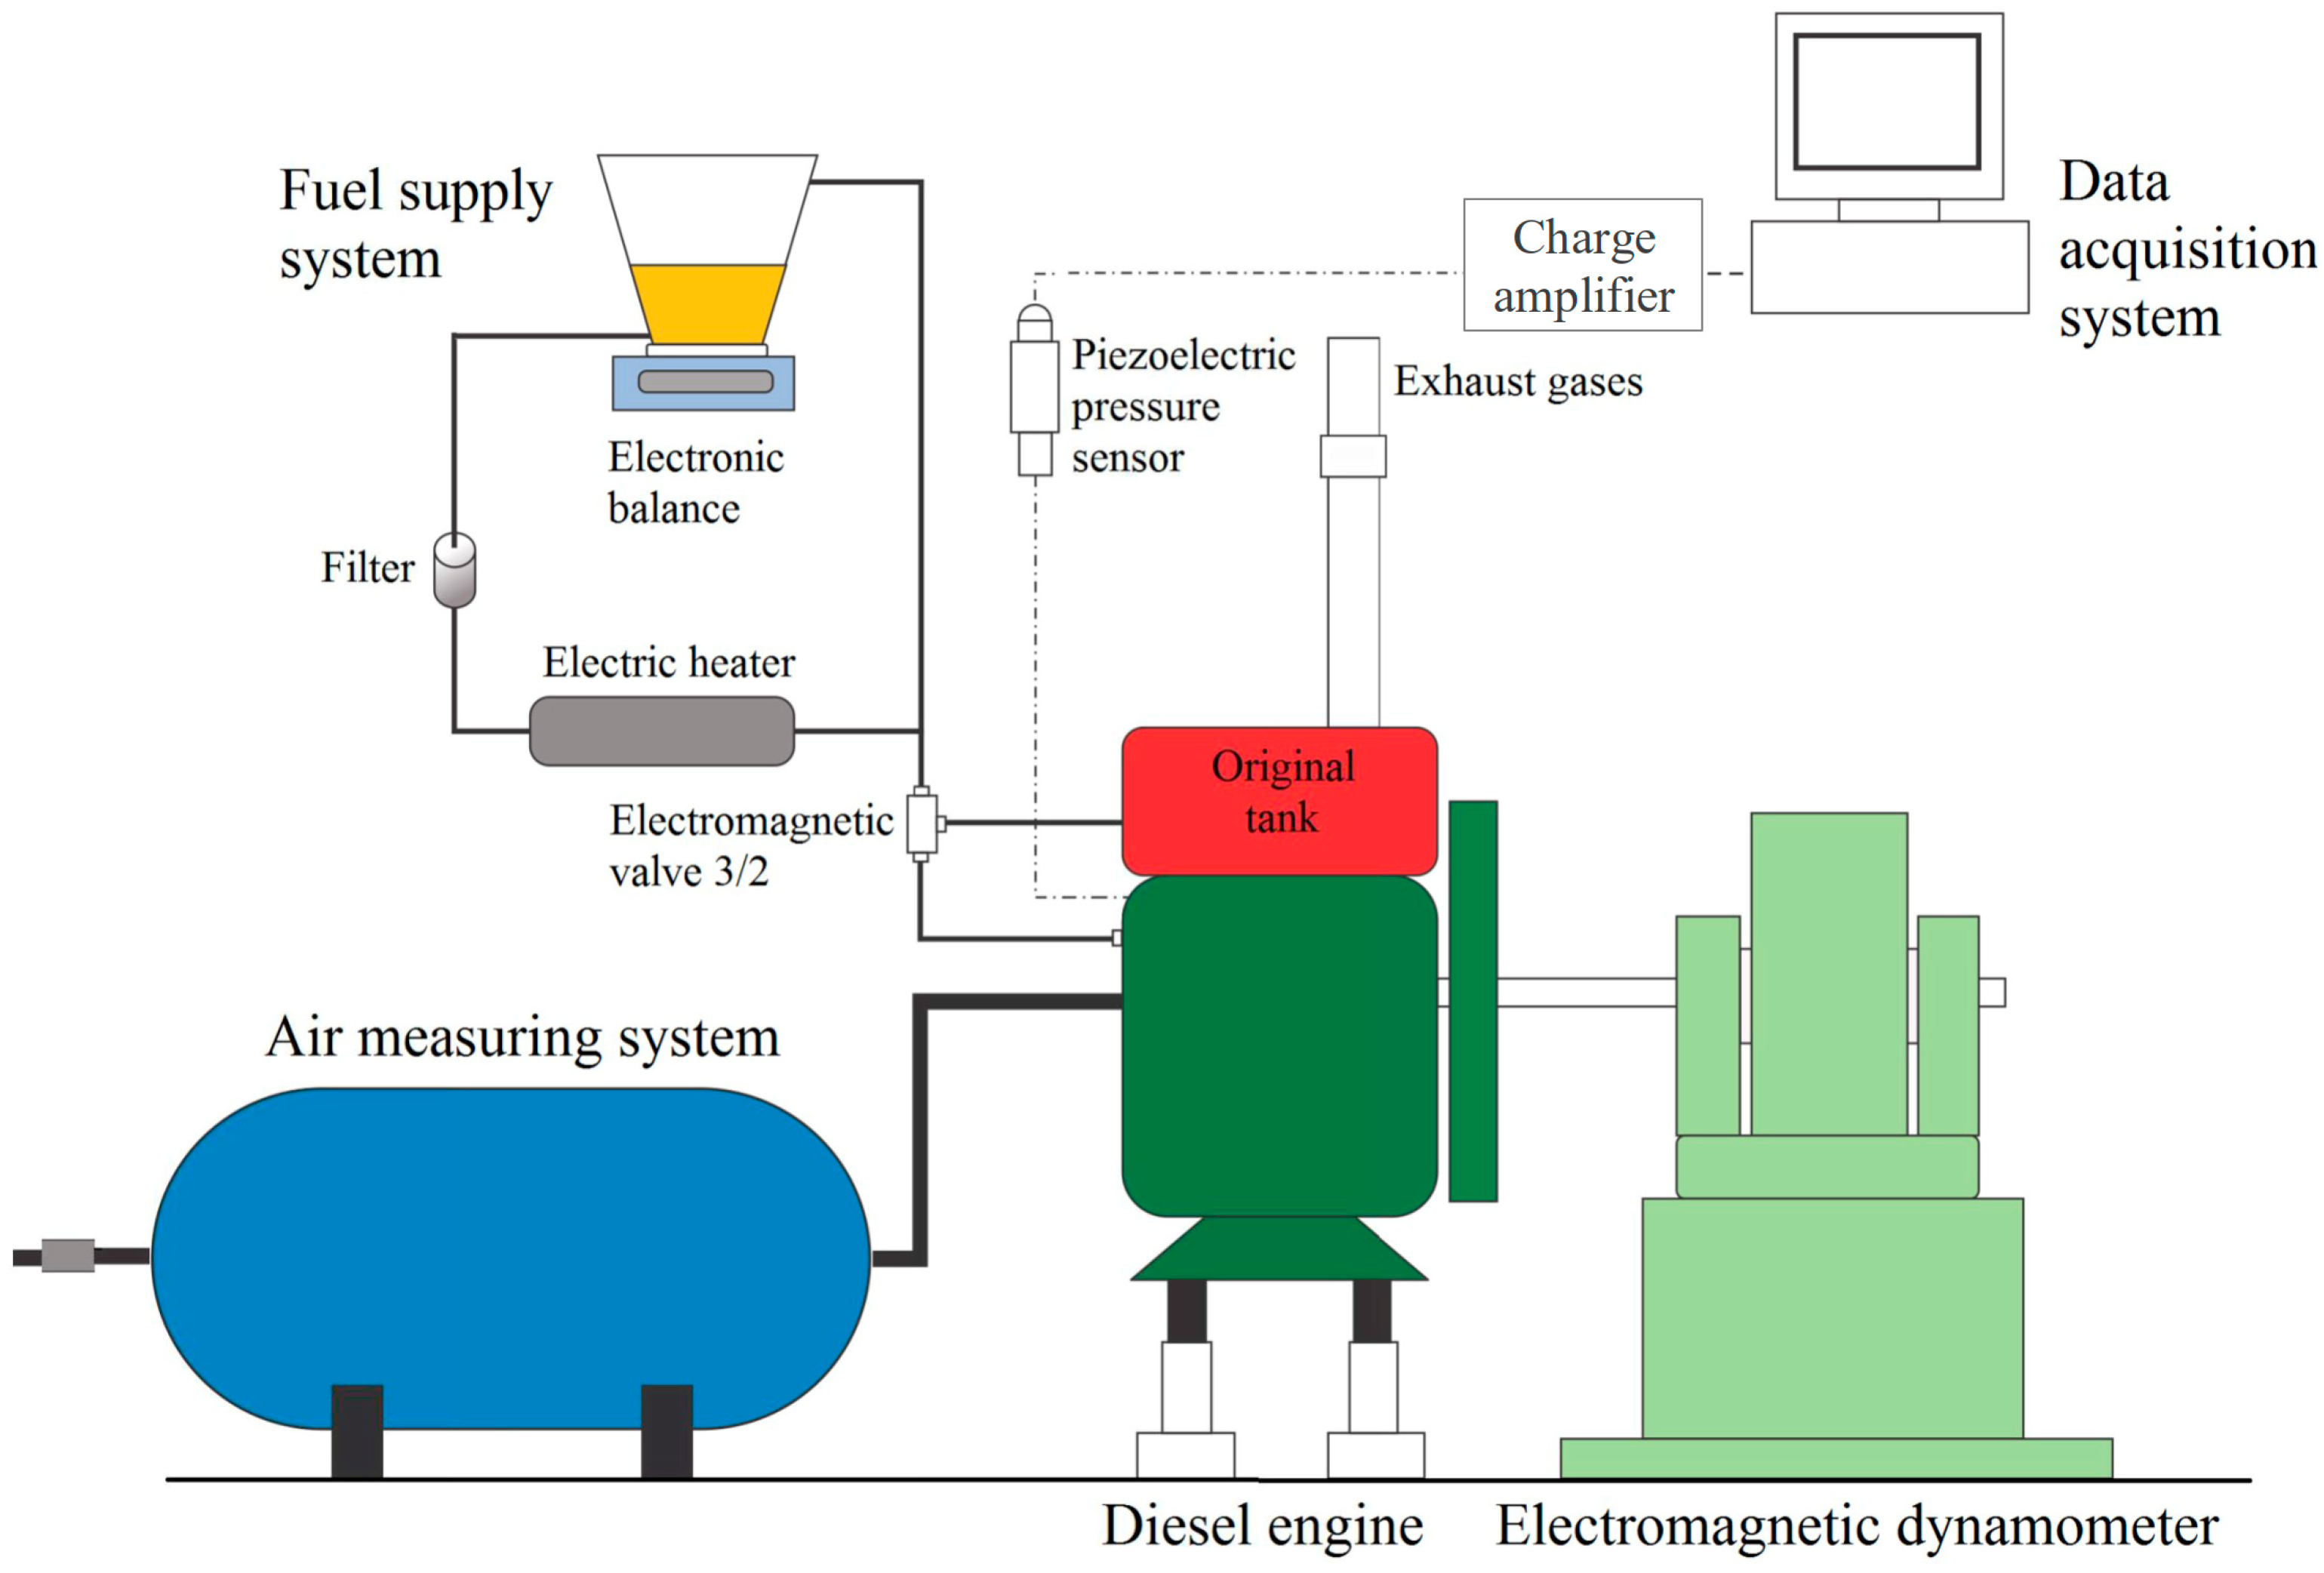
In order to fulfill the proposed objectives, the main results are presented here, concerning the in-cylinder pressure, ignition delay, heat release rate, and atomization analysis of fuel spray. Regarding performance parameters, the main results were comparable for all fuel tested in correspondence with other works reported in the literature. These results are not presented in order to emphasize the analysis of the combustion process.

3.1. In-Cylinder Pressure

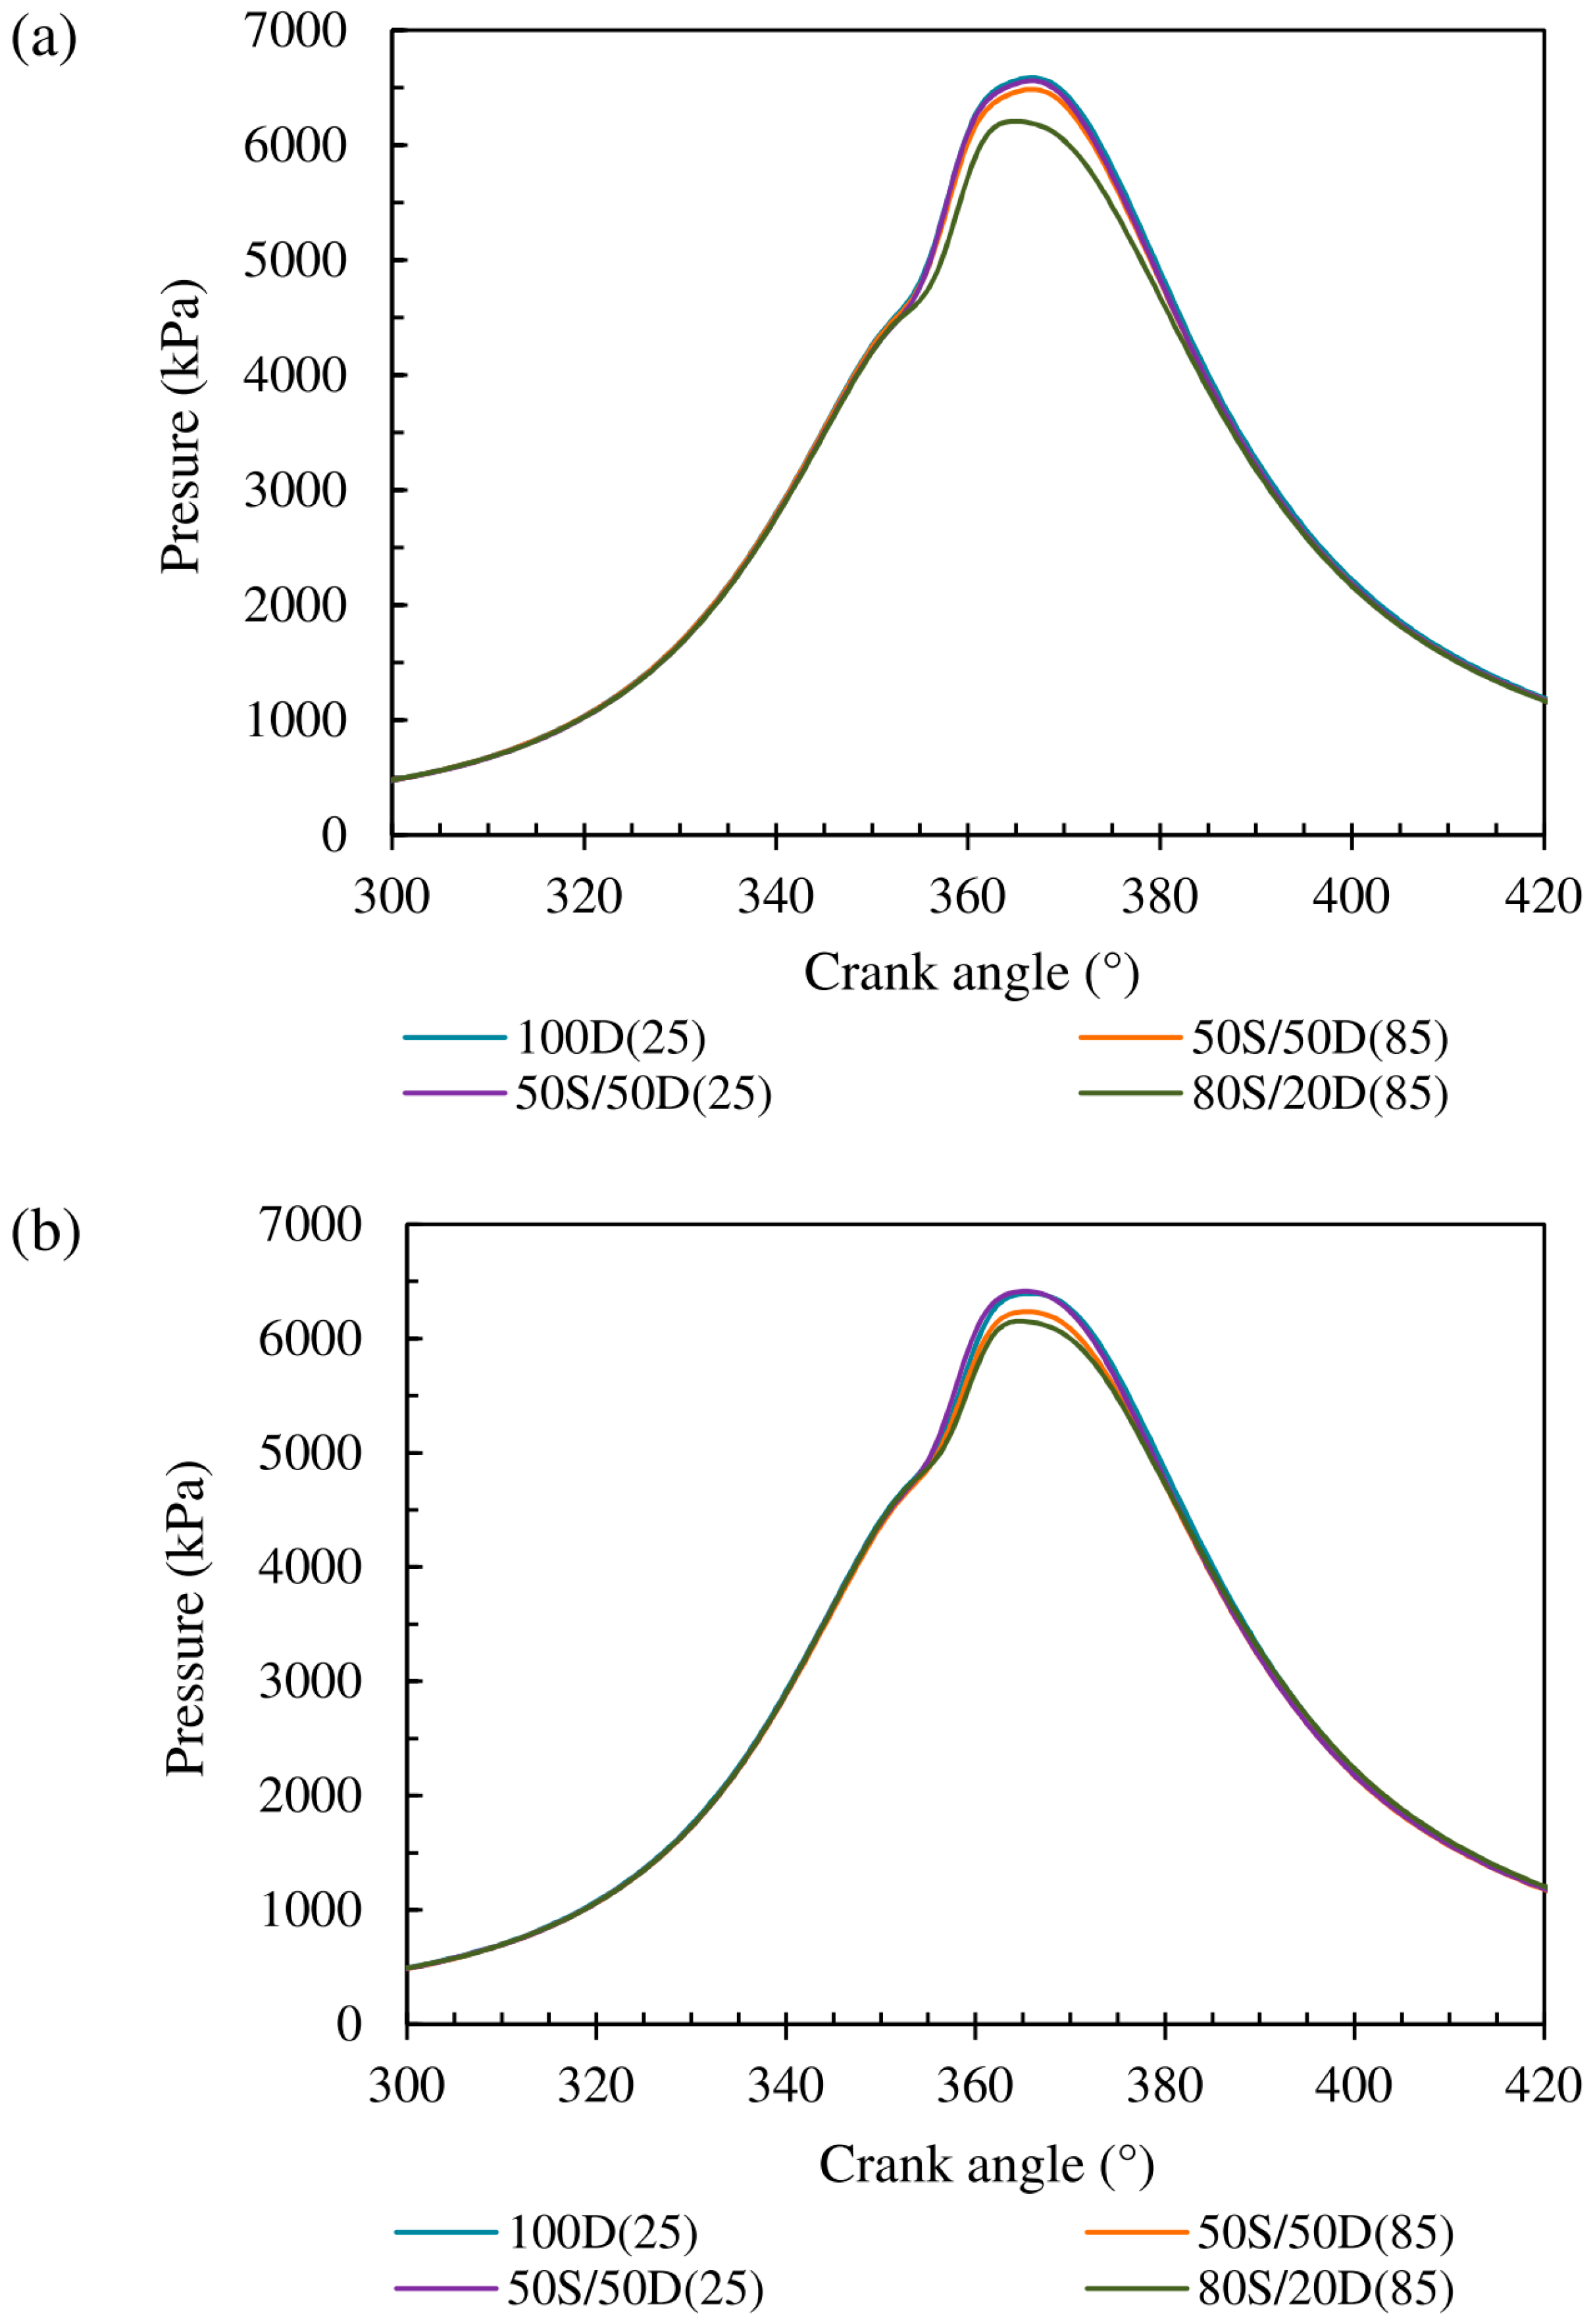
The in-cylinder pressure data as a function of crank angle for the fuels tested at 1800 and 2100 rpm are shown in Figure 2. The highest pressures are observed at the lowest speed as a consequence of the high load and, therefore, the highest fuel amount injected per cycle. High-pressure values are related to the fuel LHV, the ignition delay, and the development of the heat release rate in the premixed phase during the combustion of each sample.
The start of the ignition produces a slope change of the pressure curves, close to 360° CA. In this context, one observes an ignition more delayed for the blend 80S/20D(85) for both engine speeds. The maximum pressure value presented for each fuel at each speed and the corresponding crank angle are shown in Table 5, including the percentage difference relative to diesel oil. At 1800 rpm, the highest maximum pressure was presented for diesel oil 100D(25) and the blend 50S/50D(25). The lowest maximum pressure was presented by the blend 80S/20D(85), being about 6% lower than the maximum pressure of the diesel oil. Similar behavior was observed at 2100 rpm, decreasing to 4% of the difference between the maximum pressure of the diesel oil and the blend 80S/20D(85).

3.2. Ignition Delay

The experimental results regarding ignition delay are presented for all fuels tested at 1800 and 2100 rpm in Table 6. The expanded uncertainty for ignition delay was calculated as ±0.71° CA. The results confirm the highest ignition delay for the 80S/20D(85), as previously mentioned, regarding the slope change of the pressure curves.

3.3. Heat Release Rate

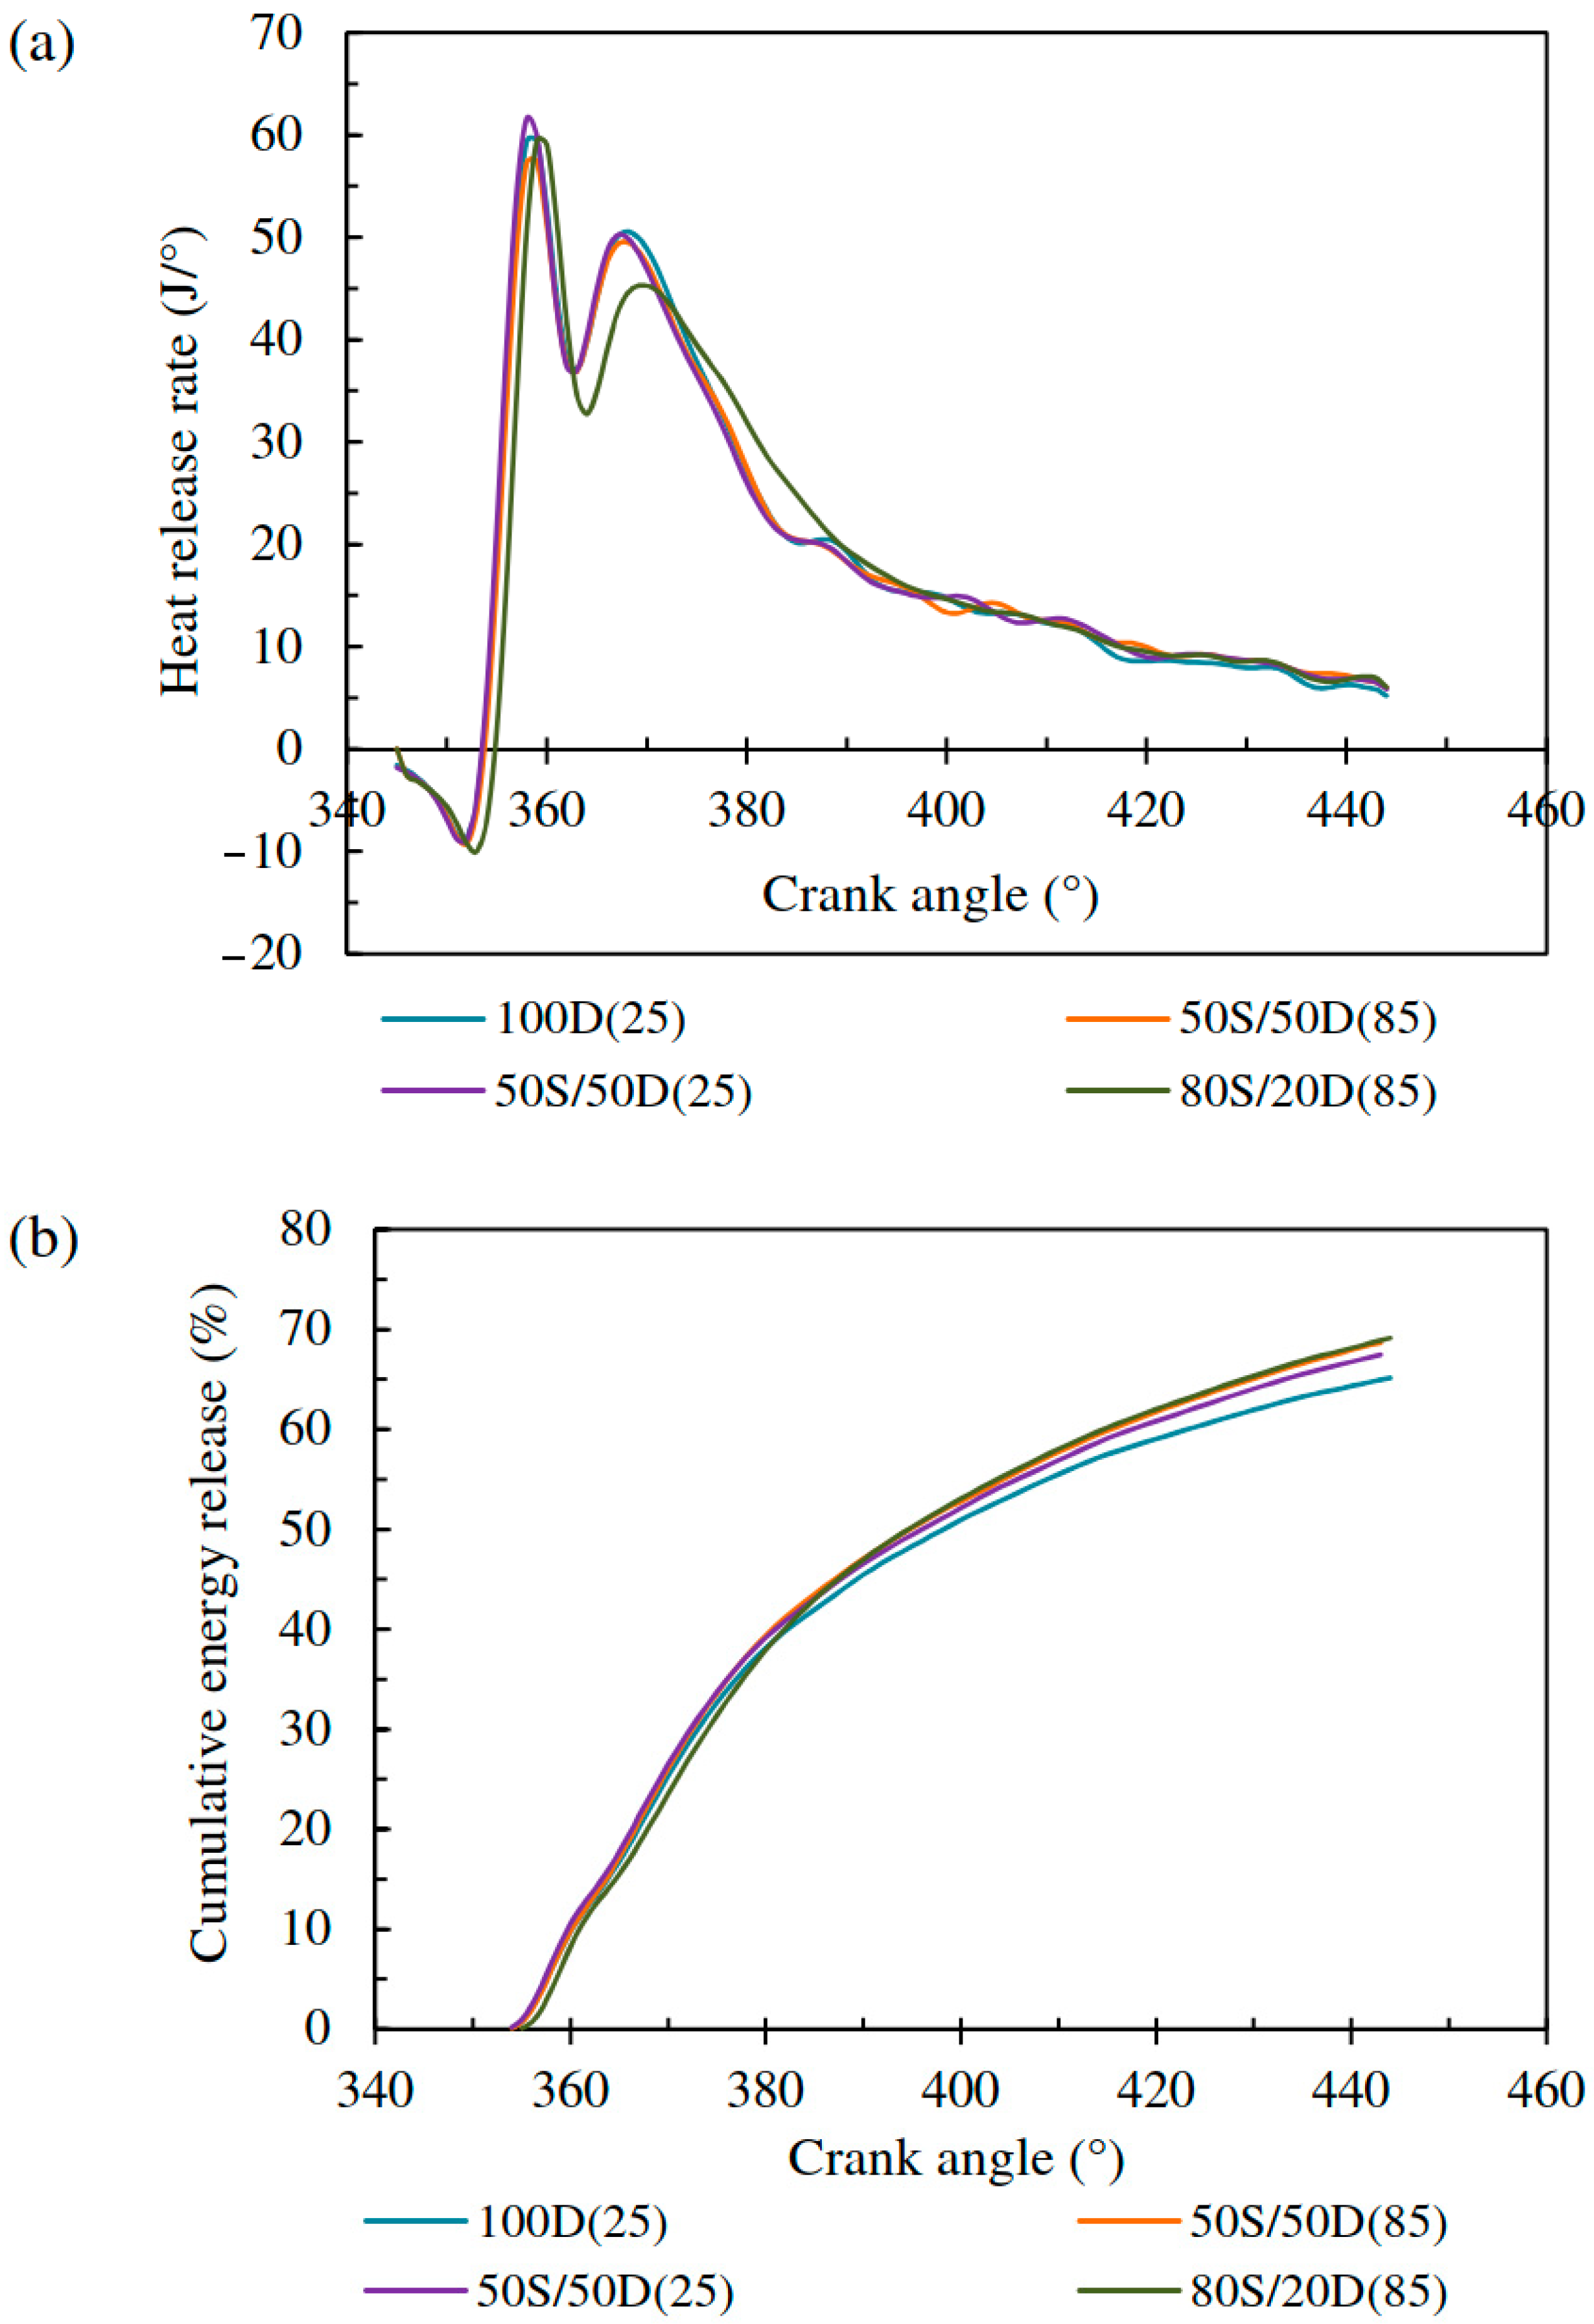
The heat release rate and the corresponding cumulative energy release obtained for the fuels at 1800 and 2100 are presented in Figure 3 and Figure 4, respectively. The heat release rate curves evidence the premixed and nonpremixed (diffusive) combustion phases. Additionally, a significant residual combustion phase is also observed.
The heat release rate increases with the load, i.e., with the speed reduction, where the mass fuel injected per cycle increases. Observing the curves of cumulative energy release, the combustion performance presented a similar behavior in the premixed combustion phase for all fuels tested, changing in the nonpremixed combustion phase, where we observed a significant difference among the fuels.
The heat release rate in the premixed combustion phase is influenced by the ignition delay. Consequently, for both engine speeds, one observes that all fuels present a similar premixed combustion phase, corresponding to a similar ignition delay, as shown in Table 6. In the case of the blend 80S/20D(85), the heat release curve begins slightly delayed as a result of its ignition delay that is slightly higher with respect to the other fuels. At 1800 rpm, the higher premixed combustion rate is related to the load increase and the time increase per each crank angle degree corresponding to the speed reduction, which favors the air–fuel mixing and the burning.
At 1800 rpm, the diesel oil 100D(25) and the blends 50S/50D(25) and 50S/50D(85) presented the highest peak of the heat release rate in the diffusive phase. From 380° CA, approximately, the heat release rate increased for the blend 80S/20D(85) in comparison with the other fuels (residual combustion phase), which shows the combustion delay of this blend and the effect of the highest oxygen content in the fuel that favors the burning, such that the cumulative energy release is high for the blends 80S/20D(85) and 50S/50D(85). The 100D(25) oil presented the lowest cumulative energy release. Similar results were reported by Kannan et al. [45] in their work with oxygenated fuels.
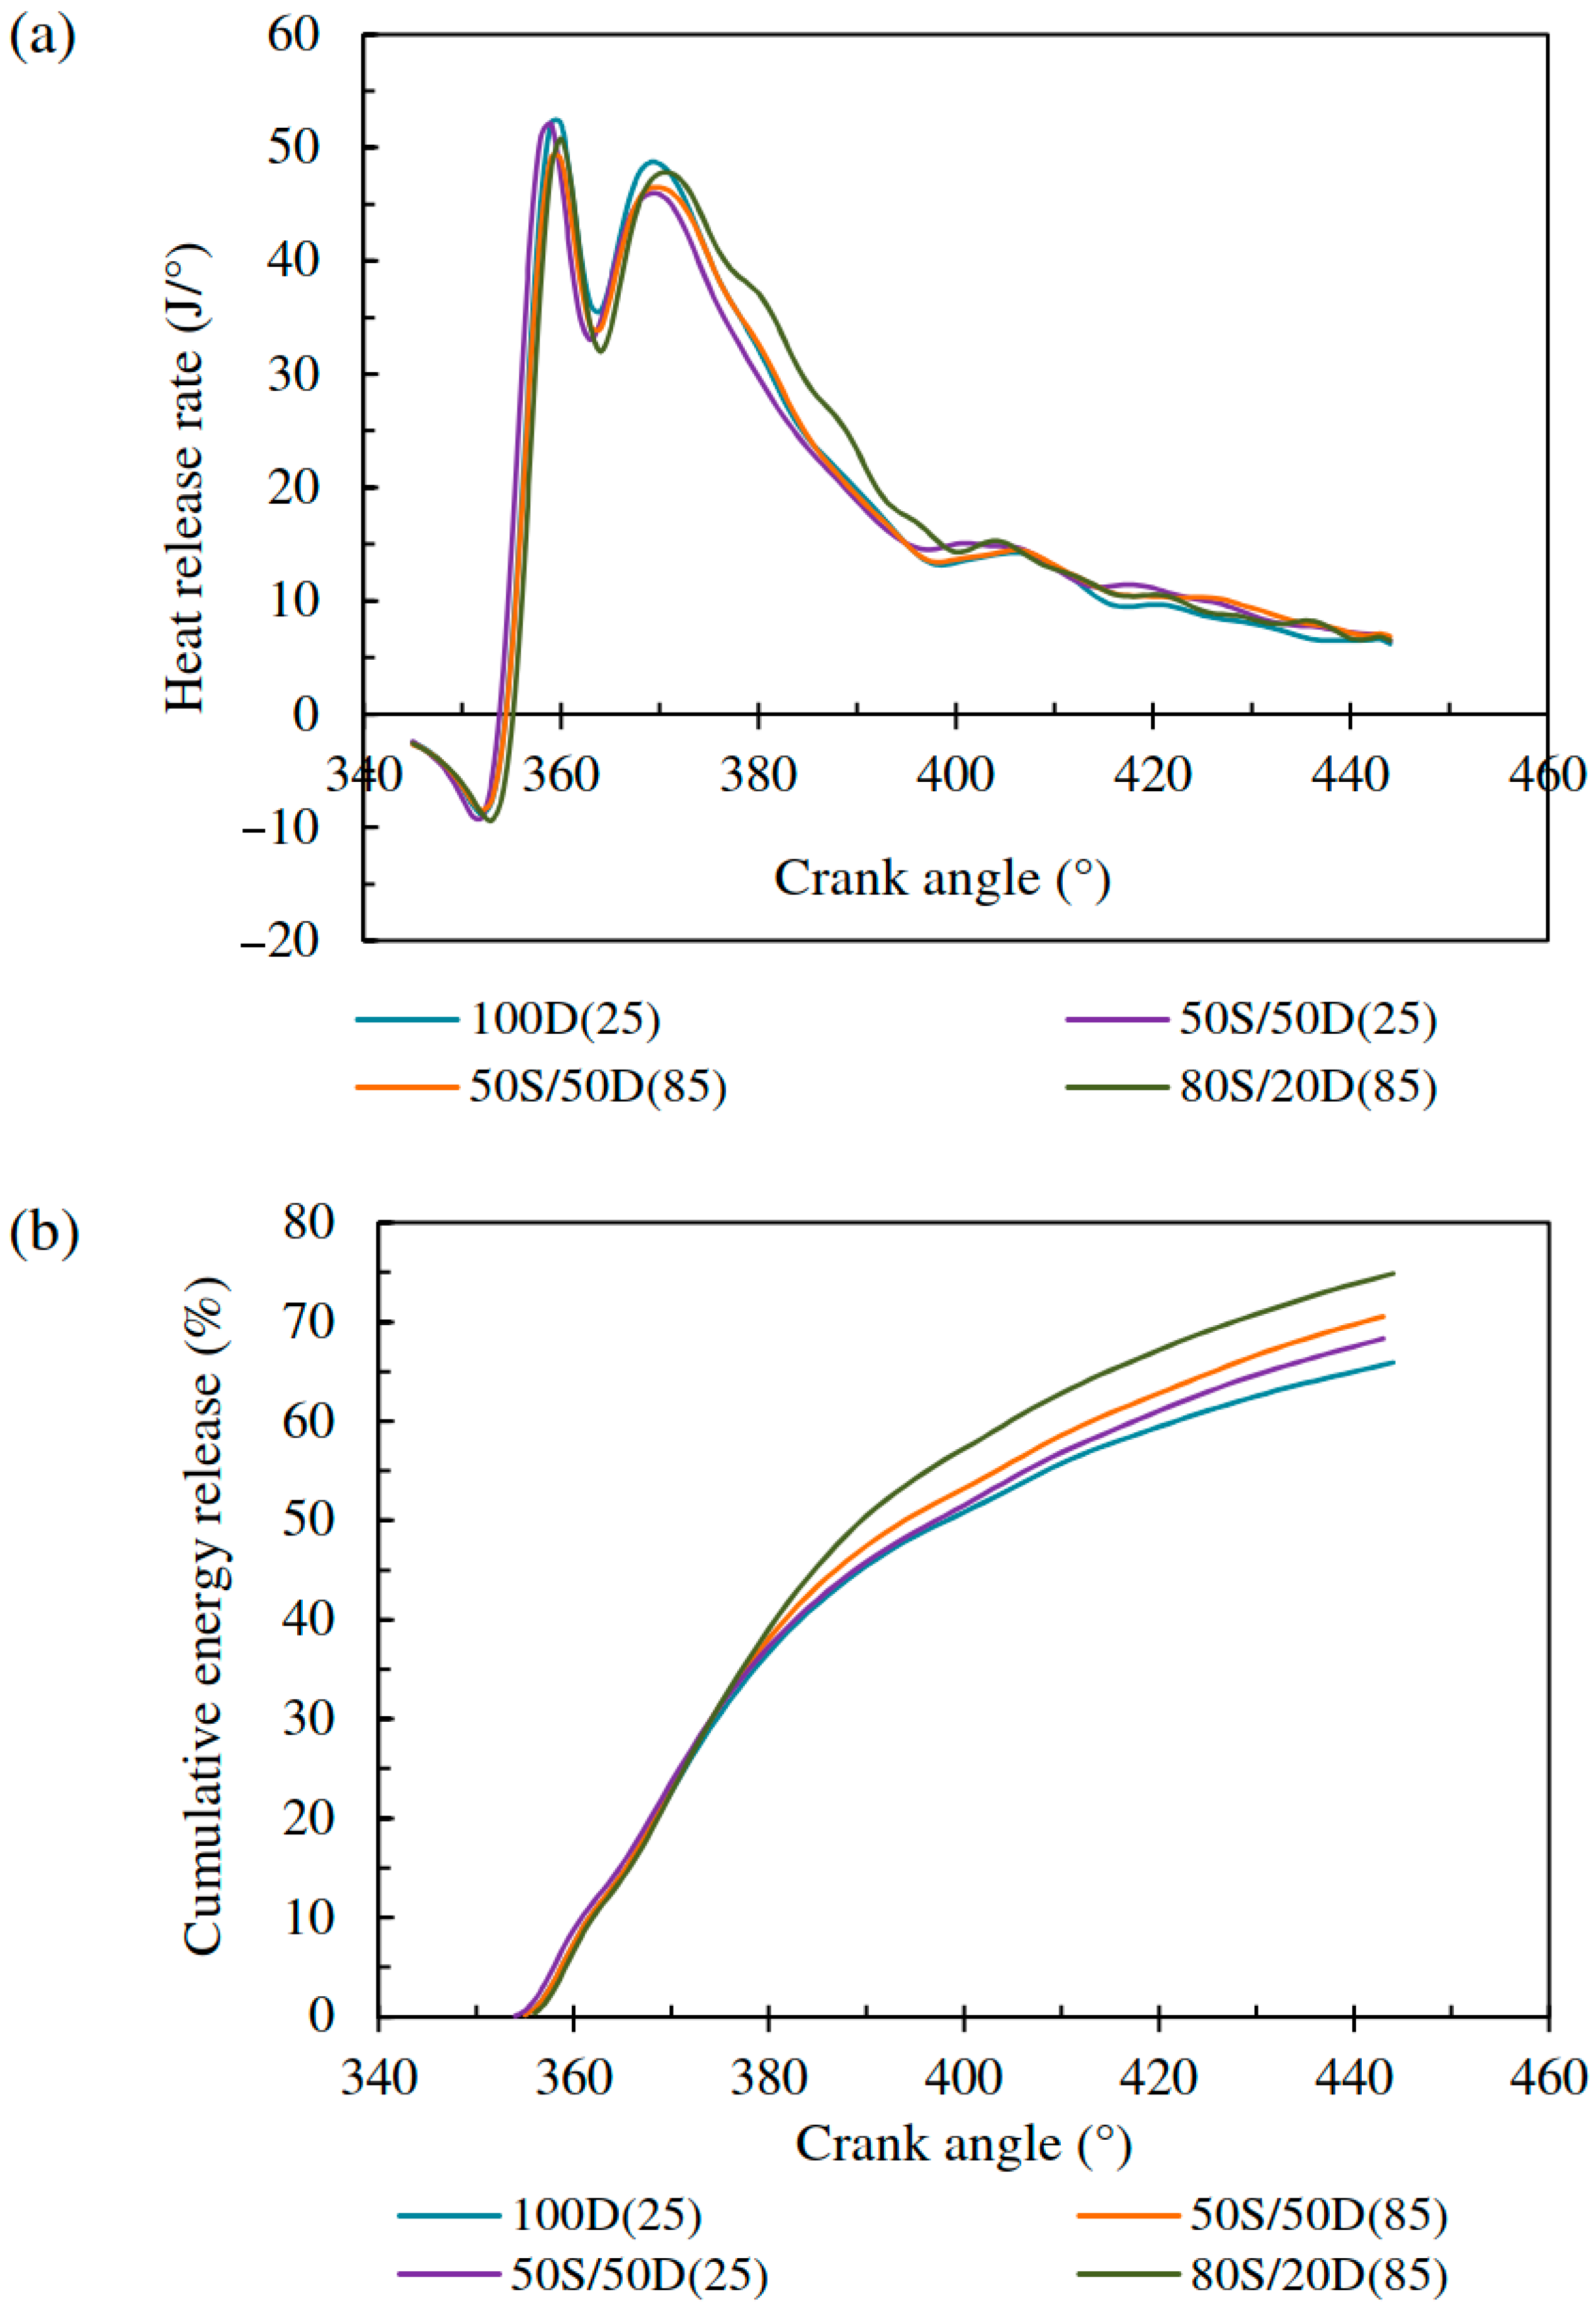
At 2100 rpm, the diesel oil 100D(25) and the blend 80S/20D(85) presented the highest peak of the heat release rate in the diffusive phase. In the residual combustion phase, the blend 80S/20D(85) presented the highest heat release rate. Once more, the blend 80S/20D(85) presented the highest cumulative energy release, increasing the overall reactive rate in the diffusive and residual combustion phases. The burning of the blends 50S/50D(25) and 50S/50D(85) presented similar cumulative energy release, being slightly higher for the blend 50S/50D(85). The diesel oil presented the lowest cumulative energy release. For the blends, the cumulative release energy was higher at 2100 rpm than at 1800 rpm.
In general, for fuels 100D(25), 50S/50D(25), and 50S/50D(85), the highest diffusive combustion rate was obtained at 1800 rpm (higher mass fuel injected), decreasing in the residual combustion phase as a consequence of high heat transfer (higher time per crank angle and higher gas temperature). At 2100 rpm, we observed the highest residual combustion rate, favored by the tumble and swirl effects, possibly present in the combustion chamber at that engine speed. In the case of the blend 80S/20D(85), the highest diffusive and residual combustion rates were observed at 2100 rpm as a consequence of the combustion delay and the effect of the turbulence and blend oxygen content that favor the burning at this speed.
The curves of the heat release rate were developed over compression and expansion strokes of the engine operating cycle when valves were closed. Consequently, the final point of the curves was 444° CA, where the exhaust valve started to open. Based on the curves of cumulative energy release, one can observe that the total mass fuel injected did not burn completely, continuing the burning during the exhaust stroke. Table 7 presents the mass fraction burned at 444° CA for all fuels at the two speeds tested. The values of the mass fraction burned are lower than 100%. One can consider that the low values calculated for the total mass fraction burned are a consequence of the model employed for the heat transfer coefficient, which probably underestimates the heat transfer for the walls; therefore, the heat release rate is also underestimated, signifying low mass fraction burned.
As shown in Table 7, the mass fraction burned increased with the speed increase or load reduction where the mass fuel injected per cycle and the global equivalence ratio were less (see Table 8). The highest mass fraction burned was presented for the blend 80S/20D(85) at both speeds, with the difference in comparison to 100D(25) at 2100 rpm being more significant. Additionally, one can see that the lowest global equivalence ratio and the turbulence produced by high speeds favor the air–fuel mixing and, consequently, the mass fraction burned.

3.4. Atomization Analysis

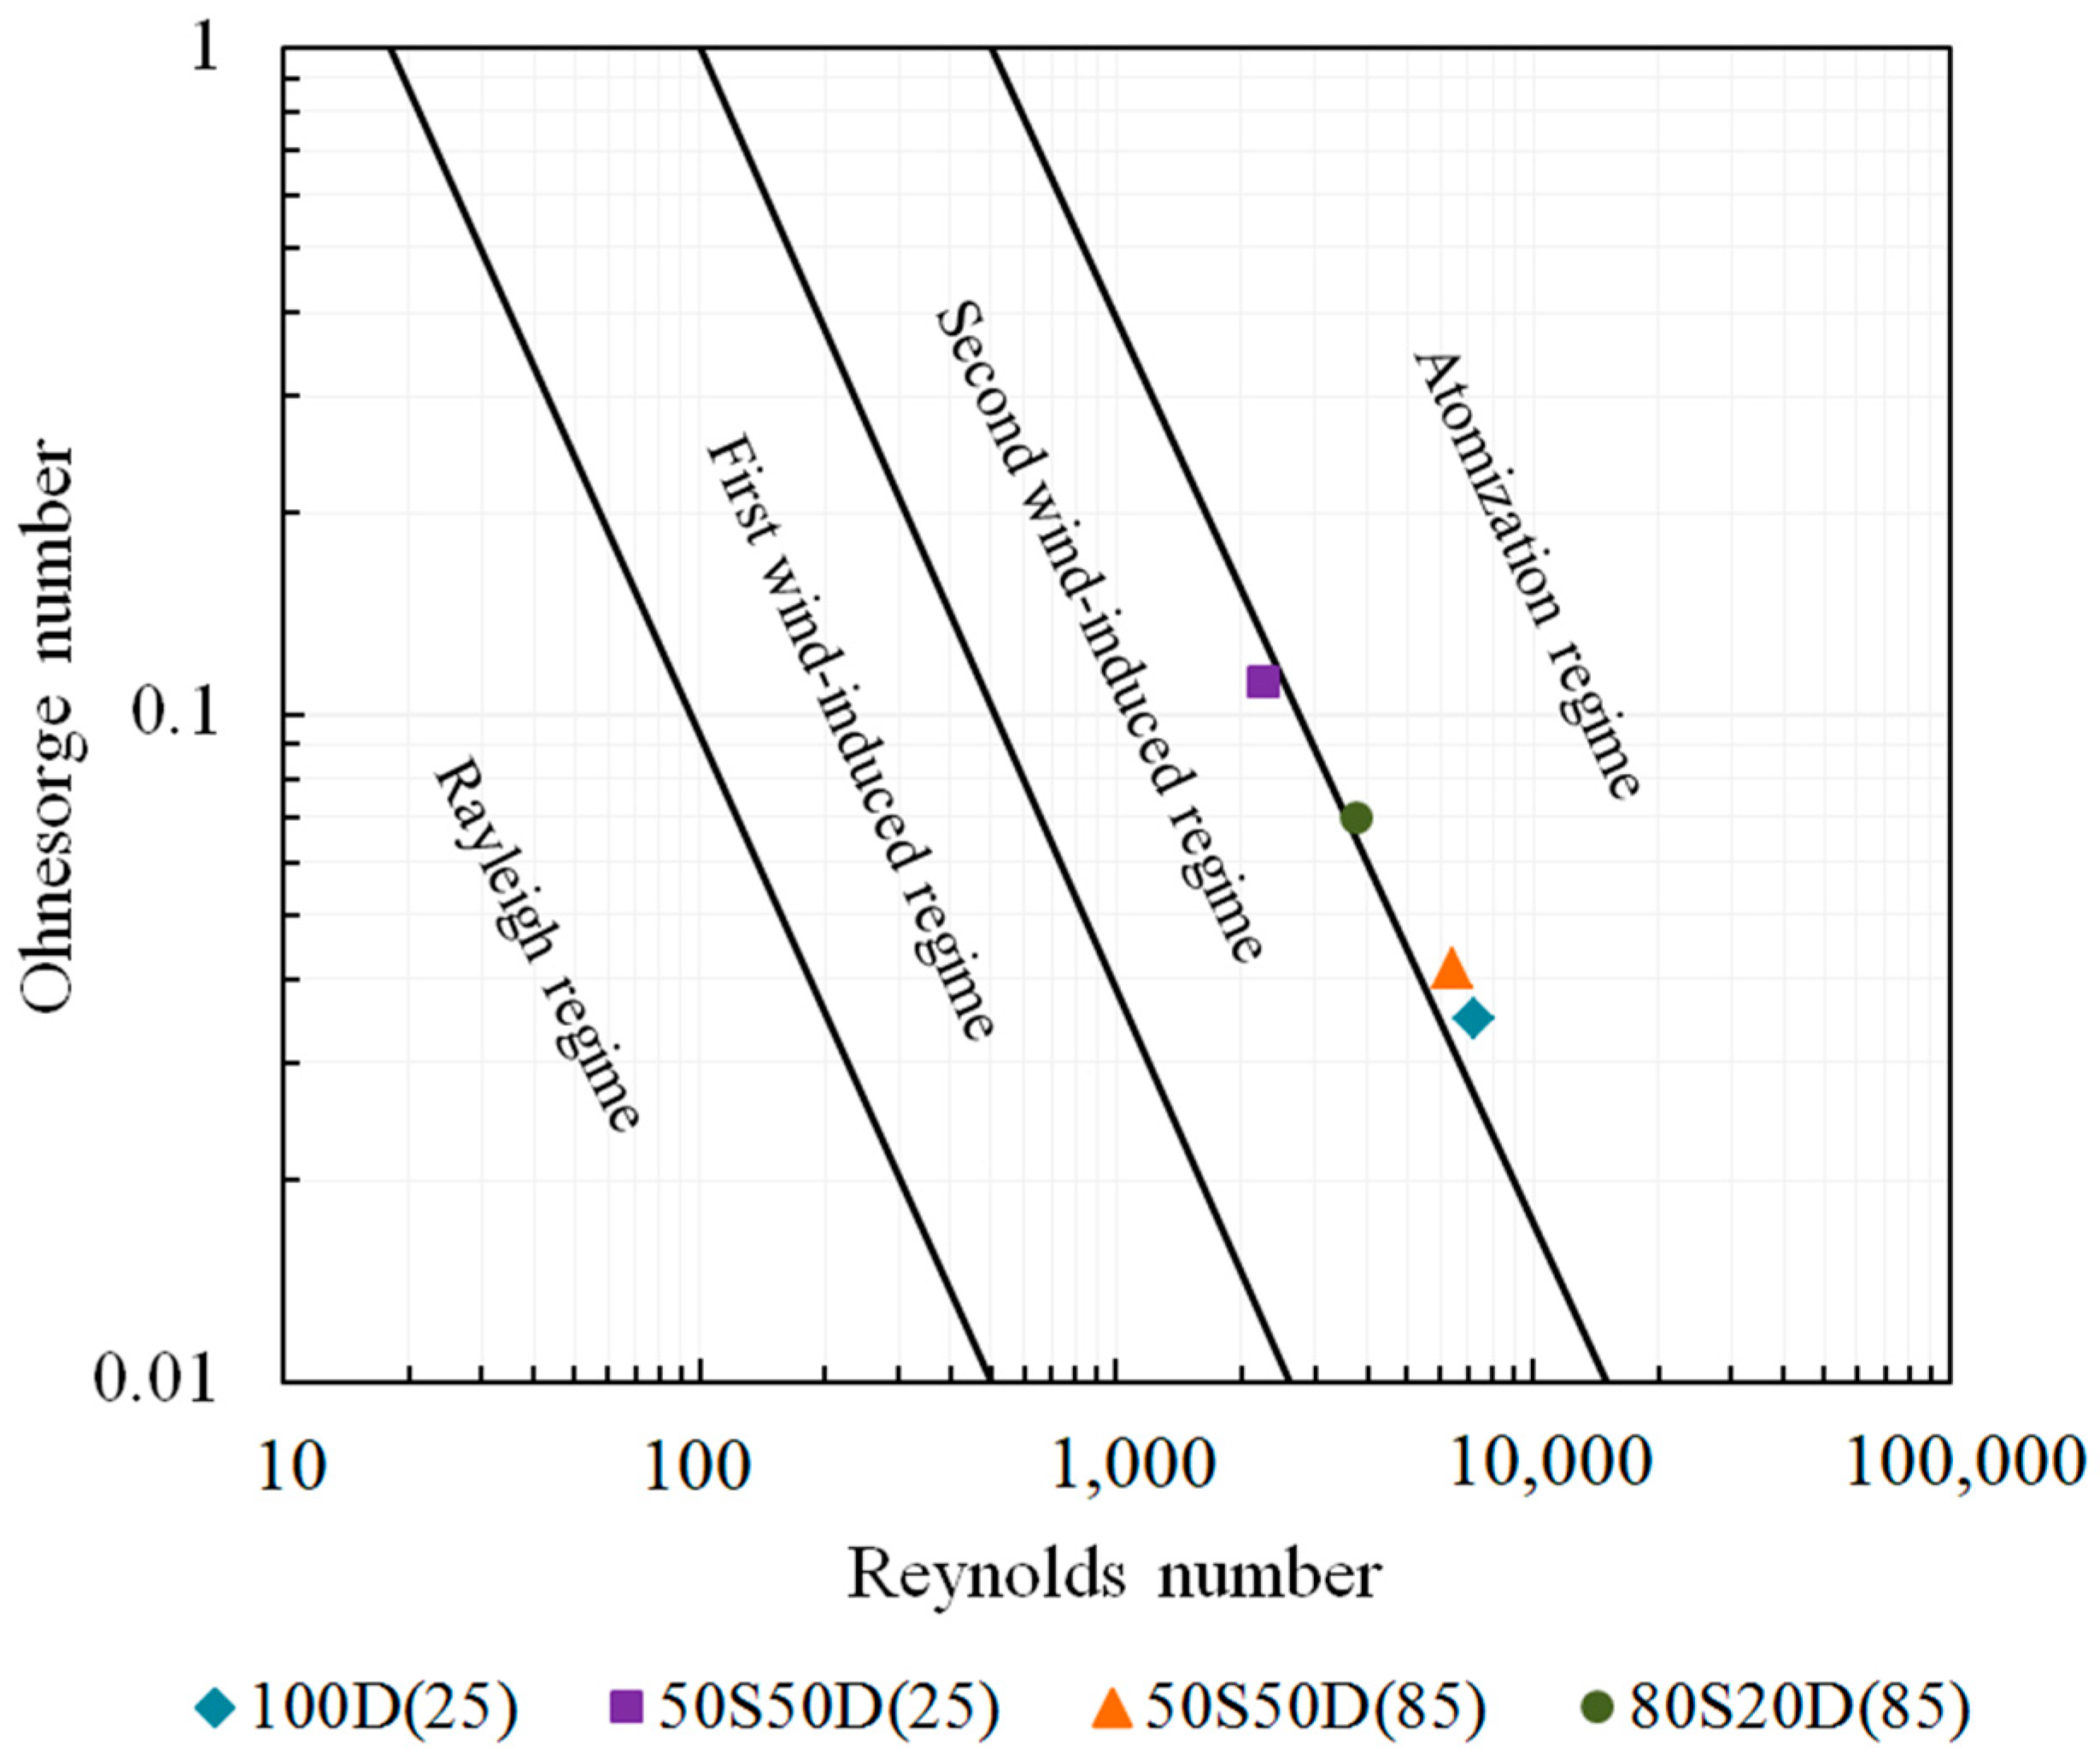
The jet pattern is a significant factor in the combustion process. It is influenced by the injection parameters and the physical fuel properties. The primary disintegration or break-up regime of the fuel jet in diesel engines must be the atomization regime. The Ohnesorge diagram permits the identification of the break-up regime, relating the Ohnesorge number with the Reynolds number of the spray. The dimensionless numbers required to build the Ohnesorge diagram are
R e s p = ρ f u s p d o μ f
W e s p = ρ f u s p 2 d o σ f
O h = W e s p R e s p
where R e s p , W e s p , and Oh are Reynolds, Weber, and Ohnesorge dimensionless numbers of the spray, respectively; u s p is the spray velocity; d o is the injector nozzle hole diameter; and ρ f , μ f , and σ f are the density, dynamic viscosity, and surface tension of the fuel, respectively. The injector nozzle hole diameter was 0.3 mm, and the fuel properties were calculated at respective injection temperatures using the correlations previously reported in Garzón et al. [37].
In order to help understand the combustion process, the break-up regime (Ohnesorge diagram), SMD (Sauter mean diameter), droplet Reynold number, and oxygen content were estimated for all fuels tested at 1800 rpm. The results are shown in Figure 5 and Table 9. The SMD was calculated using the correlation proposed by Hiroyasu and Arai [46]. Thus,
S M D d o = 0.38 Re s p 0.25 W e s p 0.32 ( μ f μ g ) 0.37 ( ρ f ρ g ) 0.47
where μ g and ρ g are the dynamic viscosity and density of the gas, respectively. The gas dynamic viscosity was calculated as μ g = 4.57 × 10 7 T 0.645 , according to Annand [47]. The droplet Reynold number was calculated as follows:
Re D = ρ g ( u s p S p ) S M D μ g
where S p is the piston velocity (gas velocity).
According to Ohnesorge diagram, the blend 50S/50D(25) does not present the atomization regime required for diesel engine combustion, and the break-up regime of the blend 80S/20D(85) is between second-wind-induced and atomization regimes. In the case of the blend 50S/50D(85), the heating favored the break-up, reaching the atomization regime.
Concerning the results shown in Table 9, the blend 50S/50D(25) presents the highest SMD, being 15.5% higher than the SMD of 100D(25). The highest droplet Reynold number is also presented by blend 50S/50D(25), and the blend 80S/20D(85) has the maximum oxygen content.
Although blends 80S/20D(85) and 50S/50D(25) are not in an atomization regime and present the highest SMD, the diesel engine operated satisfactorily with these blends and the combustion results were comparable with the other two fuels. In the case of the blend 50S/50D(25), one can suggest that the highest SMD favored the droplet Reynold number and, therefore, its evaporation constant or average area reduction rate of the droplet. For the blend 80S/20D(85), the high SMD and the highest fraction of vegetable oil led to a combustion delay, characterized by high diffusive and residual combustion phases; however, the oxygen content favored its combustion.
Additionally, in relation to the combustion of a binary liquid blend droplet (diesel + straight vegetable oil), products of oil degradation can help or can inhibit the ignition; therefore, it is not clear what occurs in the premixed combustion phase when comparing the blends 50S/50D(25) and 50S/50D(85).
The results analyzed confirm that the jet pattern is influenced by the injection parameters and the physical fuel properties. The combustion of soybean oil blends will be enhanced with high fuel temperature, high engine speed, low injection timing, high injection pressure, and high compression ratio (high in-cylinder temperature and pressure at injection timing).

4. Conclusions

This work was aimed at the applicability analysis of soybean oil blends in compression ignition engines, studying the heat release rate obtained from in-cylinder pressure measurements.
Tests on the dynamometric bench were carried out for diesel oil and two blends, 50/50% v/v and 80/20% v/v of soybean and diesel oils. The engine was tested at 1800 and 2100 rpm. In-cylinder pressure readings were recorded and processed to calculate the heat release rate using a zero-dimensional approach. The maximum in-cylinder pressure, ignition delay, and spray parameters were also determined. The results evidenced the premixed, nonpremixed (diffusive), and residual combustion phases. The influence of the physicochemical fuel properties was also evidenced in the experimental results.
The premixed combustion phase was similar for all fuels tested at 1800 and 2100 rpm. For the blend of 80% soybean oil, the high SMD (Sauter mean diameter) and the highest fraction of vegetable oil led to a combustion delay, characterized by high diffusive and residual combustion phases. However, the oxygen content, heating, and high engine speeds favored its combustion. Products of vegetable oil degradation may increase or inhibit the ignition, depending on their chemical nature. In the case of the blend of 50% soybean oil, it is suggested that the highest SMD increased the droplet Reynold number and, therefore, the evaporation constant.
Finally, the results allowed us to observe the feasibility of using straight soybean oil and diesel oil blends as alternatives for electricity generation for replacing diesel oil in isolated regions and also small applications demanded by the agro-industrial sector. Additionally, the results will support the development of a specific combustion model for straight vegetable oils in order to model and optimize the diesel engine operation with these biofuels.

Author Contributions

Conceptualization, N.A.N.G., A.A.M.O. and E.B.; methodology, N.A.N.G., A.A.M.O. and E.B.; software, N.A.N.G.; validation, N.A.N.G.; data curation, N.A.N.G.; formal analysis, N.A.N.G., A.A.M.O. and E.B.; writing—original draft preparation, N.A.N.G.; writing—review and editing, N.A.N.G., A.A.M.O. and E.B.; supervision, A.A.M.O. and E.B. All authors have read and agreed to the published version of the manuscript.

Funding

This research was funded by CNPq (National Council for Scientific and Technological Development, Grant number: 201205451), and by Mechanical Engineering Graduate Program at Federal University of Santa Catarina.

Institutional Review Board Statement

Not applicable.

Informed Consent Statement

Not applicable.

Data Availability Statement

The original contributions presented in the study are included in the article, and university library collection at https://pergamum.ufsc.br/acervo/352068 (accessed on 23 September 2024). Further inquiries can be directed to the corresponding author.

Acknowledgments

The authors acknowledge CNPq (National Council for Scientific and Technological Development) for the scholarship for N.A. Nieto Garzón, and Mechanical Engineering Graduate Program at Federal University of Santa Catarina.

Conflicts of Interest

The authors declare no conflicts of interest.

Nomenclature

Latin Symbols
d o Diameter of the injector nozzle[m]
(FA)sStoichiometric fuel/air ratio[kg/kg]
h f Enthalpy of fuel flow[kJ/kg]
HHVHigher heating value[kJ/kg]
LHVLower heating value[kJ/kg]
mTotal mass[kg]
m a Mass of air inducted into the cylinder[kg]
m f Mass fuel or fuel burned[kg]
OhOhnesorge number[-]
pPressure[kPa]
QHeat transfer through of system boundaries[kJ]
Q f Heat release for the fuel[kJ]
R e D Droplet Reynold number[-]
R e s p Spray Reynold number[-]
R g Gas constant[kJ/(kg∙K)]
S p Instantaneous piston velocity[m/s]
SMDSauter mean diameter[m]
tTime[s]
TTemperature[K]
uSpecific internal energy[kJ/kg]
VVolume[m3]
u s p Spray velocity[m/s]
W e s p Spray Weber number[-]
Greek Symbols
μ f Fuel dynamic viscosity[Pa∙s]
μ g Gas dynamic viscosity[Pa∙s]
ρ f Fuel density[kg/m3]
ρ g Gas density[kg/m3]
σ f Fuel surface tension[N/m]
ϕEquivalence ratio at any instant[-]
ϕ g l Global equivalence ratio[-]

Abbreviations

BTCBefore top-center crank position
CACrank angle
EVCExhaust valve closing
EVOExhaust valve opening
IVCIntake valve closing
IVOIntake valve opening
SVOStraight vegetable oil

References

  1. de Almeida, S.C.A.; Belchior, C.R.; Nascimento, M.V.G.; dos Vieira, L.S.R.; Fleury, G. Performance of a diesel generator fuelled with palm oil. Fuel 2002, 81, 2097–2102. [Google Scholar] [CrossRef]
  2. Duarte, A.R.; Bezerra, U.H.; de Lima Tostes, M.E.; Duarte, A.M.; da Rocha Filho, G.N. A proposal of electrical power supply to Brazilian Amazon remote communities. Biomass Bioenergy 2010, 34, 1314–1320. [Google Scholar] [CrossRef]
  3. Ministry of Mines and Energy—Brazil. Resolution N° 3, March 20, 2023. Available online: https://www.gov.br/mme/pt-br/assuntos/conselhos-e-comites/cnpe/resolucoes-do-cnpe/2023/ResCNPE32023.pdf (accessed on 8 October 2024). (In Portuguese)
  4. Graboski, M.S.; McCormick, R.L. Combustion of fat and vegetable oil derived fuels in diesel engines. Prog. Energy Combust. Sci. 1998, 24, 125–164. [Google Scholar] [CrossRef]
  5. Agarwal, A.K. Biofuels (alcohols and biodiesel) applications as fuels for internal combustion engines. Prog. Energy Combust. Sci. 2007, 33, 233–271. [Google Scholar] [CrossRef]
  6. Sidibé, S.S.; Blin, J.; Vaitilingom, G.; Azoumah, Y. Use of crude filtered vegetable oil as a fuel in diesel engines state of the art: Literature review. Renew. Sustain. Energy Rev. 2010, 14, 2748–2759. [Google Scholar] [CrossRef]
  7. Misra, R.D.; Murthy, M.S. Straight vegetable oils usage in a compression ignition engine—A review. Renew. Sustain. Energy Rev. 2010, 14, 3005–3013. [Google Scholar] [CrossRef]
  8. Agarwal, D.; Kumar, L.; Agarwal, A.K. Performance evaluation of a vegetable oil fuelled compression ignition engine. Renew. Energy 2008, 33, 1147–1156. [Google Scholar] [CrossRef]
  9. Hartmann, R.M.; Garzón, N.N.; Hartmann, E.M.; Oliveira, A.A.M.; Bazzo, E. Vegetable Oils of Soybean, Sunflower and Tung as Alternative Fuels for Compression Ignition Engines. Int. J. Thermodyn. 2013, 16, 87–96. [Google Scholar] [CrossRef]
  10. Garzón, N.A.N.; Oliveira, A.A.M.; Hartmann, R.M.; Bazzo, E. Experimental and thermodynamic analysis of a compression ignition engine operating with straight soybean oil. J. Braz. Soc. Mech. Sci. Eng. 2015, 37, 1467–1478. [Google Scholar] [CrossRef]
  11. Nwafor, O.M.I. The effect of elevated fuel inlet temperature on performance of diesel engine running on neat vegetable oil at constant speed conditions. Renew. Energy 2003, 28, 171–181. [Google Scholar] [CrossRef]
  12. Belagur, V.K.; Reddy, V.; Wadawadagi, S.B. Effect of Injection Pressure on Performance, Emission and Combustion Characteristics of Direct Injection Diesel Engine Running on Blends of Pongamia Pinnata Linn (Honge oil) Oil and Diesel Fuel. Agric. Eng. Int. CIGR J. 2009, 11/1316, 1–17. [Google Scholar]
  13. Sarada, S.N.; Shailaja, M.; Raju, A.S.R.; Radha, K.K. Optimization of injection pressure for a compression ignition engine with cotton seed oil as an alternate fuel. Int. J. Eng. Sci. Technol. 2010, 2, 142–149. [Google Scholar] [CrossRef]
  14. Rakopoulos, D.C.; Rakopoulos, C.D.; Giakoumis, E.G.; Dimaratos, A.M.; Founti, M.A. Comparative environmental behavior of bus engine operating on blends of diesel fuel with four straight vegetable oils of Greek origin: Sunflower, cottonseed, corn and olive. Fuel 2011, 90, 3439–3446. [Google Scholar] [CrossRef]
  15. D’Alessandro, B.; Bidini, G.; Zampilli, M.; Laranci, P.; Bartocci, P.; Fantozzi, F. Straight and waste vegetable oil in engines: Review and experimental measurement of emissions, fuel consumption and injector fouling on a turbocharged commercial engine. Fuel 2016, 182, 198–209. [Google Scholar] [CrossRef]
  16. Kumar, M.S.; Ramesh, A.; Nagalingam, B. An experimental comparison of methods to use methanol and Jatropha oil in a compression ignition engine. Biomass Bioenergy 2003, 25, 309–318. [Google Scholar] [CrossRef]
  17. Reddy, J.N.; Ramesh, A. Parametric studies for improving the performance of a Jatropha oil-fuelled compression ignition engine. Renew. Energy 2006, 31, 1994–2016. [Google Scholar] [CrossRef]
  18. Geo, E.V.; Nagarajan, G.; Nagalingam, B. Studies on dual fuel operation of rubber seed oil and its bio-diesel with hydrogen as the inducted fuel. Int. J. Hydrog. Energy 2008, 33, 6357–6367. [Google Scholar] [CrossRef]
  19. Agarwal, A.K.; Dhar, A. Karanja oil utilization in a direct-injection engine by preheating. Part 1: Experimental investigations of engine performance, emissions, and combustion characteristics. Proc. Inst. Mech. Eng. Part D J. Automob. Eng. 2010, 224, 73–84. [Google Scholar] [CrossRef]
  20. Geo, V.E.; Nagarajan, G.; Nagalingam, B. Studies on improving the performance of rubber seed oil fuel for diesel engine with DEE port injection. Fuel 2010, 89, 3559–3567. [Google Scholar] [CrossRef]
  21. Rakopoulos, C.D.; Rakopoulos, D.C.; Giakoumis, E.G.; Dimaratos, A.M. Investigation of the combustion of neat cottonseed oil or its neat bio-diesel in a HSDI diesel engine by experimental heat release and statistical analyses. Fuel 2010, 89, 3814–3826. [Google Scholar] [CrossRef]
  22. Leenus, J.M.; Varuvel, E.G.; Prithviraj, D. Effect of diesel addition on the performance of cottonseed oil fuelled DI diesel engine. Int. J. Energy Environ. 2011, 2, 321–330. [Google Scholar]
  23. Kasiraman, G.; Nagalingam, B.; Balakrishnan, M. Performance, emission and combustion improvements in a direct injection diesel engine using cashew nut shell oil as fuel with camphor oil blending. Energy 2012, 47, 116–124. [Google Scholar] [CrossRef]
  24. Leenus, M.; Edwin Geo, V.; Kingsly Jeba Singh, D.; Nagalingam, B. A comparative analysis of different methods to improve the performance of cotton seed oil fuelled diesel engine. Fuel 2012, 102, 372–378. [Google Scholar] [CrossRef]
  25. Rakopoulos, D.C. Heat release analysis of combustion in heavy-duty turbocharged diesel engine operating on blends of diesel fuel with cottonseed or sunflower oils and their bio-diesel. Fuel 2012, 96, 524–534. [Google Scholar] [CrossRef]
  26. Agarwal, A.K.; Dhar, A. Experimental investigations of performance, emission and combustion characteristics of Karanja oil blends fuelled DICI engine. Renew. Energy 2013, 52, 283–291. [Google Scholar] [CrossRef]
  27. Daho, T.; Vaitilingom, G.; Ouiminga, S.K.; Piriou, B.; Zongo, A.S.; Ouoba, S.; Koulidiati, J. Influence of engine load and fuel droplet size on performance of a CI engine fueled with cottonseed oil and its blends with diesel fuel. Appl. Energy 2013, 111, 1046–1053. [Google Scholar] [CrossRef]
  28. Li, H.; Biller, P.; Hadavi, S.A.; Andrews, G.E.; Przybyla, G.; Lea-Langton, A. Assessing combustion and emission performance of direct use of SVO in a diesel engine by oxygen enrichment of intake air method. Biomass Bioenergy 2013, 51, 43–52. [Google Scholar] [CrossRef]
  29. Rakopoulos, D.C. Combustion and emissions of cottonseed oil and its bio-diesel in blends with either n-butanol or diethyl ether in HSDI diesel engine. Fuel 2013, 105, 603–613. [Google Scholar] [CrossRef]
  30. Sharon, H.; Jai Shiva Ram, P.; Jenis Fernando, K.; Murali, S.; Muthusamy, R. Fueling a stationary direct injection diesel engine with diesel-used palm oil–butanol blends—An experimental study. Energy Convers. Manag. 2013, 73, 95–105. [Google Scholar] [CrossRef]
  31. Vallinayagam, R.; Vedharaj, S.; Yang, W.M.; Lee, P.S.; Chua, K.J.E.; Chou, S.K. Combustion performance and emission characteristics study of pine oil in a diesel engine. Energy 2013, 57, 344–351. [Google Scholar] [CrossRef]
  32. Qi, D.H.; Lee, C.F.; Jia, C.C.; Wang, P.P.; Wu, S.T. Experimental investigations of combustion and emission characteristics of rapeseed oil–diesel blends in a two cylinder agricultural diesel engine. Energy Convers. Manag. 2014, 77, 227–232. [Google Scholar] [CrossRef]
  33. Rakopoulos, D.; Rakopoulos, C.; Giakoumis, E.; Dimaratos, A.; Kakaras, E. Comparative Evaluation of Two Straight Vegetable Oils and Their Methyl Ester Biodiesels as Fuel Extenders in HDDI Diesel Engines: Performance and Emissions. J. Energy Eng. 2014, 140, A4014001. [Google Scholar] [CrossRef]
  34. Krieger, R.B.; Borman, G.L. The computation of apparent heat release for internal combustion engines. ASME 1966, 66-WA/DGP-4, 1–16. [Google Scholar]
  35. Heywood, J.B. Internal Combustion Engine Fundamentals, 1st ed.; McGraw-Hill: New York, NY, USA, 1988. [Google Scholar]
  36. Reitz, R.D.; Bracco, F.B. On the dependence of spray angle and other spray parameters on nozzle design and operating conditions. SAE 1979, 1–19. [Google Scholar] [CrossRef]
  37. Nieto Garzón, N.A.; Oliveira, A.A.M.; Bazzo, E. An ignition delay correlation for compression ignition engines fueled with straight soybean oil and diesel oil blends. Fuel 2019, 257, 116050. [Google Scholar] [CrossRef]
  38. LabVIEW Software 2011; National Instruments: Austin, TX, USA, 2016.
  39. Garzón, N.A.N.; Zarza, H.M.; Schroeder, F.; Santos, O.A.A.M.; Bazzo, E. Application of Statistical Procedures for the Analysis of the Combustion Chamber Pressure Curve of Compression-Ignition Engines; Actas de MTL 2016 Jornadas Iberoamericanas de Motores Térmicos y Lubricación; Universidad Nacional de La Plata: La Plata, Argentina, 2016; pp. 279–294. (In Portuguese) [Google Scholar]
  40. Reddy, P.; Krishna, D.; Mallan, K.R.; Ganesan, V. Evaluation of combustion parameters in direct injection diesel engines—An easy and reliable method. SAE 1993, 159–165. [Google Scholar] [CrossRef]
  41. Olikara, C.; Borman, G.L. A computer program for calculating properties of equilibrium combustion products with some applications to I.C. engines. SAE 1975, 1–21. [Google Scholar]
  42. Hohenberg, G.F. Advanced approaches for heat transfer calculations. SAE 1979, 88. [Google Scholar]
  43. Watson, N.; Janota, M.S. Turbocharging the Internal Combustion Engine, 1st ed.; John Wiley & Sons, Inc.: New York, NY, USA, 1982. [Google Scholar]
  44. MATLAB Natick, MA: The MathWorks, Inc.; 2013. Available online: https://la.mathworks.com/products/matlab.html (accessed on 9 October 2024).
  45. Kannan, D.; Pachamuthu, S.; Nabi, M.N.; Hustad, J.E.; Løvås, T. Theoretical and experimental investigation of diesel engine performance, combustion and emissions analysis fuelled with the blends of ethanol, diesel and jatropha methyl ester. Energy Convers. Manag. 2012, 53, 322–331. [Google Scholar] [CrossRef]
  46. Hiroyasu, H.; Arai, M. Structures of fuel sprays in diesel engines. SAE 1990, 1–15. [Google Scholar] [CrossRef]
  47. Annand, W.J.D. Heat transfer in the cylinders of reciprocating internal combustion engines. Proc. Inst. Mech. Eng. 1963, 177, 973–990. [Google Scholar]
Figure 1. Schematic diagram of the experimental setup.
Applsci 14 09215 g001
Figure 2. Experimental in-cylinder pressure data as a function of crank angle for the fuels tested at (a) 1800 rpm and (b) 2100 rpm.
Applsci 14 09215 g002
Figure 3. (a) Heat release rate and (b) cumulative energy release as a function of crank angle for the fuels tested at 1800 rpm and full load condition.
Applsci 14 09215 g003
Figure 4. (a) Heat release rate and (b) cumulative energy release as a function of crank angle for the fuels tested at 2100 rpm and full load condition.
Applsci 14 09215 g004
Figure 5. Ohnesorge diagram for all fuels tested at 1800 rpm and full load condition.
Applsci 14 09215 g005
Table 1. Identification of the fuels tested and the respective injection temperatures.
FuelInjection
Temperature (°C)
Label
Diesel oil25100D(25)
50/50% v/v soybean/diesel2550S/50D(25)
8550S/50D(85)
80/20% v/v soybean/diesel8580S/20D(85)
Table 2. Measurements of physical properties of the fuels tested.
FuelTemperature (°C)Density (kg/m3)Dynamic Viscosity (mPa∙s)Surface Tension (mN/m)
Diesel oil25828.7 ± 3.03.51 ± 0.2227.76 ± 0.40
50/50% v/v soybean/diesel25871.7 ± 2.213.19 ± 0.4330.12 ± 0.28
50/50% v/v soybean/diesel85832.9 ± 2.23.62 ± 0.1825.54 ± 0.28
80/20% v/v soybean/diesel85858.8 ± 2.76.47 ± 0.2326.83 ± 0.32
Soybean oil85876.1 ± 3.39.53 ± 0.3727.72 ± 0.39
Table 3. Values of HHV, LHV, C, H, S, N, and O of soybean and diesel oils.
PropertySoybean OilDiesel Oil
HHV (kJ/kg)39,44045,345
LHV (kJ/kg)36,95042,435
Carbon, C (%)77.6785.79
Hydrogen, H (%)11.5213.52
Sulfur, S (%)<0.04<0.04
Nitrogen, N (%)0.020.05
Oxygen, O (%)10.760.61
Molecular formulaC57.4H101.5O6C12H26
Table 4. Technical specifications of the diesel engine tested.
ItemSpecifications
TypeDiesel, 1 horizontal cylinder, 4-stroke
Injection systemDirect
Injection pressure200 bar
Injection timing15° BTC
Cylinder diameter115 mm
Stroke115 mm
Cylinder capacity1194 cm3
Compression ratio17.3
IVO-IVC654° CA–278° CA
EVO-EVC444° CA–64° CA
Power14.7 kW (20 CV)/2200 rpm
Specific fuel consumption238 g/kWh (175 g/CVh)
CoolingWater
Starting systemManual or electric
Net weight195 kg–180 kg
Dimensions965 × 450 × 699 mm
Lubrication systemForced, trochoid pump
Table 5. Maximum pressure and percentage difference relative to diesel oil at 1800 and 2100 rpm.
Engine Speed (rpm)FuelMaximum Pressure (kPa)Difference
(%)
Angle at Maximum Pressure (° CA)
1800100D(25)6584.7 ± 22.4 366.5
50S/50D(25)6557.7 ± 19.3−0.41366.5
50S/50D(85)6484.8 ± 23.1−1.52366.5
80S/20D(85)6204.8 ± 36.0−5.77365.0
2100100D(25)6395.1 ± 25.6 365.5
50S/50D(25)6413.3 ± 19.10.28365.5
50S/50D(85)6234.6 ± 26.1−2.51365.5
80S/20D(85)6152.3 ± 16.2−3.80364.5
Table 6. Ignition delay of the fuel tested at 1800 rpm.
Engine Speed (rpm)FuelStart of Injection (° CA)Start of Ignition (° CA)Ignition Delay
(° CA)
Ignition Delay
(ms)
1800100D(25)345.0352.57.50.694
50S/50D(25)345.0352.57.50.694
50S/50D(85)345.5353.07.50.694
80S/20D(85)345.5354.08.50.787
2100100D(25)345.0353.58.50.675
50S/50D(25)344.5353.08.50.675
50S/50D(85)345.0353.58.50.675
80S/20D(85)345.0354.59.50.754
Table 7. Mass fraction burned at 444° CA for all fuels at the two speeds tested.
FuelMass Fraction Burned (mg Burned/mg Injected)
1800 rpm2100 rpm
100D(25)0.6500.657
50S/50D(25)0.6750.683
50S/50D(85)0.6870.705
80S/20D(85)0.6890.746
Table 8. Stoichiometric air/fuel ratio and global equivalence ratio for all fuels at the two speeds tested.
FuelStoichiometric Air/Fuel Ratio (AF)sGlobal Equivalence Ratio
ϕ gl
1800 rpm2100 rpm
100D(25)14.920.830.81
50S/50D(25)14.230.770.76
50S/50D(85)14.230.740.74
80S/20D(85)12.820.700.69
Table 9. SMD, droplet Reynold number, and oxygen content for all fuels tested at 1800 rpm and full load condition.
FuelSMD (µm)ReDO2 (%)
100D(25)22.20737.24-
50S50D(25)25.65851.845.66
50S50D(85)21.91727.585.66
80S20D(85)23.40776.878.81
Disclaimer/Publisher’s Note: The statements, opinions and data contained in all publications are solely those of the individual author(s) and contributor(s) and not of MDPI and/or the editor(s). MDPI and/or the editor(s) disclaim responsibility for any injury to people or property resulting from any ideas, methods, instructions or products referred to in the content.

