Abstract
The type of soil and its compactness significantly influence its permeability coefficient, which in turn affects the drainage difficulty of soil pore water and the distribution of the infiltration line. However, current tailings dam models typically consider only a single soil layer instead of taking into account the differences in soil types and compactness, resulting in a deviation between simulated results and actual conditions. To address this issue, this study proposes three models with a gradually increasing degree of layering refinement based on soil type and compactness. These models aim to simulate the variations in the infiltration line under three different strategies: constant head, rainfall, and drainage. The simulation results indicate that the average increase in the infiltration line of the three schemes after rainfall is 46.2%, 65.88%, 83.52%, respectively; the fitting percentages for each scheme of infiltration line after 720 days of drainage and the constant head stage are 72.38%, 88.27%, and 93.61%, respectively. It can be seen that the higher the refinement level of the layered model, the more sensitive it is to changes in the infiltration line. Furthermore, as the refinement level of the layered model increases, the simulation effect on the changes in the infiltration line improves, and the simulated results become more consistent with the actual situation. This finding provides a strategy and possibility for the study of the tailings dam’s infiltration lines, safety, and stability.
1. Introduction
The tailings dam is a non-natural high potential energy dam constructed from the tailings sand of mining sites [1], and tailings ponds are ranked as the world’s 18th among the 93 kinds of accidental and public hazardous disasters [2]. China has more than 10,000 tailings ponds and over 1000 “head-ponds” [3], with the largest number of tailings ponds in the world. Dam failure accidents in the “head dams” cause tremendous damage to life and property, as well as serious environmental pollution to the downstream area. According to research, dam-break in tailing ponds accidents accounted for 56% [4]. The seepage field is decisive for the safety and stability of tailing dams [5]. The infiltration line is the intersection line between the surface of the infiltration water flow and the cross-section of the dam body; its position is an important factor in evaluating the safety and stability of the tailings dam. Therefore, the infiltration line was known as the tailings pond’s “lifeline”. The study of the infiltration line becomes a prerequisite for research on the safety and stability of tailings ponds [6].
The infiltration line is an important factor affecting the safety and stability of tailing ponds. Many scholars have conducted comprehensive studies on the seepage field of tailing ponds [7,8], analytical solutions for infiltration lines [9,10], the influences of rainfall [11,12], and dam slope ratios [13,14,15] on infiltration lines through model simulation experiments and numerical simulation methods [16,17]. The permeability coefficient directly affects the distribution of infiltration lines, while compactness [18,19] and consolidation [20,21,22] have a significant effect on the permeability coefficient. Many studies have observed that compactness is a major factor affecting the water-holding capacity of soil [23], thus significantly affecting the strength, stiffness, and shear strength of saturated soil [24,25]. With the increase in compactness, the permeability coefficient becomes smaller and the water-holding capacity becomes stronger [26]. It should be noted that the permeability coefficient and capacity of water holding determine the rise and fall of the infiltration line.
The numerical simulation models of tailing dams are mostly built using a single soil layer without considering microscopic parameters such as soil type, compactness, and consolidation. Research by Wu et al. has applied the compaction degree of weakly consolidated soils to the modeling process [25]. Similarly, Dessouki et al. [27] and Lian et al. [28] considered the effect of porosity and pore structure on the permeability coefficient in the rock model, respectively. Therefore, in this paper, different layered characteristics of tailings dam models are established based on the differences in micro-parameters such as tailings sand type, compactness, and permeability coefficient. Rainfall infiltration has a significant effect on the damage to tailings dams; therefore, this paper set up three different conditions of constant head, rainfall, and drainage to carry out simulation research in order to analyze the difference between the changes in the infiltration line of different layering schemes and the fitting percentage of the real situation. According to the simulation results of the three layering schemes under three different conditions, the relationship between compactness and permeability coefficient can be obtained, as well as the influence of different layering schemes on the distribution of the infiltration line of the tailings dam.
2. Layering Models and Experimental Methods
2.1. Project Overview
The tailings pond is classified as a valley-type tailings pond located in a specific valley. The total height of the tailings dam is 86.5 m, with a total storage capacity of approximately 4.11 million cubic meters. The safety level of the tailings pond is classified as Level III. It has been closed for 22 years. The initial embankment, with a maximum height of 27 m, utilizes a permeable stone filling structure. The base elevation of the dam is 250 m, and the crest elevation is 277 m, with a crest width of 3.5 m. The upstream slope ratio is 1:1.85, and the downstream slope ratio is 1:1.70. Additionally, an upstream method was employed to construct the subsequent tailings stacking embankments. This embankment is divided into four sub-dams based on deposition time, with a crest elevation of 336.5 m and a maximum height of 86.5 m. The slope ratio is 1:4.3. It is worth noting that the sub-dams of Levels II and III feature a horse road with a width of approximately 2.0 m. To prevent erosion, the outer slopes of the entire dam body are protected by vegetation, and a comprehensive system of stone-lined transverse and longitudinal drainage ditches is implemented.
2.2. Principles and Scheme of Stratification
According to the field investigation data, the soil layers of the dam can be primarily divided into three layers: surface fill soil, tailings deposition layer, and bedrock layer. The surface-fill soil consists of silty soil and gravel. The tailings deposition layer consists of fine tailings, silty tailings, sandy tailings, and sticky sandy tailings. The bedrock consists of highly weathered sandstone in the Great Wall system and weathered sandstone in the Great Wall system. According to the “Code for Geotechnical Investigation of Rock and Soil Engineering” GB50021-2001 (2009 edition) [29], the compactness classification of sandy soil can be divided into dense, medium dense, slightly dense, and loose categories. The compactness of silty soil can be classified into dense, medium dense, and slightly dense.
This paper proposes three different stratification schemes to investigate the impact of stratification based on soil layer types and compactness on the infiltration line variation of tailing dams. Scheme 1 divides the tailings dam into initial embankment, deposition layer, and bedrock. The deposition embankment consists solely of fine tailings, while the bedrock is composed of heavily weathered sandstone and moderately weathered sandstone. Scheme 2 further subdivides the deposition embankment into silty fill soil, fragmented stone fill soil, fine tailings, silty tailings, sandy tailings, and clayey silt tailings based on soil layer types. Scheme 3, based on scheme 2, further divides the fine tailings and silt tailings based on differences in compactness. The detailed stratification schemes are presented in Table 1, and the stratification models for the three schemes are illustrated in Figure 1, Figure 2 and Figure 3.

Table 1.
Classification and stratification schemes for tailing dam soils.
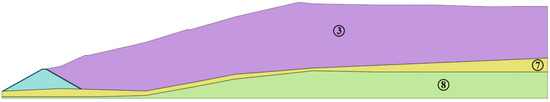
Figure 1.
Scheme 1 stratification model.
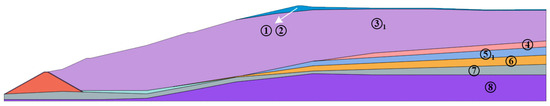
Figure 2.
Scheme 2 stratification model.
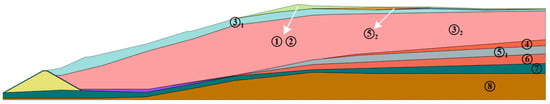
Figure 3.
Scheme 3 stratification model.
2.3. Methods
To investigate the influence of the layered model of a tailings dam on the variation of the infiltration line, three different strategies, namely constant head, rainfall, and drainage, will be implemented to simulate the changes in the infiltration line. Throughout the simulation process, it was critical to ensure the consistency of the initial conditions, boundary constraints, rainfall loads, nodal flow rates, grid sizes, and construction stages among the three sets of models. As shown in Figure 4, from line A to line E, five measurement lines were set up to monitor and record the changes in the infiltration line.
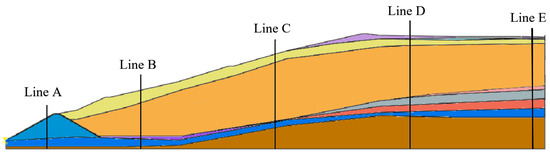
Figure 4.
Distribution of measurement lines A–E.
Constant head strategy: set the initial embankment head and reservoir boundary head, no drainage boundary, comparing the differences in infiltration line inclination and height between each measuring line of the three schemes; Rainfall strategy: set the rainfall boundary, no drainage boundary, comparing the percentage increase of the infiltration line at each measuring line, as well as analyzing the variability of the infiltration line changes in the three schemes; Drainage strategy: set the drainage boundary, compare the changes in the height of the infiltration line at each measurement line, and calculate the fitting percentages of the infiltration line height compared to the constant head strategy.
3. Results and Discussion
The contour line of zero pore water pressure in the numerical simulation results represents the infiltration line. The variations in the infiltration line under three different strategies were compared. Additionally, the height of the infiltration line on each measurement line was recorded and compared. The simulation results and data records of infiltration line height on each measurement line are recorded below.
3.1. Distribution of the Infiltration Line during the Constant Head Strategy
The initial embankment head was set at 6.35 m, and the reservoir boundary head was 53.9 m (measured height of the infiltration line) during the constant head strategy. The distribution of the infiltration line under the three-layered schemes is shown in Figure 5, Figure 6 and Figure 7.
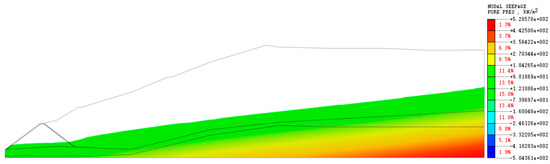
Figure 5.
Distribution of the infiltration line in scheme 1 during the constant head strategy.
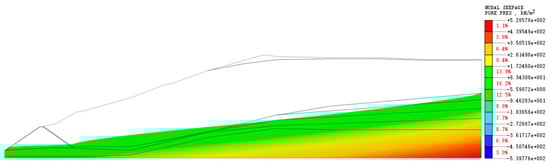
Figure 6.
Distribution of the infiltration line in scheme 2 during the constant head strategy.
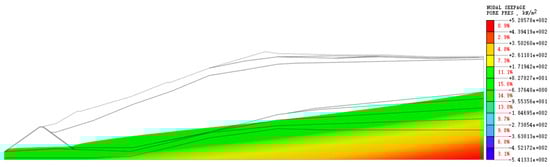
Figure 7.
Distribution of the infiltration line in scheme 3 during the constant head strategy.
Figure 5, Figure 6 and Figure 7 illustrate the initial stage pore water pressure distribution for each scenario, with the top boundary representing the contour line of zero pore water pressure, which is the infiltration line. Since no drainage is set up in the initial stage and the study state is steady, the infiltration lines for the three scenarios are relatively uniform, with a slightly smaller inclination angle and no significant fluctuation. Taking the left endpoint of the model bottom as the origin, using the model bottom boundary as the X-axis, and a line passing through the origin and perpendicular to the bottom boundary as the Y-axis, the height changes of the infiltration lines along measurement lines A to E are recorded in Table 2.
Table 2.
The heights of the lines during the constant head strategy.
In scheme 1, the tailings dam stacking layer soil is not stratified, and below the water head boundary on the right side of the dam is all tailings fine sand ③1. In scheme 2, the tailings dam stacking layer is stratified based on soil types. Below the water head boundary on the right side of the dam, it includes tailings fine sand ③1, tailings silt, tailings silty clay ⑤1 and tailings clay. Scheme 3 further divided the dam soil layers based on the compactness of tailings sand, where below the right head boundary of the dam included tailings fine sand ③2, tailings silt, tailings silty clay ⑤1 and tailings clay.
According to Table 2, it can be seen that the infiltration line in scheme 1 is the highest among the constant head strategies. In particular, the infiltration line in scheme 2 is higher than that in scheme 3 in the area to the left of line D, while in the area to the right of line D, the infiltration line in scheme 3 is higher than scheme 2. Table 2 shows that the difference in infiltration line height among scheme 1, 2, and 3 between lines D and E is 8.7, 9.4, and 10.2, respectively. The inclination angle of schemes 1, 2, and 3 between lines D and E is 4.972°, 5.370°, and 5.824°, respectively. The inclination angle of scheme 3 increased by 17.14% compared to scheme 1 and by 8.45% compared to scheme 2. A recent study by Huo [18] found that the permeability coefficient is inversely correlated with compactness. Furthermore, with the increase in compactness of the dam, the hydraulic gradient required for the seepage process will be higher. It can be inferred that as the layering scheme increases in compactness and the permeability coefficient decreases, the flow channels become steeper and more inclined, resulting in a larger difference in the height of the infiltration line and an increase in the inclination of the infiltration line. Under constant head strategy, the difference in permeability coefficients not only affects the inclination angle of the infiltration line but also leads to variations in the total flow rate of the dam body, ultimately causing differences in the initial embankment infiltration line height.
The differences in permeability coefficients under the right head boundary lead to variations in the total flow rate of the dam body under the constant head strategy. The higher the permeability coefficient, the greater the inflow of water. The permeability coefficients on the right side of the dam and the total inflow rate of water follow the sequence: scheme 1 > scheme 2 > scheme 3. Therefore, the infiltration line heights of the initial embankment line A for three schemes are 11.1, 10.3, and 9.9, respectively.
Under constant head strategy, the relationship between the compactness, permeability coefficient, and variation of the infiltration line reveals a direct relationship between the compactness and permeability coefficient of tailings sand. As the compactness of tailings increases, its permeability capability weakens, leading to an increase in the slope of the flow channels and the inclination angle of the infiltration line.
3.2. Distribution of the Infiltration Line during the Rainfall Strategy
Under the rainfall strategy, a continuous rainfall of 9 days was implemented with moderate intensity. The constant head boundary was deactivated, and the rainfall boundary was defined as the upper boundary of the tailings dam (including the initial outer slope). After 9 days of rainfall, the distribution of the infiltration lines of the three schemes were illustrated in Figure 8, Figure 9 and Figure 10.
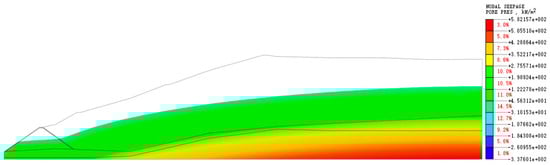
Figure 8.
Distribution of the infiltration line in scheme 1 during the rainfall strategy.
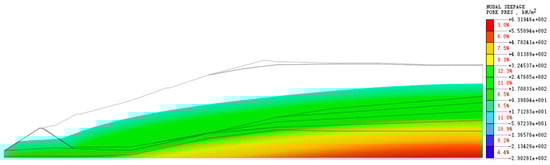
Figure 9.
Distribution of the infiltration line in scheme 2 during the rainfall strategy.
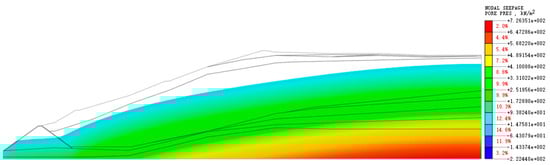
Figure 10.
Distribution of the infiltration line in scheme 3 during the rainfall strategy.
Figure 8, Figure 9 and Figure 10 demonstrate the distribution of pore water pressure after 9 days rainfall in each scheme. The upper boundary represents the infiltration line with zero pore water pressure, which is defined as the infiltration line. Under the rainfall strategy, drainage is not allowed, and the analysis is performed under transient conditions involving both horizontal and vertical seepage. The initial embankment infiltration lines for all three schemes exhibit a slight slope in a linear distribution, while the reservoir infiltration lines show noticeable fluctuations. It is evident that the infiltration lines for all three schemes have increased compared to the constant head strategy, with the highest infiltration line observed in scheme 3, followed by scheme 2, and then scheme 1. Figure 11 records the changes in the height of the infiltration line between lines A and E, with the origin at the left end point of the model bottom, the model bottom boundary as the x-axis, and a line passing through the origin and perpendicular to the bottom boundary as the y-axis.
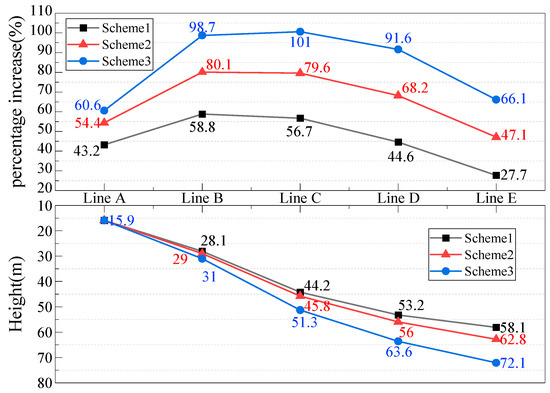
Figure 11.
The heights of the infiltration lines after 9 days of rainfall. Notes: The percentage increase in the figure represents the percentage increase of the infiltration line height at the same location between the rainfall strategy and the constant head strategy.
In scheme 1, the tailings dam consists of uniformly deposited tailings fine sand ③1 without any layering. In scheme 2, the dam body is divided into layers based on the type of soil, including the surface fill soil, tailings fine sand ③1, tailings silty sand, tailings silty clay ⑤1, and tailings silty clayey silt. Meanwhile, in scheme 3, the dam body is further divided into layers based on the compaction density of the tailings sand, incorporating additional layers of tailings fine sand ③2 and tailings silty clay ⑤2 compared to scheme 2.
According to Figure 11, the average increase in the height of the infiltration line after 9 days of rainfall for scheme 1, scheme 2, and scheme 3 is 46.20%, 65.88%, and 85.32%, respectively. It is apparent that the percentage increase in lines B, C, and D is relatively large, while lines A and E have comparatively smaller percentage increases. Among them, scheme 3 has the highest average increase in infiltration line, which is 85.32%, surpassing scheme 2 (65.88%) and scheme 1 (46.20%), which indicates that the upper layers of the tailings dam in all three schemes are fine tailings, and the difference in rainfall infiltration capacity is relatively small. However, as the compactness of the tailings layers increases, the permeability coefficient of the tailings sand decreases [18,30], resulting in a decrease in the water permeability of the tailings sand and a slower seepage velocity, consequently leading to an increase in the infiltration line. The compactness of the tailings dam for scheme 1, scheme 2, and scheme 3 follows the order of scheme 3 > scheme 2 > scheme 1. Therefore, after 9 days of rainfall, the percentage increase in the infiltration line for the three schemes also follows the pattern of scheme 3 > scheme 2 > scheme 1.
Lines B, C, and D not only experience vertical infiltration from rainfall on the dam slope but also horizontal seepage from the soil on the right side, which shows that the increase percentage in the height of the infiltration line for Lines B, C, and D is significantly greater than that of Line A and Line E. However, due to the differences in compactness, there are variations in the permeability coefficients, seepage velocity, and time. Consequently, the percentage increase in the height of the infiltration line gradually increases in schemes 1, 2, and 3. Line A is located in the initial embankment with a relatively higher permeability coefficient, resulting in a faster seepage velocity. Therefore, the percentage increase in the height of the infiltration line in Line A is relatively smaller. However, influenced by the height of the infiltration line in Line B, Line A also exhibits the following order of percentage increase in height: scheme 3 > scheme 2 > scheme 1. Line E is located at the right edge of the dam, and the main form of infiltration in the dam is vertical from rainfall on the slope of the dam. Therefore, compared to lines B, C, and D, the percentage increase in the height of the infiltration line on line E is relatively smaller. Although there are significant differences in the layering conditions, compactness, and permeability coefficient among the three schemes, the percentage increase in the height of the infiltration line on Line E still shows as scheme 3 > scheme 2 > scheme 1.
After 9 days of rainfall, this research reveals a correlation between the compactness, permeability coefficient, and infiltration line of tailings. Furthermore, it has verified the relationship between compaction and permeability coefficient under constant head strategy, and the influence of these factors on the infiltration line has been analyzed. Some research has shown that different compactness models demonstrate significant differences under rainfall conditions [12]. It can be inferred based on the results of this paper that under rainfall conditions, the compactness of tailings increases, leading to a decrease in the permeability coefficient and deterioration in water permeability. Additionally, the infiltration line of tailings becomes more sensitive to rainfall. Therefore, this study has proposed a refined layered model for the tailings dam, which classifies the soil into different layers based on soil type and compactness, different from the single-layer model. This approach can better reflect the influence of rainfall on the infiltration line, and the results are more realistic and credible.
3.3. Distribution of the Infiltration Line during the Drainage Strategy
After the rainfall ceased, drainage operations for 720 days were carried out within the tailings dam. The constant head boundary and rainfall boundary were removed, while a drainage boundary was set on the left side of the initial embankment. The distribution of the infiltration line after 720 days for three different schemes was illustrated in Figure 12, Figure 13 and Figure 14.
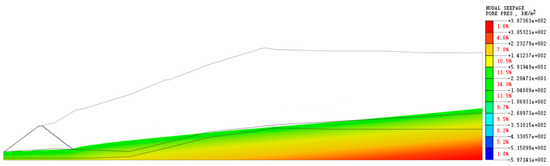
Figure 12.
Distribution of the infiltration line in scheme 1 during the drainage strategy.
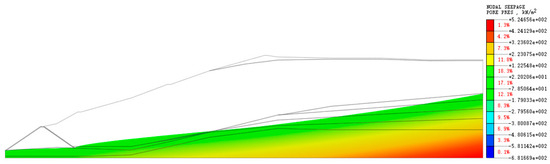
Figure 13.
Distribution of the infiltration line in scheme 2 during the drainage strategy.
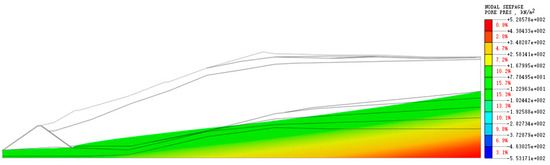
Figure 14.
Distribution of the infiltration line in scheme 3 during the drainage strategy.
Figure 12, Figure 13 and Figure 14 show the distribution of pore water pressure after 720 days of drainage for each scheme. The upper boundary represents the contour line where the pore water pressure is zero, referred to as the infiltration line. During the drainage phase, the drainage boundary is activated, and the study is conducted under steady-state conditions. The infiltration line is at the bottom of the initial embankment with no significant differences, so further analysis on Line A is not necessary. Within the dam, the infiltration lines approximate straight lines, with the height of the infiltration line decreasing from scheme 3, scheme 2, and scheme 1. Taking the left endpoint of the bottom boundary of the model as the origin, using the bottom boundary of the model as the x-axis, and using a line passing through the origin and perpendicular to the bottom boundary as the y-axis, the variations in the height of the infiltration line between lines B and E are recorded in Figure 15.
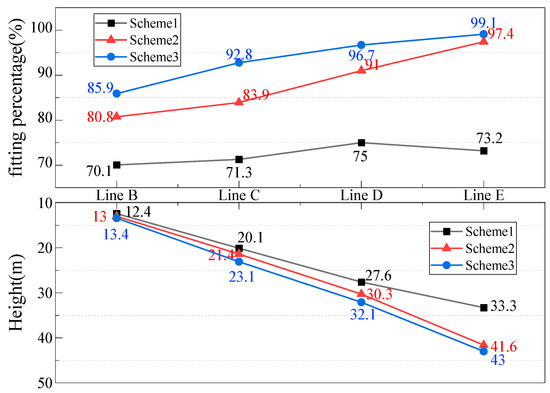
Figure 15.
The heights of the infiltration lines after 720 days of drainage. Notes: The goodness of fit in this figure refers to the percent similarity between the infiltration line height after 720 days of drainage and the infiltration line height during the constant head stage.
According to Figure 15, the average goodness of fit for scheme 1, scheme 2, and scheme 3 after 720 days of drainage is 72.38%, 88.27%, and 93.61%, respectively. Specifically, the goodness of fit for scheme 1 is all above 70%, for scheme 2 it is all above 80%, and for scheme 3 is all above 85.90%. Figure 15 also demonstrates that after 720 days of drainage, the order of infiltration line heights from highest to lowest among the three schemes is scheme 3, scheme 2, and scheme 1. During the drainage strategy, as the compactness of the tailings increases, the permeability coefficient decreases, indicating poorer permeability of the tailings but better water retention capacity and a higher stable height of the infiltration line. Scheme 3 has the highest compactness of the tailings dam, followed by scheme 2, and scheme 1 has the lowest compaction. Consequently, after 720 days of drainage, the heights of the infiltration line in the three schemes follow the order of scheme 3, scheme 2, and scheme 1. This distribution confirms the mechanism of the impact of compaction on the permeability coefficient and infiltration line of the tailings dam, as determined during the water level stabilization and rainfall phases: the greater the compactness, the smaller the permeability of the tailings, indicating poorer tailings permeability and stronger water retention capacity, slower seepage velocity, and a higher position of the infiltration line. By comparing the goodness of fit percentages of the three schemes in terms of infiltration line height among the three schemes, it can be observed that scheme 3, which has a more refined stratification scheme, exhibits the highest fitting percentage, reflecting the actual infiltration line more accurately and aligning better with the practical situation.
The relationship between compactness, permeability coefficient, and infiltration line height under three different strategies demonstrates that compactness significantly influences the permeability coefficient, water permeability, water retention capacity, and distribution of the infiltration line in the tailings dam. Compared to the single-layer model, the more refined stratified model is more sensitive to the variations of the infiltration line, resulting in a more accurate representation of the actual situation and producing more reliable and credible results.
4. Conclusions
In this study, three different strategies were simulated, including constant head, 9 days of rainfall, and 720 days of drainage, to not only analyze the impact of the three layered schemes on the infiltration line variation pattern in the tailings dam but also reveal the influence mechanism of compactness on the permeability coefficient and infiltration line variations. In addition, as the level of layer refinement increased, the compactness of scheme 1, scheme 2, and scheme 3 also gradually increased.
- (1)
- Under the constant hydraulic head strategy, the inclination angles of the infiltration lines between measurement lines D and E for scheme 1, scheme 2, and scheme 3 are 4.972°, 5.370°, and 5.824°, respectively. Compared to schemes 1 and 2, scheme 3 shows an increase of 17.14% and 8.45% in the inclination angle of the infiltration line, which reveals that as the compaction density of tailings increases, the permeability coefficient decreases, resulting in a deterioration in water permeability capacity and an increase in the slope of the seepage channel as well as the inclination angle of the infiltration line.
- (2)
- After 9 days of continuous rainfall, the average increases in the infiltration line compared to the constant head strategy are 46.2%, 65.88%, and 83.52% for scheme 1, scheme 2, and scheme 3, respectively. Among these schemes, measurement lines B, C, and D show a higher increase in the proportion of the infiltration line compared to lines A and E, which reveals that as the compactness increases, there is a corresponding decrease in the permeability coefficient, resulting in a deterioration of the water permeability of the tailings. Furthermore, it indicates a heightened sensitivity to variations in the infiltration line under rainfall conditions.
- (3)
- After 720 days of drainage, the fitting percentages of the infiltration line height at each point for scheme 1, scheme 2, and scheme 3 compared to the constant head strategy are 72.38%, 88.27%, and 93.61%, respectively. Among the three schemes, the elevation of the infiltration line is in the order of scheme 3, scheme 2, and scheme 1. In particular, scheme 3 is closer to the measured infiltration line elevation at the constant head stage, which confirms that as the compactness of the tailings increases and the permeability coefficient decreases, the water permeability decreases and the water retention capacity increases. Consequently, the seepage velocity decreases, and the position of the infiltration line rises. Scheme 3, with a higher stratification refinement, has the highest fitting percentage for the infiltration line and provides the best reflection of the real infiltration line, making it more consistent with the actual situation.
Author Contributions
Conceptualization, W.G.; Formal analysis, W.G. and X.D.; Funding acquisition, Z.S.; Investigation, X.D.; Methodology, W.G., Z.S. and C.H.; Project administration, Z.S.; Software, W.G. and C.H.; Supervision, Z.S.; Writing—original draft, W.G. and H.W.; Writing—review and editing, W.G. and Z.S. All authors have read and agreed to the published version of the manuscript.
Funding
This research was funded by the National Natural Science Foundation of China (41202214), the National Natural Science Foundation of China (51774163), and the China Coal Technology and Industry Group Double Creation Funding Major Project (2022-ZD002).
Data Availability Statement
The data presented in this study are available on request from the corresponding author. The data are not publicly available due to its potential use as a master’s thesis.
Conflicts of Interest
The authors declare that this study received funding from the China Coal Technology and Industry Group. The funder was not involved in the study design, collection, analysis, interpretation of data, the writing of this article or the decision to submit it for publication.
References
- Chen, C.C.; Zhao, Y.Q.; Jiang, L.Q.; Tang, Z.; Tian, X.R. Correlation analysis on the hidden risk factors of tailings pond based on text mining. Min. Res. Dev. 2021, 41, 26–33. [Google Scholar]
- Chen, C.C.; Zhao, Y.Q.; Jiang, L.Q. Review on the current research of dam break of tailings pond. Min. Res. Dev. 2019, 39, 103–108. [Google Scholar]
- Liu, J.X.; Yan, Z.K.; Zhong, Q.M.; Chen, L.; Shan, Y.B. Breach mechanism of tailings dam due to overtopping failure and numerical simulation of breach process. J. Cent. South Univ. Sci. Ang Technol. 2022, 53, 2694–2708. [Google Scholar]
- Zhang, J.R.; Liu, J.L. The statistics and cause of dam break and leakage in Chinese tailings pond. China Molybdenum Ind. 2019, 43, 10–144. [Google Scholar]
- Zhang, L.T. Summary on the dam-break of tailing pond. J. Hydraul. Eng. 2013, 44, 594–600. [Google Scholar]
- Czajkowski, M.; Meade, N.; da Motta, R.S.; Ortiz, R.A.; Welsh, M.; Blanc, G.C. Estimating environmental and cultural/heritage damages of a tailings dam failure: The case of the Fundão dam in Brazil. J. Environ. Econ. Manag. 2023, 121, 102849. [Google Scholar] [CrossRef]
- Wang, H.; Zhou, L.; Lin, X.S. Simplified on tailings dam seepage field model and calculation of seepage line. J. Liaoning Tech. Univ. Nat. Sci. 2016, 35, 27–31. [Google Scholar]
- Tongle, X.; Yingbo, W.; Kang, C. Tailings saturation line prediction based on genetic algorithm and BP neural network. J. Intell. Fuzzy Syst. 2016, 30, 1947–1955. [Google Scholar] [CrossRef]
- Li, Q.; Gao, S.; Niu, H.K.; Shang, Y.-L. Analytical solution to saturation line of tailings pond and its applicability analysis. Rock Soil Mech. 2020, 41, 3714–3721+3756. [Google Scholar]
- Marsooli, R.; Wu, W. Three-Dimensional Numerical Modeling of Dam-Break Flows with Sediment Transport over Movable Beds. J. Hydraul. Eng. 2015, 141, 04014066. [Google Scholar] [CrossRef]
- Zhang, Y.A.; Zhou, K.P. Sensibility Analysis of Saturation Line Depth to Tailings Dam Stability with Index Satisfaction Degree. China Saf. Sci. J. 2013, 23, 93–99. [Google Scholar]
- Hu, W.; Xin, C.L.; Li, Y.; Zheng, Y.S.; Van Asch, T.W.J.; McSaveney, M. Instrumented flume tests on the failure and fluidization of tailings dams induced by rainfall infiltration. Eng. Geol. 2021, 294, 106401. [Google Scholar] [CrossRef]
- Zhao, Y.Q.; Wang, J.; Zhong, S.Z.; Miu, J.R. Analysis on variation of saturation line and deformation of dam body of tailings pond under rainfall condition. Min. Res. Dev. 2023, 43, 157–162. [Google Scholar]
- Smilde, A.K.; Kiers, H.A.; Bijlsma, S.; Rubingh, C.M.; Van Erk, M.J. Matrix correlations for high-dimensional data: The modified RV-coefficient. Bioinformatics 2009, 25, 401–405. [Google Scholar] [CrossRef] [PubMed]
- Zandarín, M.T.; Oldecop, L.A.; Rodríguez, R.; Zabala, F. The role of capillary water in the stability of tailing dams. Eng. Geol. 2009, 105, 108–118. [Google Scholar] [CrossRef]
- He, Z.; Wu, T.; Weng, H.; Hu, P.; Wu, G. Numerical simulation of dam-break flow and bed change considering the vegetation effects. Int. J. Sediment Res. 2017, 32, 105–120. [Google Scholar] [CrossRef]
- Richard, E.D.C.; Estrada, G.C.D.; Bechtold, J.P.; de Aguiar Duarte, H., Jr.; Maioli, B.G.; de Freitas, A.H.A.; Warner, K.E.; Figueiredo, L.H.M. Water and Sediment Quality in the Coastal Zone Around the Mouth of Doce River After the Fundao Tailings Dam Failure. Integr. Environ. Assess. Manag. 2020, 16, 643–654. [Google Scholar] [CrossRef]
- Huo, H.C. Experimental Study on the Mechanism of Tailings Pond Dam Break under the Effect of Seepage Failure. Bachelor’s Thesis, Shijiazhuang Tiedao University, Shijiazhuang, China, 2023. [Google Scholar]
- Yan, D.; Fu, L.; Xia, C.F.; Song, L.H. Effects of grain size and adsorbed water on permeability of fine grained soil. J. Nanjing Technol. Univ. Nat. Sci. Ed. 2018, 40, 118–123. [Google Scholar]
- Li, B. Effect of Particle Scale on Deformation and Effect of Pore Sacle on Seepage and Consolidation. Master’s Thesis, South China University of Technology, Guangzhou, China, 2019. [Google Scholar]
- Nazari, Z.; Tabarsa, A.; Latifi, N. Effect of compaction delay on the strength and consolidation properties of cement-stabilized subgrade soil. Transp. Geotech. 2021, 27, 100495. [Google Scholar] [CrossRef]
- Kumar, P.; Rao, B.; Burman, A.; Kumar, S.; Samui, P. Spatial variation of permeability and consolidation behaviors of soil using ordinary kriging method. Groundw. Sustain. Dev. 2023, 20, 100856. [Google Scholar] [CrossRef]
- Xi, R.S. Experimental Study on the Water Retention Characteristics of Silty Soil as Affected by Compaction Density. China Water Transp. 2019, 19, 265–266+268. [Google Scholar]
- Yu, H.F.; Yang, D.H.; Yan, R.T.; Wei, H.; Lu, D. The Influence of Compaction Density on the Mechanical Properties of Soil Containing Hydrated Compounds. Mech. Eng. 2022, 44, 1111–1119. [Google Scholar]
- Wu, R.; Deng, J.; Liu, W.; Mao, S.; Sun, J.; Yan, M.; Li, M.; Li, Y. Numerical investigation of fluid injection into poorly consolidated geomaterial considering shear dilation and compaction. J. Pet. Sci. Eng. 2018, 168, 119–132. [Google Scholar] [CrossRef]
- Tang, H.M.; Wang, L.F.; Yan, Y. Experimental Analysis of Permeability Coefficient of Sandy Gravel Soil under Different Density. Subgrade Eng. 2020, 6, 19–24. [Google Scholar] [CrossRef]
- Dessouki, M.; Hathon, L.; Myers, M. Permeability and porosity modelling for resedimented mudrocks Applications for compaction dominated mudrock systems. Mar. Pet. Geol. 2021, 128, 1044945. [Google Scholar] [CrossRef]
- Lian, X.; Zong, Z.; Li, X.; Yang, W.; Zhang, J. Rock-physics modeling of deep clastic reservoirs considering the relationship between microscopic pore structure and permeability. J. Appl. Geophys. 2023, 105270. [Google Scholar] [CrossRef]
- GB 50021-2001(2009); Code for Investigation of Geotechincal Engineering. China Architecture & Building Press: Beijing, China, 2002.
- Nguyen, V.H.; Gland, N.; Dautriat, J.; David, C.; Wassermann, J.; Guelard, J. Compaction, permeability evolution and stress path effects in unconsolidated sand and weakly consolidated sand stone. Int. J. Rock Mech. Min. Sci. 2014, 67, 226–239. [Google Scholar] [CrossRef]
Disclaimer/Publisher’s Note: The statements, opinions and data contained in all publications are solely those of the individual author(s) and contributor(s) and not of MDPI and/or the editor(s). MDPI and/or the editor(s) disclaim responsibility for any injury to people or property resulting from any ideas, methods, instructions or products referred to in the content. |
© 2024 by the authors. Licensee MDPI, Basel, Switzerland. This article is an open access article distributed under the terms and conditions of the Creative Commons Attribution (CC BY) license (https://creativecommons.org/licenses/by/4.0/).