Article

Hazard Prediction of Water Inrush in Water-Rich Tunnels Based on Random Forest Algorithm

1
College of Civil Engineering, Taiyuan University of Technology, Taiyuan 030024, China
2
Shanxi Provincial Key Laboratory of Civil Engineering Disaster Prevention and Control, Taiyuan 030024, China
3
Research Institute of Highway, Ministry of Transport, Beijing 100088, China
*
Authors to whom correspondence should be addressed.
Appl. Sci. 2024, 14(2), 867; https://doi.org/10.3390/app14020867
Submission received: 26 December 2023 / Revised: 17 January 2024 / Accepted: 18 January 2024 / Published: 19 January 2024
(This article belongs to the Special Issue Advances in Tunnel and Underground Construction)

Abstract

:
To prevent large-scale water inrush accidents during the excavation process of a water-rich tunnel, a method, based on a random forest (RF) algorithm, for predicting the hazard level of water inrush is proposed. By analyzing hydrogeological conditions, six factors were selected as evaluating indicators, including stratigraphic lithology, inadequate geology, rock dip angle, negative terrain area ratio, surrounding rock grade, and hydrodynamic zonation. Through the statistical analysis of 232 accident sections, a dataset of water inrush accidents in water-rich tunnels was established. We preprocessed the dataset by detecting and replacing outliers, supplementing missing values, and standardizing the data. Using the RF model in machine learning, an intelligent prediction model for the hazard of water inrush in water-rich tunnels was established through the application of datasets and parameter optimization processing. At the same time, a support vector machine (SVM) model was selected for comparison and verification, and the prediction accuracy of the RF model reached 98%, which is higher than the 87% of the SVM. Finally, the model was validated by taking the water inrush accident in the Yuanliangshan tunnel as an example, and the predicted results have a high degree of consistency with the actual hazard level. This indicates that the RF model has good performance when predicting water inrush in water-rich tunnels and that it can provide a new means by which to predict the hazard of water inrush in water-rich tunnels.

1. Introduction

With the implementation of China’s “the Belt and Road” and “A country with strong transportation network “ strategies and the continuous development of Industry 4.0 technology [1,2], tunnel construction will continue to develop at a high speed. As China is the country with the largest karst area in the world, it is inevitable that this construction will pass through inadequate geology conditions, such as high water pressure, rich water, and karst, during the construction of tunnels. During the construction of the water-rich tunnel, water inrush, as a typical accident, poses a serious threat to construction safety and operation. Moreover, the influencing factors of water inrush are complex, so it is particularly important to choose appropriate indicators and prediction models in order to evaluate the hazard of water inrush in water-rich tunnels.
With the continuous development of tunnels, the issues of water inrush during tunnel construction have been exposed and attracted attention. In this process, the hazard assessment of water inrush has gradually become an indispensable part of tunnel construction. From Du Yuchao’s [3] analytic hierarchy process (AHP) combined with expert systems to Zhang Wenquan’s [4] multi-level fuzzy comprehensive evaluation, and from Hou Dongsai’s [5] AHP and coefficient of variation combined with comprehensive weighting to Zhou Zongqing’s [6] attribute interval recognition method, various methods have been successfully applied in some tunnels. However, since they presuppose some patterns or specify some parameters in advance, their results are subjective.
In recent years, artificial intelligence has gradually emerged, underpinning systems such as the BP neural network, RBF neural network and SVM, which have gradually been applied to predict the hazard of water and mud inrush disasters in tunnels [7,8,9,10,11,12]. Although these methods are all used to determine the hazard of water inrush in tunnels, the performances of the models are different. Although BP neural networks have strong learning abilities and can handle complex nonlinear relationships, they have drawbacks, such as requiring a large sample size, having a slow learning convergence speed, and being prone to falling into local optima. Although RBF neural networks have fast computation speed, fewer parameters, and nonlinear mapping ability, they have disadvantages, such as their difficulty when selecting suitable centers and adjusting the network structure and their inability to learn online. Additionally, although SVM networks have the advantages of high efficiency, strong model generalization ability, and high robustness, they have some problems in parameter tuning, handling multi classification problems, and storing and computing large-scale datasets.
Considering the above issues, it is necessary to find a model with high accuracy and stability and good robustness in order to be able to apply it to the identification of water inrush hazards in water-rich tunnels. RF has the above characteristics and has shown good performance in practical applications [13]. RF is an ensemble learning method that uses autonomous sampling, cross validation, and other methods to improve the accuracy, stability, and robustness of the model during the model building process. However, research has found that stability and robustness are generally not used as evaluation indicators for classification performance in machine learning. Based on this, this article intends to use the RF model in the Sklearn library of the Python language to establish a prediction model for the hazard of water inrush in the water-rich tunnels, and to verify its reliability and effectiveness through examples, with the aim of ultimately achieving a process of hazard level prediction for water inrush in water-rich tunnels.
The implementation process of the hazard prediction of water inrush in a water-rich tunnel in this article is shown in Figure 1.

2. Construction of Evaluating Indicator System and Grading Standards

2.1. Construction of Evaluating Indicator System

This article collected 101 actual accident cases; however, due to the high hazard of water inrush accidents recorded in this literature, the lack of cases with lower hazard, and the limited number of cases with relevant data, it was impossible to carry out subsequent data preprocessing work and establish prediction models. Based on this, this article collected 131 relevant studies from scholars on the prediction and evaluation of water inrush, and the results of these predictions and evaluations have been verified with high accuracy. In summary, the dataset applied to the model includes data regarding a total of 94 tunnels and 232 accident sections [14,15,16].
The construction of an evaluating indicator system can help evaluate the risk and hazard effects of water inrush in tunnels, thus enabling corresponding prevention and response measures and providing a scientific basis for the determination of the hazard level of water inrush in water-rich tunnels. Water inrush in a water-rich tunnel is influenced by various factors, mainly including hydrogeological conditions and human factors. Hydrogeological conditions are considered part of a disaster-prone environment, while human factors are considered to be inducing factors. This article focuses on the assessment of the hazard of water inrush in water-rich tunnel caused by the environment in which the tunnel is located. Therefore, the evaluating indicators established in this article all belong to hydrogeological conditions.
This article conducts statistical analysis on accident sections where water inrush occurs. Based on the relevant hydrogeological conditions introduced by scholars [17,18], the stratigraphic lithology, inadequate geology, and rock dip angle, which all have a significant impact on water inrush, are selected as evaluating indicators. Based on the evaluation and prediction of tunnel water inrush by various scholars [19,20], the negative terrain area ratio, surrounding rock grade, and hydrodynamic zonation are three evaluating indicators that have high application frequency and are easy to collect. Finally, this article constructs an evaluation system for the hazard of water inrush in water-rich tunnels based on six evaluating indicators: stratigraphic lithology, inadequate geology, rock dip angle, negative terrain area ratio, surrounding rock grade, and hydrodynamic zonation. There is no obvious dependency relationship between various indicators, and their combination conditions jointly affect the risk of sudden water inrush, as shown in Figure 2.
The impact mechanisms of the six evaluating indicators selected in this article are as follows.
(1)
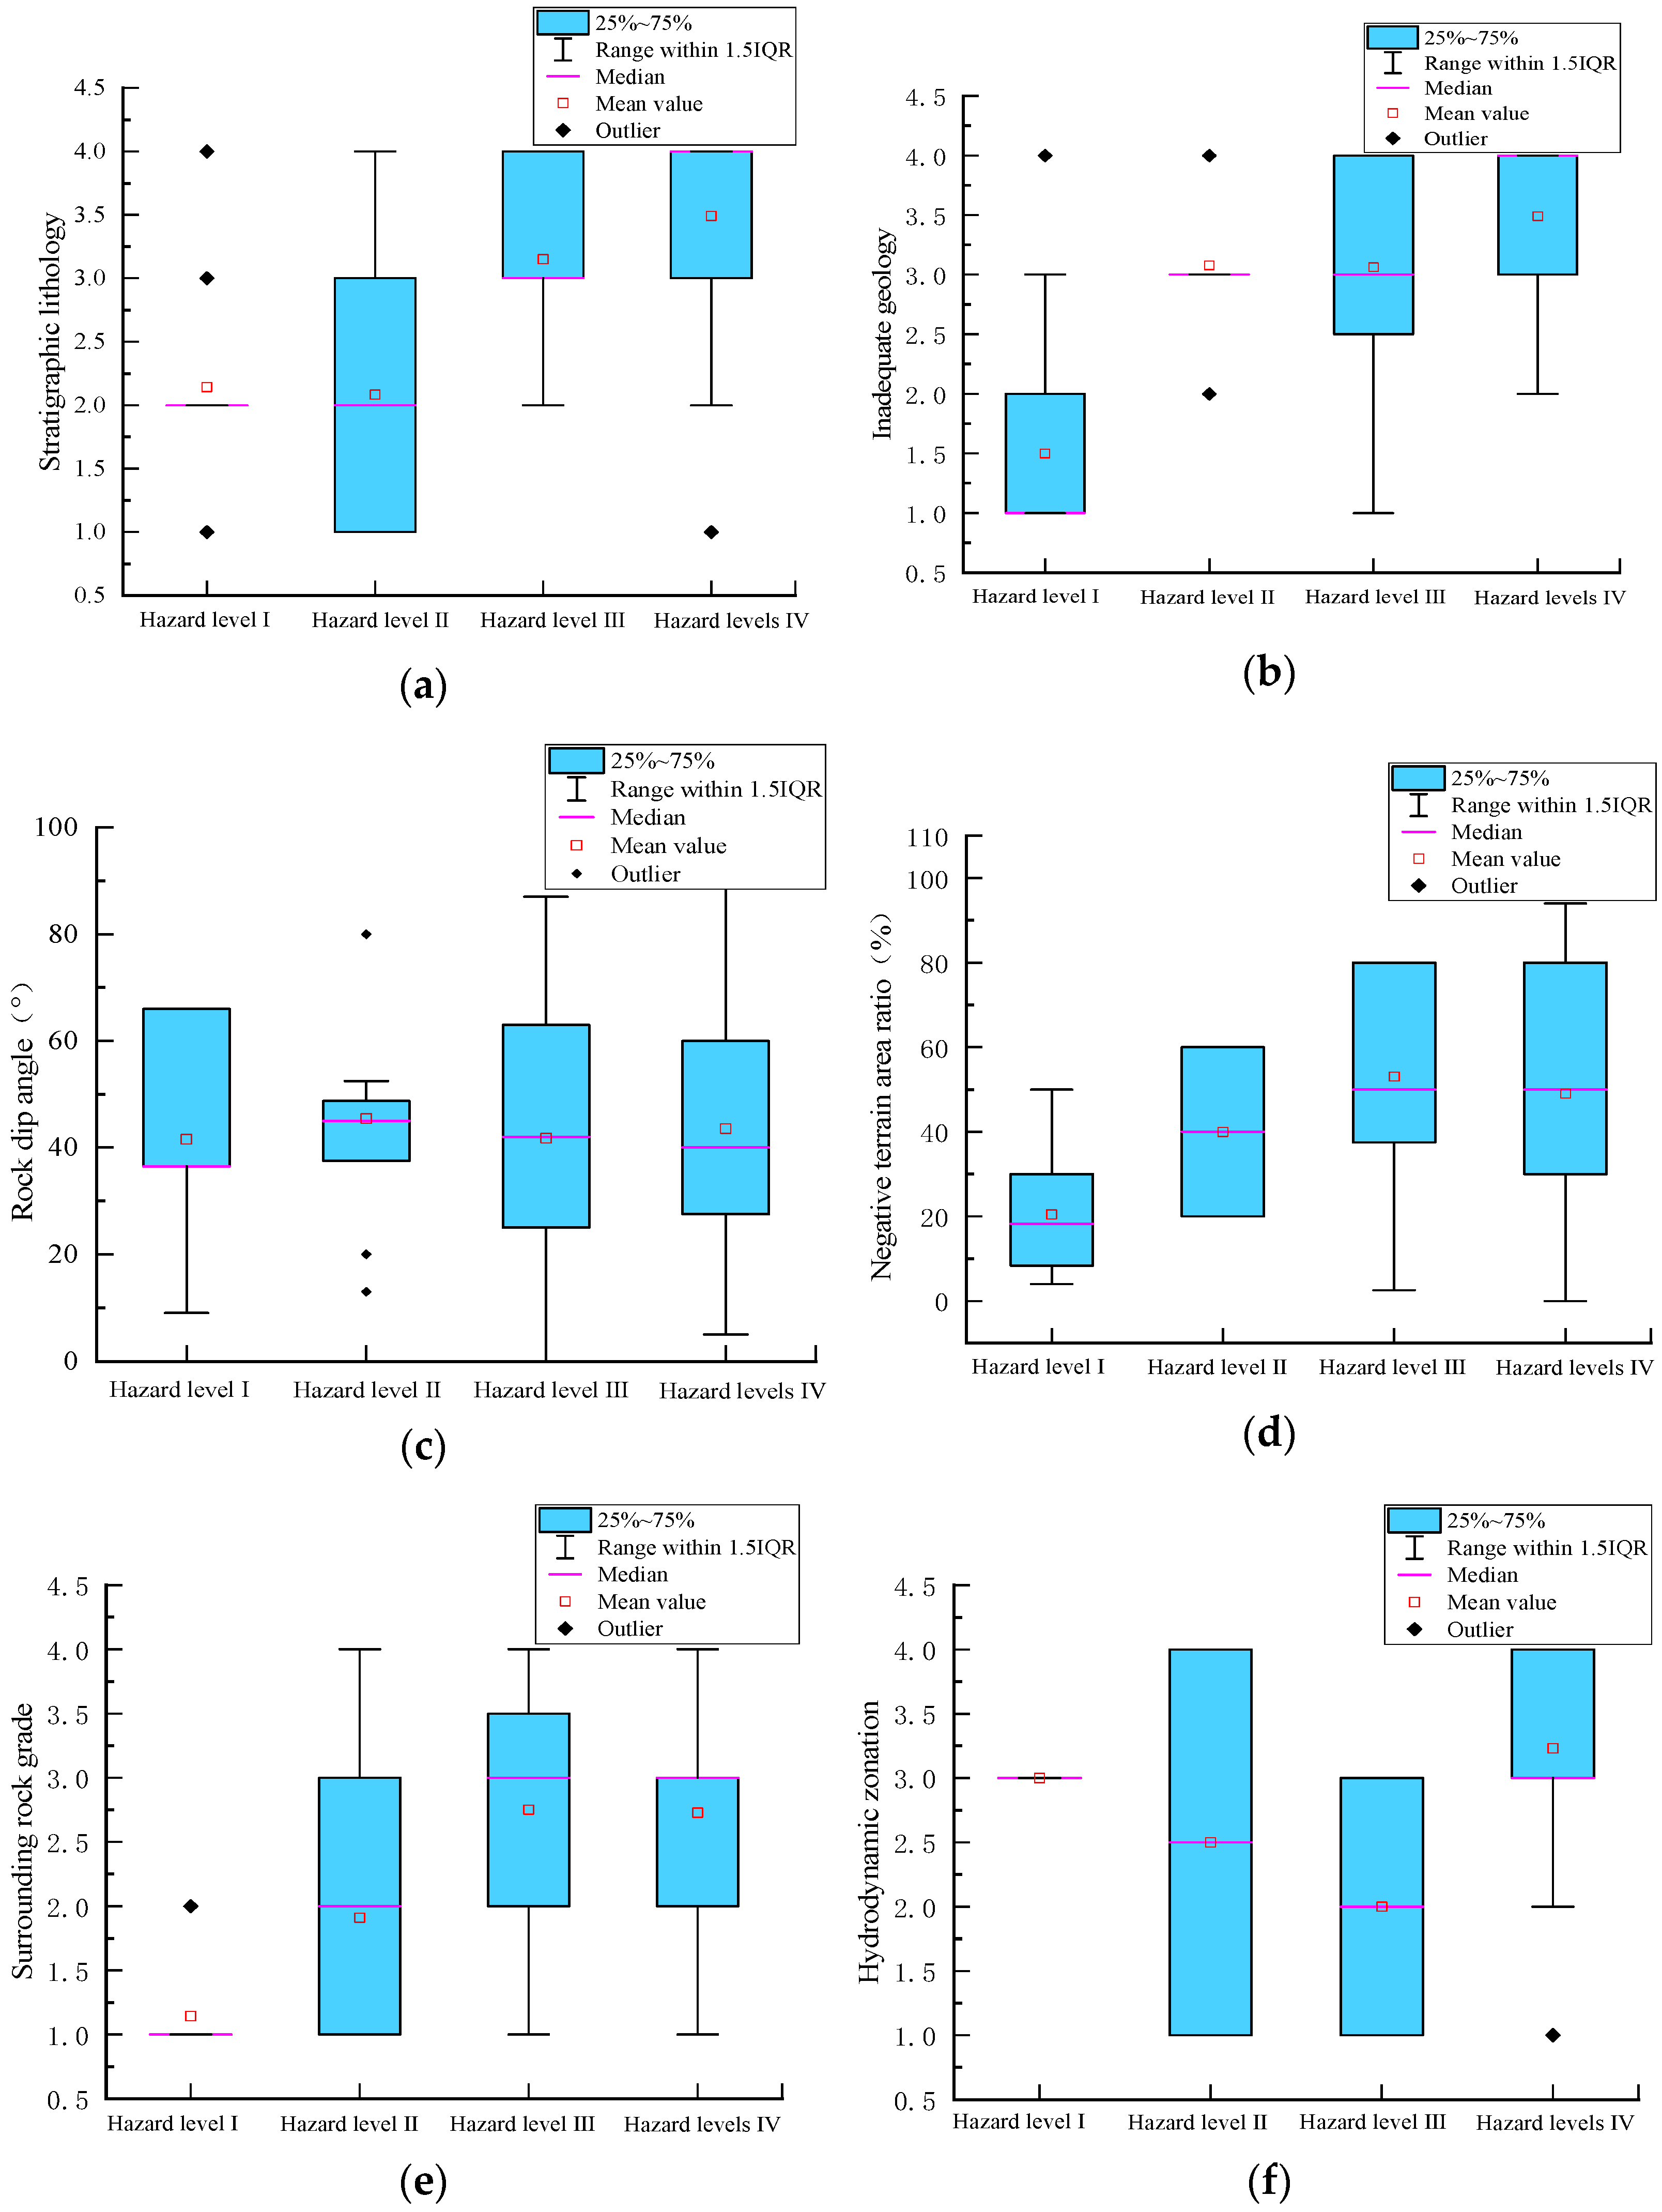
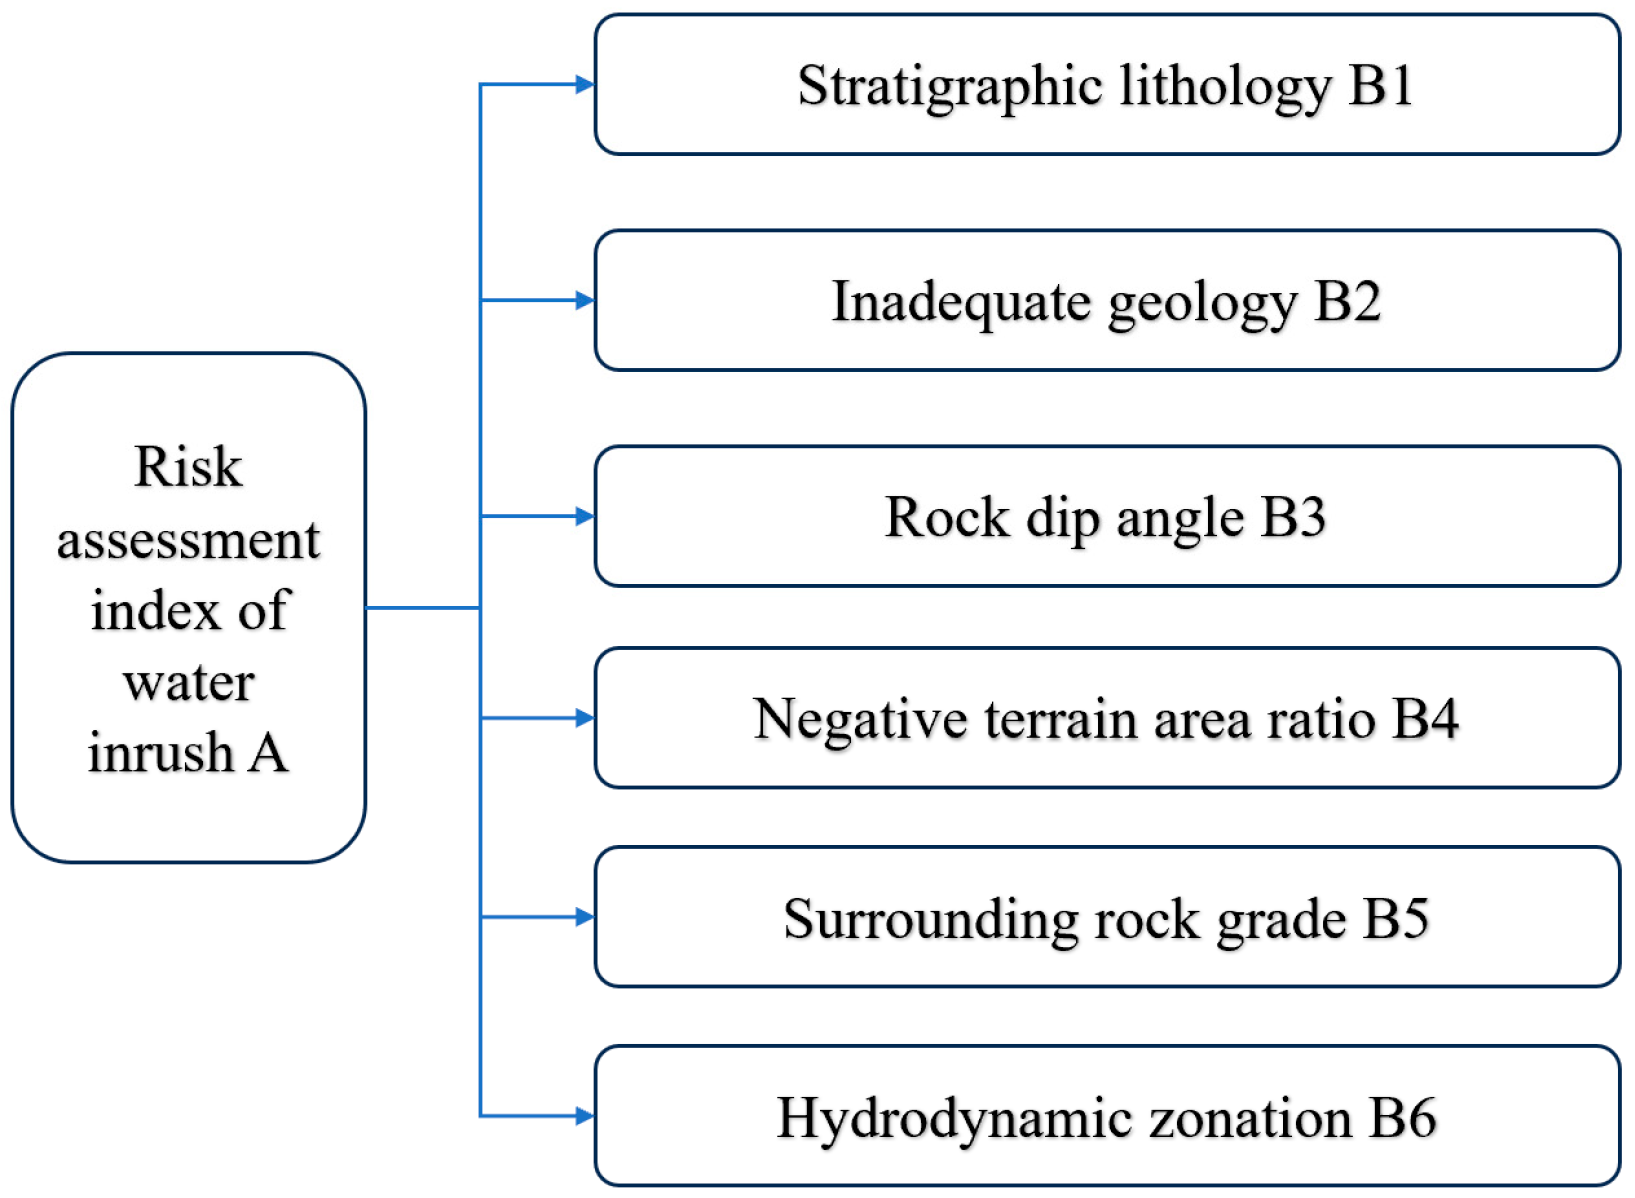
Stratigraphic lithology B1: Stratigraphic lithology is one of the main material foundations that lead to karst development. Due to the different erosion and dissolution properties of rock minerals in groundwater, different rock types lead to different occurrence characteristics of water-bearing structures. Generally speaking, water inrush disasters in water-rich tunnels are more likely to occur in carbonate formations with higher solubility, such as limestone, dolomite, and other karst formations.
(2)
Inadequate geology B2: Inadequate geology refers to the channels and flow paths of underground water systems, including water storage structures, karst pipelines, underground rivers, fault fracture zones, and joint planes, which directly affect the scale of water inrush disasters in water-rich tunnels. The water-rich structural properties nurtured by these geological conditions determine the level of hazard when water inrush occurs in tunnels.
(3)
Rock dip angle B3: The rock dip angle has a significant impact on the flow of groundwater. The rock dip angle affects the path of karst water seepage, supply, and discharge by influencing the anisotropic characteristics of rock permeability. Generally speaking, the permeability parallel to the rock layer is much greater than that perpendicular to the rock layer. However, when the dip angle of the rock layer is too large, the area of the water-rich surface is small, leading to less groundwater circulation and poor erosivity. If the dip angle of karst is too small, it is not conducive to the smooth infiltration of groundwater into karst strata.
(4)
Negative terrain area ratio B4: The negative terrain area ratio determines the recharge capacity of groundwater. Landforms such as depressions, subsidence, and sinkholes on the surface make it easier for surface water to accumulate and recharge to the run-off area of groundwater through seepage.
(5)
Surrounding rock grade B5: The surrounding rock grade reflects the integrity, strength, and deformation resistance of the surrounding rock. When the surrounding rock grade is high, the integrity, strength, and deformation resistance of the surrounding rock are poor, which leads to higher groundwater permeability and the formation of water conducting channels. Moreover, the surrounding rock with high grade often appears in weak zones, such as fractured zones and dissolution cavities, which can easily cause water inrush disasters in water-rich tunnels.
(6)
Hydrodynamic zonation B6: The groundwater system is one of the decisive factors in the occurrence of karst in tunnels. The possibility and characteristics of water inrush vary depending on the karst hydrodynamic zonation in which the water-rich tunnel is located. The hydrodynamic zonation in which the tunnel is located is an important factor determining the characteristics and water inflow of water inrush.

2.2. Grading Criteria

The grading criteria include the grading criteria for evaluating indicators and the hazard grading criteria for water inrush. Grade classification not only expresses the degree of impact of various evaluating indicators on the hazard of water inrush in water-rich tunnels under different states, but also provides a quantitative basis for subsequent data processing and establishment of prediction models. Through such grading standards, we can more accurately evaluate and predict the hazard of water inrush in water-rich tunnels and take corresponding measures to ensure the safety of the tunnel.

2.2.1. Classification of Evaluating Indicators

Based on the research results of relevant scholars [21,22,23], this article divides the levels of each evaluating indicator into four hazard levels: I (none), II (low), III (medium), and IV (high) (quantified using values 1, 2, 3, and 4 in the model). The classification of each evaluating indicator is shown in Table 1. In the cases collected in this article, some scholars have different level classifications of stratigraphic lithology and negative terrain area ratio compared with the evaluating indicator established in this article. These scholars have quantified the stratigraphic lithology using coefficient t, which this article converts into the level classification of stratigraphic lithology in Table 1, based on the hazard level classification of coefficient t. The negative terrain area ratio can be quantitatively converted into 80%, 50%, 30%, and 10% using qualitative expressions such as large range negative terrain, medium range negative terrain, small range negative terrain, and no negative terrain, respectively. The negative terrain area ratio can also be quantitatively divided into 80%, 50%, 30%, and 10% based on the catchment area size of 6 km2, 4 km2, and 2 km2, respectively. In summary, this article comprehensively applies coefficient t, quantification of negative terrain area ratio, and evaluation of indicator grading standards in order to classify the relevant evaluating indicators of accident sections.

2.2.2. Classification of Hazard Levels of Water Inrush

The hazard of water inrush in tunnels is mainly manifested in casualties, equipment and economic losses caused by excessive water inrush or mud inrush, and in an impact on the environment. In this paper, the hazard of water inrush is divided into four hazard levels according to the size of water inrush and mud inrush, and the highest hazard level in the water inrush or mud inrush at the accident is taken as the hazard level of water inrush. Such a standardized division is helpful when clarifying the corresponding relationship between different water inrush and mud inrush and the hazard degree, and further improves accuracy when identifying the hazard of water inrush in water-rich tunnels. Based on the research results of various scholars [24,25,26,27,28], this article constructs a classification standard for the hazard level of water inrush in water-rich tunnels, as shown in Table 2.
According to the standard in Table 2, this article classified the hazard levels of water inrush accidents collected. Among these, as the predicted and evaluated cross-sectional data collected by scholars were used to evaluate the hazard levels, this article converted the hazard levels of each evaluated accident cross-section into corresponding water inrush volumes, and then reclassified the hazard levels based on the established classification standards. Final classification results were obtained, including 17 for hazard level I, 17 for hazard level II, 52 for hazard level III, and 146 for hazard level IV.

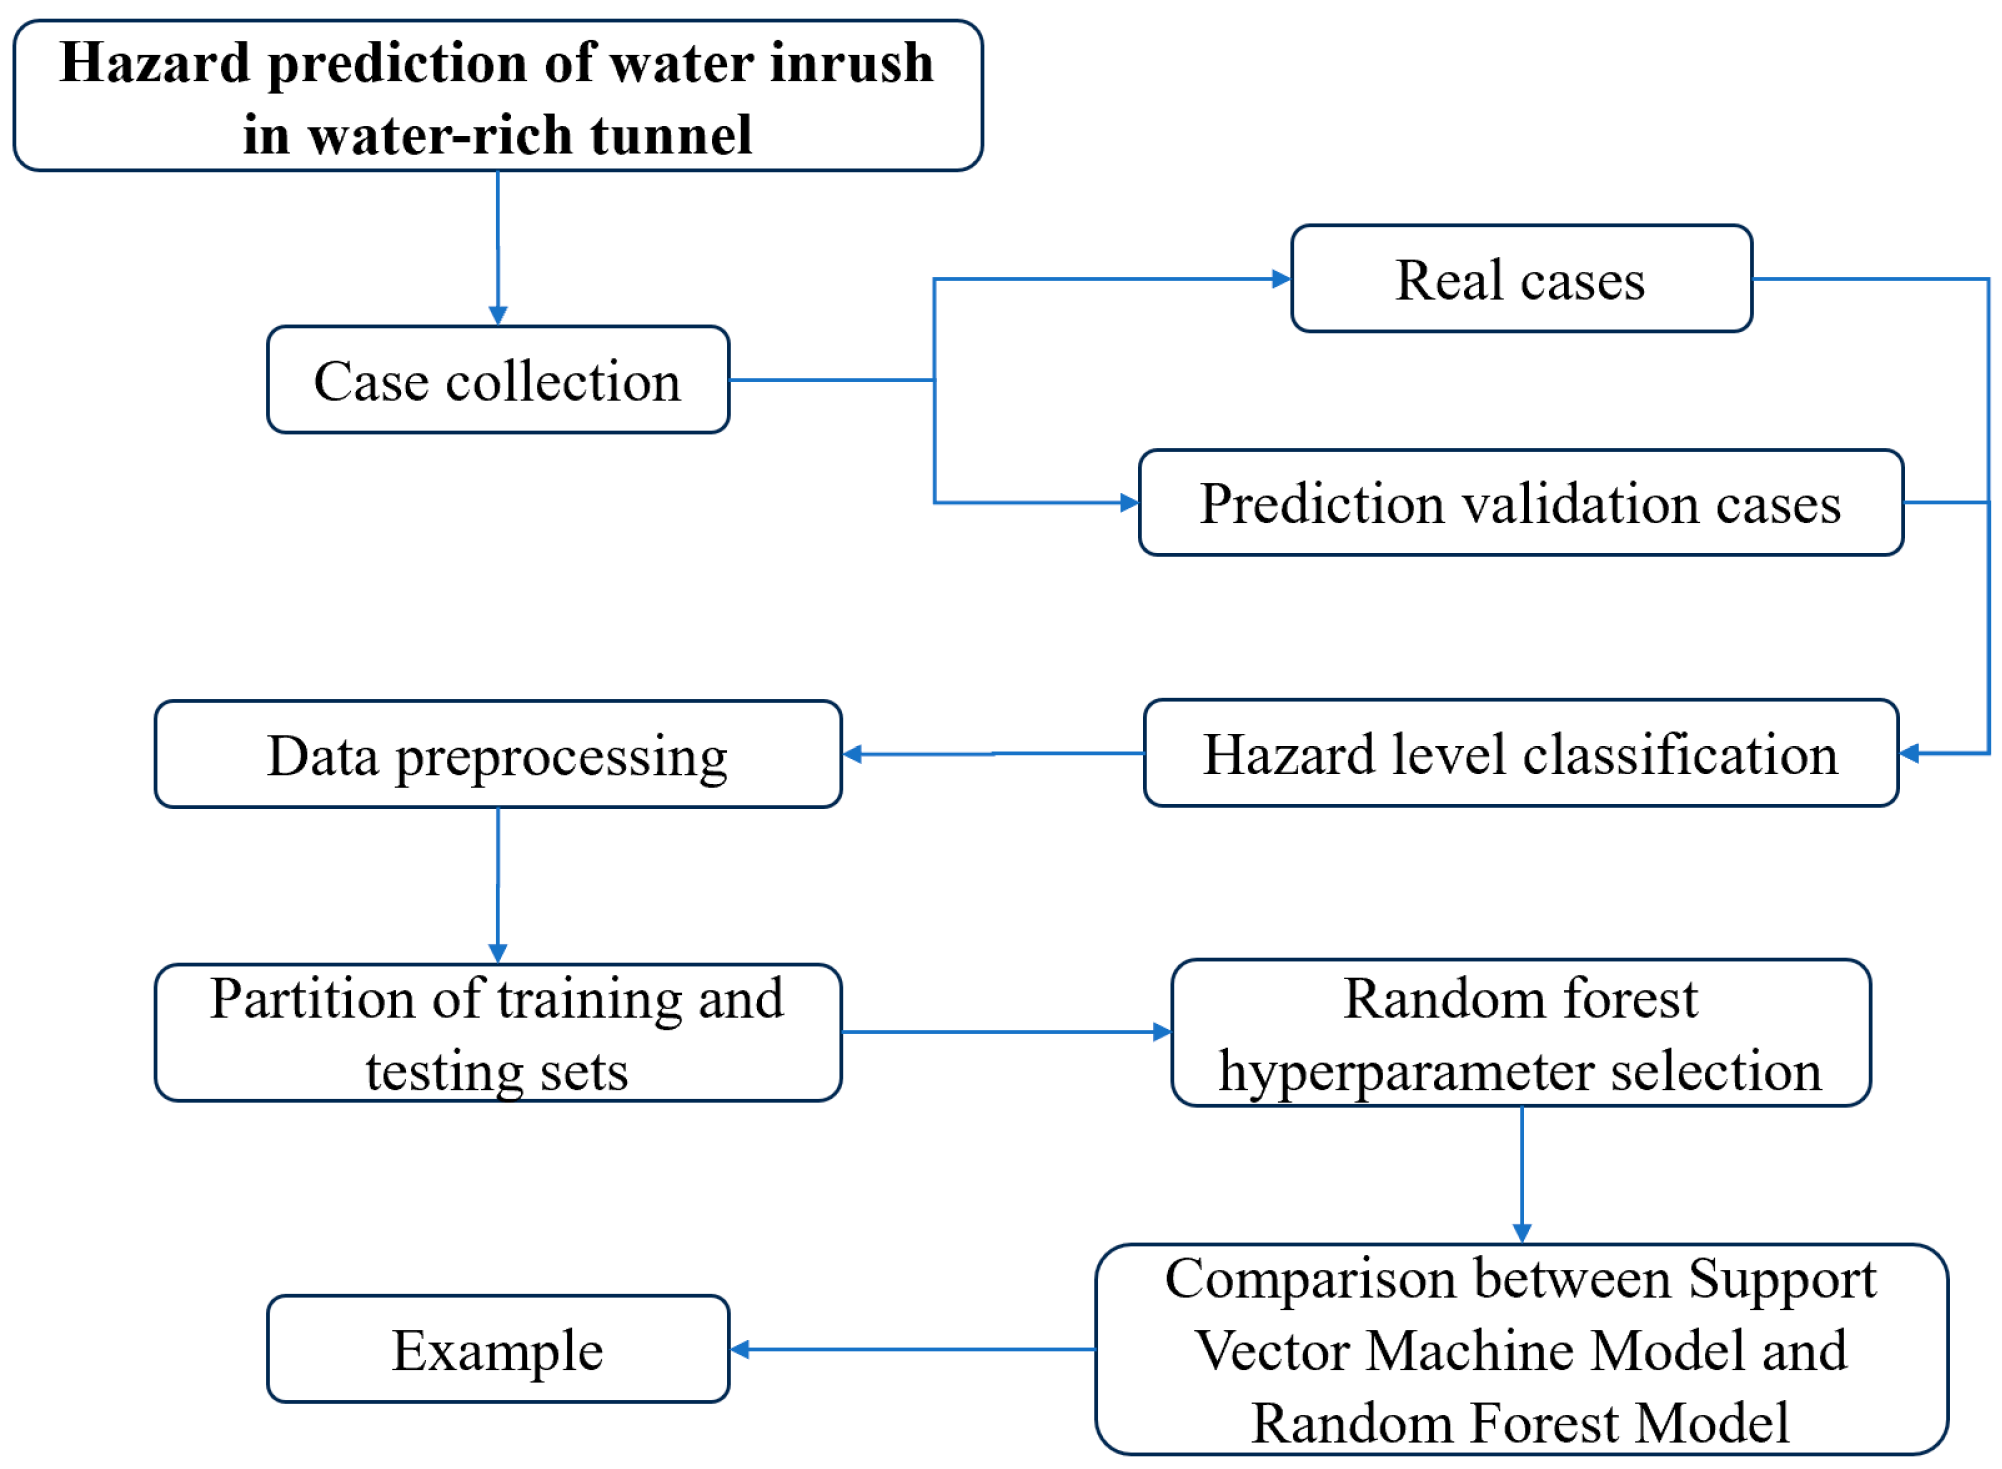
3. Methodology: Establishment of a Prediction Model for the Hazard of Water Inrush in a Water-Rich Tunnel

3.1. Principles of the RF Algorithm

The RF algorithm is an ensemble learning method based on decision trees and has the characteristics of high accuracy, high stability, and good robustness. It constructs a large number of decision trees and uses voting mechanisms for tasks such as classification, regression, and feature selection. RF mainly includes classification models and regression models. For classification problems, a voting mechanism is usually used to determine the final prediction category. For regression problems, the average value is usually used as the final prediction result. The RF algorithm can improve the robustness and generalization ability of models by integrating the results of multiple decision trees and taking into account the opinions of multiple models. The label (hazard levels) established in this article belongs to discrete variables and is suitable for classification models. Therefore, the classification model in the RF algorithm is selected as the application model. The algorithm includes the following steps:
(1) There is a data set S with N samples. Let i (i = 1, 2, …, N) represent its sample serial number, then the information of the ith sample can be expressed as (xi, yi), where xi is an M-dimensional vector, representing M features of the sample. yi is the category to which the sample belongs, so dataset S can be represented as:
S = x i , y i , i = 1 , 2 , , N
This is divided into the training sets c of C samples and the testing sets d of D samples according to a certain ratio, so that j (j = 1, 2, …, c) represents its serial number in the training sets. Let k (k = 1, 2, …, d) represent its serial number in the training sets, where N = c + d. With the above representation, training set C and testing set D can be represented as:
C = x j , y j , j = 1 , 2 , , c
D = x k , y k , k = 1 , 2 , , d
In training sets C, t samples were selected with the self-sampling method and the training subset was constructed.
(2) Feature selection is carried out on the training subset—M features are randomly selected from m features without being placed back, where m = log 2 M (rounded up) is used as the basis for node splitting of the decision tree—and a complete decision tree is generated.
(3) By repeating steps 1 and 2 above, s training subsets and s decision trees can be obtained, and s decision trees can be combined to form an RF model.
(4) The testing set D is input into the RF, so that each decision tree makes a decision on each sample, then the majority voting method is adopted to vote on the decision results. Finally, the classification of all samples in the testing sets is completed.

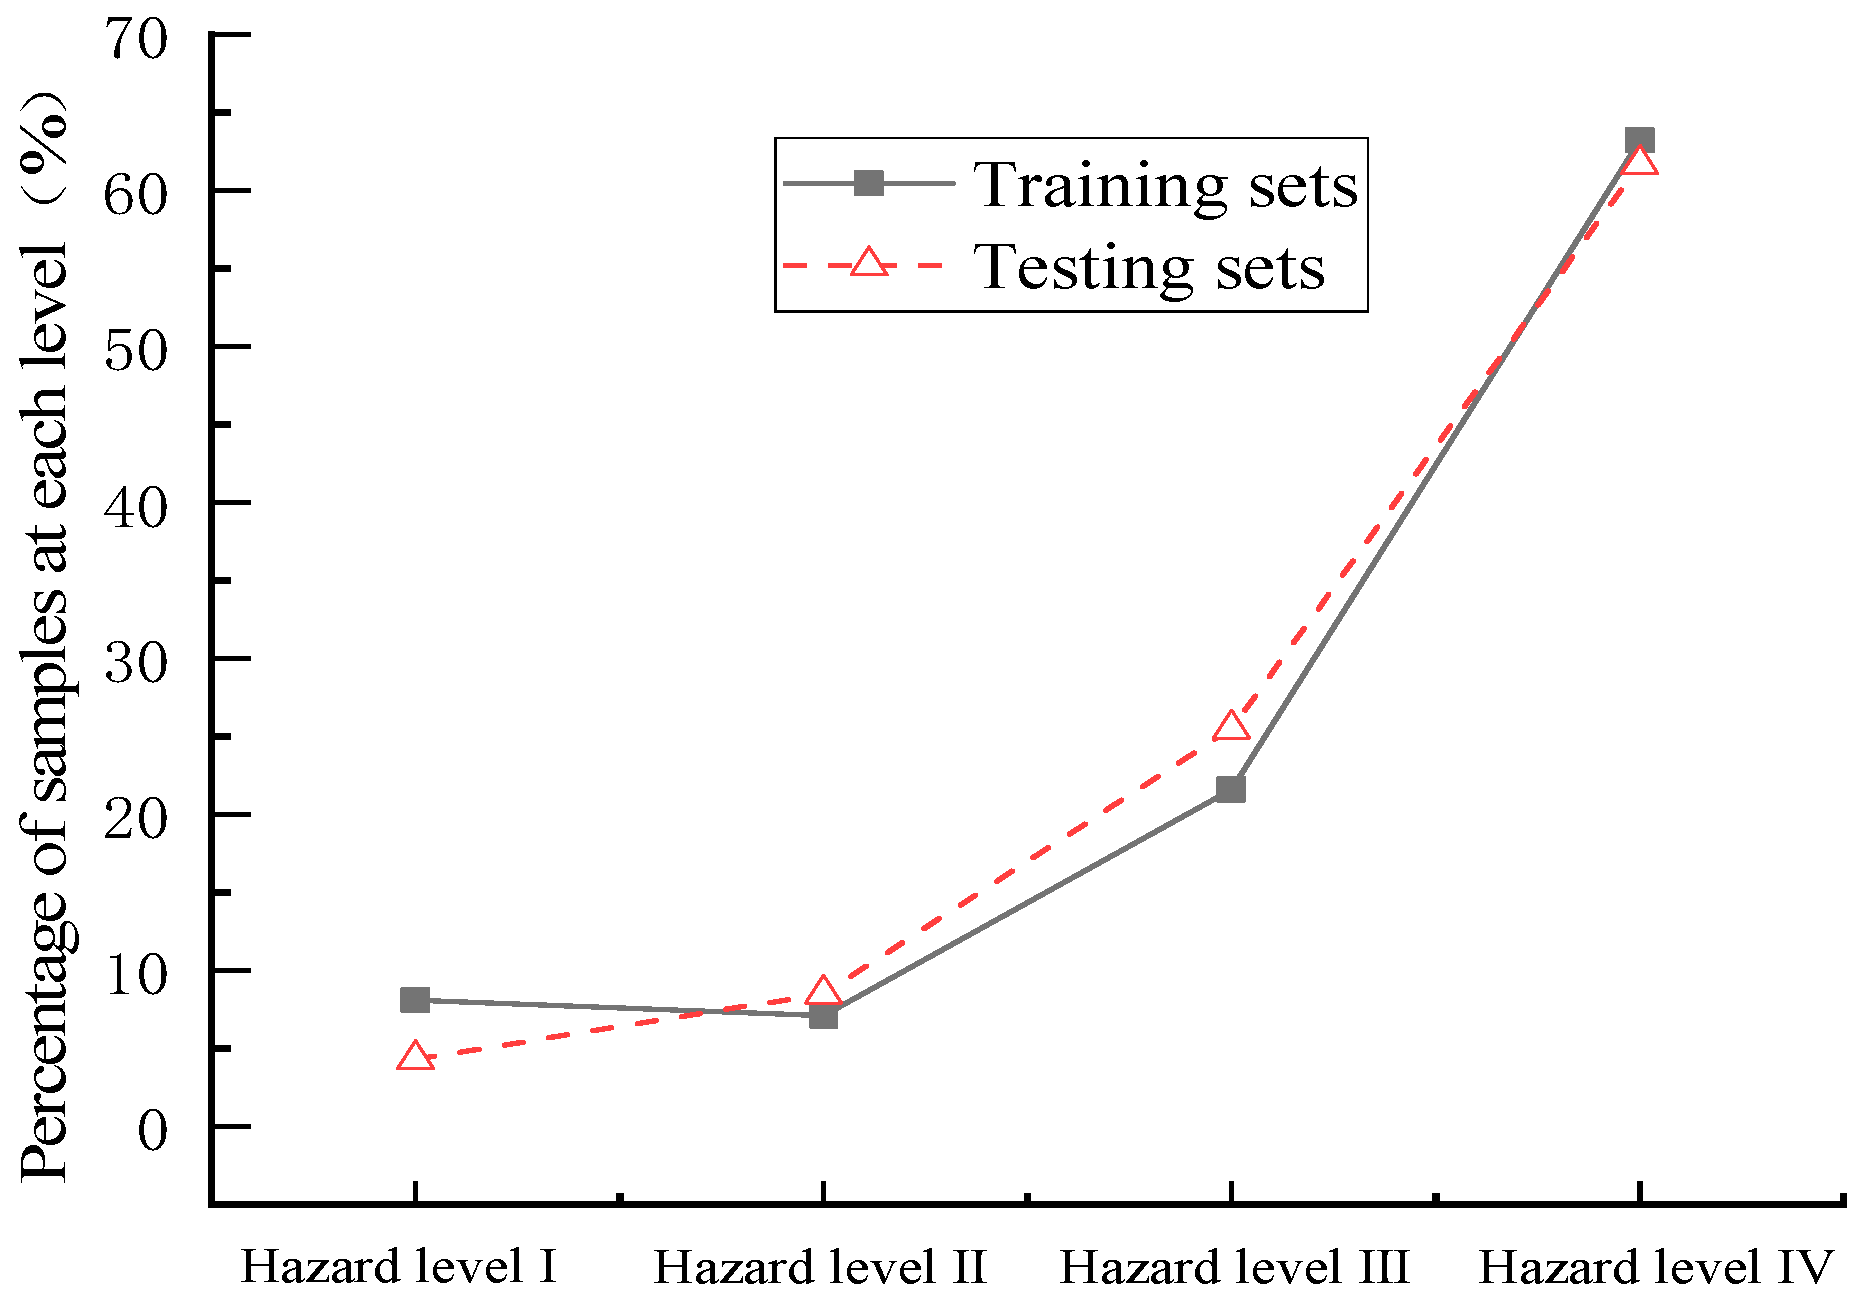
3.2. Division of Training and Testing Sets

The train_test_split module of sklearn divides the hazard levels of water inrush accidents in this article into training sets and testing sets with a ratio of 8:2. To optimize the model, select the appropriate random_seed. The result will fix the training and testing sets and ensure that they follow the stratified sampling ratio as much as possible. After the random_seed is fixed, the training and testing sets will also remain unchanged. The divided training set then consists of 185 samples (15 hazard levels I, 13 hazard levels II, 40 hazard levels III, and 117 hazard levels IV) and the testing set consists of 47 samples (2 hazard levels I, 4 hazard levels II, 12 hazard levels III, and 29 hazard levels IV). The proportion distributions of each hazard level in the training and testing sets are shown in Figure 3.

3.3. Preprocessing of Data

In the process of collecting case data, we were able to collect a large number of cases of water inrush disasters in tunnels. However, due to differences in the consideration of disaster factors by different scholars, and as some of the data were found from relevant literature, such as analysis and treatment of water inrush accidents, there may be some missing or incomplete information in the collected dataset. In order to better apply these data, we were required to process them further.
The main processes of data preprocessing in this article include data numerization, outlier detection and replacement, missing data supplementation, and data standardization. In order to avoid overfitting of the model, this article adopts a method in which data preprocessing is undertaken on the training set first, with the same processing then performed on the test set. Through this processing method, we ensured that the data of the training set and the testing set remained consistent during the preprocessing process.

3.3.1. Data Numerical Processing

The six evaluating indicators selected in this article must be numerically processed in order to be applied to the Sklearn module in Python in order to establish a hazard prediction model for water inrush in water-rich tunnels. The evaluating indicators include discrete variables (stratigraphic lithology, inadequate geology, surrounding rock grade, hydrodynamic zonation) and continuous variables (rock dip angle, negative terrain area ratio). For discrete variables, the numerical values 1, 2, 3, and 4 are used for quantification based on their hazard levels (I, II, III, IV). For continuous variables, the numerical values can be directly used for representation.

3.3.2. Detection and Replacement of Outliers

An outlier, also known as an anomaly, refers to one or several values in the data that differ significantly from other values. In machine learning, outliers may increase the bias and variance of the model, thus affecting the performance and accuracy of the model. Thus, it is necessary to detect and replace outliers.
The commonly used methods for outlier detection include Z-score, box plot, local outlier factor, isolated forest, etc. This article uses the box plot method [29] to screen outliers. This method is relatively simple and easy to use and can display the distribution of data in an intuitive manner. At the same time, it is also sensitive to and able to detect outliers. Based on this method, this article detected outliers in the collected cases, and the results are shown in Figure 4.
From the box plot in Figure 4, it can be seen that there are outliers in each hazard level of the evaluating indicator. After detecting outliers, it is necessary to replace them reasonably. In machine learning, data replacement generally selects the mean, mode, median, etc. In this article, we choose to replace the mode of each evaluating indicator under each hazard level for discrete variables and replace the average value of each evaluating indicator under each hazard level for continuous variables.

3.3.3. Missing Data Supplementation

Due to the fact that the selected cases in this article come from studies by different scholars, there are differences in the disaster factors selected by each scholar. Additionally, the data obtained in the analysis of water inrush accidents in water-rich tunnels differ from the selected indicators, resulting in a large amount of missing data in this article. For example, some literature only records the stratigraphic lithology, inadequate geology, rock dip angle, and surrounding rock grade of a certain tunnel. It is thus difficult to find the missing negative terrain area ratio and hydrodynamic zonation related data required for this article. The lack of these data means that we were unable to express the relevant information, which in turn affects the accuracy of the machine learning models’ predictions. The supplementary method for missing data is the same as the replacement method for outliers.

3.3.4. Data Standardization

In machine learning, standardization is a common data preprocessing technique that refers to a scaling of the features in a dataset on order that they have the same scale and distribution range. Due to the inconsistent interval range of the selected evaluating indicators in this article, there may be differences in their expression in machine learning. In the combination of disaster causing factors, there is often a problem whereby the expression of large data is stronger than that of small data, resulting in the inability of the small data to express its features. Therefore, a standardized approach is adopted to eliminate the inequality caused by data features. Standardization can improve the training efficiency of machine learning algorithms and make the weights between different features more equal and reasonable.
The standardized formula used in this article [30] is shown below.
X n o r m = x i x ¯ s
where xi represents the original data in the data set, x ¯ = 1 n i = 1 n x i is the average of the original data under the same variable, s = 1 n 1 i = 1 n x i x ¯ is the standard deviation of the original data in the same variable, and Xnorm is the standardized value of the original data, with a value between 0 and 1 and no dimension.
Based on the water inrush accidents selected in this article, the data were preprocessed using the above method, and a dataset suitable for the RF model was obtained. Taking two representative water inrush accidents as examples, the six evaluating indicators for the hazard of water inrush in water-rich tunnels were processed according to Table 1, and their numerical and standardized results were obtained. At the same time, according to Table 2, the hazard level of water inrush was classified, and the treatment results are displayed in Table 3.

3.4. Optimization of Hyperparameters

Hyperparameters are different parameter values used to control the learning process and have a significant impact on the performance of machine learning models. The optimization of hyperparameters involves finding suitable combinations of hyperparameter values in order to achieve maximum performance with the data in a reasonable time.
This article uses ten-fold cross validation [31] to select hyperparameters. Based on the limitation of the number of sample cases, the number of parameter classifiers (n_estimators) was divided into multiples of 1 and 10, and the maximum depth of the tree (max_depth) was divided into multiples of 1 and 10. Finally, the optimal hyperparameters selected were determined as n_Estimators = 7, max_ Depth = 10, and random_seed and these were determined in order to ensure a fixed result for each occurrence.
The receiver operating characteristic (ROC) curve of the testing sets was used to visually demonstrate the classification effect of the four hazard levels [32], as shown in Figure 5.
From Figure 5, it can be seen that the area under curve (AUC) of hazard levels I, II, III, and IV are 1, 0.983, 1, and 0.987, respectively. The larger the area value (1 is the largest), the better the classification effect. The AUC values in this article are close to 1, which shows that the RF model has high applicability for water inrush hazard prediction in a water-rich tunnel.

3.5. Comparative Testing

As different machine learning models have different classification effects for predicting the hazard of water inrush in water-rich tunnels, and because SVM achieves good results in the negative effects of tunnel groundwater environment, this article compares and analyzes the calculation results of the SVM model and the RF model. On the basis of consistent data and processing, and in order to maximize the optimal performance of SVM, the optimal hyperparameter selected through ten-fold cross validation is kernel = linear, C = 1. By comparing the confusion matrix results of the two models on the testing sets, the prediction accuracy at each hazard level and the overall prediction accuracy of the testing sets are calculated, as shown in Figure 6.
In the confusion matrix in Figure 6, the rows and columns represent the predicted hazard level and the actual hazard level, respectively. The numerical value at the point where the row value and column value are equal represents the accurate number of predicted results for each level, while the values at unequal points represent the number of inaccurate predictions at each level. From the graph, one can observe the distribution of the predicted samples (the correct number is the sum of the numbers on the main diagonal). Among the 47 samples, there were 46 cases of correct RF prediction, with an accuracy of 98%, and only 41 cases of correct SVM prediction, with an accuracy of 87%. This indicates that the RF model has high accuracy when predicting the hazard of water inrush in water-rich tunnels and is more suitable for distinguishing the hazards associated with water-rich tunnels.

4. Results: Engineering Case Verification

The Yuanliangshan tunnel [33,34,35] is located in Youyang County, Chongqing City, with a total length of 11,068 m and corresponding mileage of DK351+465~DK362+533. The maximum burial depth of the area where the tunnel is located is 780 m, the surrounding rock grades of the tunnel are mainly Class II, III, and IV and there are 11 faults that have a large influence on the tunnel. The main geological structures crossed by the tunnel are the Maoba Syncline, Tongmaling Anticline, and their associated or secondary fault structures. The lithology of the strata through which the tunnel passes mainly consists of limestone and shale, and the Maoba syncline area is a closed, basin-like structure that is soluble and impervious to water. It is easy for the convergence, infiltration, and circulation of atmospheric precipitation, the acceleration of the dissolution rate of limestone, and the formation of cracks, karst caves, karst pipes, or large, high-pressure, and water-rich karst caves. During tunnel construction, five deep buried filling karst caves were encountered, which were induced by factors such as high pressure, rich water, and karst. During the construction process, dozens of water inrush accidents occurred. The geological conditions related to the Yuanliangshan tunnel are shown in Figure 7, and a photo of the water inrush accident in Yuanliangshan tunnel is shown in Figure 8. This article selects five typical tunnel water inrush accidents from the relevant literature recorded by scholars, and these five accident sections are located in five karst cave areas with inadequate geology conditions, resulting in a high hazard of water inrush accidents. According to the on-site situation of the Yuanliangshan tunnel, the specific evaluating indicators are shown in Table 4. The water inrush in Table 4 is classified into hazard levels based on Table 2, with sections 1–5 classified as IV (4), IV (4), IV (4), II (2), and III (3), respectively.
According to the data preprocessing scheme mentioned in this article, Table 5 can be obtained by processing the hydrogeological conditions related to the Yuanliangshan tunnel in Table 4.
The preprocessed data in Table 5 are brought into the water inrush hazard prediction model of the water-rich tunnel established in this article to predict and analyze the hazard level of water inrush in five sections of Yuanliangshan tunnel. The implementation process is shown in Figure 9 and the comparison between the actual hazard level and the predicted hazard level is shown in Table 6.
According to the comparison between the predicted results and the actual results in Table 6, we can see that, of the five water inrush accident sections selected in this article, the predicted results of four sections are correct, with an accuracy rate of 80%, indicating that the overall performance of the model is good. However, there is a certain deviation (inconsistency) in one section (Section 4), in which the actual hazard level is Level II but the predicted result is Level IV. After analysis, it was found that the main reason for the high prediction results is due to the high level of hazard associated with the stratigraphic lithology, inadequate geology, rock dip angle, and surrounding rock grade. An explanation for the actual level being level II can be found in the lack of relevant data on negative terrain area ratio, which may result in a lower hazard level for negative terrain, or in its relatively far distance from water-rich karst caves, which results in a lower actual hazard level. Therefore, this model can be used to improve accuracy when predicting the hazard of water inrush via the examination of more accident cases and the use of more comprehensive data in the future.

5. Conclusions

This article focuses on the problem of water inrush in water-rich tunnels. Through the investigation and analysis of a large number of accident cases and by processing the associated data, a hazard prediction model for water inrush in water-rich tunnels based on RF is established. Finally, the model is validated by taking the water inrush accident in Yuanliangshan tunnel as an example, and the main conclusions are as follows:
(1)
Through the analysis of a large number of cases of water inrush accidents, indicators suitable for the hazard assessment of water inrush in water-rich tunnels were selected, an evaluating indicator system was constructed, and each classification of each evaluating indicator was obtained. The classification criteria for the hazard level of water inrush in water-rich tunnels in this article were established.
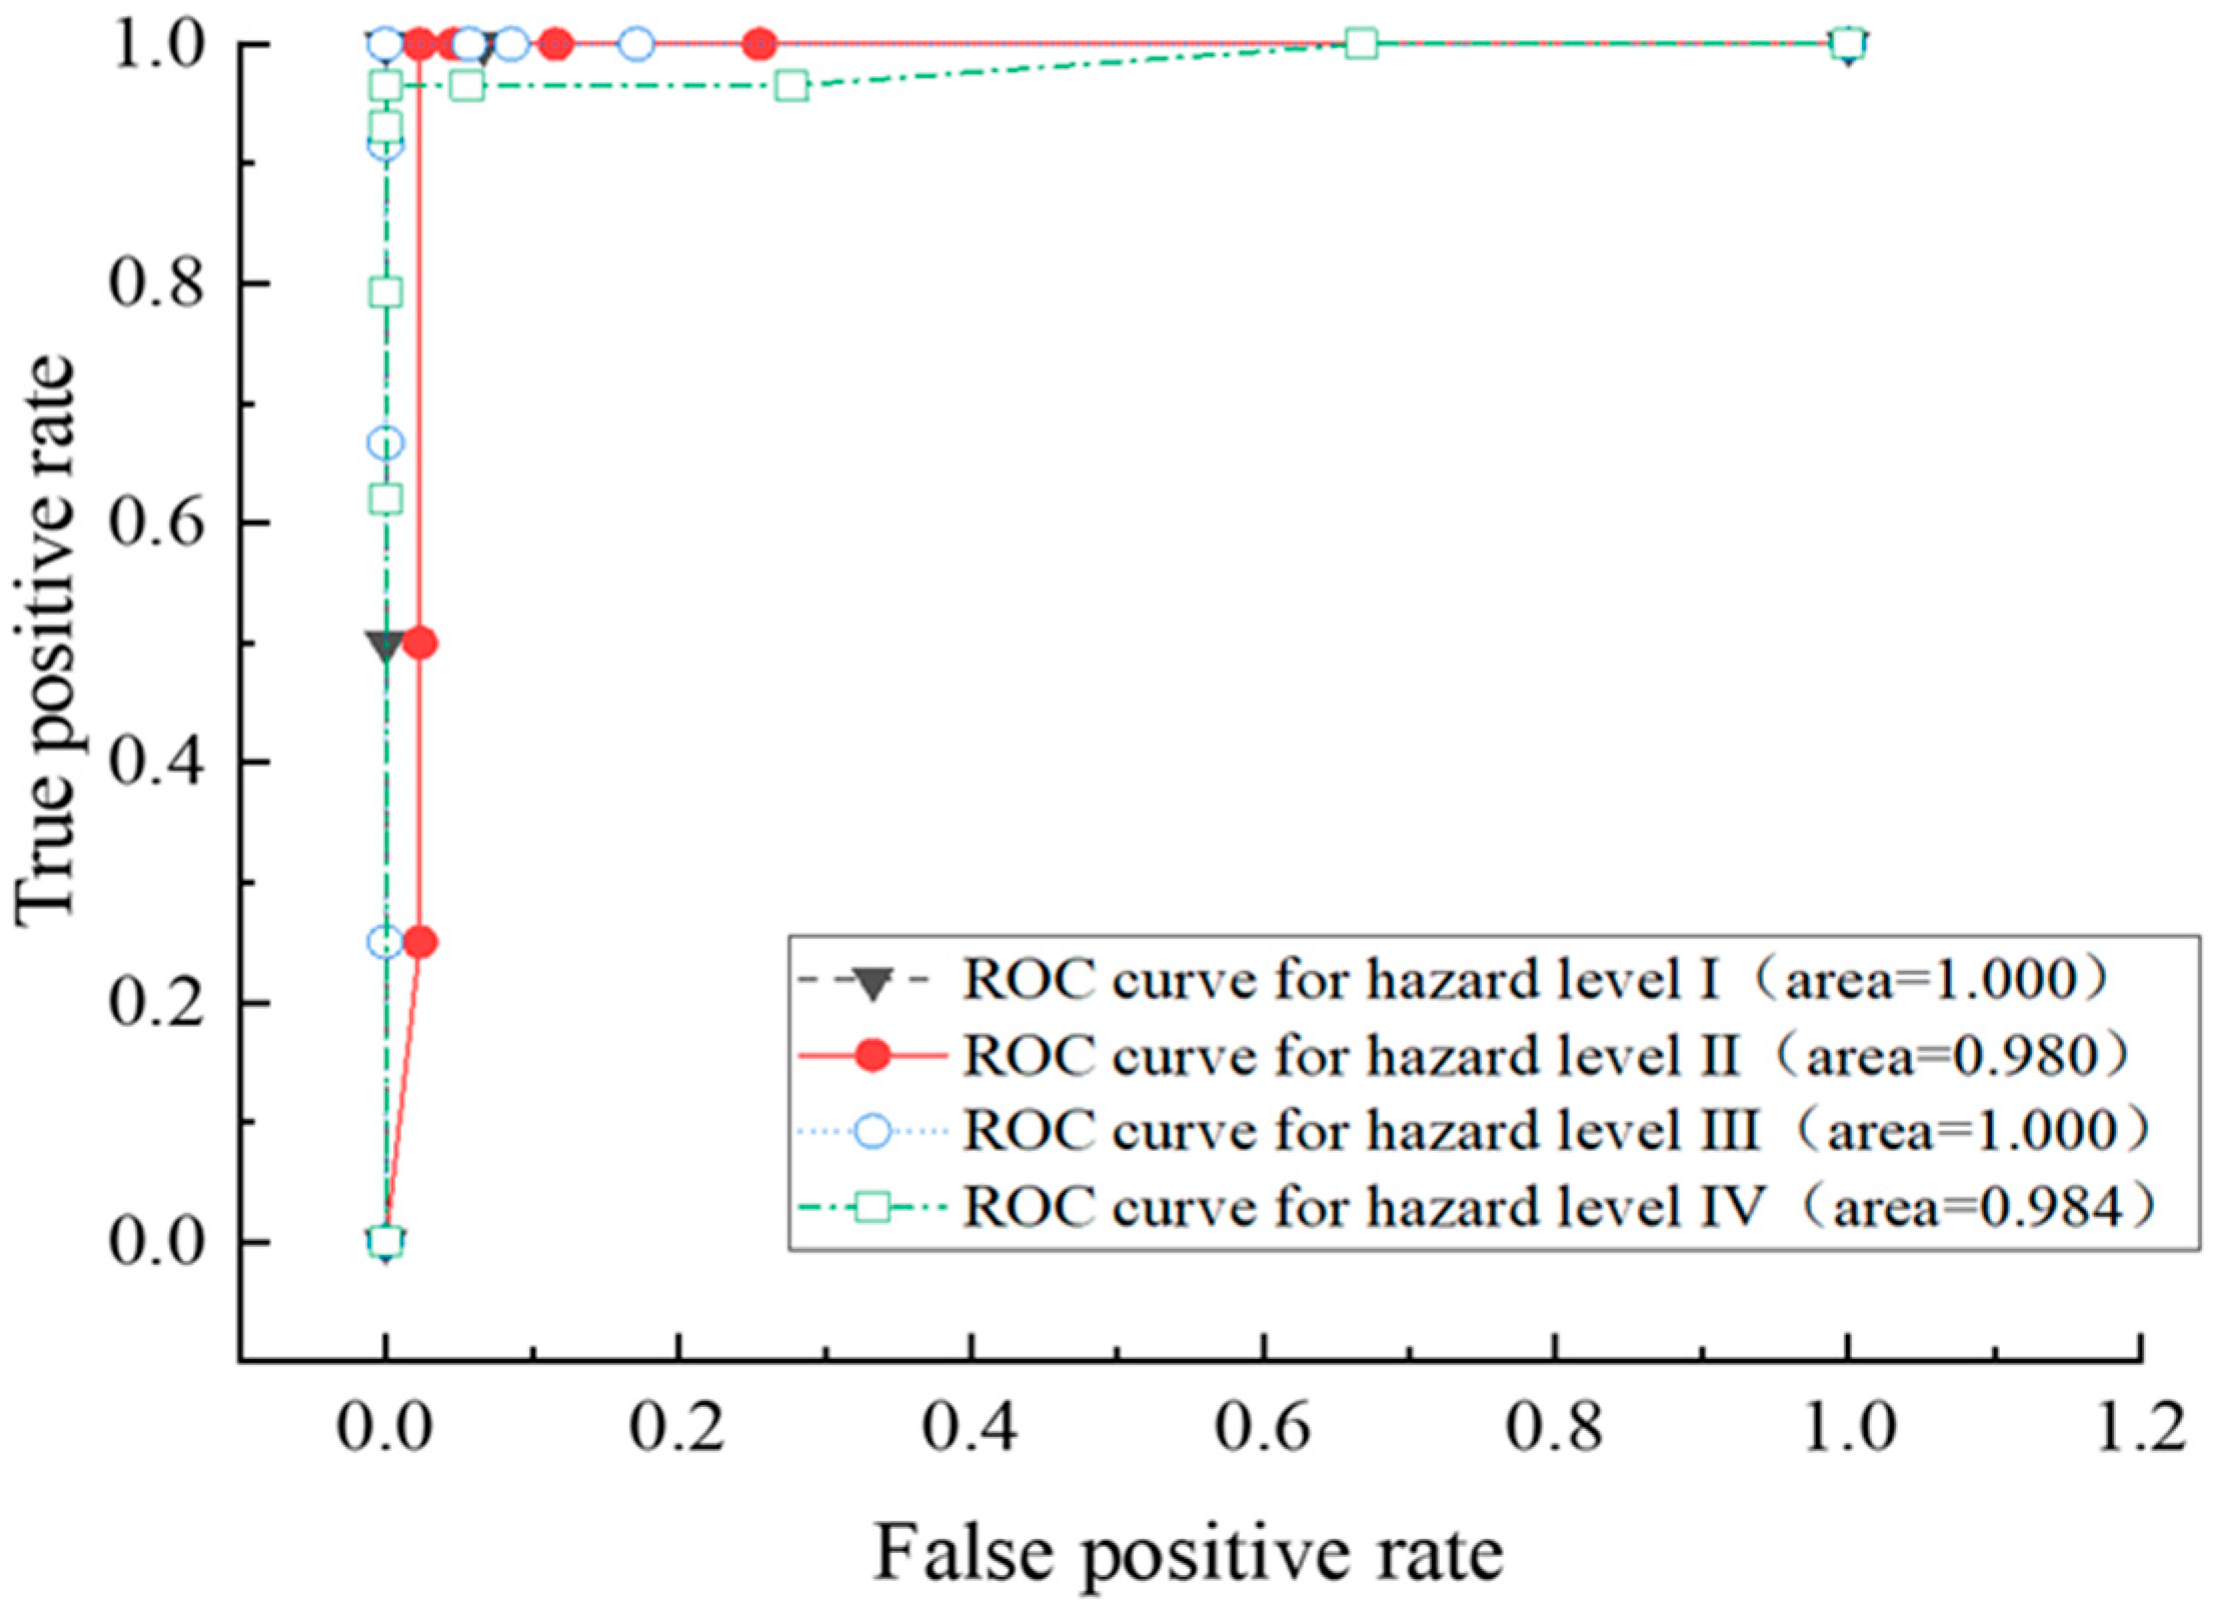
(2)
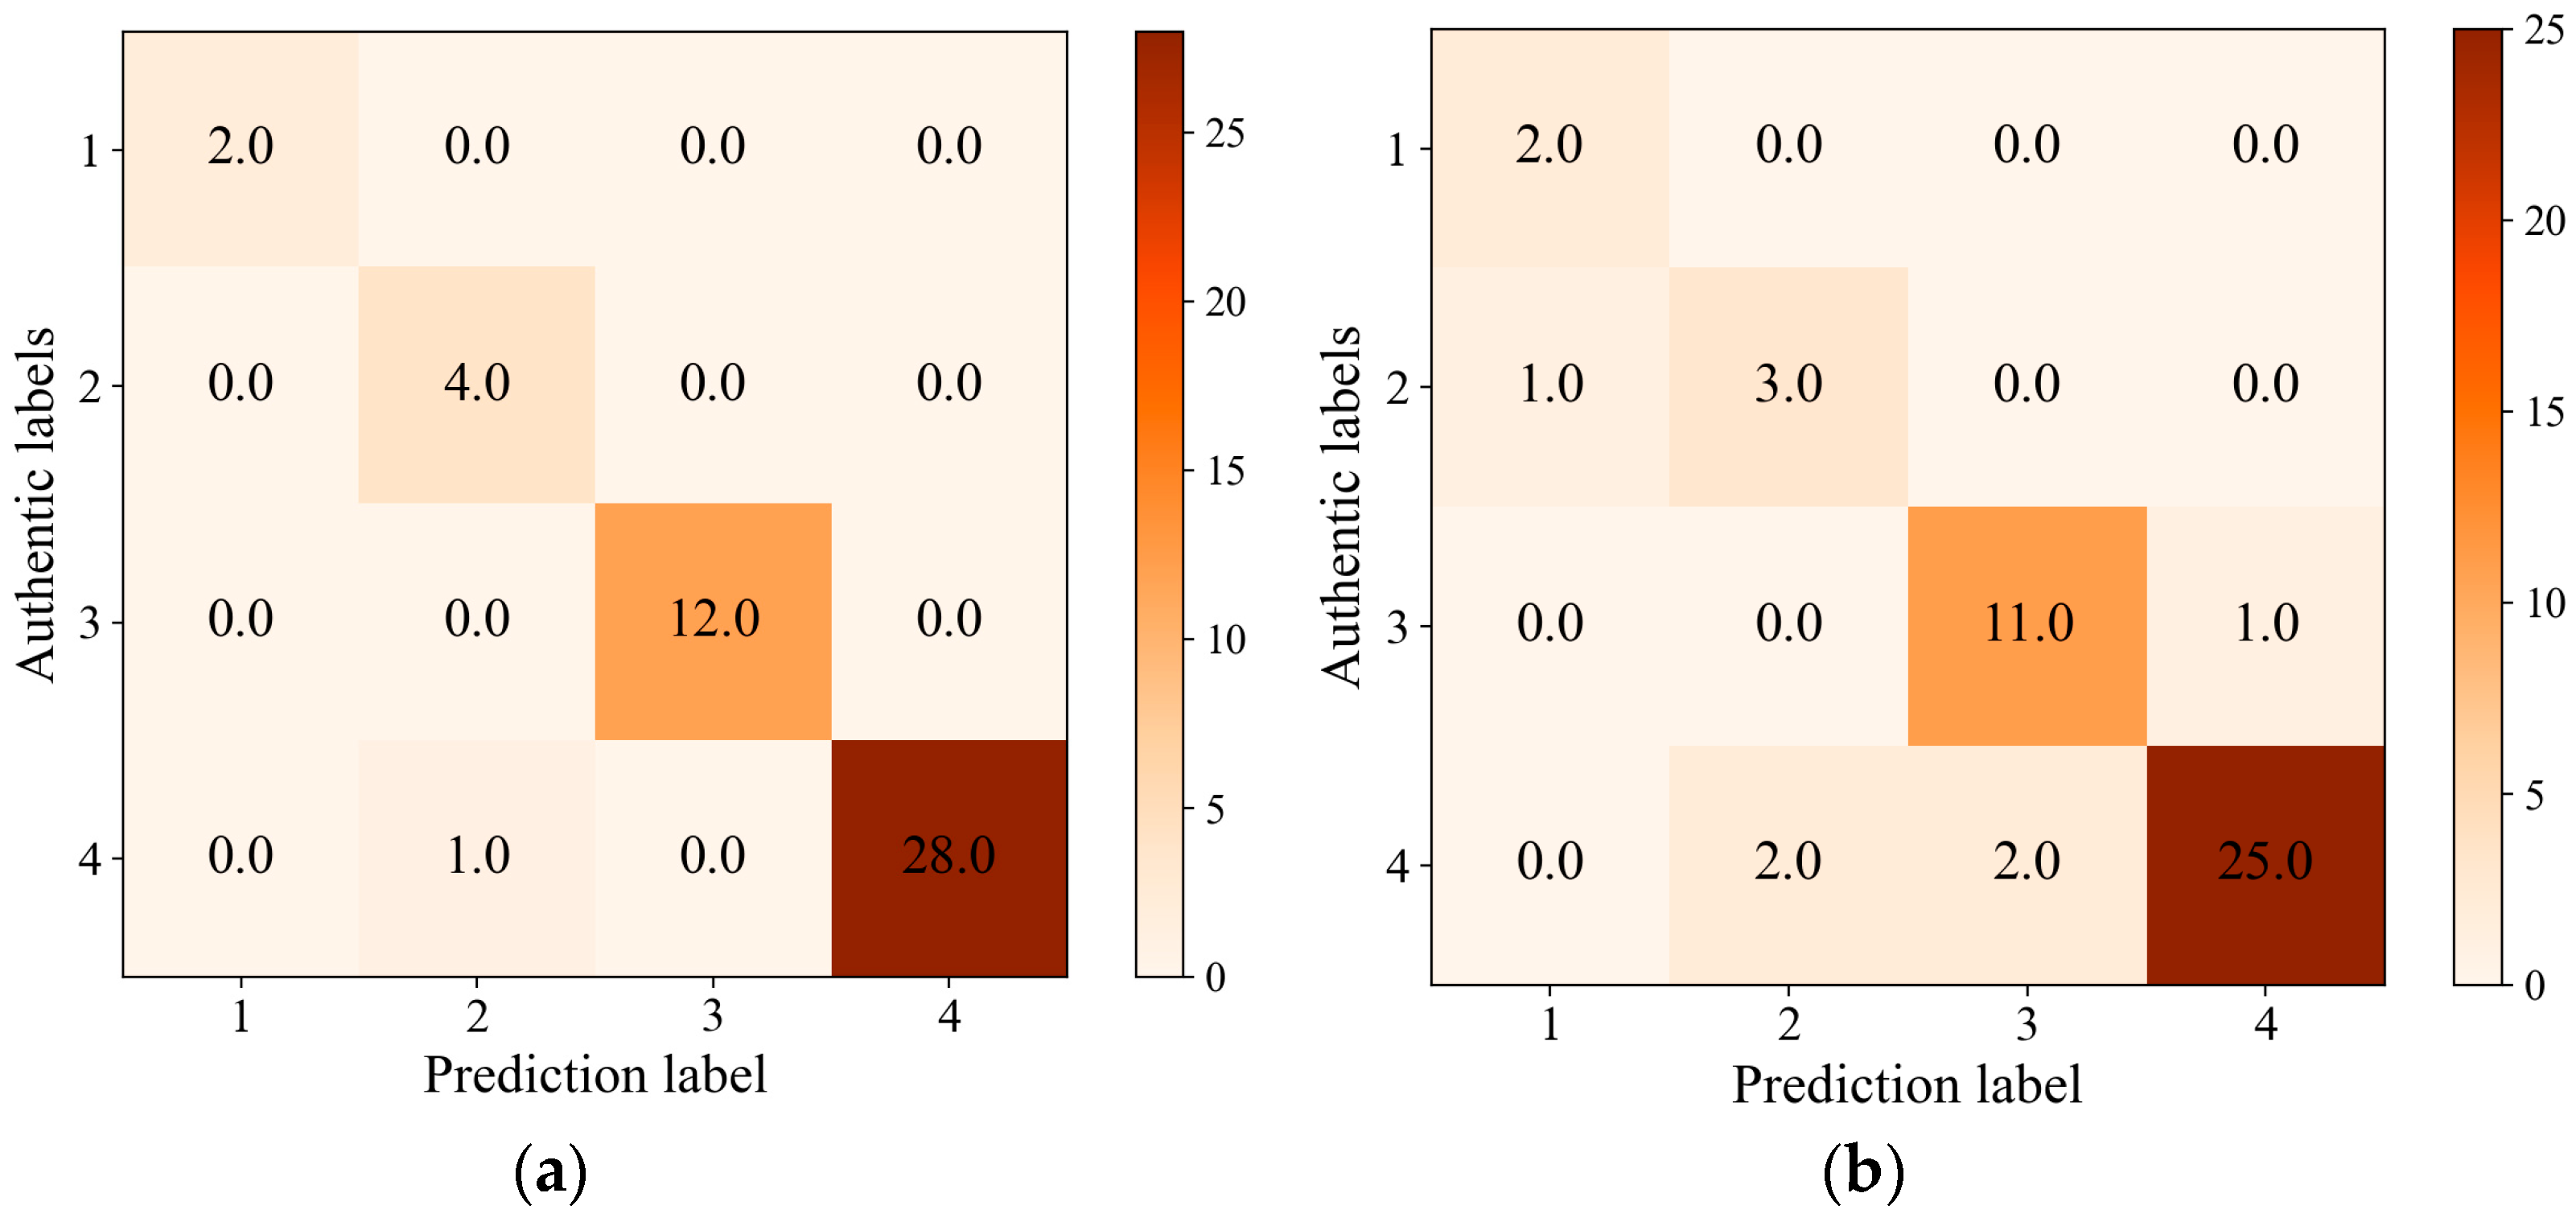
After ten-fold cross validation and optimization of the hyperparameters, the AUC values of the four hazard levels in the ROC curve are all above 0.98. Further comparison was made between the RF model and the SVM model, and it was found that the prediction accuracy of the RF model reached 98%, which is significantly better than the 87% of the SVM. This indicates that the RF model has high applicability when predicting the hazard of water inrush in water-rich tunnels.
(3)
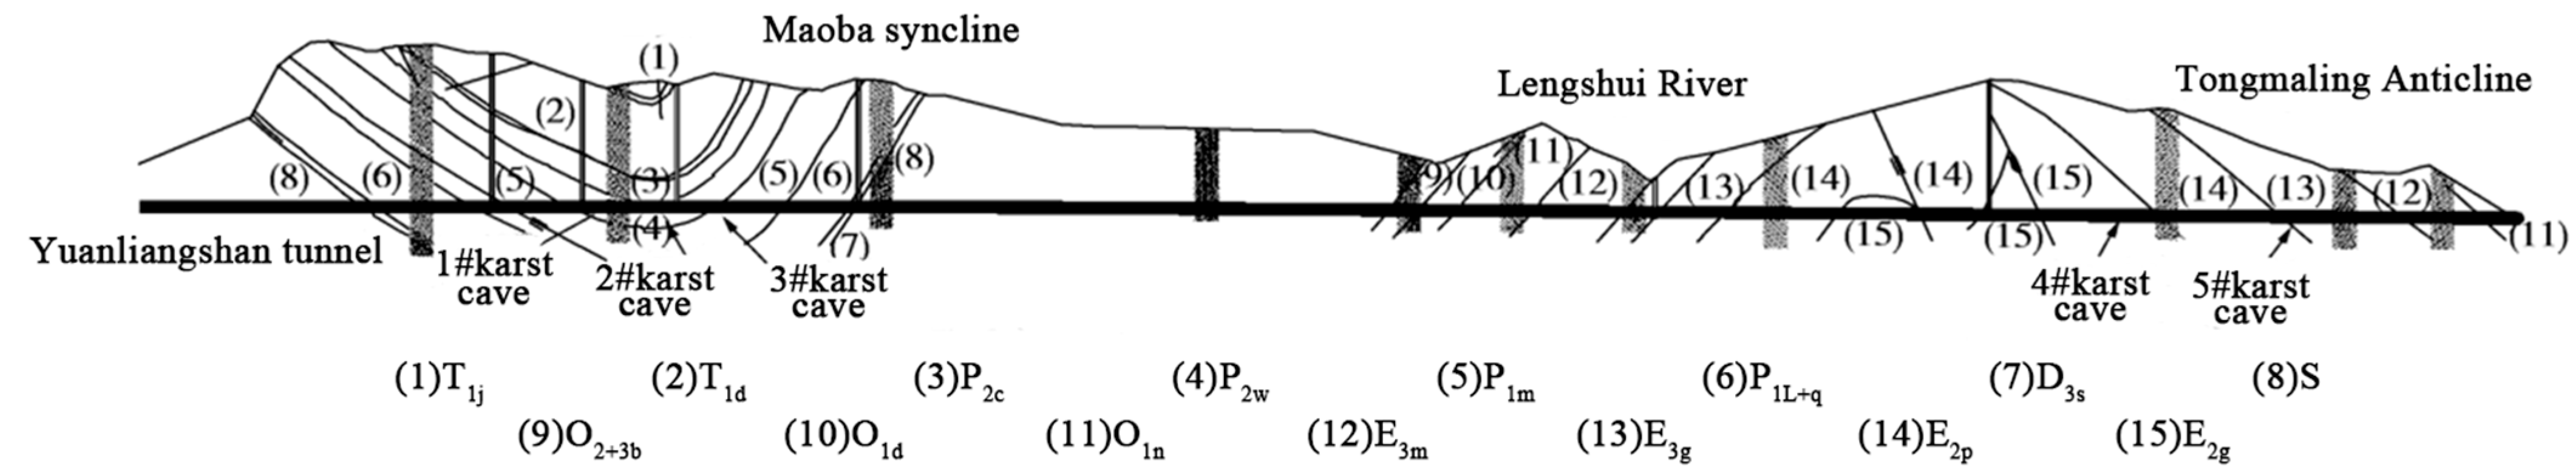
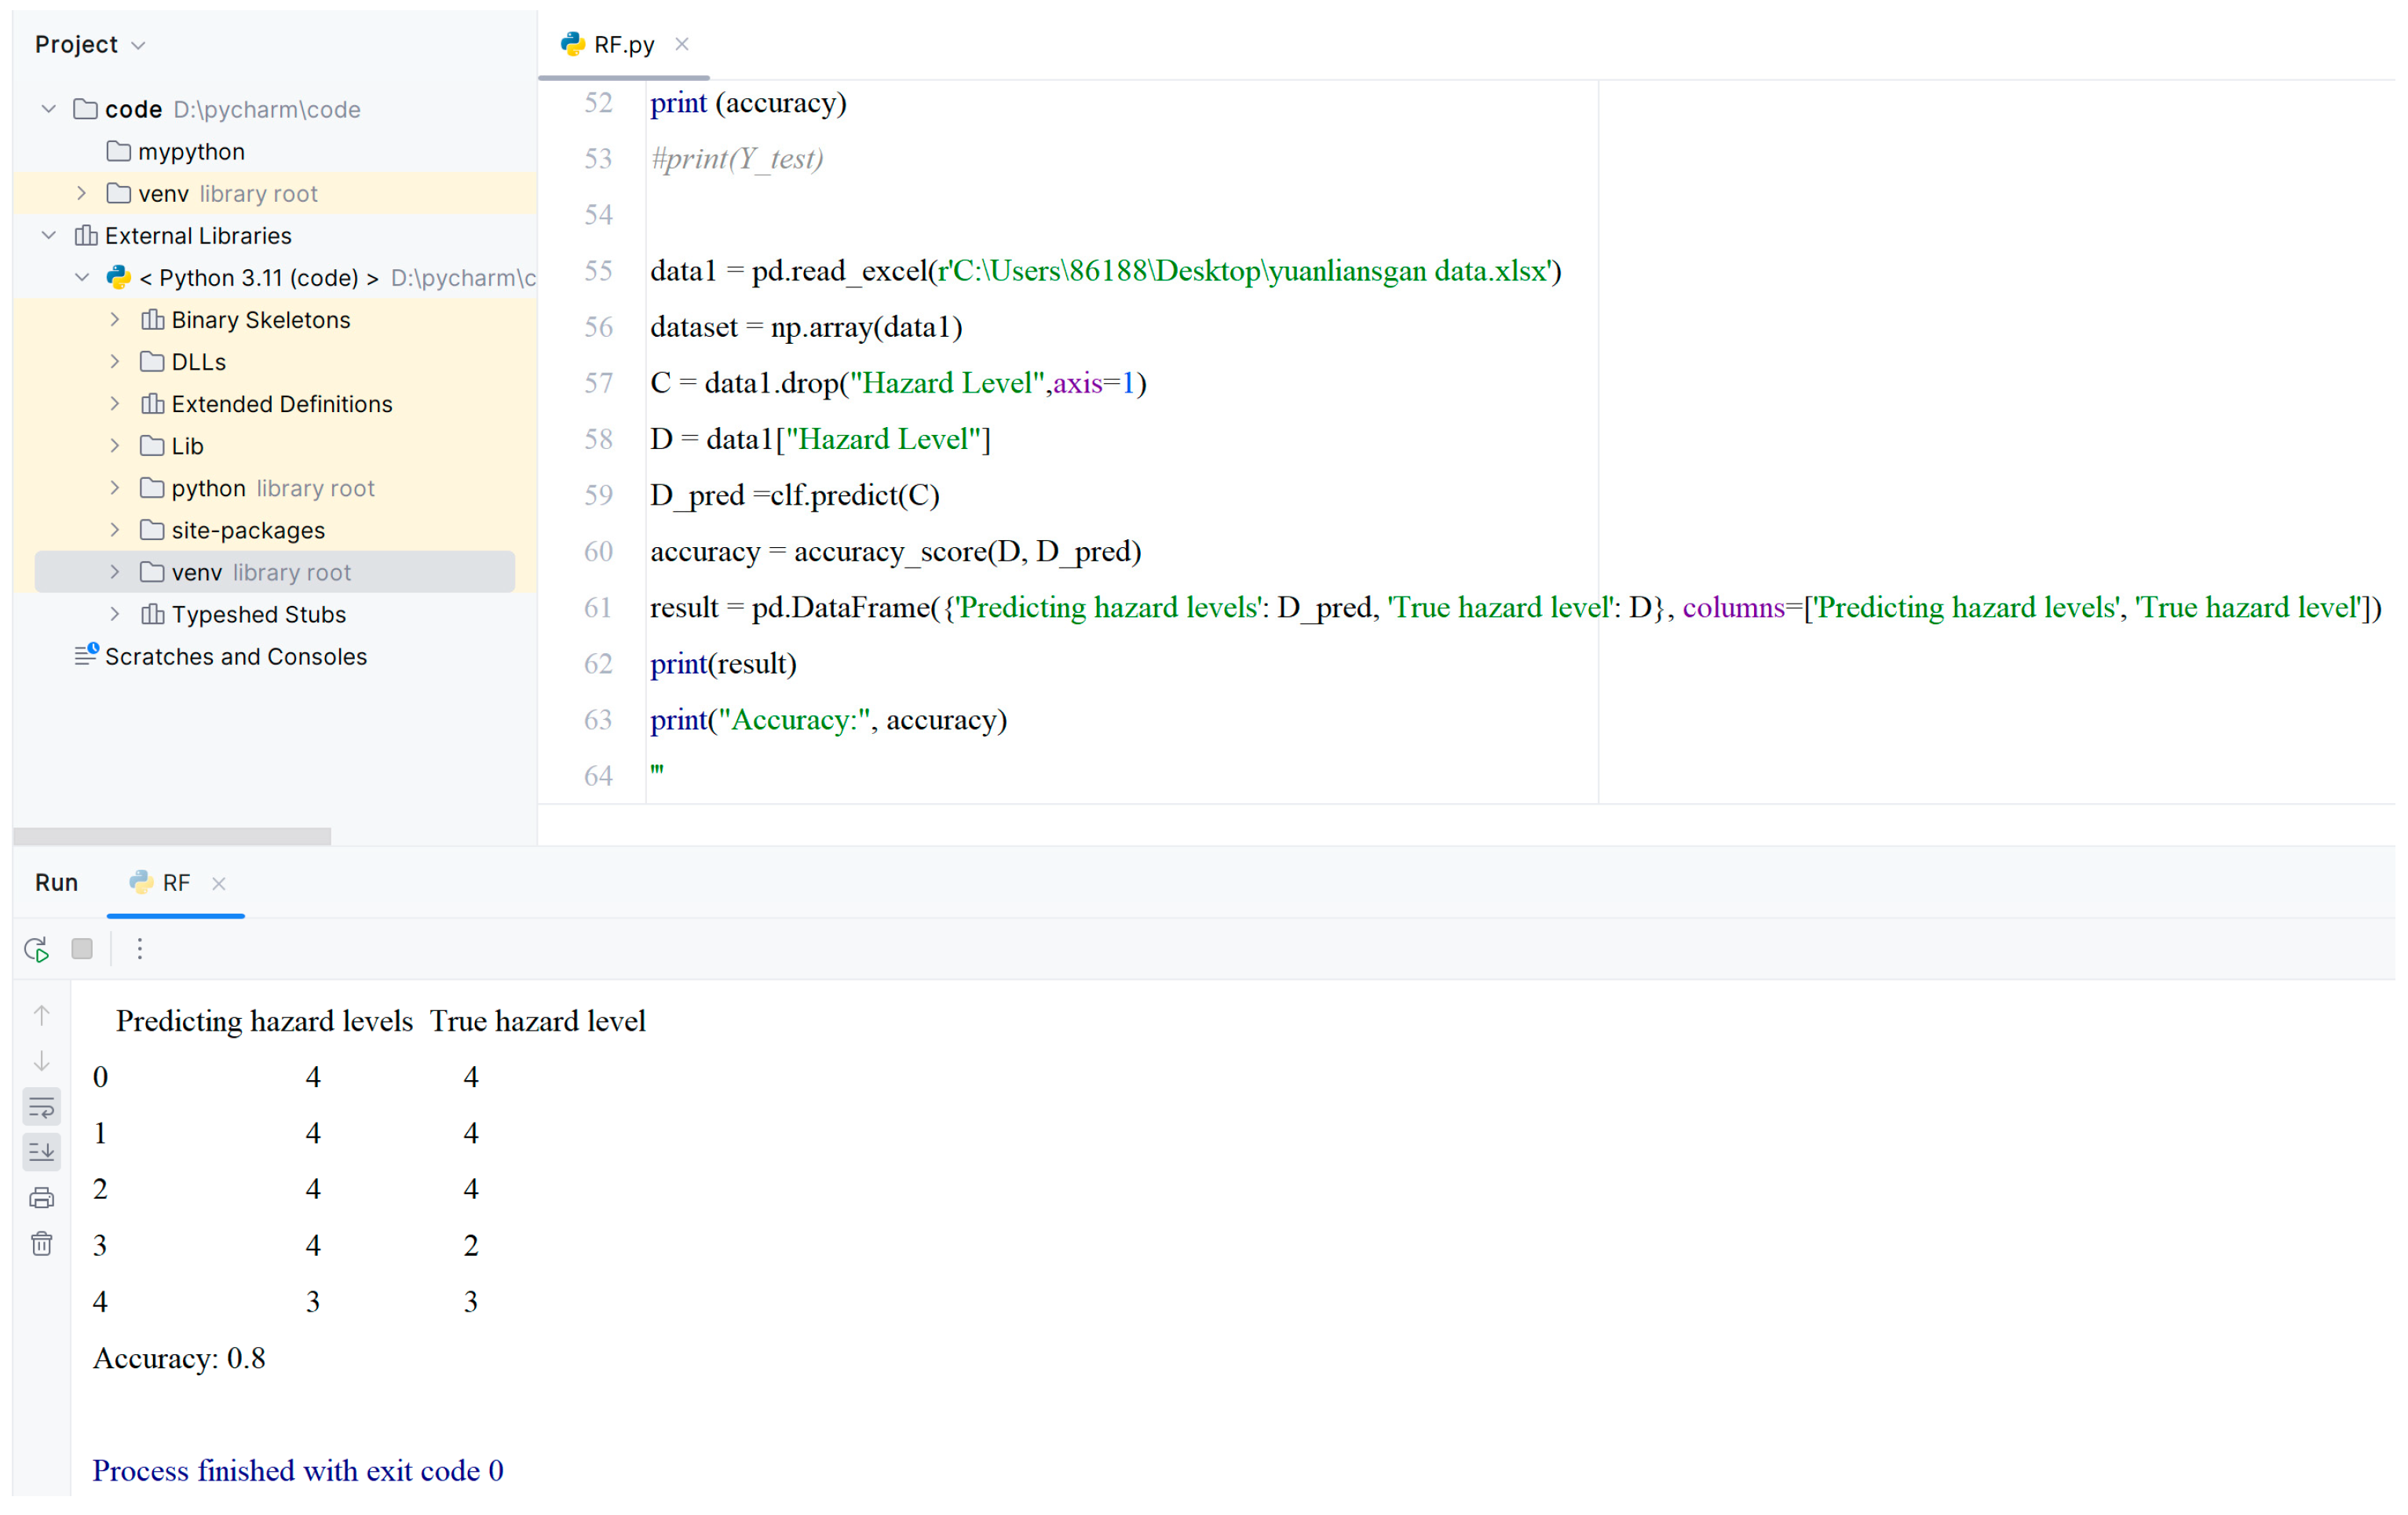
Taking the water inrush accident in the Yuanliangshan tunnel as an example, the accuracy of the RF algorithm-based hazard prediction model of water inrush in a water-rich tunnel was verified. The results show that the established model has strong applicability and high accuracy when predicting water inrush in a water-rich tunnel, and can be applied to practical engineering when identifying water inrush hazards in a water-rich tunnel.
At present, this study has the disadvantage of having a small number of data samples, which leads to a relatively vague classification of the degree of danger of each accident. By supplementing a large number of accident cases and conducting regression analysis on them, the harm caused by sudden water inrush in tunnels can be more accurately predicted. The collected data also have a large number of missing situations, and more comprehensive data collection is the key to improving prediction accuracy. Subsequent on-site research on the collected data can fill in the missing data, and it is expected that later generations may have a more comprehensive collection of frontline data with which to improve machine learning capabilities.

Author Contributions

Conceptualization, N.Z. and F.W.; methodology, M.N., F.W. and N.Z.; software, M.N. and J.L.; formal analysis and investigation, N.Z., M.N., J.L. and Y.W.; writing—original draft preparation, N.Z., M.N., X.Y. and C.Z.; writing—review and editing, F.W., N.Z., M.N., J.L. and Y.W.; funding acquisition, N.Z. and F.W.; resources, F.W. and N.Z. All authors have read and agreed to the published version of the manuscript.

Funding

This research is supported in part by Central Government Guides Local Science and Technology Development Fund Project (No. YDZJSX20231A021, YDZJSX20231A022), in part by Research Projects Supported by Shanxi Scholarship Council of China (No. 2020038, 2021061), and in part by Shanxi Province Graduate Practice and Innovation Project (No. 2023SJ070).

Institutional Review Board Statement

Not applicable.

Informed Consent Statement

Not applicable.

Data Availability Statement

The raw data supporting the conclusions of this article will be made available by the authors upon request.

Acknowledgments

The authors are grateful for the comments provided by the anonymous reviewers.

Conflicts of Interest

The authors declare no conflict of interest.

Abbreviations

RFRandom forest
SVMSupport vector machine
AHPAnalytic hierarchy process
ROCReceiver operating characteristic
BPBack propagation
RBFRadial basis function
AUCArea under curve

References

  1. Rupp, M.; Schneckenburger, M.; Merkel, M.; Börret, R.; Harrison, D.K. Industry 4.0: A Technological-Oriented Definition Based on Bibliometric Analysis and Literature Review. J. Open Innov. Technol. Mark. Complex. 2021, 7, 68. [Google Scholar] [CrossRef]
  2. Cacciuttolo, C.; Guzmán, V.; Catriñir, P.; Atencio, E.; Komarizadehasl, S.; Lozano-Galant, J.A. Low-Cost Sensors Technologies for Monitoring Sustainability and Safety Issues in Mining Activities: Advances, Gaps, and Future Directions in the Digitalization for Smart Mining. Sensors 2023, 23, 6846. [Google Scholar] [CrossRef] [PubMed]
  3. Du, Y.C.; Han, X.R.; Li, Z.L. Professional Evaluating System for Karst Tunnel Gushing Based on AHP and Its Application. Carsologica Sin. 2009, 28, 281–287. [Google Scholar]
  4. Zhang, W.Q.; Liu, Y. Multilevel Fuzzy Comprehensive Evaluation of Water Inrush in Karst Tunnels. J. Xi’an Univ. Sci. Technol. 2016, 36, 187–192. [Google Scholar]
  5. Hou, D.S.; Zhang, X.; Wang, L. Risk Evaluation of Tunnel Water lnrush Based on Comprehensive Weighting-TOPSIS Method and Its Application. Tunn. Constr. 2017, 37, 691–699. [Google Scholar]
  6. Zhou, Z.Q.; Kong, J.; Yang, W.M.; Chen, Y.P.; Zhang, Q.; Li, L.P.; Shi, S.S. Improved Attribute Interval Recognition Method and Its application in Risk Assessment of Water Inrush in Tunnels. J. Cent. South Univ. (Sci. Technol.) 2020, 51, 1703–1711. [Google Scholar]
  7. Saeid, S.; Panos, K. A Novel Anomaly-Based Intrusion Detection Model Using PSOGWO-Optimized BP Neural Network and GA-Based Feature Selection. Sensors 2022, 22, 9318. [Google Scholar]
  8. Kosarac, A.; Cep, R.; Trochta, M.; Knezev, M.; Zivkovic, A.; Mladjenovic, C.; Antic, A. Thermal Behavior Modeling Based on BP Neural Network in Keras Framework for Motorized Machine Tool Spindles. Materials 2022, 15, 7782. [Google Scholar] [CrossRef]
  9. Wei, X.Y.; Jin, C.L.; Gong, L.; Zhang, X.; Ma, M.H. Risk Evaluation of Railway Tunnel Water Inrush Based on PCA-Improved RBF Neural Network Model. J. Railw. Sci. Eng. 2021, 18, 794–802. [Google Scholar]
  10. Du, C.C.; Wang, X.; Wang, Z.; Wang, D.H. Data-driven dynamics reconstruction using RBF network. Mach. Learn. Sci. Technol. 2023, 4, 045016. [Google Scholar] [CrossRef]
  11. Zhang, W.; Bao, X.Y. Study on Evaluation of Negative Effect Grade of Tunnel Groundwater Environment Based on SVR. Railw. Stand. Des. 2021, 65, 148–153. [Google Scholar]
  12. Melgarejo-Morales, A.; Vazquez-Becerra, G.E.; Millan-Almaraz, J.R.; Martinez-Felix, C.A.; Shah, M. Applying support vector machine (SVM) using GPS-TEC and Space Weather parameters to distinguish ionospheric disturbances possibly related to earthquakes. Adv. Space Res. 2023, 72, 4420–4434. [Google Scholar] [CrossRef]
  13. Hao, Q.; Wu, X.; Mu, W.P.; Deng, R.C.; Hu, B.Y.; Gao, Y. Groundwater Source Determination of Mine lnflow or lnrush Using a Random Forest Model. Sci. Technol. Eng. 2020, 20, 6411–6418. [Google Scholar]
  14. Bo, C.H. Research on Intelligent Prediction Method of Hazard Risk of Water and Mud inrush in Karst Tunnel Based on Machine Learning. Master’s Thesis, Shandong University, Jinan, China, 2021. [Google Scholar]
  15. Ren, R.; Xu, M. BP network prediction of water inrush volume in tunnels in barrier anticline structural areas. Mod. Tunn. Technol. 2011, 6, 47–52. [Google Scholar]
  16. Huang, X.J. Prediction and Forecast of Maluqing Tunnel + 978 Melting Cavity of Yiwan Railway. Mod. Tunn. Technol. 2011, 48, 128–132. [Google Scholar]
  17. Zhang, K.; Zheng, W.; Xu, C.; Chen, S. An Improved Extension System for Assessing Risk of Water Inrush in Tunnels in Carbonate Karst Terrain. KSCE J. Civ. Eng. 2019, 23, 2049–2064. [Google Scholar] [CrossRef]
  18. Chu, H.; Xu, G.; Yasufuku, N.; Yu, Z.; Liu, P.; Wang, J. Risk Assessment of Water Inrush in Karst Tunnels Based on Two-Class Fuzzy Comprehensive Evaluation Method. Arab. J. Geosci. 2017, 10, 179. [Google Scholar] [CrossRef]
  19. Li, L.; Lei, T.; Li, S.; Zhang, Q.; Xu, Z.; Shi, S.; Zhou, Z. Risk Assessment of Water Inrush in Karst Tunnels and Software Development. Arab. J. Geosci. 2015, 4, 1843–1854. [Google Scholar] [CrossRef]
  20. Li, L.P.; Li, S.C.; Chen, J.; Li, J.L.; Xu, Z.H.; Shi, S.S. Construction License Mechanism and Its Application Based on Karst Water Inrush Risk Evaluation. Chin. J. Rock Mech. Eng. 2011, 30, 1345–1354. [Google Scholar]
  21. Li, S.C.; Zhou, Z.Q.; Li, L.P.; Xu, Z.H.; Zhang, Q.Q.; Shi, S.S. Risk Assessment of Water Inrush in Karst Tunnels Based on Attribute Synthetic Evaluation System. Tunn. Undergr. Space Technol. 2013, 38, 50–58. [Google Scholar] [CrossRef]
  22. Mao, B.Y.; Xu, M.; Jiang, L.W. Preliminary Study on Risk Assessment of Water and Mud Inrush in Karst Tunnel. Carsologica Sin. 2010, 29, 183–189. [Google Scholar]
  23. Shen, X.M.; Liu, P.L.; Wang, J.F. Evaluation of Water Inrush Risks of Karst Tunnel with Analytic Hierarchy Process. J. Railw. Eng. Soc. 2010, 12, 56–63. [Google Scholar]
  24. Xian, M.; Xiong, W. Risk assessment of water inrush in karst shallow tunnel under river based on SPA model. Chin. J. Appl. Mech. 2023, 40, 135–145. [Google Scholar]
  25. Jia, J.; Zhao, L.M.; Yu, Z.T.; Xie, R.Q.; Luo, Y.Z. Karst Development Characteristics and Water Inrush Risk Assessment of Railway Tunnel in a Difficult and Dangerous Mountain Area. Northwest. Geol. 2023, 56, 258–267. [Google Scholar]
  26. Li, Z.Y.; Wang, Y.C.; Liu, Y.; Jiao, Q.L.; Wang, M.T.; Zhang, Y. Model on variable weight−target approaching for risk assessment of water and mud inrush in intrusive contact tunnels. J. Cent. South Univ. (Sci. Technol.) 2019, 50, 2773–2782. [Google Scholar]
  27. Yang, Z. Risk prediction of water inrush of karst tunnels based on bp neural network. In Proceedings of the International Conference on Mechanical Materials and Manufacturing Engineering, London, UK, 18–19 January 2016; Atlantis Press: Amsterdam, The Netherlands, 2016; pp. 327–330. [Google Scholar]
  28. Yang, X.; Zhang, S. Risk assessment model of tunnel water inrush based on improved attribute mathematical theory. J. Cent. South Univ. 2018, 25, 379–391. [Google Scholar] [CrossRef]
  29. Gu, G.Q.; Li, X.H. Exponential Weighted Smoothing Prediction Model Based on Abnormal Detection of Box-plot. Comput. Mod. 2021, 1, 28–33. [Google Scholar]
  30. Cochran, J.M.; Leproux, A.; Busch, D.R.; O’sullivan, T.D.; Yang, W.; Mehta, R.S.; Police, A.M.; Tromberg, B.J.; Yodh, A.G. Breast cancer differential diagnosis using diffuse optical spectroscopic imaging and regression with z-score normalized data. J. Biomed. Opt. 2021, 26, 026004. [Google Scholar] [CrossRef]
  31. Chik, Z.; Aljanabi, Q.A.; Kasa, A.; Taha, M.R. Ten-fold cross validation artificial neural network modeling of the settlement behavior of a stone column under a highway embankment. Arab. J. Geosci. 2014, 7, 4877–4887. [Google Scholar] [CrossRef]
  32. Ierimonti, L.; Venanzi, I.; Ubertini, F. ROC analysis-based optimal design of a spatio-temporal online seismic monitoring system for precast industrial buildings. Bull. Earthq. Eng. 2021, 19, 1441–1466. [Google Scholar] [CrossRef]
  33. Wang, L. Prediction of water inflow in Southwest Karst Crossing Mountain Tunnel Based on Genetic Algorithm and Support Vector Machine. Master’s Thesis, Chengdu University of Technology, Chengdu, China, 2020. [Google Scholar]
  34. Zhang, M.Q.; Liu, Z.W. The analysis on the features of karst water burst in the Yuanliangshan tunnel. J. Geotech. Eng. 2005, 27, 422–426. [Google Scholar]
  35. Zeng, W.; Zhang, M.Q. Analysis and research on mud burst caused by explosive spraying in the No. 3 karst cave of Yuanliangshan Tunnel. In Highway Transportation Technology (Applied Technology Edition); Railway Engineering: Beijing, China, 2008; pp. 158–161. [Google Scholar]
Figure 1. Implementation process of hazard prediction of water inrush in a water-rich tunnel.
Applsci 14 00867 g001
Figure 2. Hazard evaluating indicator system of water inrush.
Applsci 14 00867 g002
Figure 3. Proportion distributions of each hazard level in the training and testing sets.
Applsci 14 00867 g003
Figure 4. Box plot detection results. (a) Stratigraphic lithology. (b) Inadequate geology. (c) Rock dip angle. (d) Negative terrain area ratio. (e) Surrounding rock grade. (f) Hydrodynamic zonation.
Applsci 14 00867 g004
Figure 5. Testing sets ROC curve.
Applsci 14 00867 g005
Figure 6. Confusion matrix of two models. (a) RF. (b) SVM.
Applsci 14 00867 g006
Figure 7. Geological conditions of Yuanliangshan tunnel.
Applsci 14 00867 g007
Figure 8. Photo of water inrush accident in Yuanliangshan tunnel.
Applsci 14 00867 g008
Figure 9. Implementation process of predicting water inrush in Yuanliangshan tunnel.
Applsci 14 00867 g009
Table 1. Classification of evaluating indicators of water inrush.
Grade IndicatorIVIIIIII
Stratigraphic lithologyLimestone, marbleDolomitic limestone, argillaceous limestone, calcareous dolomite, dolomiteArgillaceous limestone, argillaceous dolomite, argillaceous limestoneSandstone, shale, mudstone
Inadequate geologyStrong disaster causing (core of fold)Moderately disaster inducing (wing of fold)Weakly disaster inducing (monoclinic)none (feeble)
Rock dip angle (°)25–6510–25/65–8080–900–10
Negative terrain area ratio (%)>6040–6020–400–20
Surrounding rock gradeV or VIIVIIII or II
Hydrodynamic zonationHorizontal runoff zone, saturation zoneSeasonal variation zone, alternating zoneDeep circulation zoneVertical infiltration zone
Table 2. Hazard level of water inrush in water-rich tunnels.
level of Water InrushHazard Manifestation
IThe water inrush of the tunnel is less than 1000 m3/d or the mud inrush is less than 500 m3
IIThe water inrush of the tunnel is higher than 1000 m3/d and less than 3000 m3/d
or the mud inrush is higher than 500 m3 and less than 1000 m3
IIIThe water inrush of the tunnel is higher than 3000 m3/d and less than 10,000 m3/d
or the mud inrush is higher than 1000 m3 and less than 2000 m3
IVThe water inrush of the tunnel is higher than 10,000 m3/d
or the mud inrush is higher than 2000 m3
Table 3. Partial cases.
Accident SectionData ProcessingStratigraphic LithologyInadequate GeologyRock Dip Angle (°)Negative Terrain Area Ratio (%)Surrounding Rock GradeHydrodynamic ZonationAmount of Water Inrush
Section 1Original dataStrong karst layerHighly disaster inducing10–16Catchment area 7.5 km2IVPressure saturation zone108,000 m3/d
Numerization441380344
standardization110.150.840.6714
Section 2Original dataLimestone dominatedHighly disaster inducing30–60Catchment area 6.5–9.1 km2saturation zone313,000 m3/d
Numerization44458044
standardization110.520.840.6714
Table 4. Related geological situation of Yuanliangshan tunnel.
Accident SectionStratigraphic LithologyInadequate GeologyRock Dip Angle (°)Negative Terrain Area RatioSurrounding Rock GradeHydrodynamic ZonationAmount of Water Inrush
Section 1LimestoneLarge karst pipe,
synclinal wing
30VDeep circulation zone25,992 m3/d
Section 2LimestoneSynclinal wing,
karst cave
25VDeep circulation zone20,640 m3/d
Section 3LimestoneSynclinal wing,
karst cave
38–47Catchment area 110 km2V72,000 m3/d
Section 4LimestoneSynclinal wing35VDeep circulation zone2400 m3/d
Section 5DolomiteAnticlinal wingV7992 m3/d
Table 5. Preprocessed data.
Accident SectionStratigraphic LithologyInadequate GeologyRock Dip AngleNegative Terrain Area RatioSurrounding Rock GradeHydrodynamic Zonation
Section 10.80.9−0.70.11.55−1.81
Section 20.80.9−0.960.11.55−1.81
Section 30.80.9−0.051.551.550.76
Section 40.8−0.29−0.44−0.321.55−1.81
Section 5−0.34−0.29−0.090.291.55−0.53
Table 6. Comparison between the actual hazard level and the predicted hazard level.
Accident SectionActual Hazard GradesPredicted Hazard GradesComparison between Predicted Results and Actual Results
Section 144Consistent
Section 244Consistent
Section 344Consistent
Section 424Inconsistent
Section 533Consistent
Disclaimer/Publisher’s Note: The statements, opinions and data contained in all publications are solely those of the individual author(s) and contributor(s) and not of MDPI and/or the editor(s). MDPI and/or the editor(s) disclaim responsibility for any injury to people or property resulting from any ideas, methods, instructions or products referred to in the content.

