1. Introduction
Manufacturing organizations need to ensure the optimization of their supply chain and urban logistics operations in order to help manufacturers reduce their transportation costs; avoid congestion and delays; improve their supply chain performance; and, therefore, contribute to improving manufacturing processes by adopting sustainable practices and achieving their goals effectively. The industrial supply chain includes the last-mile transportation process, which represents 20% of the overall supply chain cost, as shown in
Figure 1. This phase often presents challenges such as cost management, delivery delays, urban congestion, and route optimization.
Urban logistics have a significant impact on the economy, urban growth, and social and environmental problems, involving various stakeholders such as shippers (manufacturers, wholesalers, and retailers) and carriers (shipping companies, warehouse companies), managers (national, state, provincial, and city levels), and residents [
1]. Moreover, urban logistics is the art of efficiently transporting flows of products to urban areas. The products involved are of all kinds and concern not only businesses that produce products or services but also retailers, construction sites, and deliveries made by residents of the urban area. The analysis of urban logistics is therefore very complex as it involves many actors including transporters, businesses, and local authorities. Adding to that is the growing availability and volume of data in the manufacturing industry, which have drawn attention to the study of machine learning (ML) concepts that can help to effectively process and analyze the data. ML and Deep Learning (DL) techniques have been used in the manufacturing sector. In fact, classification ML algorithms can be used in urban logistics to categorize different types of products and make decisions about their transportation, delivery, and categorization. These intelligent systems have the potential to support effective decision-making and optimize manufacturing processes. ML stands as a distinct domain within Artificial Intelligence (AI), focusing on the creation of algorithms and statistical models. These models enable computers to learn from experiences, facilitating accurate predictions of future events. ML broadly falls into two categories: supervised learning and unsupervised learning. Its versatile applications span across various fields; for instance, the categorization of objects into predefined groups, a well-explored aspect in ML, is widely employed in manufacturing. The ML field, containing DL, which specifically focuses on neural networks, has shown great potential for improving fields classification. There are a variety of fields applications, including health, education, wireless sensor networks, finance, natural language processing, computer vision, recommendation systems, fraud detection, and medical diagnosis.
Figure 1.
Supply chain [
2].
Figure 1.
Supply chain [
2].
The classification of last-mile flows is a crucial step allowing for efficient mutualization of the delivery, efficient planning and scheduling, and a financial gain. For this purpose, the use of MLP neural networks will be able to meet and guarantee these objectives. This can reduce operational costs, increase efficiency, and speed up delivery times, which is essential in a growing e-commerce environment.
More specifically, the main contributions of this paper are as follows:
Development of an ensemble classification approach using multiple ML models and MLP models as well as automation of last-mile logistics processes.
Improvement of delivery times and supply chain sustainability by optimizing products flows in the city.
The paper emphasizes the significance of classifying last-mile flows for mutualizing delivery, efficient planning, scheduling, and financial gains. MLP neural networks play a crucial role in meeting these objectives, reducing operational costs, improving efficiency, and accelerating delivery times. Besides, the paper includes the development of an ensemble classification approach using multiple ML models and MLP models, alongside the automation of last-mile logistics processes. These contributions aim to enhance delivery times and supply chain sustainability by optimizing product flows within the city.
Utilizing the developed model extends its application to diverse scenarios, showcasing its versatility and effectiveness. One prominent application involves the categorization of financial transactions, providing a streamlined approach to accounting processes and delivering comprehensive insights into expenditure patterns. The model’s adaptability further proves valuable in the realm of business strategies, where it can be employed to categorize products based on regional preferences. This enables businesses to tailor their product offerings to specific markets, enhancing market responsiveness. Additionally, the model finds relevance in the digital landscape by contributing to content categorization in online platforms. Whether applied to articles, blogs, or multimedia, the model facilitates efficient organization and categorization, ultimately improving user accessibility to relevant information across various online channels.
The subsequent sections of the paper are structured as follows:
Section 2 introduces related work.
Section 3 provides an in-depth overview of our proposed method’s system.
Section 4 delves into the findings and evaluation of the proposed method. In conclusion,
Section 5 summarizes and concludes the paper.
2. Related Work
2.1. Medical Domain Classification
In their 2021 work, Azad et al. [
3] introduced an innovative ensemble classification technique, leveraging the Multilayer Perceptron (MLP) neural network for the purpose of diagnosing breast cancer. The emphasis on early detection in breast cancer is pivotal for ensuring prolonged survival. The outcomes of their predictions showcase promising results, achieving an accuracy rate of 98.74% when applied to the Breast Cancer Wisconsin dataset.
In their 2019 study, Alarsan and Younes [
4] aimed to introduce a machine-learning-based methodology for classifying electrocardiogram signals, which measure the heart’s electrical activity, to effectively address irregularities in these signals. This is particularly crucial for detecting the patient’s health status. The proposed approach utilized classification algorithms including Decision Trees (DT), Random Forests (RF), and Gradient-Boosted Trees (GBT). Initially, the signals were classified into two classes: normal and abnormal—and subsequently into four classes. The approach demonstrated notable performance, achieving an overall accuracy of 96.75% with the GBT algorithm and 97.98% with Random Forest for binary classification. In the context of multiclass classification, the approach attained an accuracy of 98.03% using the Random Forest algorithm.
Hassan et al. (2022) [
5] introduced a novel, multiclass classification approach for timely cardiovascular autonomic neuropathy (CAN) detection with an AUC score of 0.931.
Sultana (2018) [
6] conducted a study to identify and classify cancer patients as high or low risk using various classifiers such as the Simple Logistic Regression (LR) method, MLP, RF, and DT. Simple LR yielded a maximum classification accuracy of 97.18%.
In their 2022 study, Cui et al. [
7] introduced a data mining methodology called MLP-TLBO, which combines MLP with Teaching-Learning-Based Optimization (TLBO) for breast cancer diagnosis. The study compared the performance of this proposed method with other existing approaches across three datasets. The majority of the comparative analyses consistently showed the superiority of the proposed MLP-TLBO method, as evidenced by the obtained results.
Obaid et al. (2018) [
8] compared the performance of three ML algorithms such as Support Vector Machine (SVM), K-Nearest Neighbors (KNN), and DT to detect which classifier works better in distinguishing malignant and benign tumors. The results of this study found SVM to offer the highest accuracy of 98.1% on the WBCD dataset.
The medical industry now relies on technology to predict, analyze, and store medical information through images. The work of Muthuselvan et al. (2019) [
9] focused on the use of ML algorithms to classify liver patients using a liver patient dataset. The highest accuracy with nominal execution time taken was obtained by the RT algorithm.
2.2. Network Traffic Classification
Boyko et al. (2020) [
10] crafted an application aimed at categorizing network traffic through a neural network approach, responding to the surge in Distributed Denial of Service attacks on internet-connected devices. The application incorporated two distinct neural network topologies, each developed using Stochastic Gradient Descent (SGD) and Adam optimizers. The outcomes demonstrated a remarkable classification accuracy of 99%.
The adoption of Virtual Private Networks (VPNs) has witnessed a significant upswing in popularity. Presently, the market offers a myriad of VPN services, surpassing previous availability, and a substantial portion of these services boast user-friendly setups. Unfortunately, this ease of use has created a need for businesses to identify whether incoming network connections are from original IP addresses or if they are being routed through a VPN. An MLP was conducted to learn the typical patterns of VPN and non-VPN traffic, ultimately creating a model capable of distinguishing between the two in real time. The result was an accuracy rating of 91.6996% [
11].
Zewairi et al. (2017) [
12] illustrated a DL approach for a network intrusion detection system. The proposed classifier outperformed other ML models in the literature with 98.99% accuracy.
Jonathan et al. (2021) [
13] developed two approaches to network traffic classification using ML methods: one with feature selection and one without. The results indicate that classification without features has an average accuracy of 94.14%, while the method with feature selection has an accuracy of 95.61%.
Parsaei et al. (2017) [
14] highlighted that accurate traffic classification using Software-Defined Networking (SDN) is crucial for various other network operations, including security monitoring, accounting, Quality of Service (QoS), and long-term provisioning forecasts. This study employed four variations of Neural Network estimators to classify traffic. The findings revealed that the Naive Bayes (NB) model attained the highest accuracy, reaching 97.6%.
In the face of an increasing number of potential network attacks, traditional Intrusion Detection Systems face challenges in effectively handling these threats. Thus, Churcher et al. (2021) [
15] introduced several ML methods, including KNN, SVM, DT, NB, RF, and the Artificial Neural Network (ANN). The performance of these ML algorithms was evaluated on the Bot-IoT dataset for both binary and multiclass classification. Notably, RF demonstrated superior performance in binary classification across all attack types. However, for multiclass classification, KNN outperformed other ML algorithms, achieving an accuracy of 99%, which is 4% higher than that of RF.
2.3. Online Game Classification
Tsaur et al. (2022) [
16] investigated detecting game bots in a mobile online game by using MLP neural networks. The results demonstrated that the proposed approach achieves a higher accuracy of 99.894% compared to the widely used RF algorithm.
2.4. Electric Domain Classification
Shanmughasundaram et al. (2020) [
17] conducted a study on a technique for identifying and categorizing notable faults in lithium-ion batteries utilized in electric vehicles. The proposed method employs an MLP, which outperforms other methods in terms of efficiency and accuracy. This method proves that the MLP is highly versatile and efficient in this domain. The proposed method was able to achieve a classification accuracy of 98.633%.
Kalboussi et al. (2023) [
18] addressed the growing demand for electricity through smart grid technology, employing ML—especially MLP neural networks—for efficient energy distribution. MLP outperformed other algorithms with a high R-squared of 0.998866 and a low RMSE of 44.228105.
2.5. Finance Domain Classification
ANNs have demonstrated effectiveness in accurately detecting credit card fraud transactions with high precision and minimal cost. To enhance the accuracy of the detection process, an MLP was introduced. The results demonstrated that the proposed model is efficient and achieves an accuracy of 85.13% [
19]. Megdad et al. (2022) [
20] compared various ML algorithms to efficiently predict the legitimacy of financial transactions. The RF was the best classifier for unbalanced datasets. However, for balanced datasets, the bagging classifier outperformed the others with an accuracy of 99.96%.
2.6. Text Classification
Tadesse et al. (2019) [
21] aimed to identify depression attitudes among relevant online users by analyzing their Reddit posts using Natural Language Processing (NLP) techniques and machine learning approaches. The MLP classifier using the combined features yielded the best performance with a 91% accuracy rate. Neghabadi et al. (2019) [
22] utilized bibliometric analysis and a systematic literature review to survey over 370 papers published since 2010. The aim was to categorize the literature into six research categories based on keywords-based classifiers that were introduced as follows: definition and perimeters, policy, innovative solutions, sustainability, methods, and stakeholders.
2.7. Education Domain Classification
ML models are used to extract valuable insights from educational databases and predict student academic performance. An MLP was conducted in order to improve student performance classification accuracy and take appropriate remedial actions in the educational system. The classification accuracy amounted to 79.30% [
23].
2.8. E-Commerce Domain Classification
One article introduced a novel approach—Learning to Accept Classes (L2AC), a meta-learning-based OWL approach—and an experimental demonstration of its effectiveness in e-commerce product classification. L2AC outperforms existing methods by simultaneously addressing the rejection of unseen examples and incrementally incorporating new classes, providing an integrated solution for OWL [
24].
Akritidis et al. [
25] proposed a supervised learning method for automatic product categorization in e-commerce, employing morphological analysis of product titles and assigning importance scores to tokens. A dimensionality reduction technique was proposed to address scalability issues. Evaluation on a real-world dataset demonstrated over 95% classification accuracy. Future work includes testing the model on large-scale data and assessing its efficiency in practical scenarios.
One article presented a large-scale e-commerce product categorization system using deep neural models. It addresses challenges such as sparse data distribution and diverse text lengths, proposing a solution with deep belief nets and deep autoencoders. The system achieved 81% accuracy in matching predictions with merchant-assigned categories. Future work was suggested to explore the impact of incorporating image data on system performance [
26].
Gupta et al. [
27] proposed a two-level approach for product classification in e-commerce. It utilizes a set of classifiers for path-wise, node-wise, and depth-wise labels in the taxonomy hierarchy, aiming to enhance classification accuracy. By considering the hierarchical structure, the method captures the specificity of product placement. The ensemble technique demonstrated improved results compared with previous approaches, showcasing the effectiveness of this comprehensive two-level strategy in leveraging taxonomy information for enhanced product classification.
2.9. Optimizing Logistics: A Focus on Classification and Last-Mile Efficiency
We found recent relevant articles on logistics in which ML techniques were used to solve many problems related to classification. One study [
28] focused on addressing road accidents in logistics transportation caused by careless driver behavior. It introduced an autonomous system based on a convolutional neural network to recognize and classify various risky driving positions. The proposed model achieved an impressive 98.98% accuracy when evaluated against the State Farm Distracted Driver Database, outperforming other algorithms with different descriptors and classification techniques. The authors explored the optimization of last-mile logistics using machine learning approaches. Their study involved a bibliometric analysis and a critical review to highlight key issues, utilized algorithms, and case studies in the field (Kalboussi et al., 2023) [
29].
Another study pioneered a hybrid approach, fusing Reinforcement Learning and rule-based agent models for microlevel traffic flow optimization. Agents adapt decisions based on local sensors, departing from traditional system-level methods. The innovation extends applicability beyond traffic to logistics and general transport, demonstrating efficacy through agent-based modeling [
30].
The study of Qu and Li (2022) [
31] presented an efficient e-commerce logistics path optimization algorithm using NSGA-II and an enhanced genetic algorithm. Integration of an ant colony algorithm achieved a 6.6% reduction in route length, demonstrating substantial time savings in e-commerce logistics distribution.
One study (Dossou and Vermersch, 2021) [
32] addressed urban traffic congestion issues by proposing sustainable alternatives to road transportation through a co-creation methodology involving local authorities, companies, and citizens. The paper introduced a decision-aided simulation tool architecture for optimizing these alternative solutions and emphasized the collaboration of stakeholders in developing sustainable urban transportation strategies.
Another prior study introduced a Convolutional Neural Network–Gated Recurrent Units (CNN-GRU) combined model for predicting railway logistics traffic speed, leveraging both spatial and temporal features. The experiment demonstrated superior accuracy compared to individual GRU and CNN models. The prediction results were further utilized in a multiobjective optimization model for efficient train route planning [
33].
The study of Salais-Fierro and Martínez (2022) [
34] emphasized the crucial role of the Transportation Management System (TMS) and data analysis techniques, including machine learning and data mining, in enhancing logistics distribution performance. The proposed methodology compares three prediction methods, highlighting the effectiveness of the Artificial Neural Network (ANN) in achieving more accurate results for freight transport demand forecasting.
Servos et al. (2020) [
35] focused on enhancing freight transport efficiency through accurate travel time prediction using ML algorithms like ExtraTrees, AdaBoost, and SVR. The study utilized real-world multimodal container transport data and found SVR to achieve the highest prediction accuracy compared to other models, outperforming average-based approaches with a mean absolute error of 17 h for transport times up to 30 days.
One study addressed the sustainable development of road freight transport by proposing a supervised ML model with intelligent classification algorithms and key performance indicators. SVR demonstrated the highest accuracy (98%) among various algorithms, enabling the establishment of sustainability levels. The model was applied to a European road freight company, facilitating the formulation of green strategies for sustainable development (Taylor et al., 2021) [
36].
In recent decades, various techniques based on ML and DL have been widely used in the classification and prediction problems of many fields, particularly education, traffic network, finance, NLP, and medical diagnosis.
Table 1 summarizes the related works and presents an overview of the AI approaches utilized to enhance the efficiency of various intriguing domains. In this regard, in this paper, we propose a classification model of product flows by category delivered in the city in order to optimize the whole supply chain of industries. Indeed, we define a model based on MLP, which aims to optimize products flows in the city. However, the capabilities of ML approaches such as KNN, SVM, DT, and RF are analyzed and compared to MLP.
Our research significantly stands out from existing articles, highlighting innovative aspects often lacking in these works. In contrast to an excessive focus on mere product classification, our article distinguishes itself by emphasizing the optimization of last-mile delivery processes, aiming to reduce transportation costs and prevent delays. Furthermore, instead of delving into technical aspects without tangible connections to sustainable benefits, our research clearly demonstrates its impact on urban sustainable development. Finally, where other articles might lack a thorough comparative analysis, ours stands out by providing a direct evaluation of performance between the multilayer neural network model and traditional machine learning models. In summary, our article’s unique features include a focus on last-mile process optimization, a demonstration of its impact on sustainable development, and a comprehensive comparative performance analysis, setting it apart from other mentioned articles.
3. Proposed Method
In this study, we focus on optimizing industries’ supply chain, particularly the last-mile transportation process. The classification of products is an essential element in supply chain management. It helps industries to optimize their inventory management, logistics operations, demand forecasting, and supply chain visibility, leading to improved efficiency and cost savings.
In this paper, our work will be presented in four parts as follows:
Collecting and preprocessing the data.
Splitting the dataset into training and testing data.
Building and training models: MLP and ML techniques for products flows classification.
Evaluating models using various metrics.
Figure 2 illustrates the overall architecture of the proposed product flows classification.
As demonstrated in the preceding figure, the initial phase involves the acquisition of data from diverse stakeholders. In the subsequent step, the data undergo preprocessing, involving transformations and standardization, to optimize its format for model learning. Following preprocessing, the data are input into a neural network to construct a model, necessitating decisions on the architecture including the number of layers, neural units, initialization functions, and activation functions for each layer. Additionally, specifications for the overall model, such as the choice of loss function, optimizer, and metrics, are determined. Concurrently, the preprocessed data are utilized in machine learning models for a comparative analysis of results with those obtained from the MLP. Hence, we present four ML models and the MLP network in this study.
3.1. Data Collection
The first phase of our work consists of compiling as much information as possible from different stakeholders in order to have the most accurate view of daily deliveries in the pedestrian plateau. We began with a merchant audit that identified the transporters involved in delivery on the plateau; then, we met them to identify their practices. In parallel to these two audits, data were recompiled to achieve a better mapping of user flows. Finally, the data are stored in a relational database. The relational database is the most popular choice of database worldwide. In a relational database, data are stored in tables, which are related to each other through primary and foreign keys. These tables, which are transporters, merchants, products, zones, categories, and deliveries, can be accessed and manipulated using a Structured Query Language (SQL).
3.2. Connecting Relational Database with Python
First, we established a connection to the relational database to access it in Python. After this, we ran a query to the database directly from Python and saved the results to a table. We store the table as a pandas dataframe. Working with dataframes in Python provides a convenient and efficient way to manipulate and analyze tabular data. They are widely used in data analysis and ML applications in Python 3.0 [
37].
3.3. Dataset Description and Preprocessing
The dataset includes 409 records of products. Each record has 7 features: category name, area, company name, transporters name, category identifier, zone identifier, merchant identifier, and transporter identifier—four categorical and four numerical. The original aim of this dataset is to classify products by category, which are presented in
Table 2 below.
Effective data processing is crucial for improving the suitability of a dataset for classification models. Our suggested preprocessing module consists of two vital phases: encoding categorical attributes and normalizing numeric attributes.
In the first phase, categorical variables undergo transformation into numerical representations through the utilization of label encoding. This step is essential to ensure the proper functioning of sklearn functions, as they often require numeric input.
Furthermore, it is important to note that after using LabelEncoder to transform classes into integers, the use of to categorical is generally necessary. After transforming the classes into integers, to categorical converts these integers into a one-hot encoding representation, a format often required by machine learning algorithms to handle multiclass classification tasks. This step is crucial to ensure data compatibility with the requirements of machine learning algorithms when dealing with classification tasks involving multiple classes.
3.4. Model Training
After the preprocessing stage, the dataset was divided into training and testing sets at an 80%:20% ratio to measure model performance. ML models and MLP network were trained on 80% of the data to ensure that the classification algorithm’s training can be generalized well to new data.
3.5. Classification Methods Used
Experiments were carried out on product datasets taken from different stakeholders, which were fed to various classifiers like LR, RF, LR, SVM, and the MLP neural network. Each of these models will be elaborated upon in subsequent sections, providing a more in-depth understanding. The results obtained will be meticulously calculated and assessed based on measures such as Accuracy, Precision, Recall, F-measure, and the time taken to construct the model.
3.5.1. Logistic Regression
To predict product flows effectively within the city, a trained model utilizing multinomial logistic regression was developed, incorporating a ridge estimator [
6]. This approach aims to optimize the last-mile delivery in urban areas, thereby contributing to the overall improvement of logistic processes.
3.5.2. Random Forest
To address the specific challenges of optimizing delivery in urban areas, the Random Forest (RF) model, chosen for its classification and regression capabilities, employs an ensemble learning approach. During training, this model constructs multiple decision trees. In classification, the model generates the mode of the classes, while in regression, it produces the average prediction of individual trees [
4]. The effectiveness of the RF model in our study relies on precise handling of key parameters, such as the number of trees and maximum depth, adjusted using hyperparameter tuning techniques to better adapt to the nuances of product flows in urban environments.
3.5.3. Support Vector Machine
In the specific context of our research, focusing on the optimization of last-mile delivery processes in urban environments, an SVM was developed in the mid-1990s based on statistical learning theory. It has gained popularity as a classifier [
38], especially for binary classification tasks, due to its simplicity and efficiency. However, since many real-world datasets consist of more than two categories, the SVM classifier has been extended to handle multiclass classification problems. This development has made SVM a more versatile classification method that can be applied to a wider range of datasets [
39]. In addressing the unique complexities of urban logistics, our study leverages SVM’s evolved capabilities to contribute to the advancement of sustainable and optimized urban delivery systems, thereby enhancing the overall effectiveness of last-mile delivery in e-commerce platforms.
3.5.4. K-Nearest Neighbors
In the context of our study on optimizing last-mile delivery processes in urban environments, the KNN is a generalization algorithm for nearest neighbor rules. The output of KNN is the class label that appears most frequently among the K nearest neighbors. Unlike the basic nearest neighbor rule, which only considers the closest neighbor, the KNN algorithm expands the search to K neighbors in the decision-making phase. This extension allows the algorithm to utilize more information from the surrounding data points, resulting in better classification accuracy [
40].
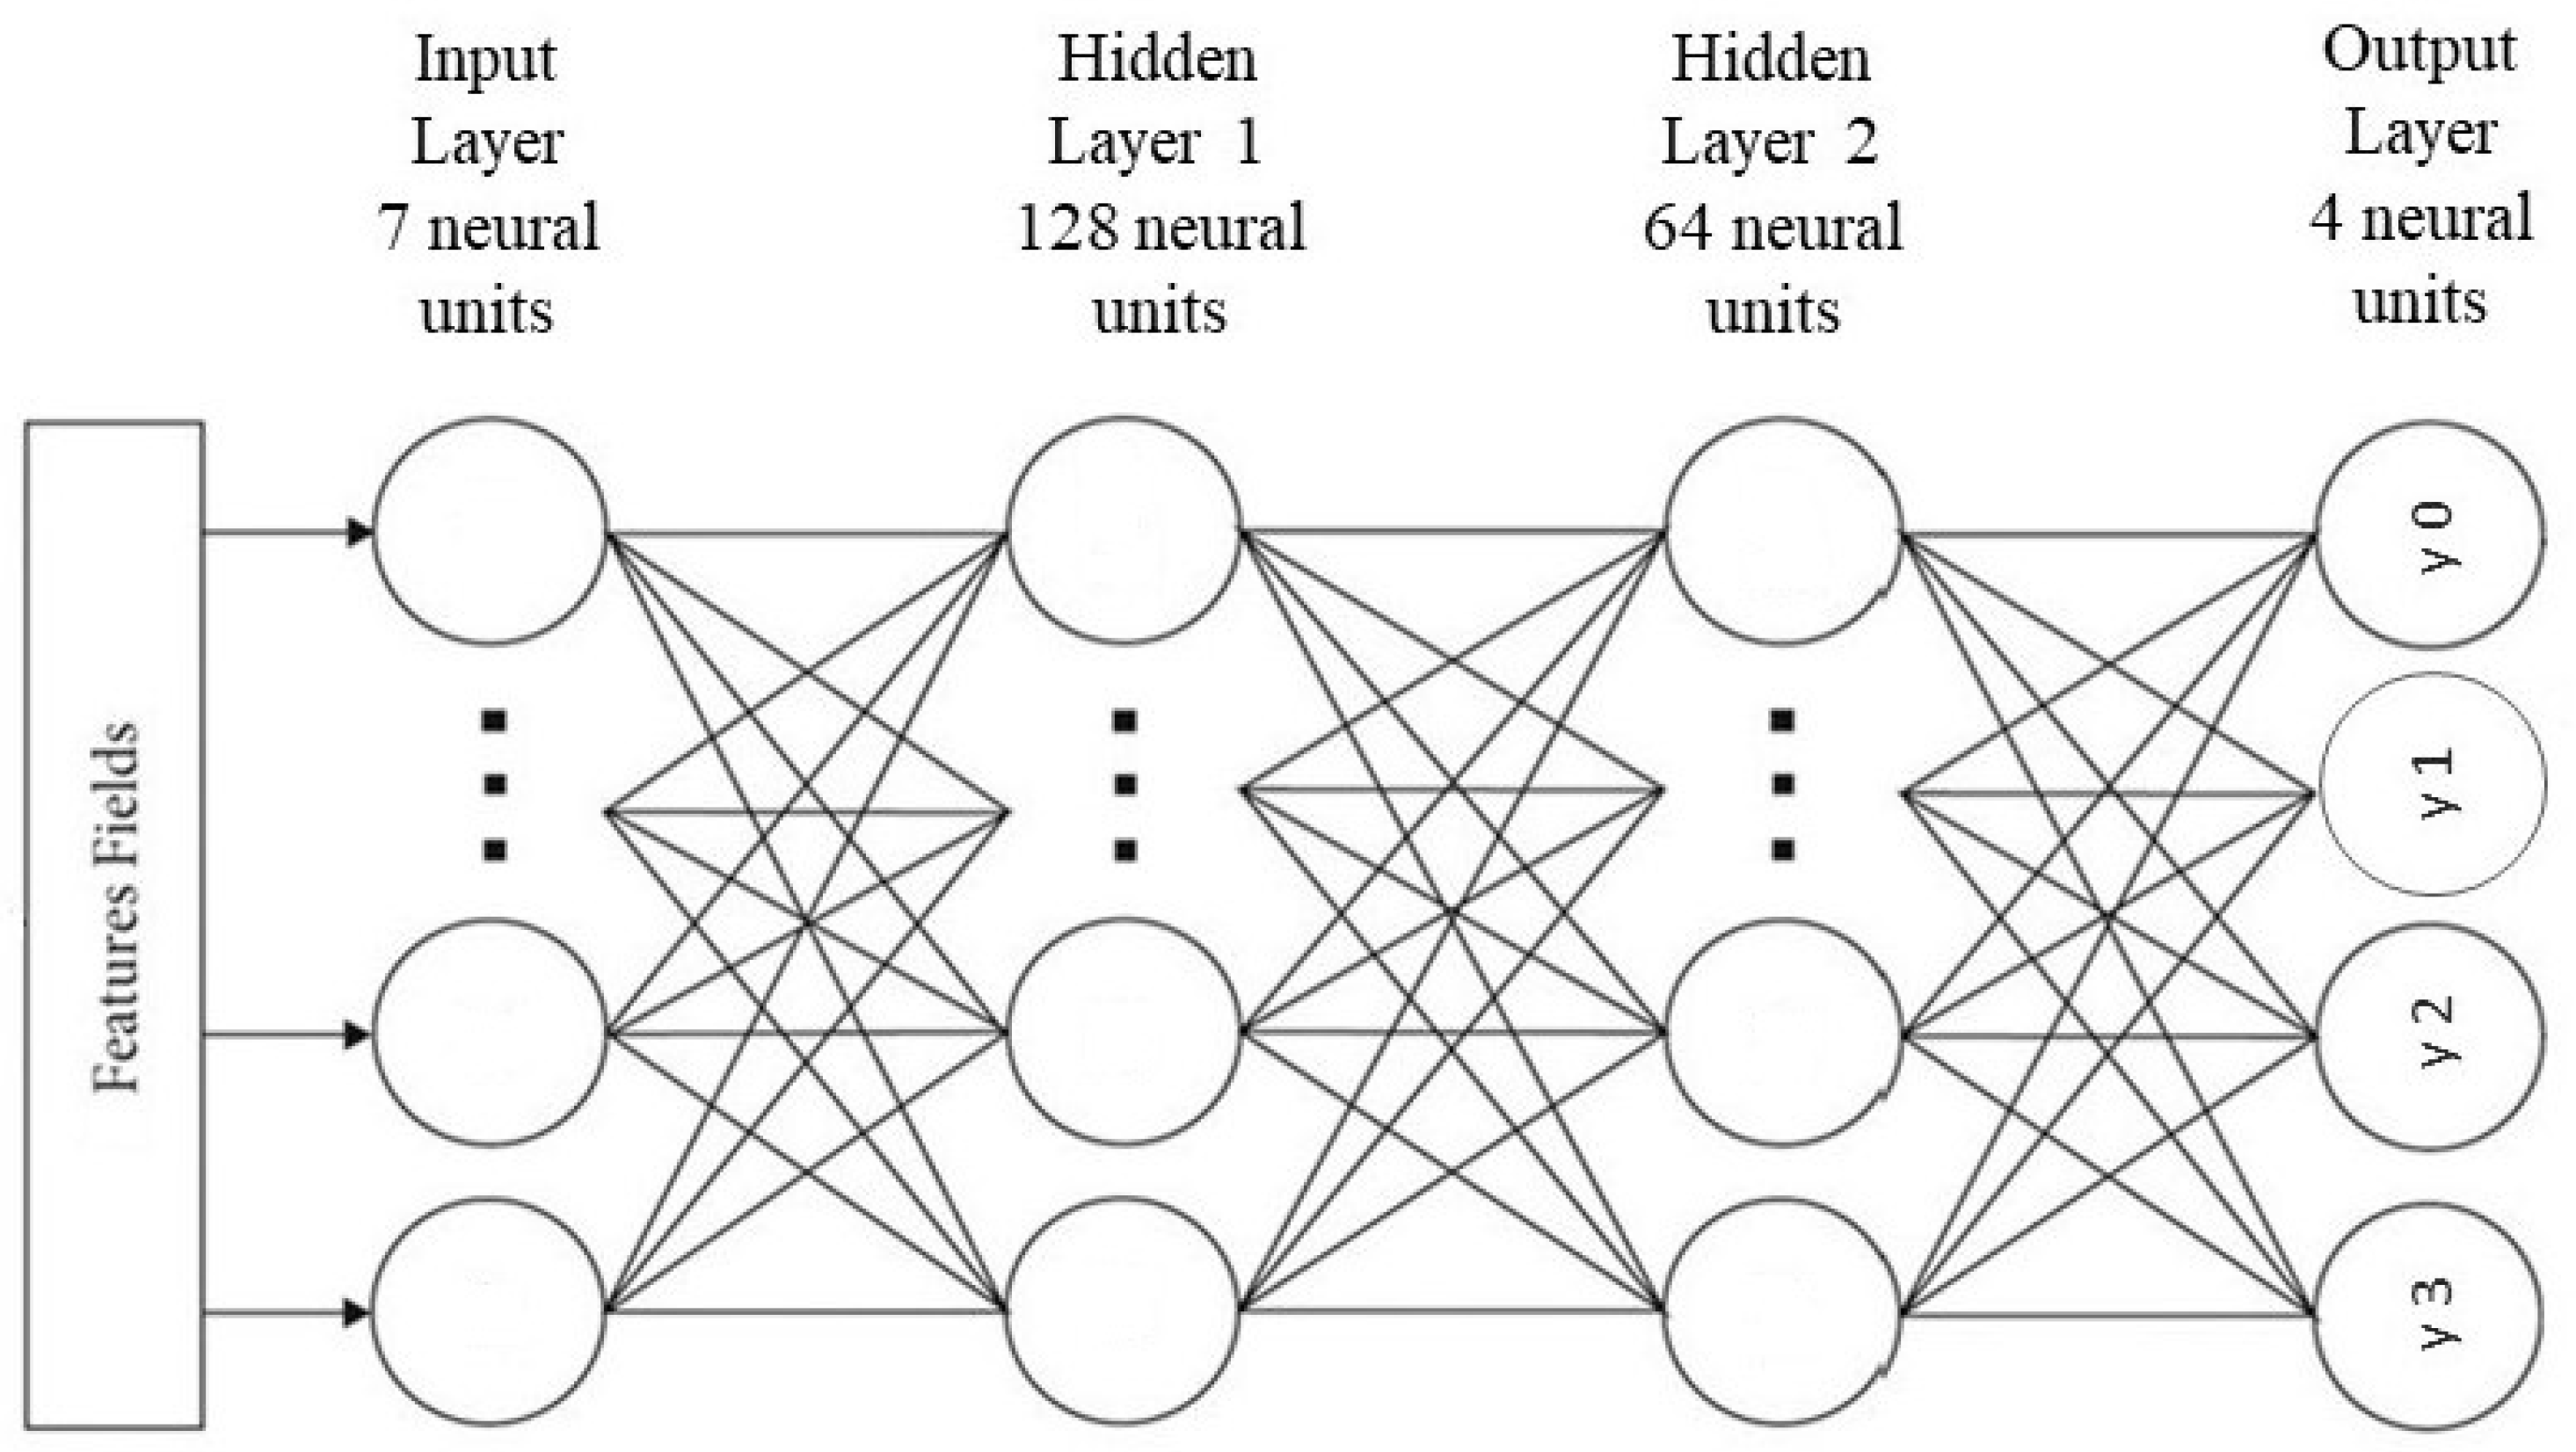
3.5.5. Multilayer Perceptron Neural Network
In the context of our research on enhancing last-mile delivery efficiency, the Multilayer Perceptron (MLP) stands out as a pivotal tool. As a feed-forward neural network designed for supervised learning applications, MLP tackles both classification and regression challenges, aligning seamlessly with our goal of optimizing product flows in urban settings [
41]. Comprising a minimum of three layers—namely, input, hidden, and output—MLP’s input and output layer nodes are determined by the dataset’s features and classes. Configuration specifications include the number of hidden layers, nodes allocated to each hidden layer, learning epochs, and the chosen weight learning technique. Within this architecture, hidden layer nodes receive signals from input nodes through weighted connections, applying their output activation function before transmitting data to the output layer nodes. The backpropagation algorithm, widely embraced in MLP training [
42], follows a methodical approach. It involves presenting each training sample, computing the output in a forward step, and subsequently determining the squared error by assessing the distinction between predicted and actual outputs. The mean squared error serves as a prevalent metric for gauging error in MLP. Notably, an epoch denotes a complete cycle through the entire training dataset, requiring multiple iterations for robust MLP training. To provide visual clarity,
Figure 2 portrays the intricacies of the proposed MLP neural network architecture designed specifically for product classification.
3.6. Evaluation Metrics
To assess and compare the performance of distinct models, the following evaluation metrics were employed: accuracy, precision, recall, F1 score, and error rate. In these metrics, FN represents false negatives, FP denotes false positives, TN signifies true negatives, and TP corresponds to true positives.
4. Results and Discussion
In this section, we provide the outcomes of our experiments with various MLP neural network models utilizing the same dataset. We conduct a comparative analysis of these MLP models to identify the optimal one by assessing their performance on the same dataset. Our evaluation of experimental results encompasses six metrics: accuracy, error rate, precision, recall, F1 score, and total training time. Noteworthy distinctions among the models include variations in the number of epochs and batch size. To enhance accuracy or diminish the error rate, we considered increasing the number of epochs, indicating additional training periods for improvement. However, careful attention must be given to another variable, namely, batch size. Neglecting this variable may result in increased training time; decreased accuracy; and, consequently, elevated error rates. Drawing insights from existing literature, we opted for categorical cross-entropy loss, RMSprop optimizer, and ReLu activation. The experimental determination of the number of hidden layers and neurons was executed empirically, with a fixed choice of two hidden layers due to the dataset’s limited attributes. Detailed experimental results are outlined in
Table 3.
Table 4 provides a clear picture on the performance comparisons among these three different MLP models. The optimal numbers of neurons in the hidden layers are 128 and 64. The topology of the best MLP neural network is presented in
Figure 3.
Our analysis indicates that all four MLP neural network models demonstrate comparable performance in the experimental results. Notably, Model 1 achieves the highest accuracy, precision, recall, F1 score, and the lowest error rate. Model 1 exhibits an outstanding accuracy of 97.56%, and its F1 score, representing a balance of precision and recall, is also notably high at 97.17%. Precision, highlighting the impact of false positives against true positives, and recall, reflecting false negatives, both excel in Model 1, with precision being relatively higher than recall. The model’s training time on a system with 8 GB of RAM and a clock speed of 1.80 GHz is 10.07 s. While MLP 2 and MLP 3 exhibit shorter build times, their classification accuracy falls short of that achieved by MLP 1. Consequently, Model 1 stands out as the superior MLP neural network in this evaluation.
Now, we present the performance of the model via the evolution of the classification accuracy and the loss function of this model during training. These results are plotted throughout the training and testing phases of the neural network, which are shown in
Figure 4 below.
Figure 4 above shows that the curves follow each other and reach an accuracy of 97.56% in the test phase and at the end of the training phase. Thus, the function of the loss function decreases relatively during the epochs until it almost reaches the value 13.83%.
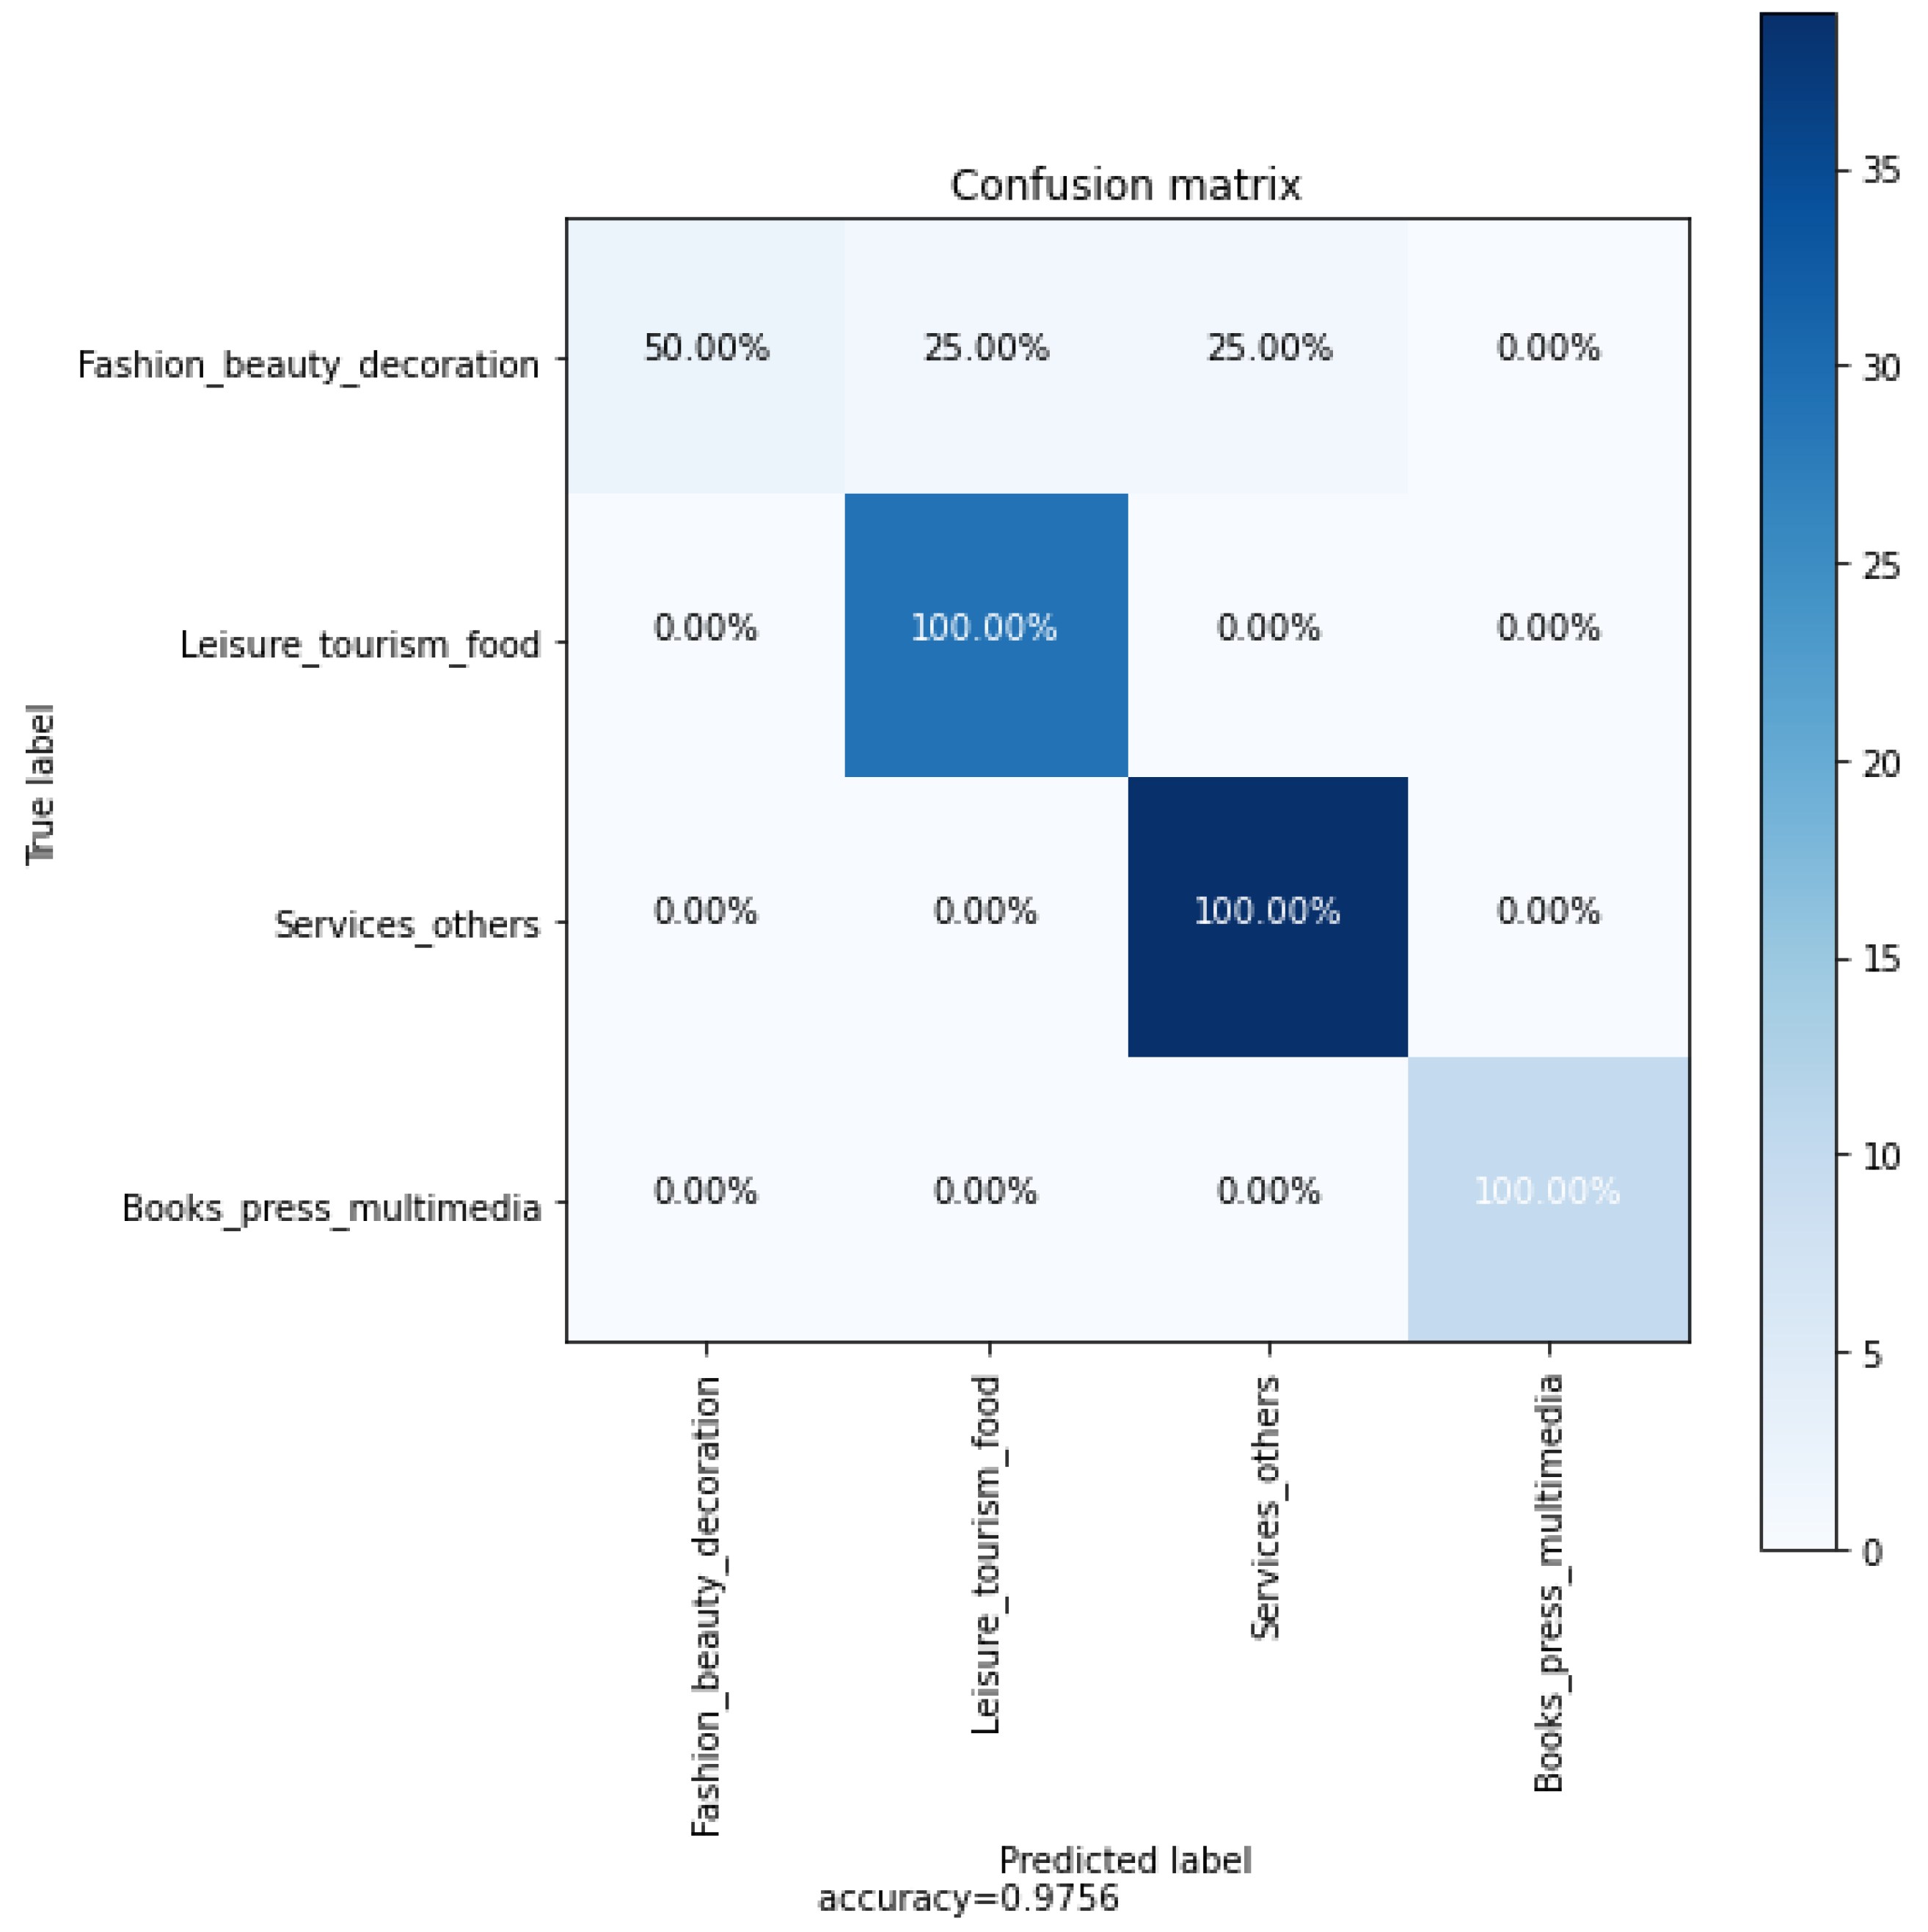
Figure 5 below presents the confusion matrix for the four classes on the test database. It presents a breakdown of instances that were classified correctly and those that were not, categorizing them into true positives, true negatives, false positives, and false negatives. The aim is to minimize the occurrences of false positives and false negatives.
The outcomes indicate that the model attained the highest level of accuracy for the Leisure, tourism, and food class; the Services and others class; and the Books, press, and multimedia class with 100%, followed by the Fashion, beauty, and decoration class with 50%. The confusion matrix shows that category 1 (fashion, beauty, and decoration) was incorrectly classified as category 2 (leisure, tourism, and food), resulting 25% of accuracy. Category 1 being incorrectly classified as category 3 (services and others) formed 25% of accuracy. The MLP may predict incorrectly and confuse category 1 with category 2 and category 3. The similarity between categories can stem from various sources. Some possible reasons for the observed similarity between categories 1, 2, and 3 include shared characteristics, making it challenging for the model to differentiate between them as it struggles to identify distinct patterns. Additionally, limited data size during training can also be a factor, as a dataset with restricted size may not fully represent the variability of the data, hindering the model’s ability to generalize effectively.
This study employs various machine learning classifiers distinct from MLP neural networks. The experimentation involves training the dataset on diverse classifiers, followed by validation using test data, and the subsequent analysis of results. The outcomes are assessed based on the following metrics: accuracy, error rate, precision, recall, and F1 score.
Table 5 provides a thorough examination of the outcomes obtained from the products dataset using various machine learning classifiers. The results focus on accuracy, where KNN, configured with k = 4, exhibits the highest classification accuracy at 95.12% followed by RF with n estimators = 30 at 93.9%, LR at 92.68%, and SVM with a linear kernel at 93.9%. The analysis extends to error rates, precision, recall, and F1 score, outlined comprehensively in
Table 5. Notably, KNN stands out in its accurate categorization of products, even though its accuracy slightly lags behind that of the MLP neural network.
5. Validation and Robustness Testing: Applying Architectures to Predictive Maintenance Dataset
The findings presented in this article are a result of a collaborative project with the city of Metz, focusing on the optimization of goods distribution. The dataset, consisting of 409 real, ungenerated records, was collected as part of this project. Recognizing the limitations of the relatively small dataset, we are exploring the incorporation of an additional database. To assess and validate the robustness of our proposed solutions, we initially introduced and studied the Predictive Maintenance Dataset from
https://www.kaggle.com/datasets/stephanmatzka/predictive-maintenance-dataset-ai4i-2020 (accessed on 30 November 2023). In addition, as the data in this database are very different in shape, size (10,000 records), and content from the database mentioned above, we are considering an alternative database to enhance the comprehensiveness of our analysis. Despite the challenges, the direct application of the employed architectures on the new database has shown promising results, prompting further investigation into larger datasets for a more comprehensive evaluation.
In the course of our analysis, the ML models and the DL model tested have demonstrated commendable performance, underscoring their robustness, as shown in
Table 6. The positive outcomes observed across various metrics highlight the efficacy of the employed algorithms, providing confidence in their ability to handle diverse datasets and real-world scenarios. These results encourage us to continue exploring and refining our models to further elevate their performance in the context of goods distribution optimization.
Moreover, we are in the process of enhancing the efficiency of our database management by integrating automation. This initiative is designed to diminish the considerable time spent on manual data entry.
6. Conclusions
Effective collaboration between the manufacturer, the supply chain partners, and the transport providers is crucial to deliver products on time as well as in appropriate condition and, therefore, to satisfy sustainability in urban areas. Different types of ML and DL approaches are introduced with their applications in the manufacturing sector. The purpose of this study is to classify product flows by category using the MLP neural network and ML approaches in order to improve supply chain operations. To do this, we first collected the dataset of the products; then, by preprocessing the raw data, we listed the comparisons among the proposed three neural networks based on an MLP neural that was trained with different parameters on the same amount of data in this experiment. Results indicate that MLP 1 obtained the best indicators of classification metrics compared with the other MLP neural networks in terms of classification accuracy, precision, recall, F1 score, error rate, and time taken to build the model. The proposed best MLP neural network is compared with ML classifiers, and a better classification effect can be obtained with the MLP neural network. The best MLP reached a classification accuracy of 97.56%. Through comparative techniques, MLP was found to be very efficient when dealing with datasets as in this case. Therefore, the results found confirm the aforementioned statement.
To extend the accomplishment of this work, we plan to further enhance our methodology to more than four categories in order to reduce confusion errors between categories. Additionally, we suggest collecting more data as they help the model to understand the different classes better and minimize confusion. In such a way, we will be able to show that this work can also be applied for the classification of other products.


