Article

Experimental Investigation of Compressive Concrete with Different Immersion Times and Its Stochastic Damage Model

1
School of Civil Engineering, Central South University, Changsha 410075, China
2
Department of Transportation, Shuohuang Railway Development Co., Ltd., China Energy Investment Corporation, Beijing 100080, China
3
National Engineering Research Center of High-Speed Railway Construction Technology, Changsha 410075, China
4
China Railway Group Limited, Beijing 100039, China
5
Engineering Technology Research Center for Prefabricated Construction Industrialization of Hunan Province, Changsha 410075, China
*
Authors to whom correspondence should be addressed.
Appl. Sci. 2024, 14(2), 739; https://doi.org/10.3390/app14020739
Submission received: 4 December 2023 / Revised: 29 December 2023 / Accepted: 8 January 2024 / Published: 15 January 2024
(This article belongs to the Special Issue Durability and Intelligent Evaluation of Concrete Structures)

Abstract

:
Continuous large amounts of precipitation can lead to a rapid increase in the water content of concrete in village building foundations, which can adversely affect the mechanical properties, such as the compressive strength of concrete. There are few experimental studies on the compressive stochastic mechanical properties of concrete in the wet state after considering different soaking times (different water contents and saturations), but there is no corresponding stochastic damage principal structure model. In this study, the mechanical properties of concrete under different immersion times were tested to obtain the mechanical properties of the concrete degradation law, and the random damage intrinsic model of wet concrete was established. The results of this paper were compared with the classical test results from the literature to verify the validity of the model. The results show that the proposed stochastic damage model is able to consider both the effects of the saturation and the damage behavior of wet concrete under compression, which is beneficial to the structural design and maintenance protection of village buildings in areas with abundant precipitation.

1. Introduction

There are many regions in the world with abundant precipitation. For example, Yunnan Province has a daily precipitation exceeding 25 mm for about 20 days in a year, and 10 days is the maximum number of days of continuous precipitation per year. It has been found that a large amount of continuous precipitation and frequent flooding disasters generally lead to the rapid increasing in the water content in the concrete used in the construction of the foundations of common buildings found in local villages, approaching saturation at about 4 days or less. Moreover, the mechanical properties, such as the compressive strength of concrete under static loading, deteriorate with the increase in the water content [1,2]. Therefore, it is necessary to consider the effect of the water content on the mechanical property evolution of concrete foundations [3]. Moreover, the low strength of concrete in village buildings and the large-scale manual mixing are subject to high dispersion in terms of mechanical properties, and further research is needed on the damage mechanisms and overall reliability of village building foundations in rain-fed areas. Furthermore, this will be beneficial for the structural design and maintenance of village buildings in areas with abundant precipitation.
A large number of researchers have carried out experimental studies on the mechanical properties of immersed concrete. Yang et al. [4] investigated the evolution of the water content in concrete specimens in terms of the immersion times and the concrete strength experimentally and analyzed the effect of the water content on the compressive strength of concrete. Zhang et al. [5] analyzed the effect of different immersion times on the strength of concrete foundation pile core samples by studying the mechanical properties of concrete foundation piles in a humid environment. Navaratnarajah Sathiparan et al. [6] observed the effect of moisture on the mechanical properties of bricks, mortar, and masonry. Wang et al. [7] found that, with the increase in the pore water saturation in fly ash concrete, the compressive strength decreased, but the ultrasonic velocity and elastic modulus increased.
Furthermore, some scholars have conducted research on the modeling theory and method for the mechanical properties of immersed concrete. The representative contributions are as follows: Liu et al. [8] quantifiably observed the effect of the porosity on the effective volume and shear modulus of saturated concrete by utilizing a three-phase spherical model and a hollow cylindrical rod model. Tetsuri Kaji et al. [9] investigated the dynamic response of concrete structures affected by the strain rate dependence of concrete material, which is related to the water content and microporous structure. Shen et al. [10] developed a strength–porosity–saturation model based on the strength–porosity model of Ryshkewithh, by considering the effect of the water content and porosity on the compressive strength. Zhang et al. [11] adapted the Hsieh–Ting–Chen four-parameter damage criterion to develop a damage model for concrete based on a simplified uniaxial damage evolution equation. Bai et al. [12] proposed a uniaxial tensile statistical damage model for saturated concrete considering the dynamic strain rate effect and the “effective stress principle” of Taishaji. Chen et al. [13] established an elastoplastic damage model for saturated concrete under uniaxial compression based on damage mechanics.
However, there are few studies in the literature that have reported on experimental investigations of the random mechanical properties of wet concrete under compression considering different immersion times (i.e., water contents or saturation degrees) [4,5,6,7] or stochastic constitutive models of wet concrete [8,9,10,11,12,13] considering both immersion and damage effects.
Therefore, this paper conducts a experimental investigation on the random mechanical properties of wet concrete under uniaxial compression after different immersion times and develops a stochastic damage model of wet concrete considering both immersion and damage effects. The outline of this paper is as follows: the experimental investigation on the random mechanical properties of concrete under uniaxial compression after different immersion times is reported in Section 2 and Section 3; the stochastic damage model of wet concrete under compression is developed in Section 4; and this model is verified by comparing the predicted with the experimental results in the following Section 3.

2. Experimental Procedure

2.1. Raw Materials

The compression strength grade of the concrete prepared in this experiment was C30. The water–cement ratio of the material was W/C = 0.38; the details of the mixture proportions are shown in Table 1. In detail, the cement was P.II 52.5R Portland cement (Asia Cement Holdings Ltd., Nanchang, China), following the Chinese standard GB 175-2007 [14]. The sand was a natural middle-grain sand (Tiancheng Limited, Changsha, China), and the water was tap water. The aggregates were crushed limestone with diameters of approximately 5–20 mm; the mineral admixture was fly ash (FA), and the other admixture material was the slump loss-preventing admixture (SLP) of MH-BT (Beijing Muhu New Material Technology Co., Beijing, China). The physical properties of Portland cement and pelletized sand are presented in Table 2 and Table 3, respectively.

2.2. Specimen Preparation

A total of 3 cubic specimens with a length of 150 mm and 25 prismatic specimens with dimensions of 100 × 100 × 300 mm3 were cast using the above concrete material. The cubic specimens were cured using the standard method [15], while the prismatic specimens were naturally cured by keeping them wet under plastic sheeting for 28 days. After the curing, the prismatic specimens were categorized into 5 groups; each group of specimens was immersed (or not) in the tap water as follows (see Table 4). Group A was dried in the air on an indoor ground for 28 days; Group B was dried in the air on an indoor ground for 28 days and then baked at 50 ± 2 °C for 48 h in an electric oven; and Groups C, D, and E were dried in the air on an indoor ground for 28 days and then immersed in tap water for 6 h, 12 h, and 24 h and wrapped with plastic films to maintain their moisture contents, respectively.

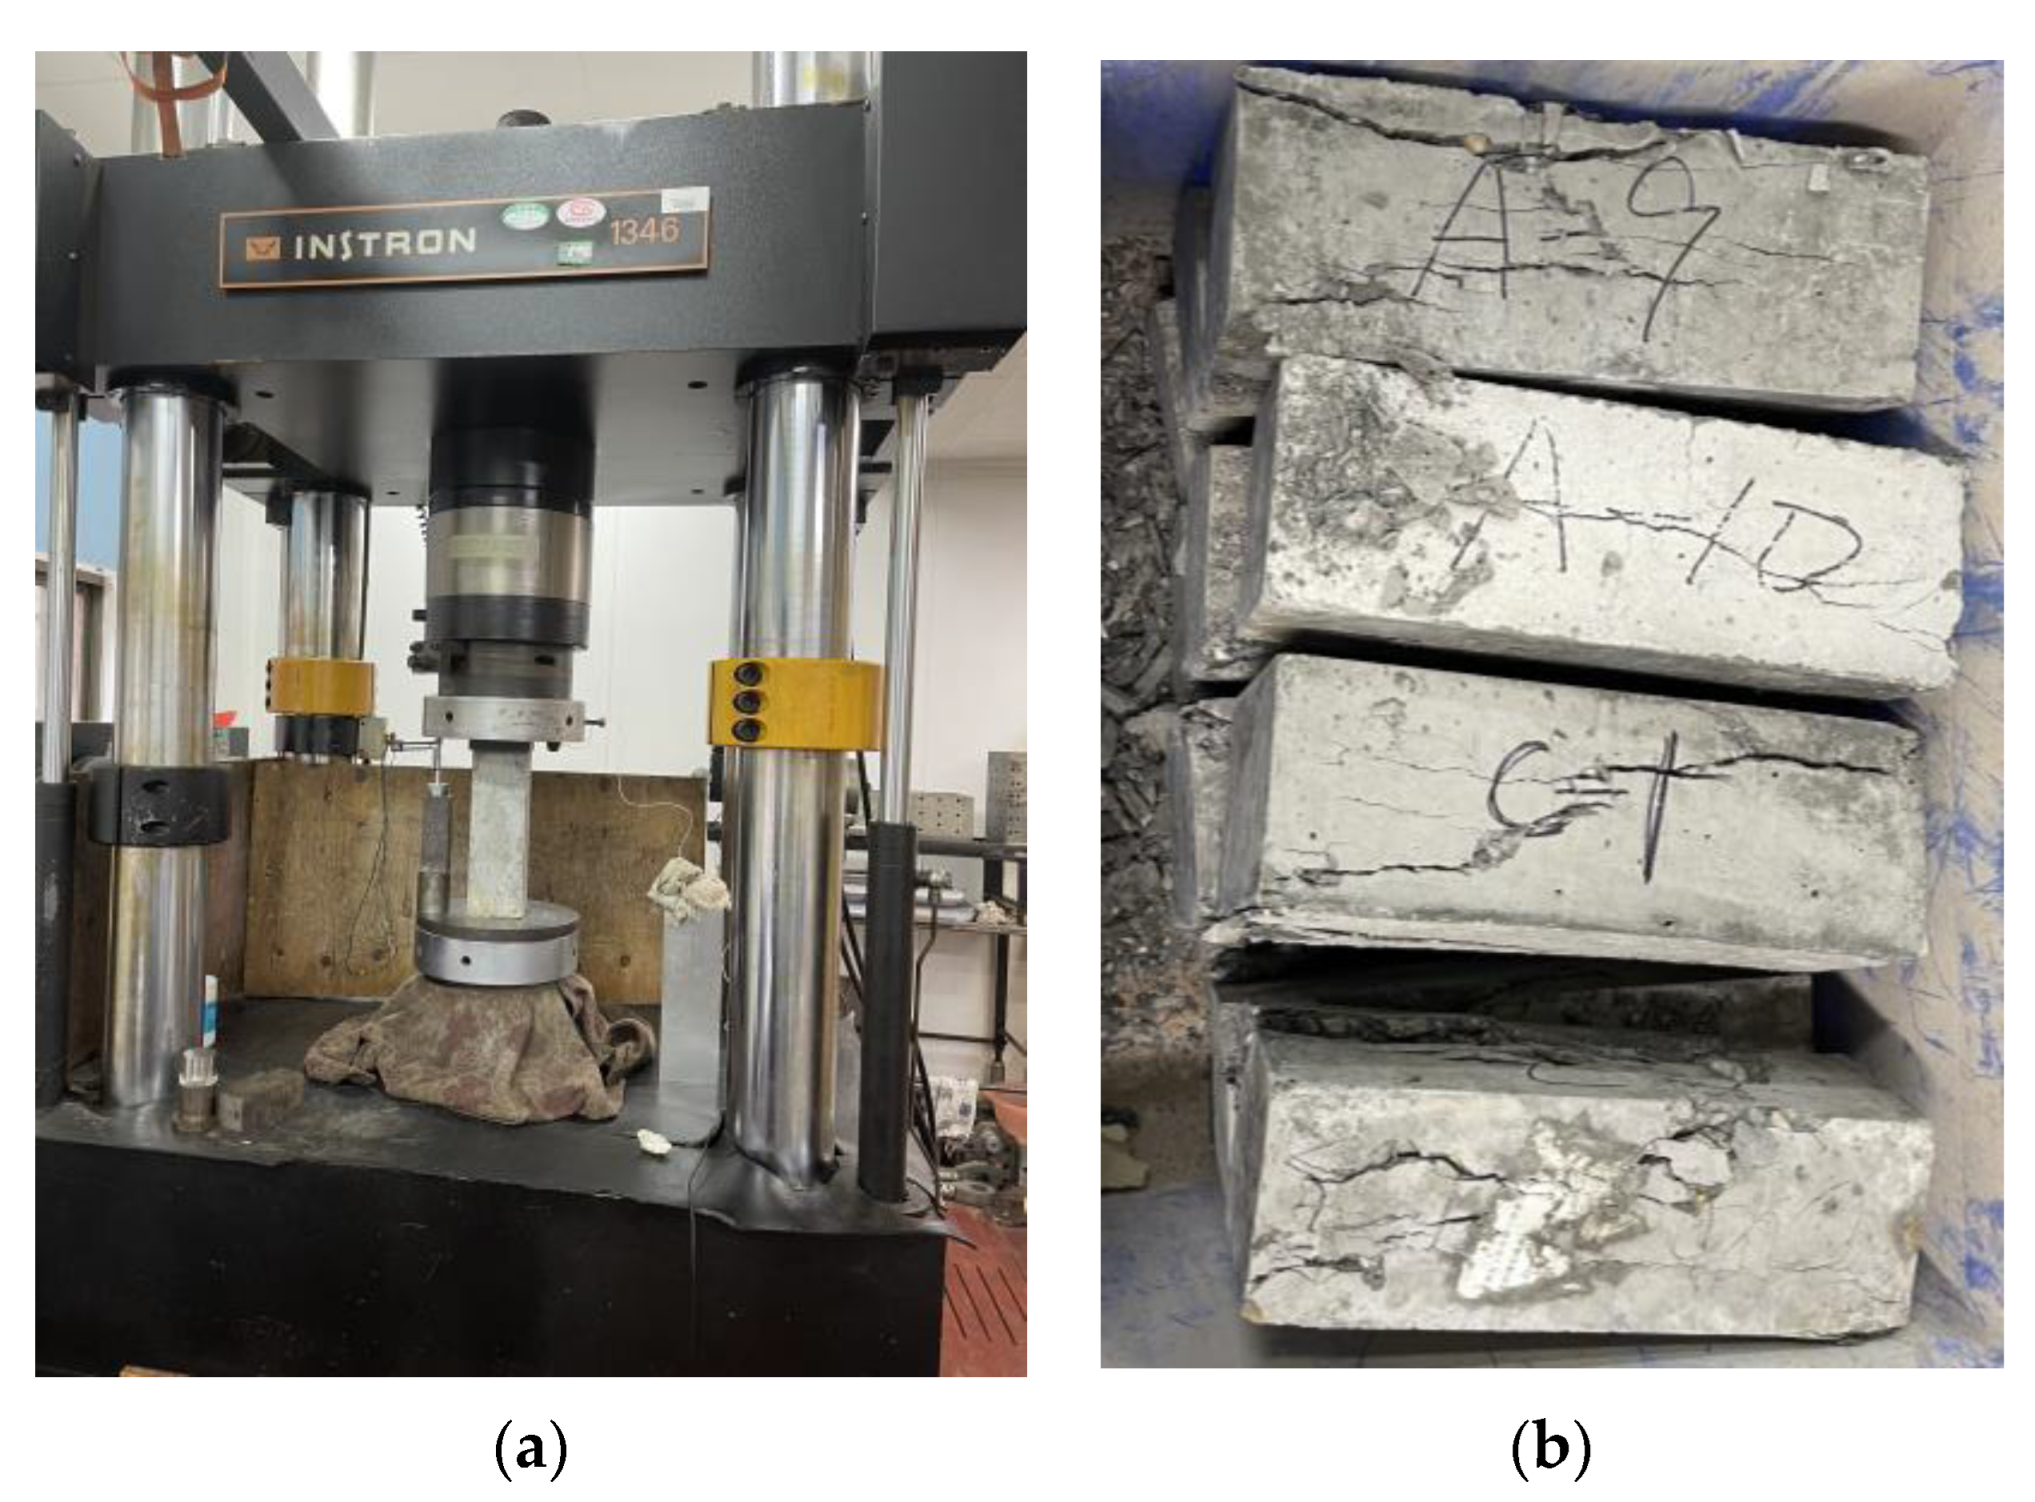
2.3. Experimental Setup

The random mechanical properties of concrete after different immersion times were observed by using a material universal test machine (Instron 1346, High Wycombe, UK. Instron Ltd. see Figure 1) with a monotonic uniaxial compression load to which the concrete specimens were subjected. The maximum load range of the universal test machine was 500 kN and the measurement accuracy was ±0.5%. Before the test, the mass of the specimens was weighed for the purpose of measuring the moisture content by using an electronic scale with an accuracy of 0.001 kg. The lording process was as follows:
(1)
At the beginning of the test, the specimen was placed between the loading panels of the test machine with talcum powder for reducing friction, and the loading control system was used to control the loading actuator and increase the load to the presetting load value (i.e., 0.5 kN for this test) with a constant loading rate, to ensure that the surfaces of the specimen were flat and the loading actuator was aligned during the test.
(2)
Subsequently, three preloads were carried out (the load was set as 30% of the estimated bearing capacity of the specimen).
(3)
Finally, the test was conducted in the load-controlled loading mode and displacement-controlled loading mode during different stages; in detail, the load-controlled loading mode was adopted before the specimen reached the peak-bearing capacity, and the displacement-controlled loading mode was adopted after the peak-bearing capacity.
The loading rate of the formal test is shown in Table 5. The representative broken specimens after testing are shown in Figure 1b.

3. Experimental Results and Analysis

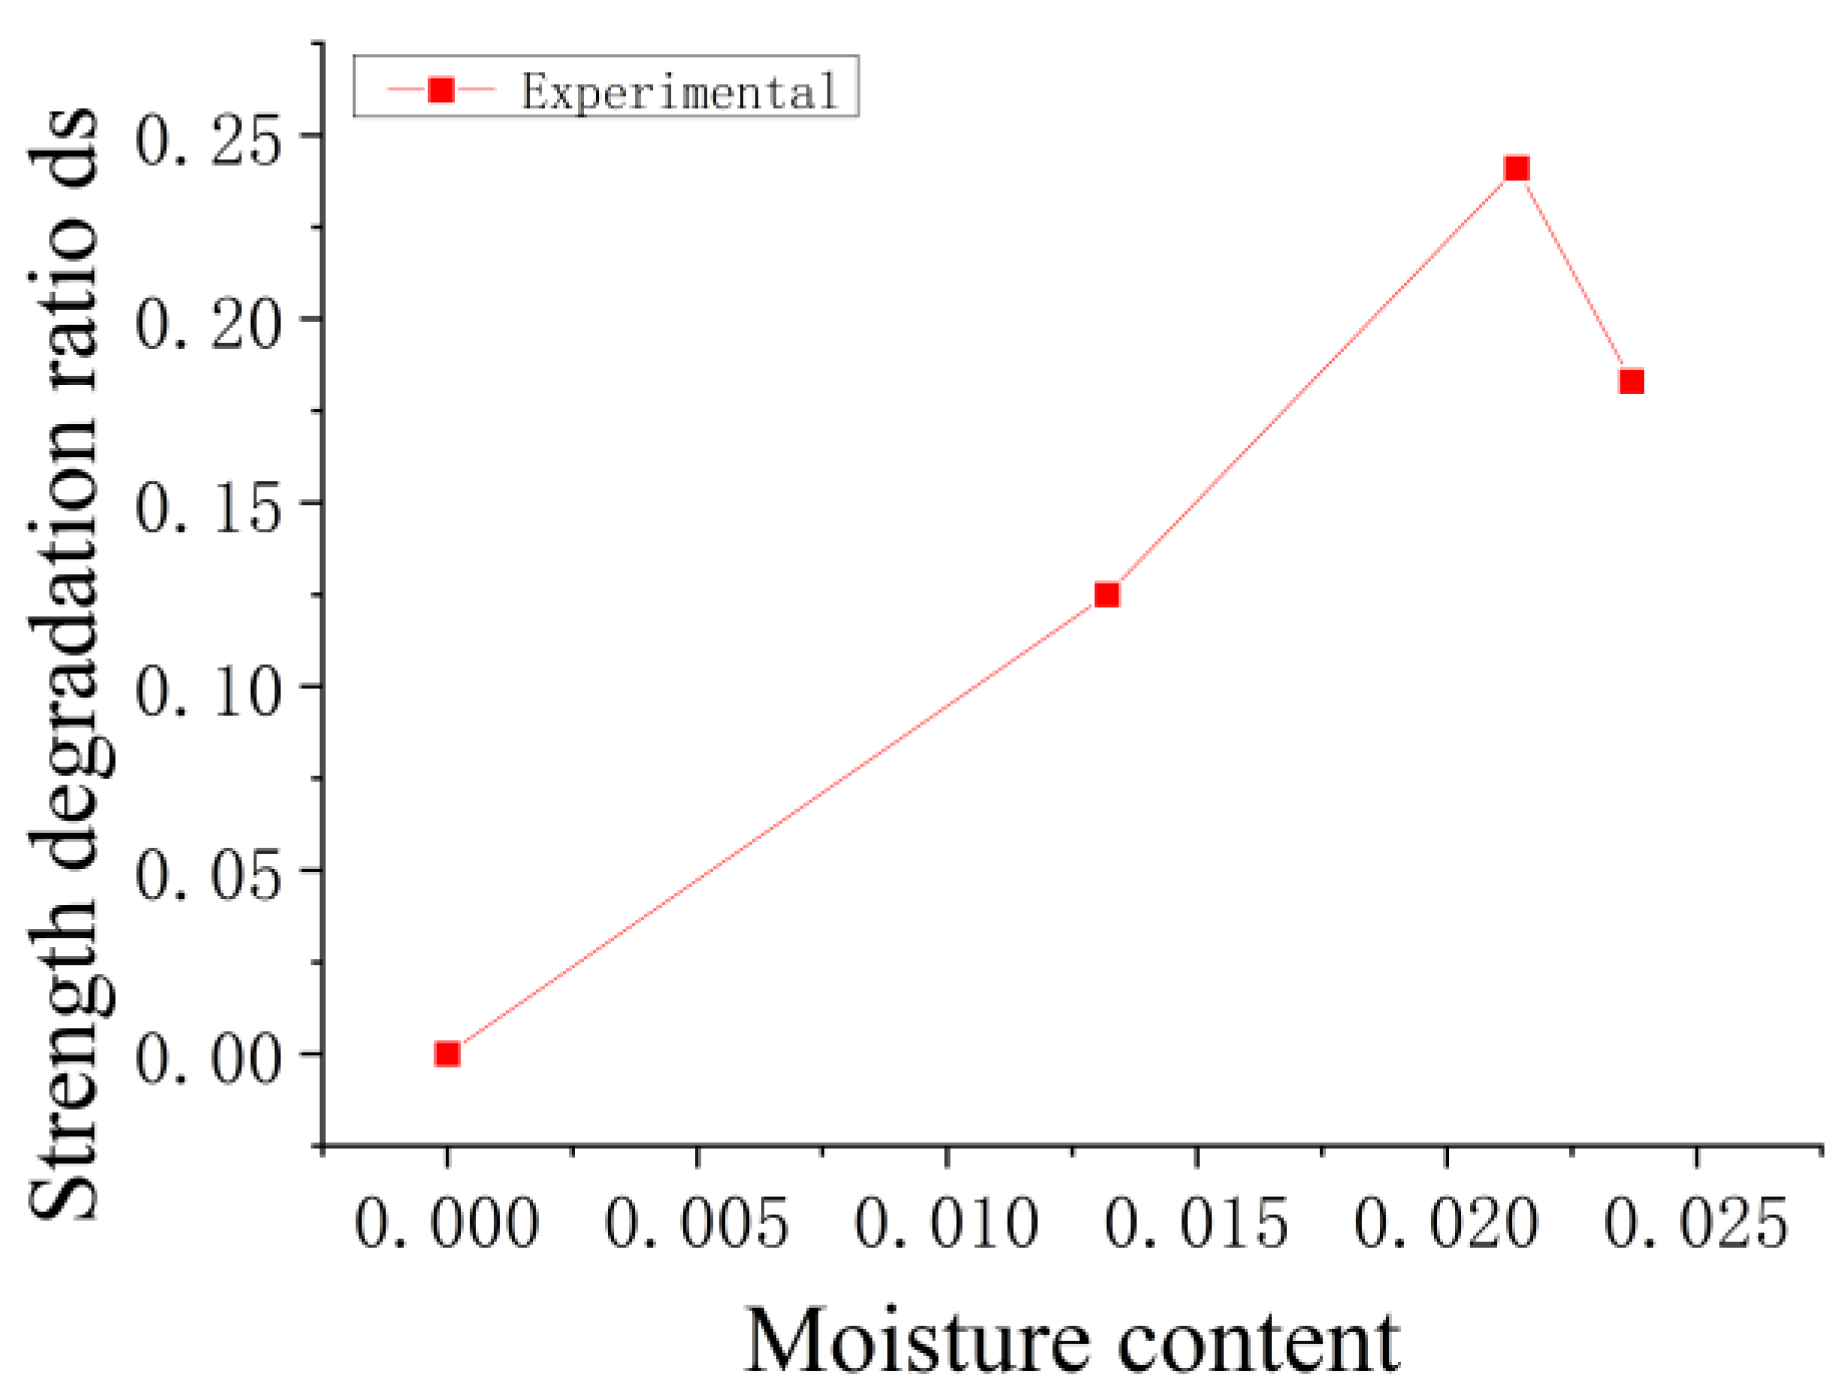
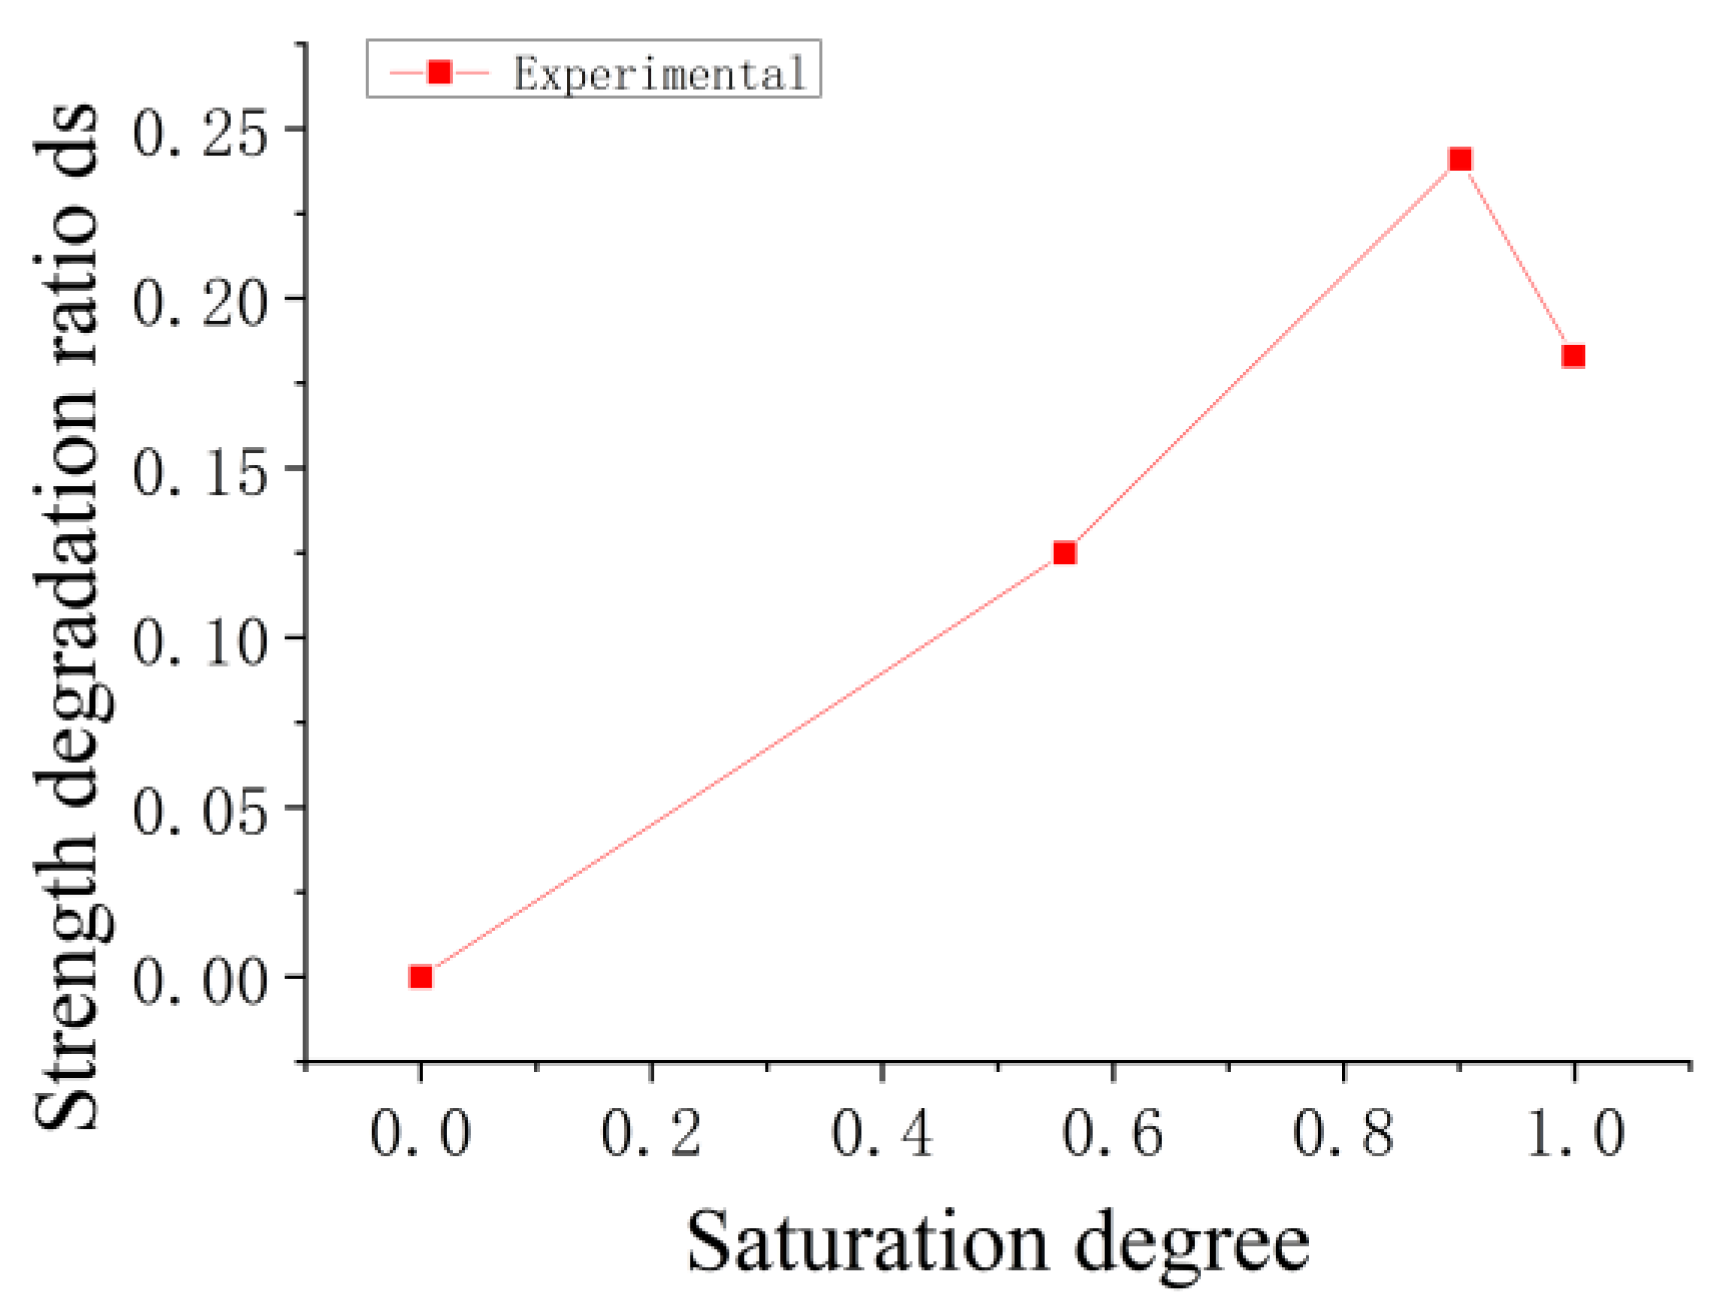
3.1. Strength Deterioration of Wet Concrete

Thorough the above experiments, the moisture content, strength, and strength deterioration results of wet concrete with different immersion times were obtained and are shown in Table 6.
It was found that the compressive strength of the C30 concrete specimens deteriorated more obviously after immersion for more than 6 h and reaching a certain saturation (moisture content), and with the increase in the saturation, the deterioration rate of compressive strength tends to increase and then decrease (see Figure 2 and Figure 3). Based on the theory of linear elastic fracture mechanics, according to the law of initiation and development of microcracks in concrete under compression, due to the influence of surface tension and volume compression deformation of water, the free water in the initial microdefects, such as cracks and pores, produces splitting and pulling effects on the cracks, which accelerates the initiation and development of cracks. For the material subjected to the same compression load, the more content of free water in the concrete, the more serious damage it suffers; thus, the higher the saturation of the concrete, the lower its static compressive strength.

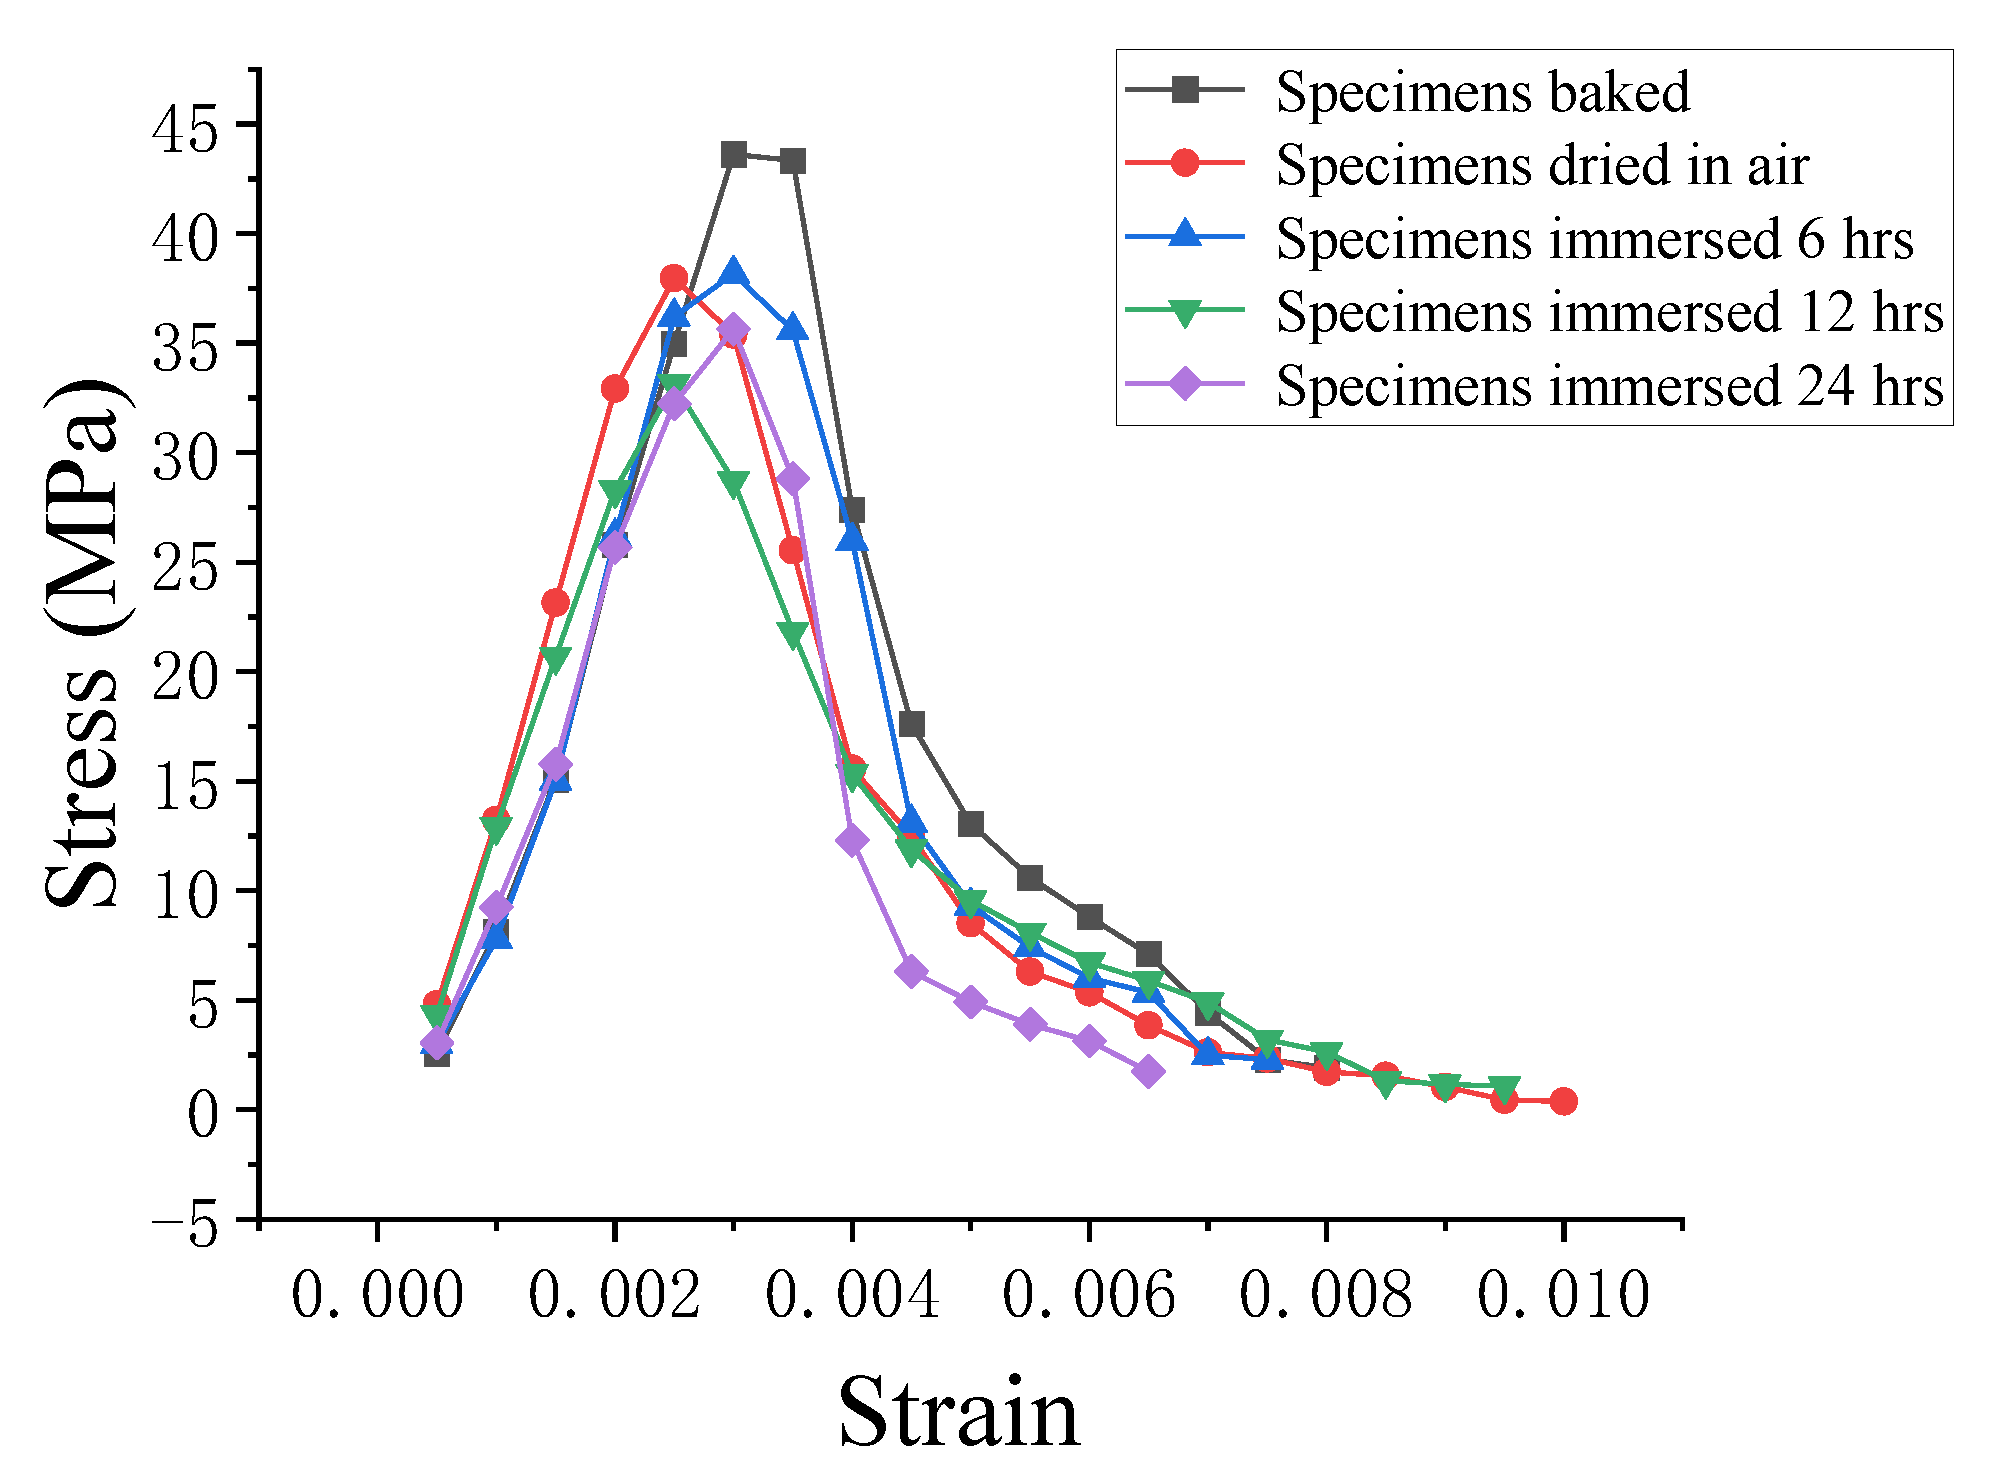
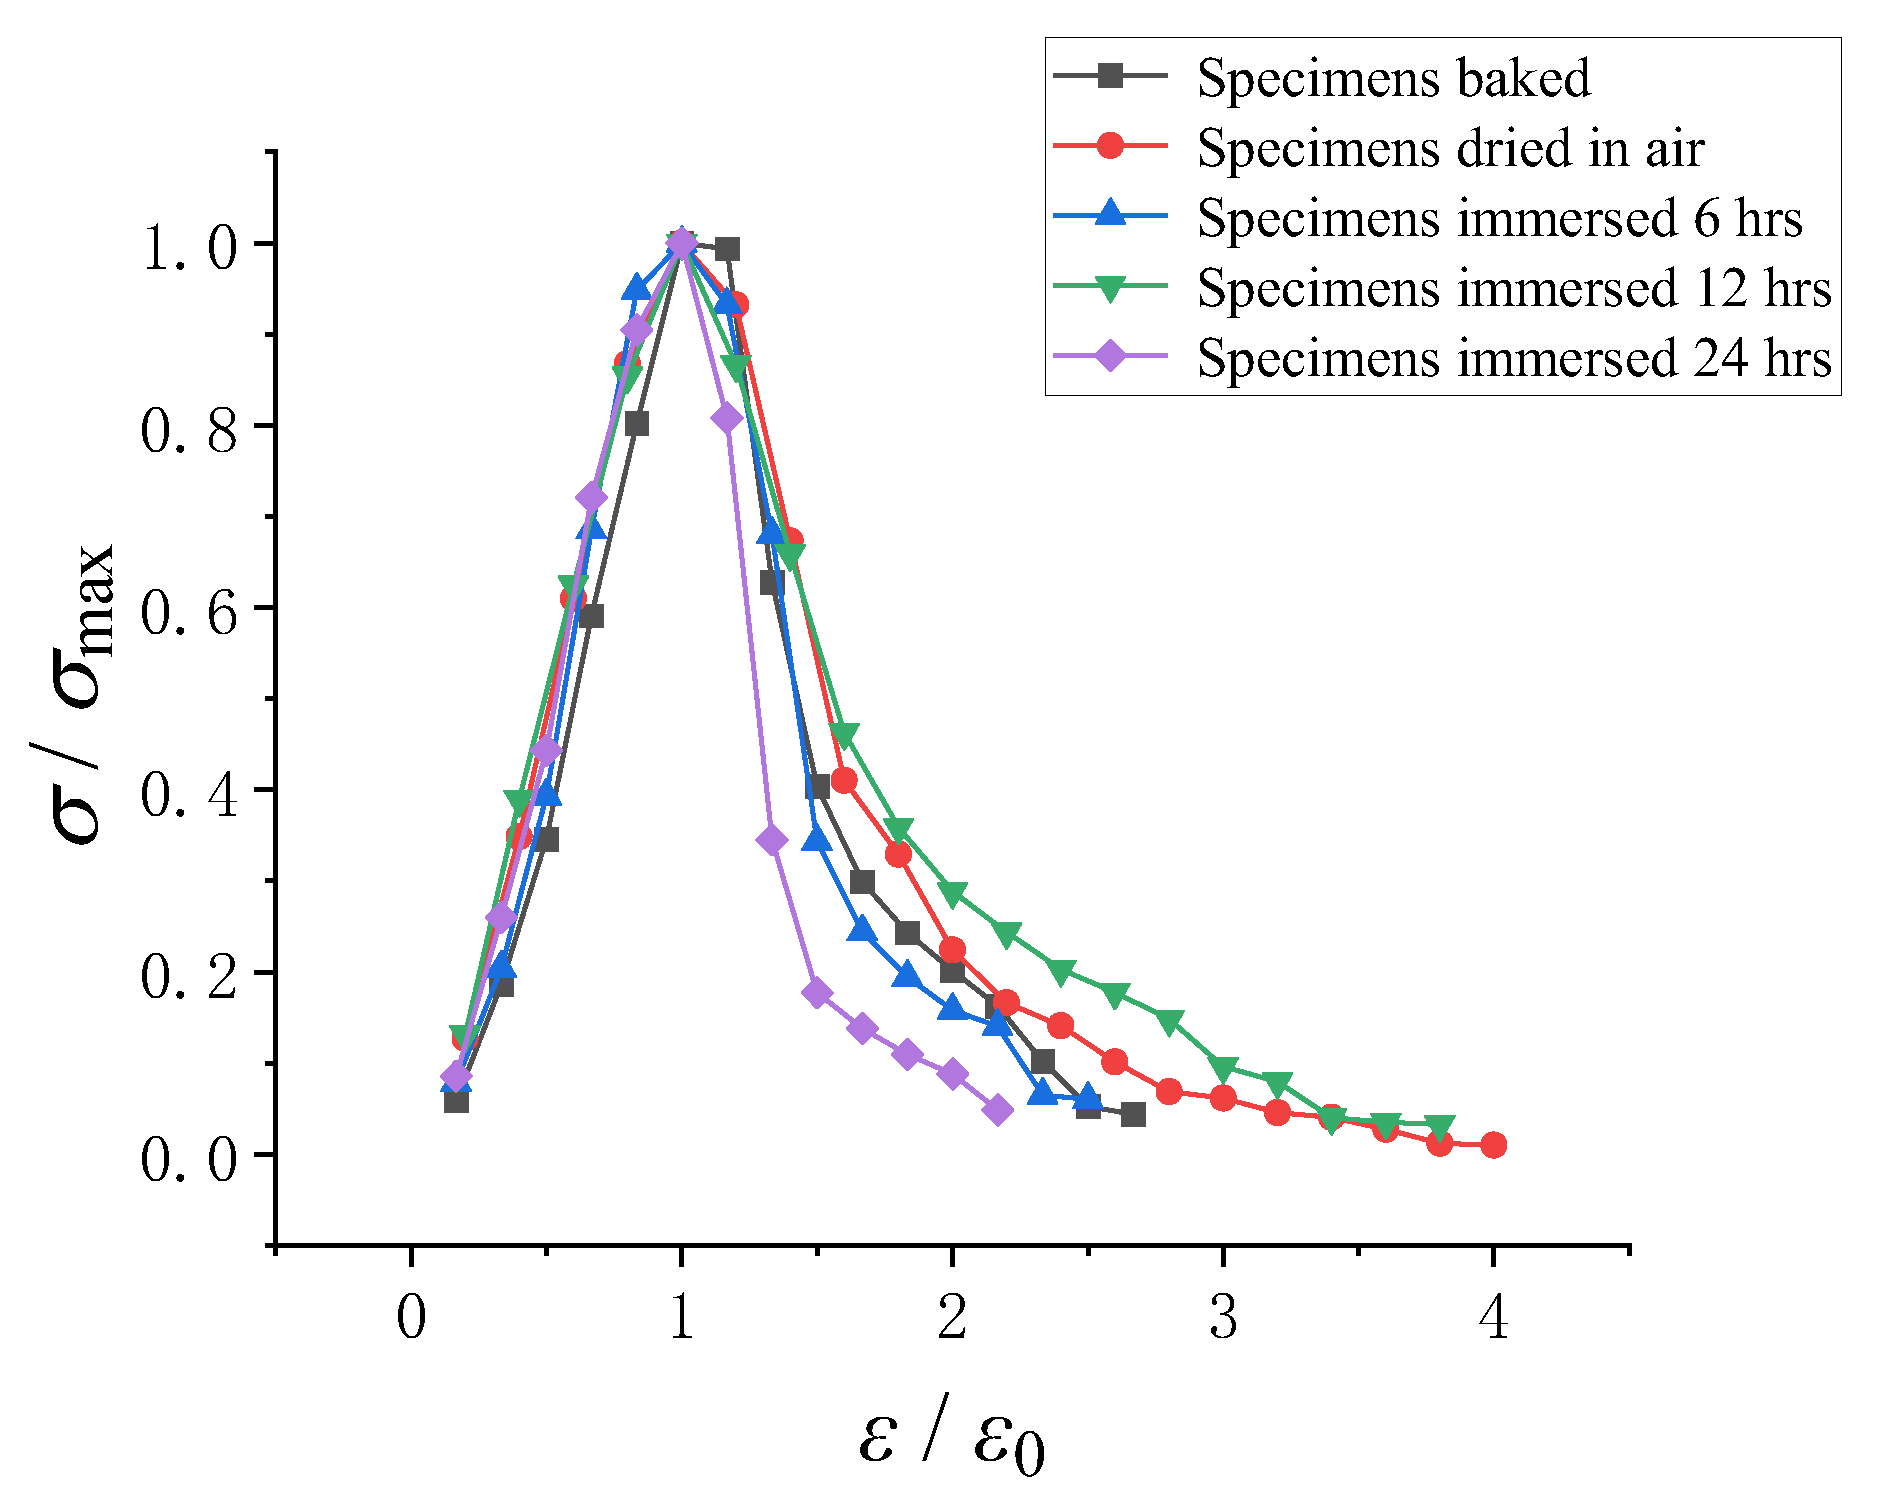
3.2. Stress–Strain Curves of the Wet Concrete under Compression

The experimental results of the typical stress–strain curves in this work are shown in Figure 4. It was found that the shape of the stress–strain curves of the wet concrete was similar to that in the literature [1], and the curve can be roughly divided into three stages, i.e., a linearly rising stage (when the specimen is in the elastic deformation process), a curvy-line rising stage (when the specimen undergoes a microcrack initiation process), and a descent stage (when the specimen undergoes a microcrack development and convergence and a final failure process). In addition, the strains corresponding to the peak stress are mostly range from 0.002 to 0.003.

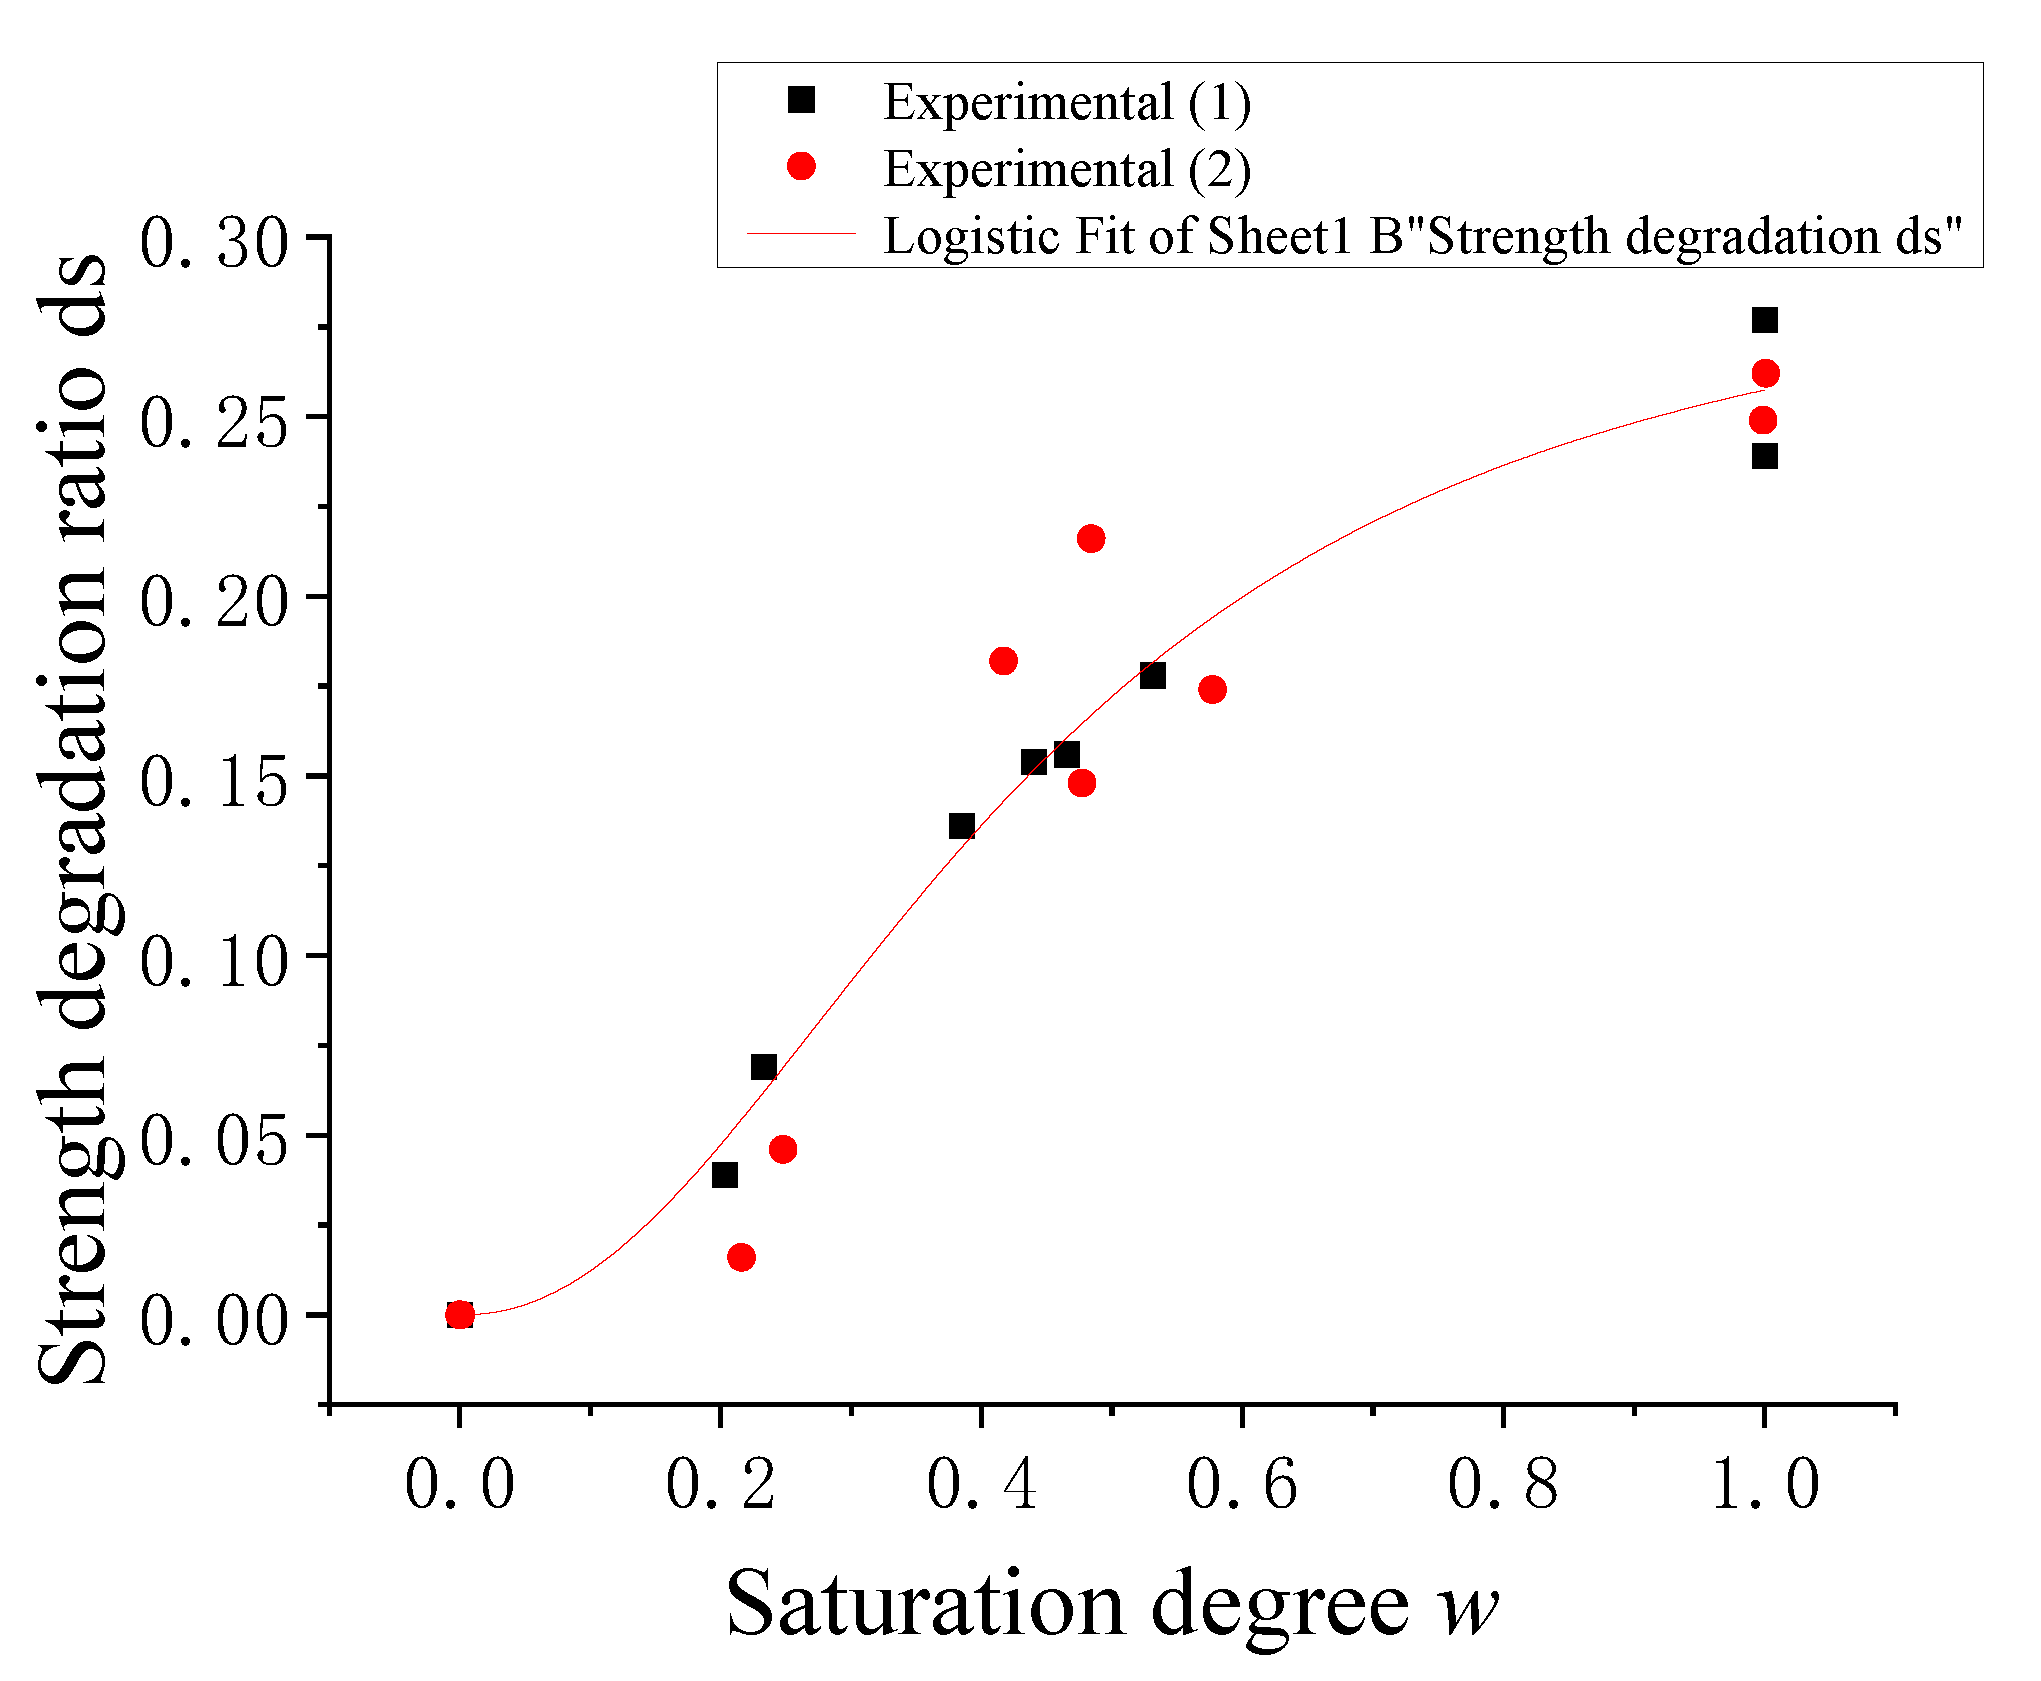
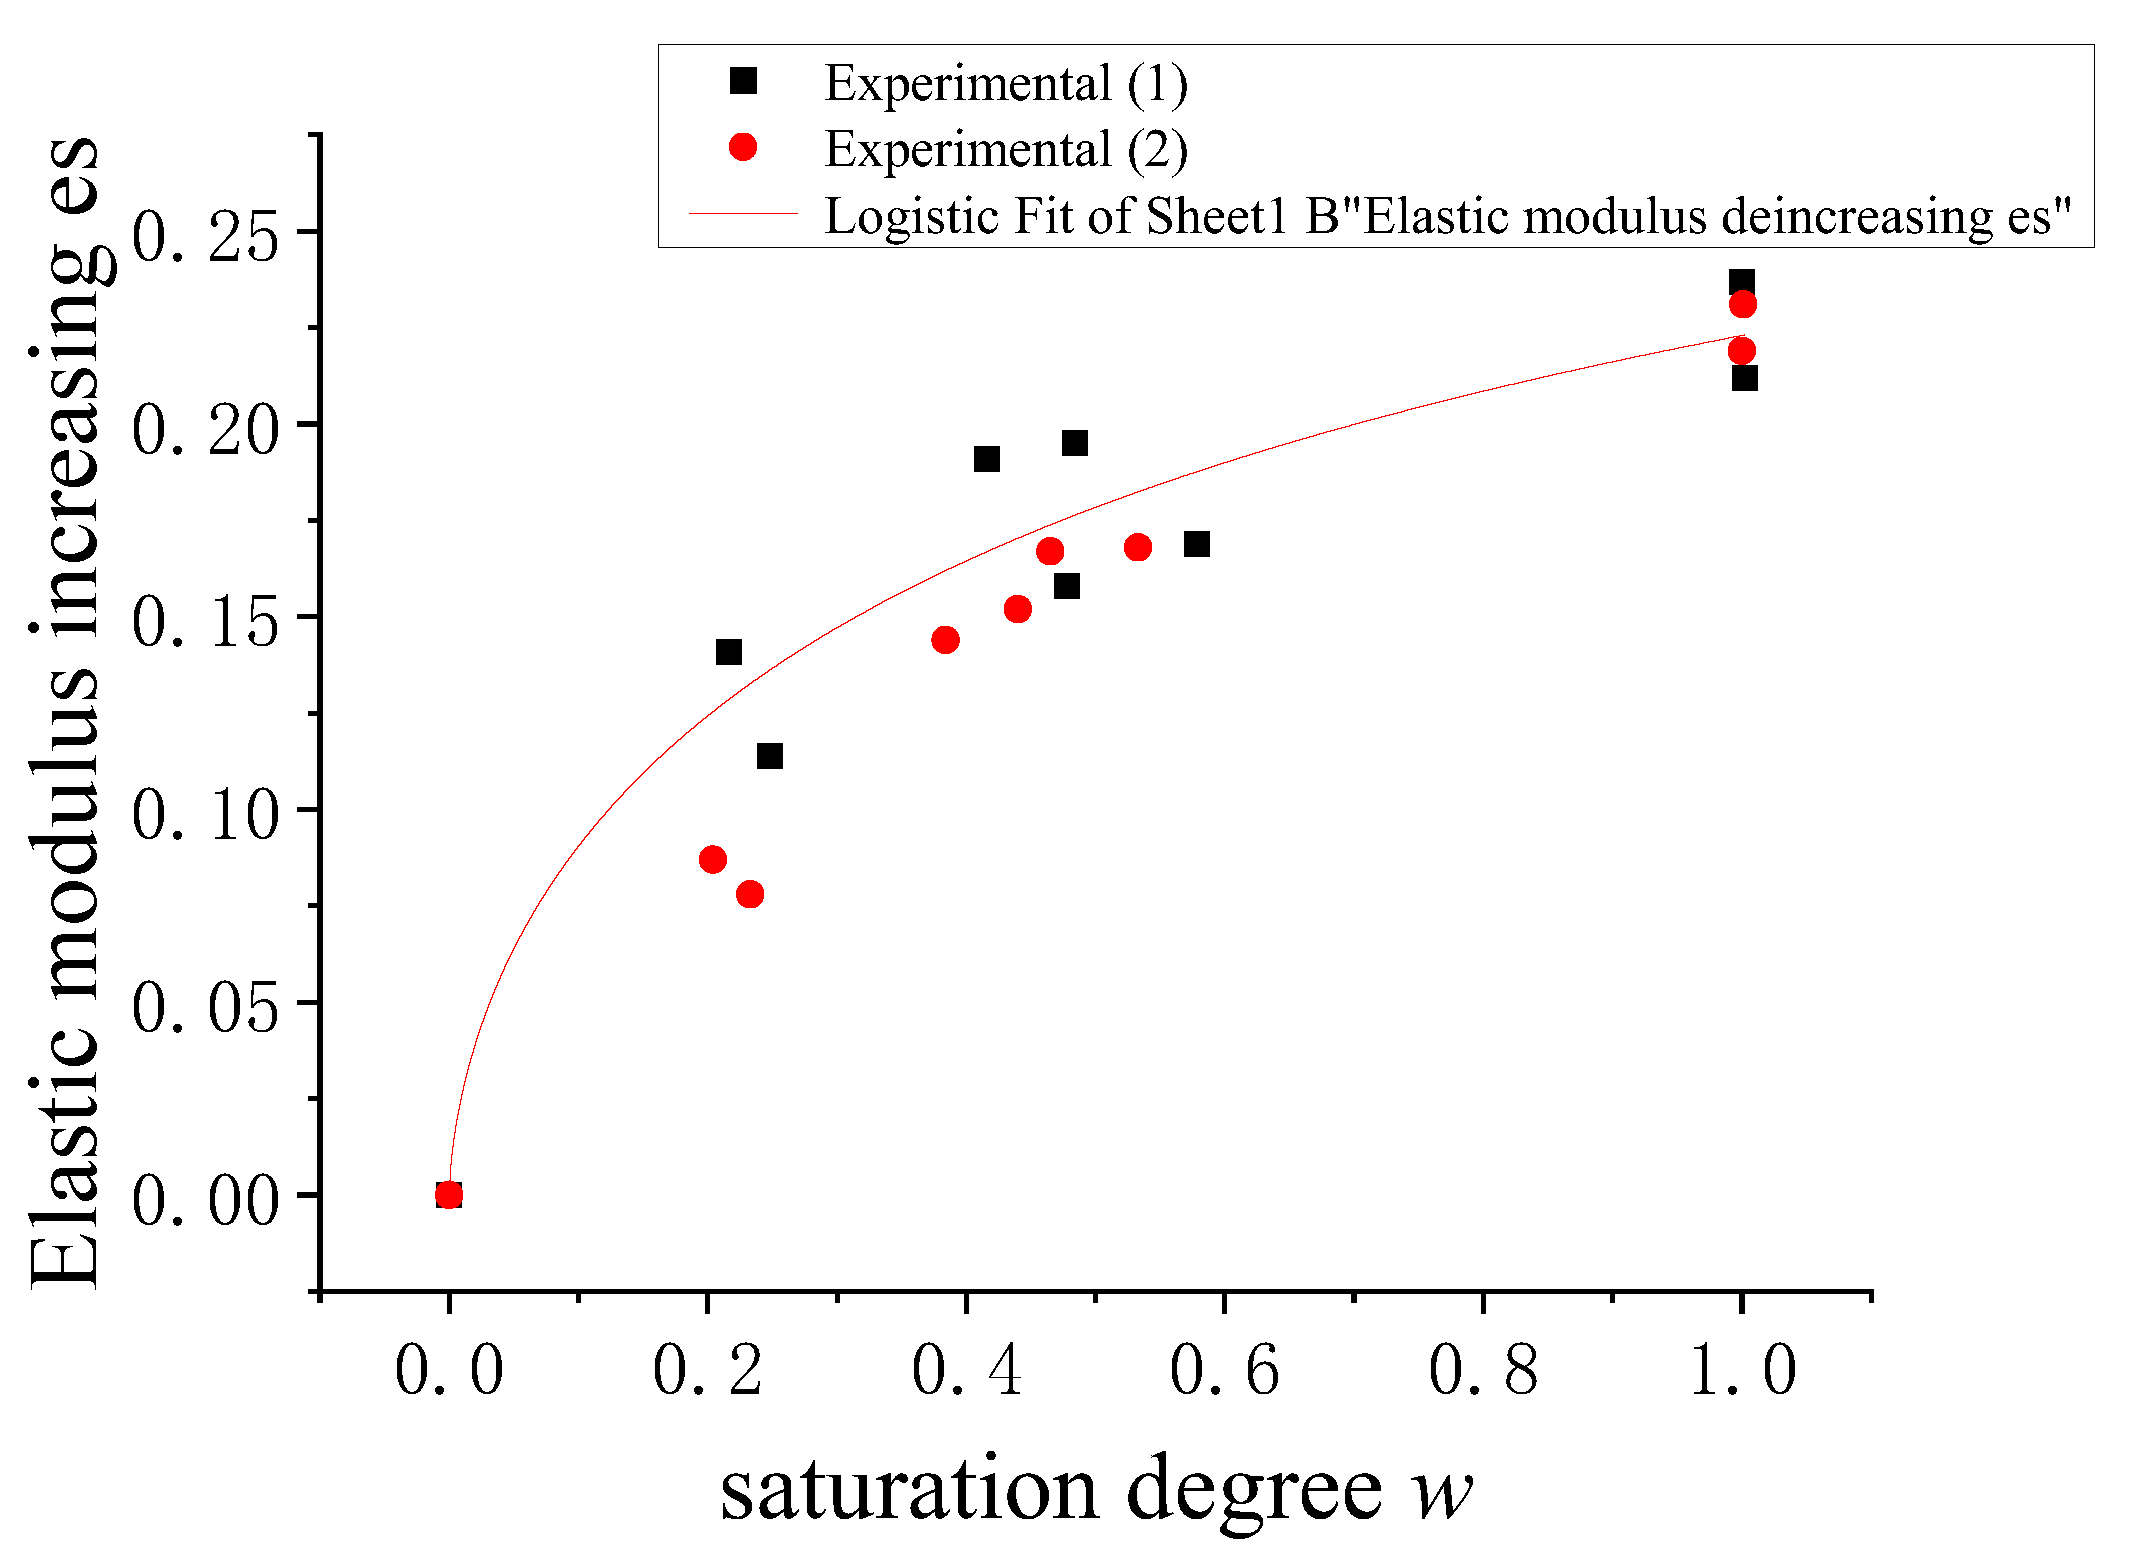
3.3. Saturation Effects on the Mechanical Properties of Wet Concrete

Based on the above experimental investigation on the mechanical properties of concrete after different immersion times, the evolution of concrete saturation w depending on the immersion time lgt was modeled using the experimental results applied to the following equation (see Figure 5 showing some typical experimental results from the literature [2]):
w = 0.082 lg t 2 + 0.381 lg t + 0.563
Furthermore, considering the evolution of the concrete compressive strength deterioration and the elastic modulus increase dependent on the saturation w (see Figure 6 and Figure 7 showing typical test results [5]), the evolution equations are, respectively,
d s = 0.301 0.301 1 + w / 0.457 1.991
e s = 0 . 422 0 . 422 1 + w / 0 . 831 0 . 613
Concerning the elastic modulus of wet concrete, Yaman et al. [16] classified the pores into effective porosity and non-effective porosity based on the effect of the capillary pressure and the air entrained in the concrete pores on the mechanical properties of concrete. The effective porosity is the porosity occupied by capillary water, while the non-effective porosity is the porosity occupied by the air entrained into it. The effective porosity is related to the water–cement ratio, hydration degree, and wetting degree of concrete and generally affects the physical and mechanical properties of concrete compared with the non-effective porosity. It was found, based on the relevant experimental studies, that, with the increase in the effective porosity and water content, the strength of concrete decreases; with the increase in the effective porosity, the Poisson’s ratio and elastic modulus of concrete decreases; and for the same effective porosity case, the Poisson’s ratio and elastic modulus of saturated concrete increase compared with those of dry concrete. Therefore, as the saturation of concrete increases, its modulus of elasticity gradually increases under static force (as shown in Figure 7).

4. Stochastic Damage Model of Wet Concrete under Compression

4.1. Damage Model of Wet Concrete in the Sense of the Mean Value

The constitutive model of dry concrete in the sense of the mean value can be expressed as
σ = E ε
where σ is the stress, E is the elastic modulus of concrete, and ε is the strain.
Based on the theory of damage mechanics of Lemaitre et al. [17,18], the damage variable dc can be defined as a parameter of the mechanical properties for the material that leads to the nonlinear mechanical behavior, and the damage model of dry concrete in the mean sense can be expressed as
σ = 1   d c E c ε
where Ec is the initial elastic modulus of concrete.
Furthermore, based on the damage model of dry concrete in Equation (2), considering the effect of saturation (water content) on the strength and initial elastic modulus of concrete by defining an effect function as f(ds, es), the damage model of wet concrete in the mean sense can be developed as
σ = f d s , e s 1 d c E c ε = 1 + e s ε 1 + e s 1 d s ε c , k 1 d c E c ε
where ds denotes the damage variable related to the compressive strength deterioration of wet concrete compared to that of dry concrete (i.e., strength degradation variable); es denotes the variable related to the elastic modulus of wet concrete compared to that of dry concrete (i.e., elastic modulus increase variable), and both can be determined using the experimental results; Ec is the initial elastic modulus of dry concrete, which can be determined using the experimental results or can be obtained from Table 7 if no relevant experimental results are available; εc,k is the strain corresponding to the peak value of the uniaxial compressive stress of dry concrete, which can be determined using the experimental results or can be obtained from Table 7 if no relevant experimental results are available; and dc is the damage variable of dry concrete, whose evolution function is expressed by the following equation,
d c = A c , 1 A c , 2 1 + x / x c , 0 p c + A c , 2
x = ε ε c ,   k
where the parameters Ac,1, Ac,2, xc,0, and pc are parameters related to the evolution of the uniaxial compressive damage of dry concrete, which can be determined by the experimental results of concrete under monotonic compression or can be obtained from Table 7 if no relevant experimental results are available. Note that Table 7 was developed based on the Chinese standard Code for the Design of Concrete Structures [19], considering the following: (1) Considering the test method of the elastic modulus in the standard and a better simulation of the stress–strain curve, the value of the elastic modulus Ec in this work was taken as 1.03 times of that in the standard [19]; (2) The coefficient of variation of concrete strength δc was obtained from Table 4 in Appendix C of the standard [19]; (3) εcu denotes the ultimate strain of concrete under uniaxial compression, assumed to correspond to the strain at stress σ = 0.5fck in the descent section of the stress–strain curve.

4.2. Stochastic Damage Model of Wet Concrete

Due to the randomness of the size, shape, and distribution of the aggregates, the randomness of the distribution of initial defects, such as initial microcracks and microporosity on a multi-scale (from microscopic to macroscopic), and the randomness of the distribution of free water after rainwater and flooding entering the material (see Figure 8), especially man-caused material properties’ randomness during the mixing, pouring, and vibrating process in the village construction, the material concrete has a conspicuous randomness in its mechanical properties under loading. Therefore, we proposed a damage model of wet concrete to characterize the mechanical behavior’s heterogeneity.
In order to describe the stochastic mechanical behavior of wet concrete, the stochastic stress–strain curve of wet concrete subjected to uniaxial compression is suggested to be characterized by the following equation,
μ σ = f d s , e s 1 μ dc E c ε
μ σ ± V σ c = 1 μ dc E c ε ± k δ c δ c 0 f cm
δ c 0 = 0.18 × 0.322 x 3 0.21 × 0.322 x 2 + 0.40 × 0.322 x
where μσ is the mean value of the stress of wet concrete under compression; μdc is the mean value of the damage variable for dry concrete under uniaxial compression, calculated by Equation (4); Vσc is the standard deviation of stress; δc0 is the coefficient evolution of the standard deviation of stress, which is suggested to be determined by the experimental results or by Equation (11) based on the results in the literature [20] if there is no relevant test result available; kδc is a correction parameter for the coefficient evolution of the standard deviation of stress, according to Equation (11), and its value is suggested in Table 8. The related parameters are also suggested in Table 8, if there are no experimental results available.

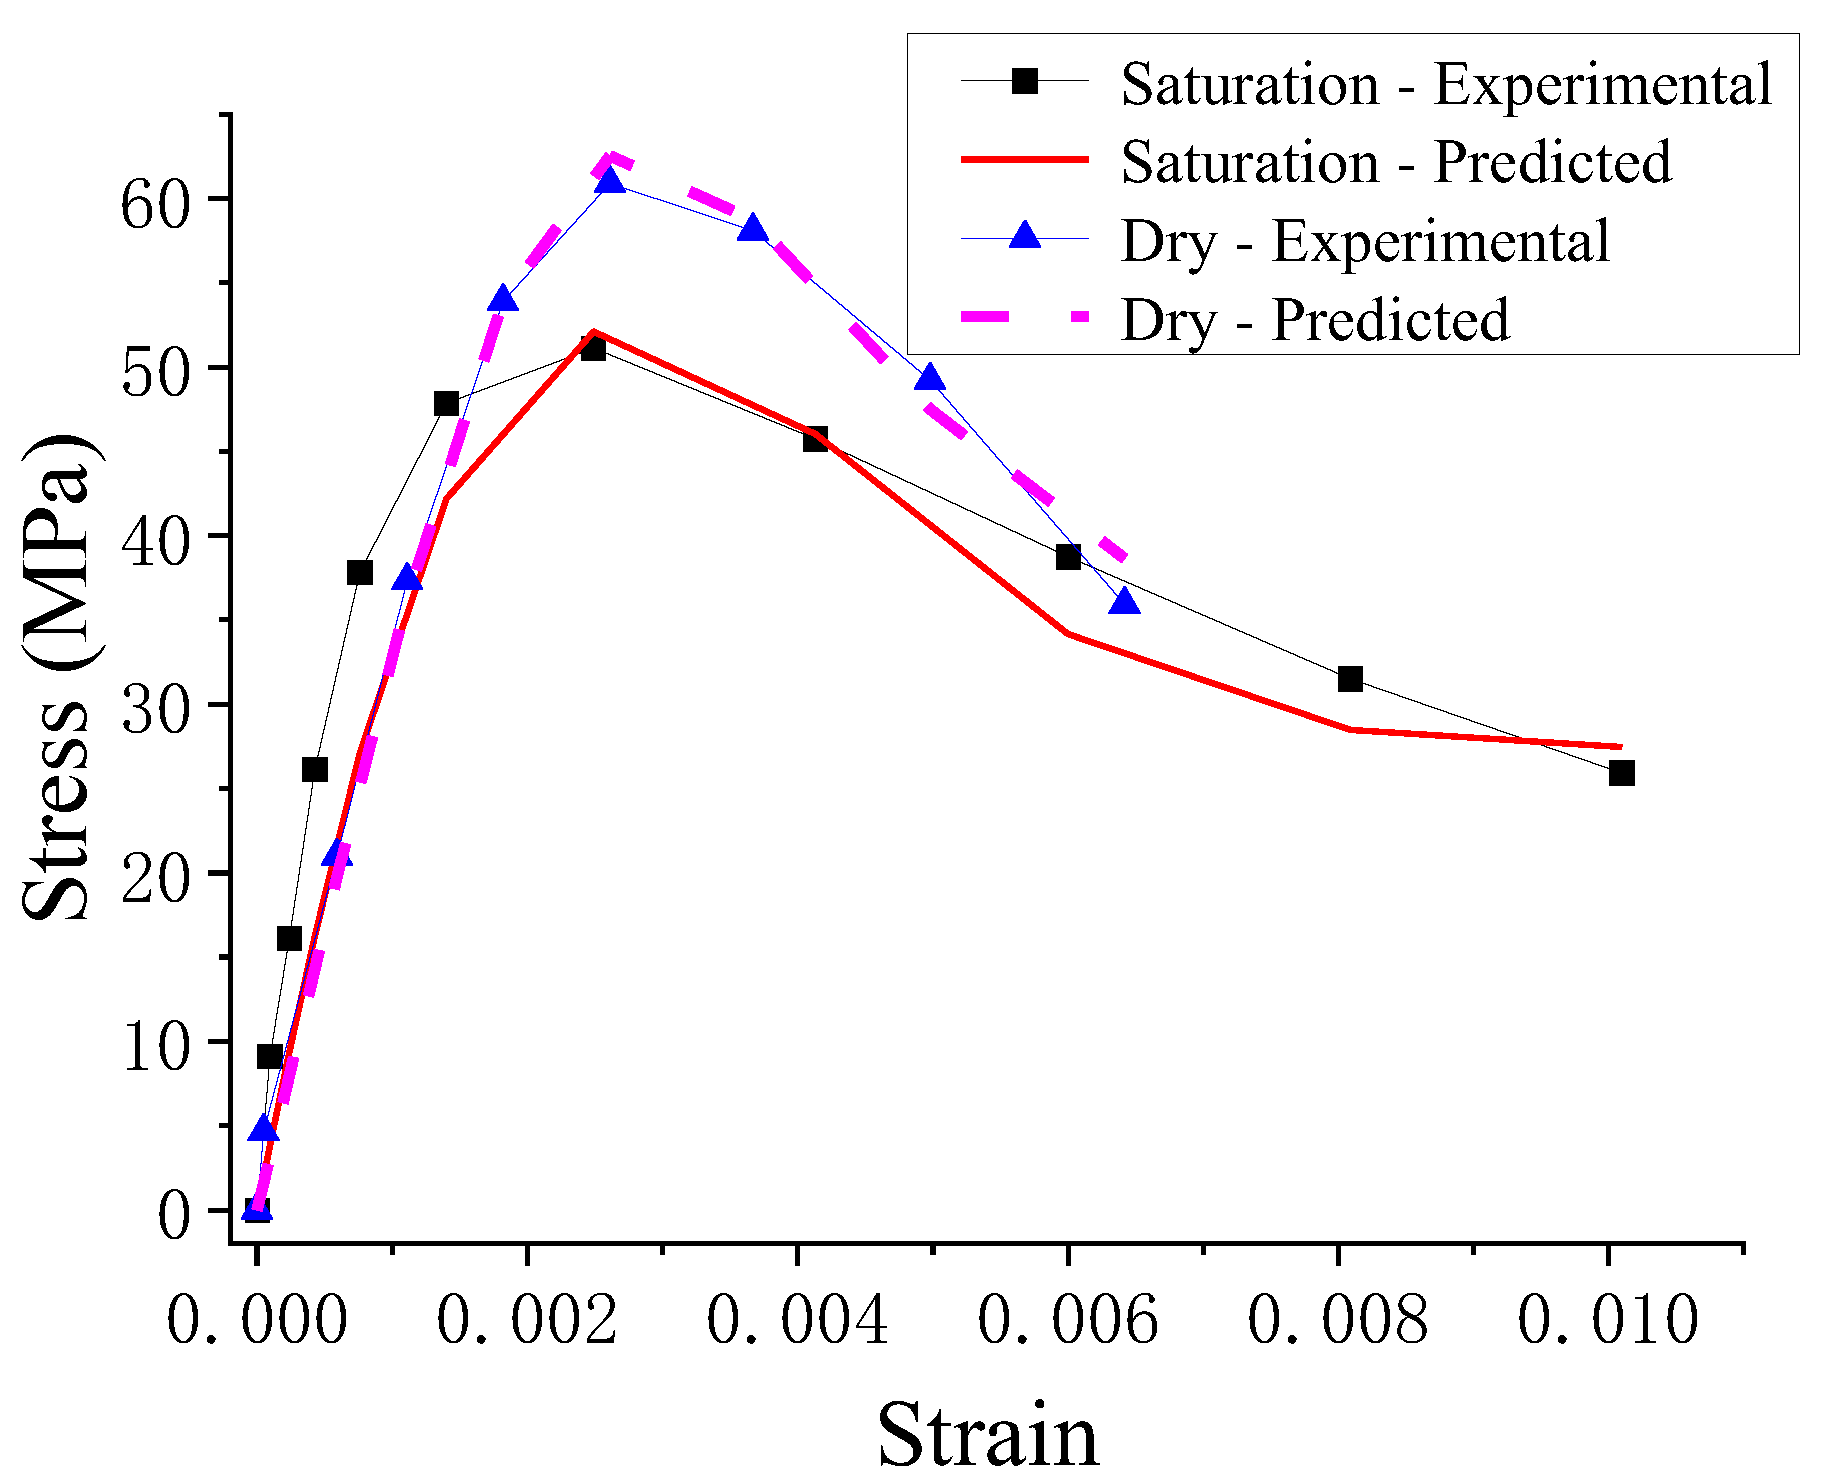
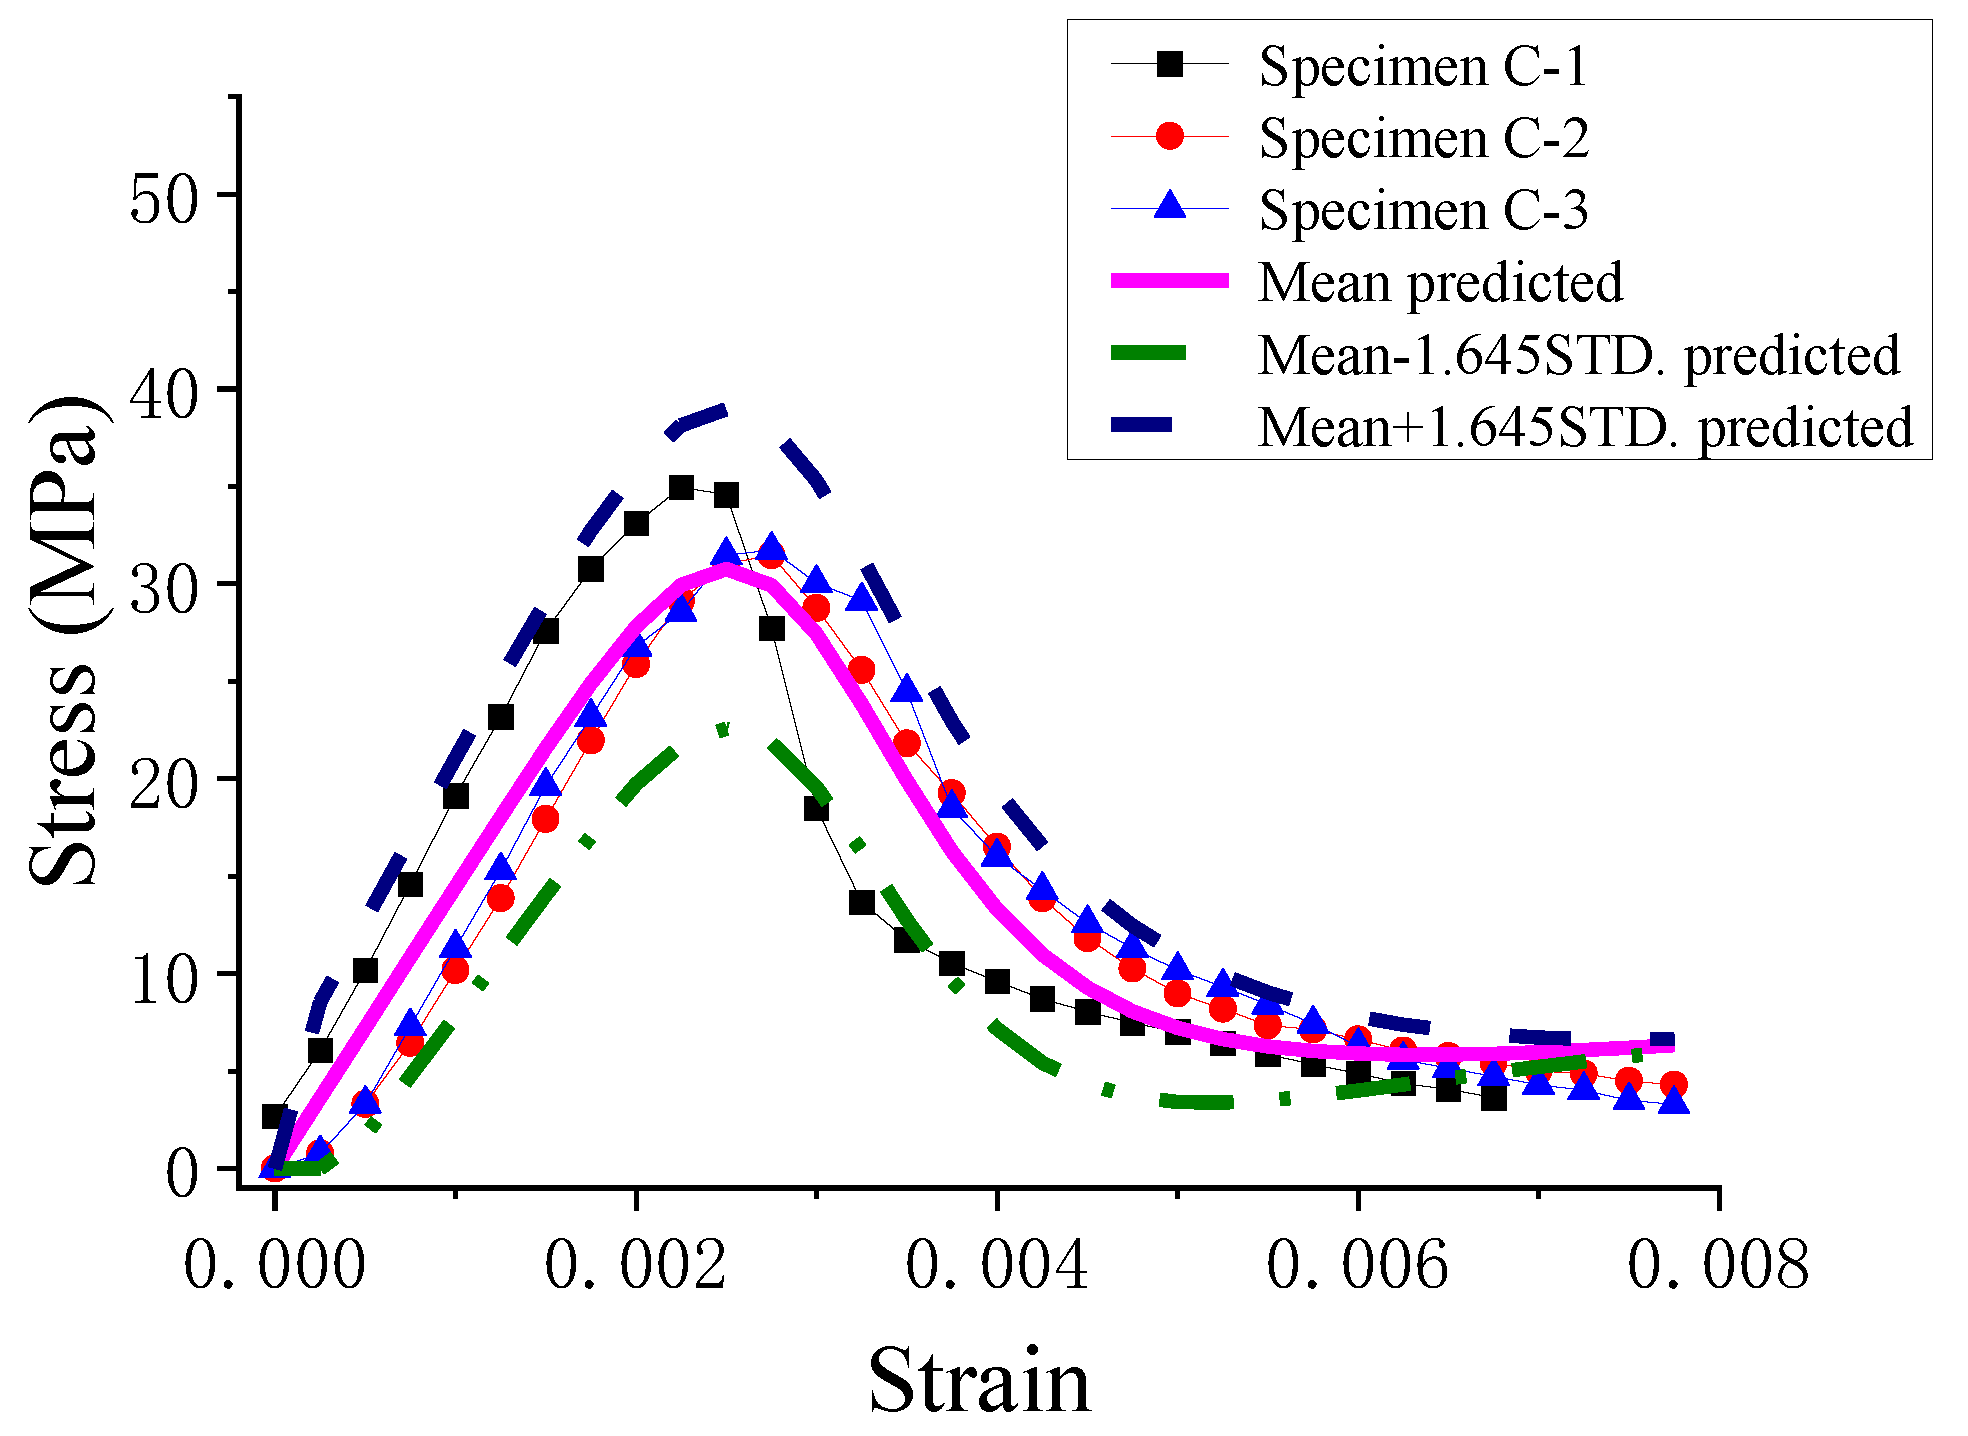
4.3. Model Verification

The predictions of the proposed stochastic damage model for wet concrete in this work were compared with the experimental results of the typical stress–strain response in the mean value sense and stochastic stress–strain response of wet concrete under compression in this work or in the literature [21] (see Figure 9, Figure 10, Figure 11, Figure 12, Figure 13, Figure 14, Figure 15 and Figure 16). Through the comparison, it was found that the proposed model was not only able to predict the mechanical behavior of wet concrete in the mean value sense, but also to describe the stochastic mechanical behavior of wet concrete in the probabilistic sense, which verifies the effectiveness of the proposed model.

5. Discussion

In this paper, we experimentally investigated the mechanical properties of concrete under compression after different immersion times and developed a stochastic damage model of wet concrete. The conclusions drawn are as follows.

5.1. Transition from the Microscale to the Macroscale

In order to understand the intrinsic randomness of materials at different scales, it is necessary to focus on the problem of medium processes in the transition from the microscale to the macroscale.
Figure 17 and Figure 18 demonstrate the average behavior of the probability density of the damage variable d at the microscopic scale. They indicate that the randomness of the microscopic thresholds leads to the random generation and development of microscopic damage in concrete materials, which in turn leads to the evolution of the damage.
In Figure 17 and Figure 18, three probability density functions commonly used in statistical damage methods are examined by fitting the probability density results shown in Figure 10 and Figure 12. The results show that the best consistency of concrete can be obtained using the lognormal distribution function shown in Figure 17a and Figure 18a, compared to the Gaussian distribution function in Figure 17b and Figure 18b and the Weibull distribution function in Figure 18c. The Weibull distribution function cannot effectively fit the probability density in Figure 10; thus, it is not shown.

5.2. Comparison of the Mean Stress–Strain Curves of Concrete with Different Immersion Times

The variation curves of the mean stress response of concrete with strain for different immersion times obtained from the tests are shown in Figure 19. Furthermore, in order to facilitate the examination of the main characteristics of the mean stress response curves of each group, we normalized the strain and stress and obtained the variation curves of the mean stress with the normalized strain (see Figure 20, ε/ε0, where ε0 is the strain corresponding to the peak stress) and the variation curves of the normalized mean stress with the normalized strain (see Figure 20, σ/σmax, where σmax is the peak stress). We compared and analyzed these curves as follows.
As it can be seen from Figure 20, the peak value of the mean stress appeared on the stress–strain curve of the specimens baked at 50 ± 2 °C for 48 h, and it was significantly higher than the peak value of the mean stress of the concrete under immersion, and the peak value of the mean stress showed a gradual decrease with the increase in the immersion time. As it can be seen from Figure 21, the correlation curve of the specimen with an immersion time of 24 h reached the peak stress and then fell rapidly, showing the most obvious quasi-brittle behavior. A possible reason is that, with the increase in the immersion time, the water content in the pores of the concrete increased gradually until it was completely wet, and under the action of the external compressive load, the microscopic pores were more likely to produce the horizontal splitting tensile action of compressive loading, which made the cracks more likely to arise and development, and then the brittleness characteristics of the material were more obvious and the strength was reduced.

5.3. Characteristics and Limitations of the Stochastic Damage Model

The proposed model is an analytical mechanical model based on a class of damage mechanics models, statistical mechanics models, and bundle chain models, and considers the effect of water on the damage mechanics behavior of concrete. This class of models is based on the fiber bundle model, which is recognized in theoretical physics and engineering, and can describe complex damage mechanical behaviors, such as damage accumulation, plastic development, and fatigue damage, in a simple form. The model proposed in this paper is also characterized by its simple form and accuracy in expressing the stochastic mechanical behavior of immersed concrete, which can reveal the micromechanical behavior of damage generation and development in immersed concrete.
For high-strength concrete, such as concrete exceeding the C80 strength class, the accuracy of the predicted values of the random mechanical properties by this model cannot be determined because we do not have test results on its random mechanical properties.

6. Conclusions

In this paper, we experimentally investigated the mechanical properties of concrete under compression after different immersion times and developed a stochastic damage model of wet concrete. The conclusions that we were able to be draw are as follows:
(1)
The degradation evolution of mechanical property for concrete with different immersion times under uniaxial compression was obtained, and the shape of the stress–strain curves of the wet concrete was similar to that in the literature.
(2)
The proposed stochastic damage model was able to consider both effects of the saturation and the damage behavior of wet concrete under compression. It was verified by comparing with the experimental results in this paper and the classical experimental results from the literature.
(3)
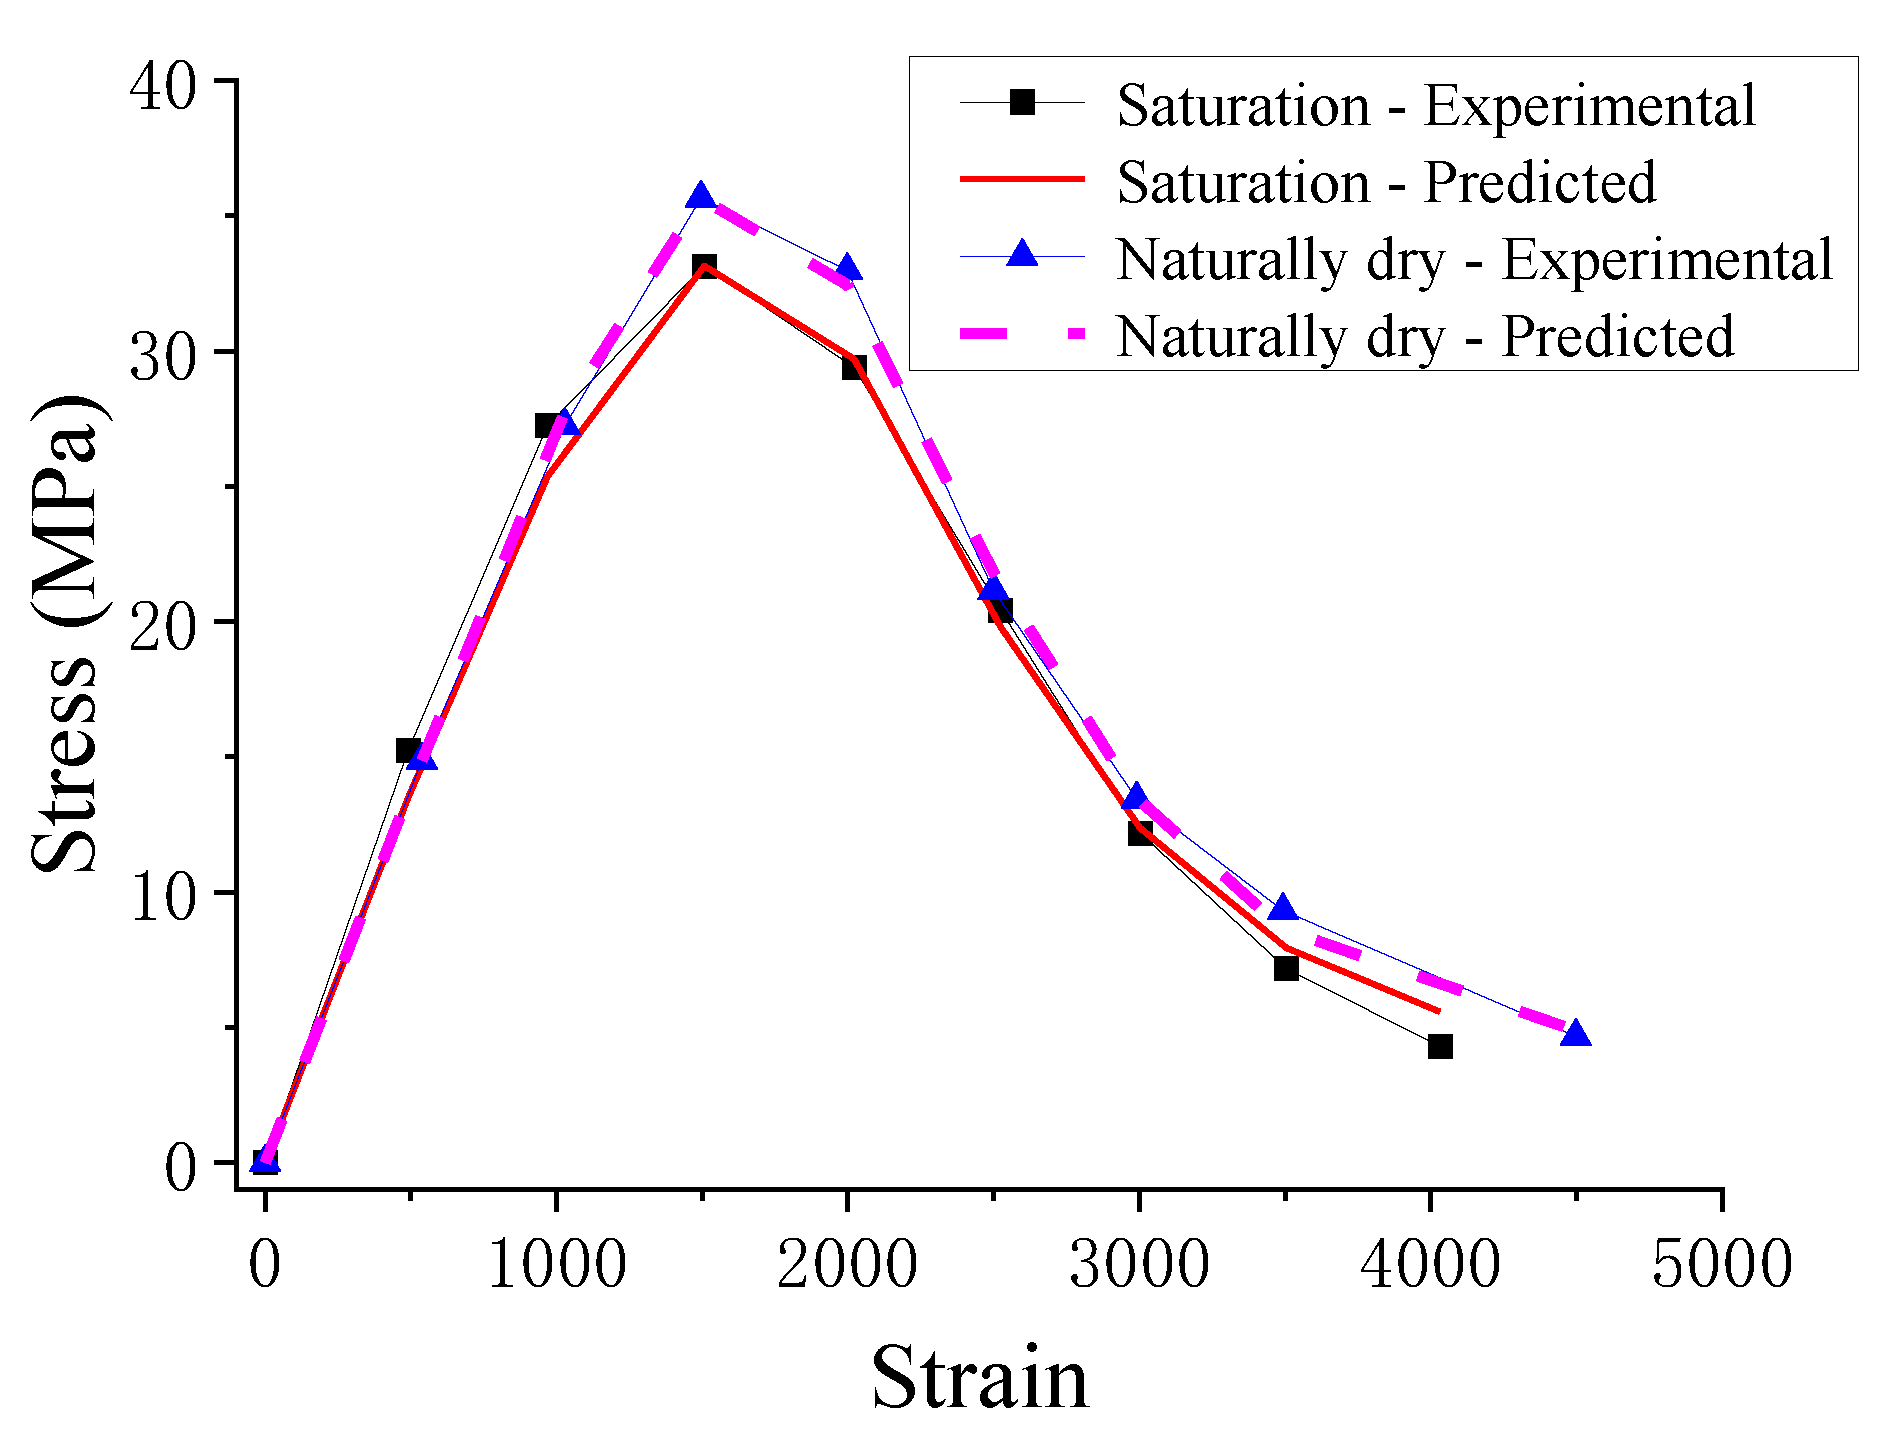
The model was capable of evaluating the mean and standard deviation of the stress–strain curve. The proposed model was validated by comparing the predicted and experimental results. The results show a good agreement between the predicted and experimental results. In addition, the predicted results based on the average stress–strain curves were compared with the experimental results.
(4)
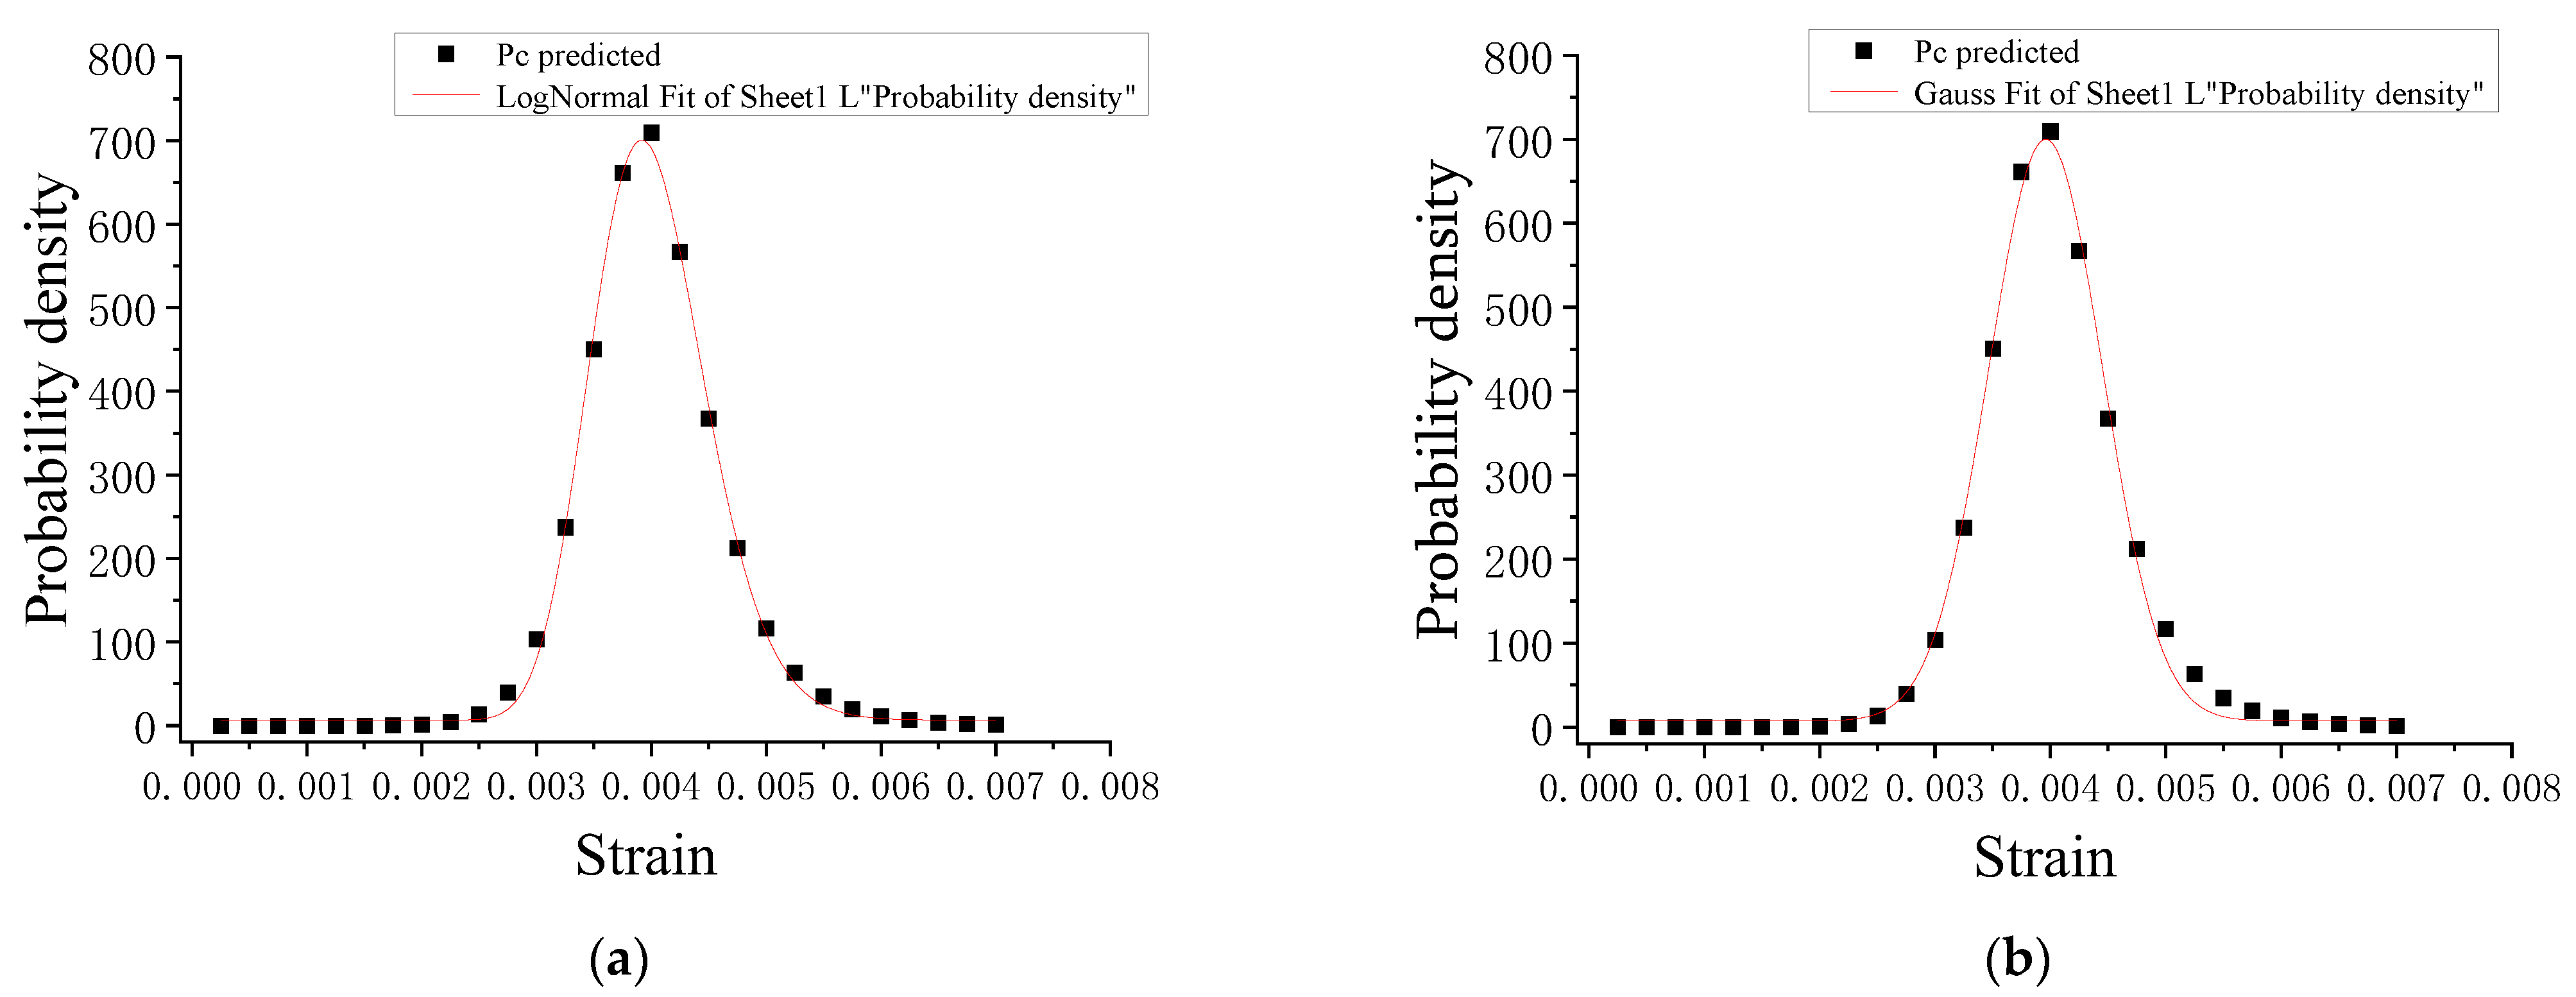
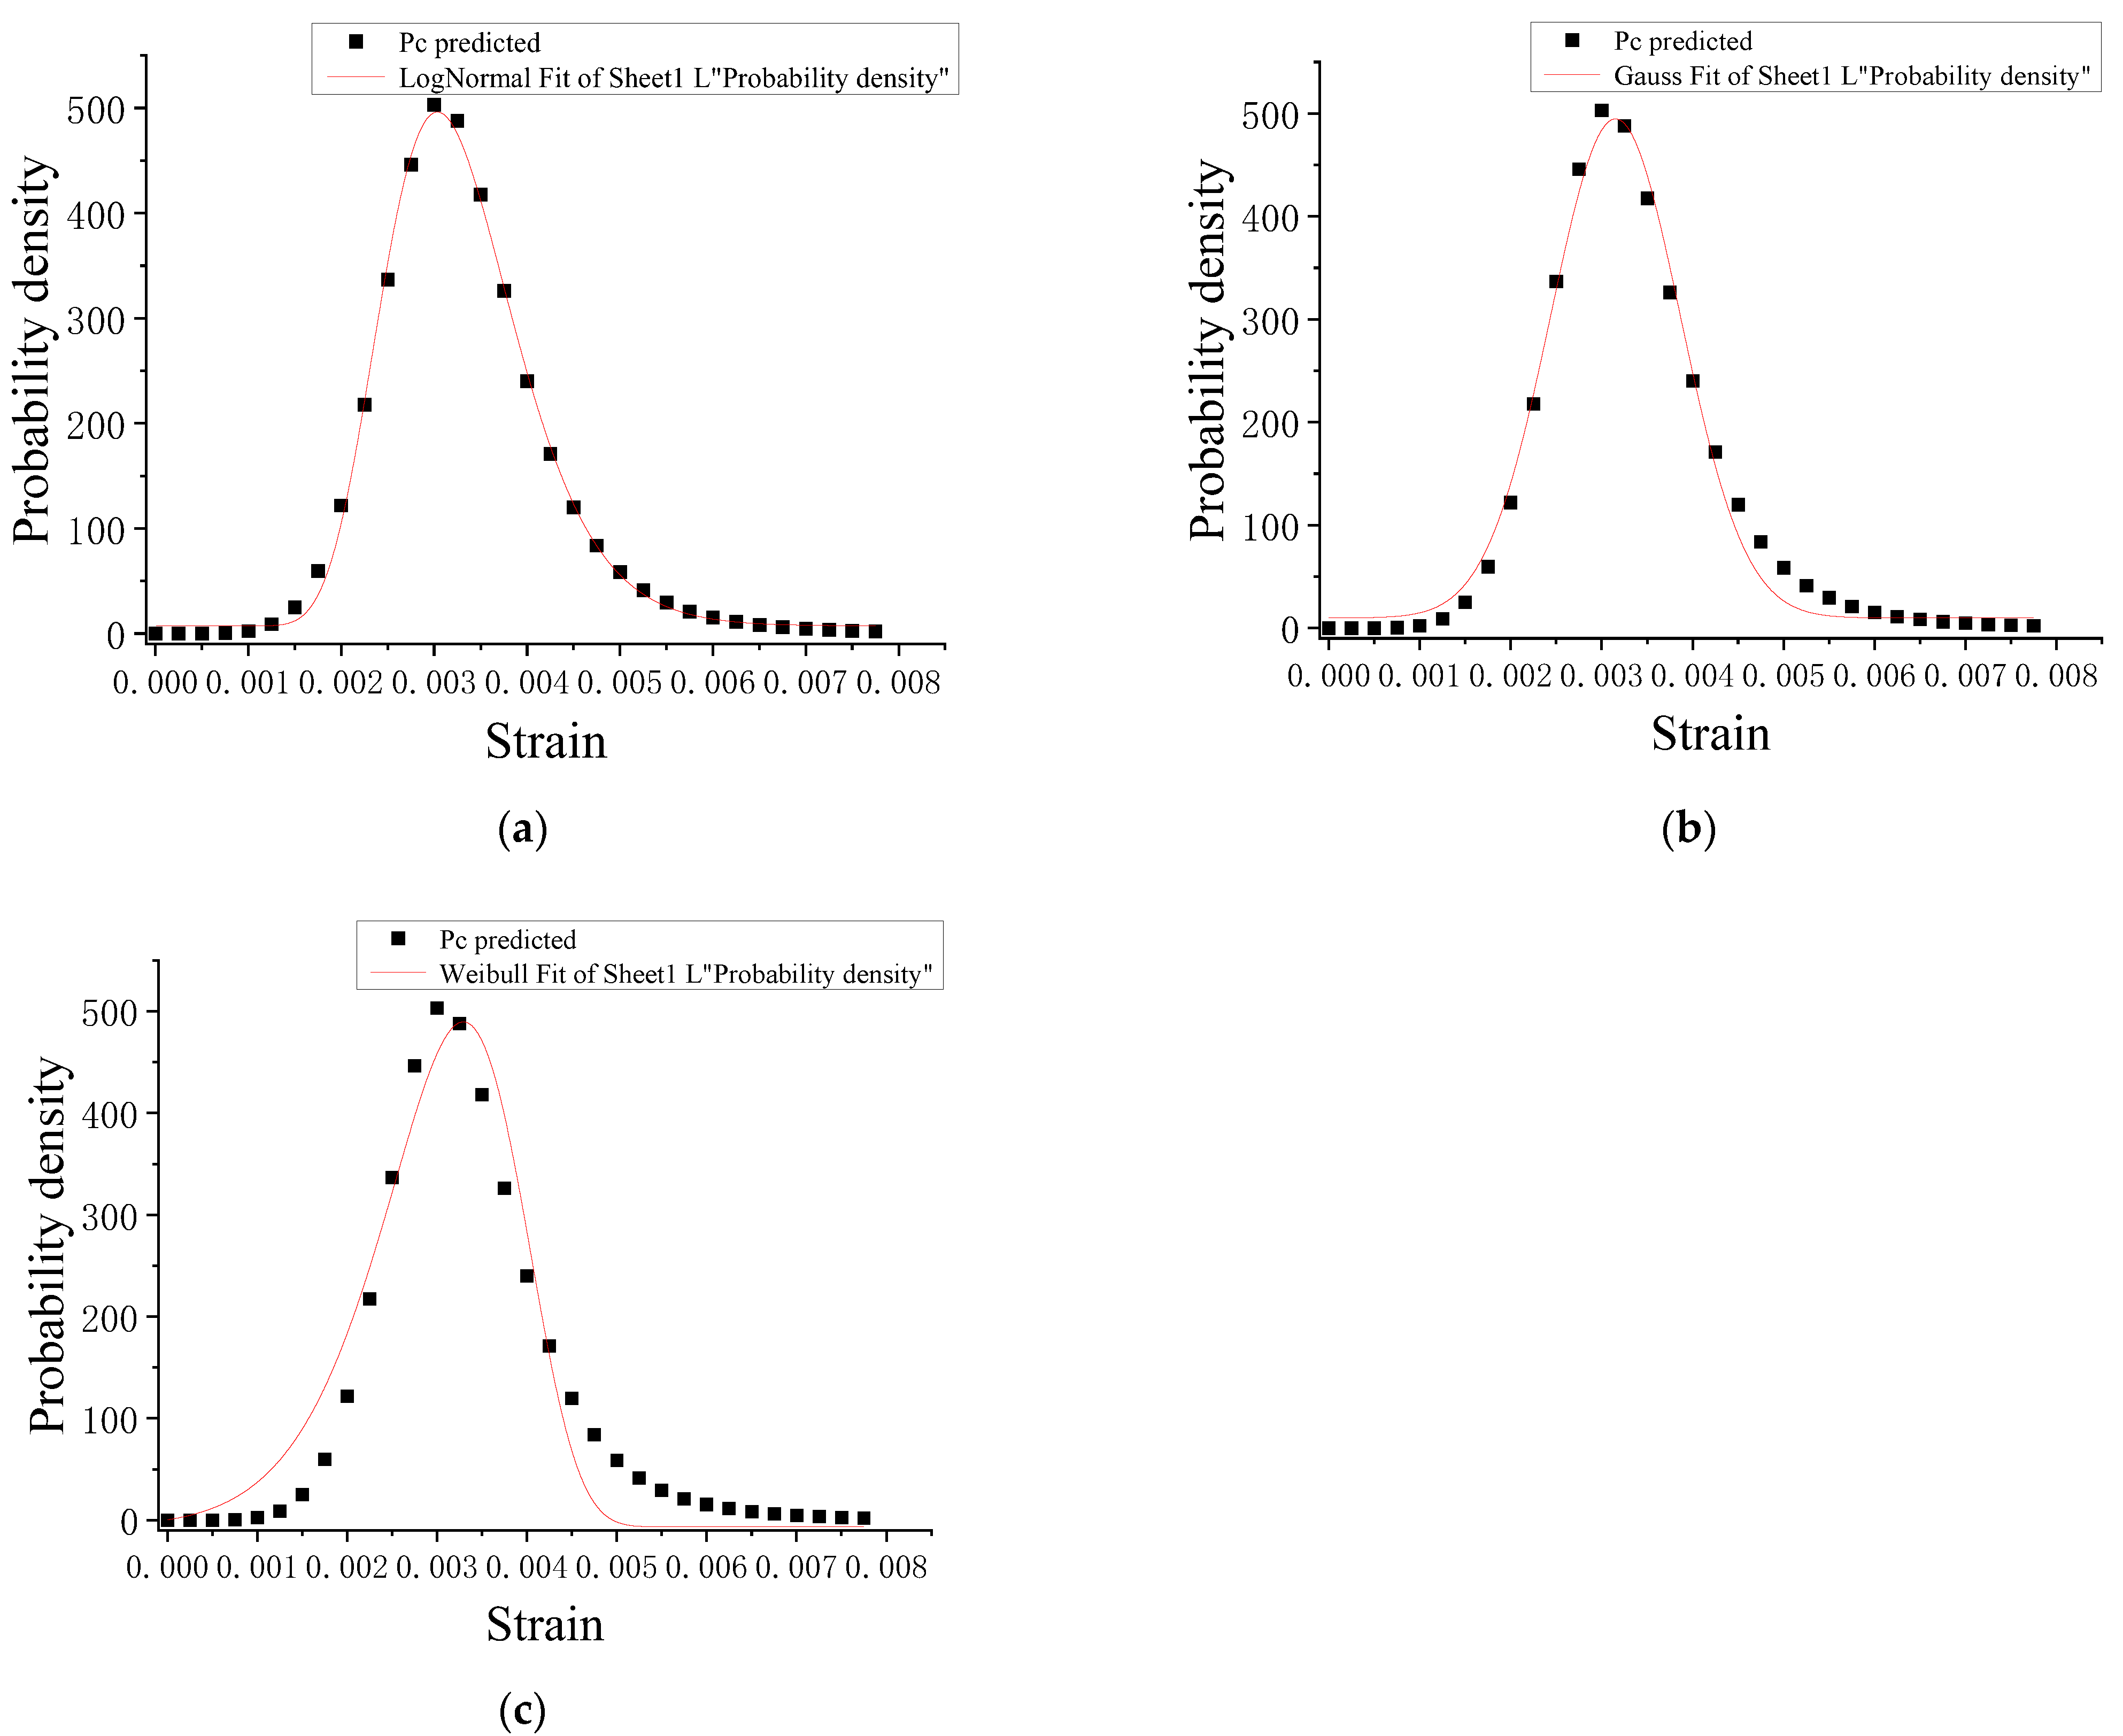
A further exploration of the behaviors of wet concrete was obtained by examining the media process in terms of transition from the microscale (microstructure) to the macroscale (macroresponse). It was found that the lognormal distribution density function can represent well the damage probability density for wet concrete under compression when compared to the Weibull and Gauss distribution density functions.
In the future, we will distribute and apply the research results obtained in this paper to further carry out research related to the mechanical properties of village building foundations considering the stochastic mechanical properties of concrete affected by different immersion times and provide theoretical support, such as stochastic damage model and their parameters, to the design and maintenance of village building structures. Moreover, with the development of new theories and techniques of artificial intelligence, such as machine learning, this paper will provide experimental information of training and learning for related theories and techniques. We will also try to introduce the related artificial intelligence theories and techniques into the study of the principal structure model, or even the research related to the design and maintenance of village and township building structures.

Author Contributions

Conceptualization, J.W. and Z.S.; methodology, J.W. and Z.S.; software, J.W. and Z.S.; validation, J.W., Z.S. and J.K.; formal analysis, J.W. and Z.S.; investigation, J.W. and Z.S.; resources, J.W. and Z.S.; data curation, J.W., Z.S. and J.K.; writing—original draft preparation, J.W. and Z.S.; writing—review and editing, Z.S. and J.K.; visualization, J.W. and Z.S.; supervision, J.W. and Z.S.; project administration, J.W. and Z.S.; funding acquisition, J.W. and Z.S. All authors have read and agreed to the published version of the manuscript.

Funding

This research was funded by the National Key R&D Program of China, grant number 2018YFD1100401; the National Natural Science Foundation of China (grant number U1934217); the China Energy Investment Corporation, grant number SHGF-18-50 and the Science and Technology Research and Development Program Project of China railway group limited (grant numbers, Major Special Project, No. 2020-Special-02 and Practical Technical Project, No. 2021-Major-02).

Institutional Review Board Statement

Not applicable.

Informed Consent Statement

Not applicable.

Data Availability Statement

The raw data supporting the conclusions of this article will be made available by the authors on request.

Conflicts of Interest

Authors Jing Wang and Zhi Shan were employed by the company Department of Transportation, Shuohuang Railway Development Co., Ltd., China Energy Investment Corporation. Zhi Shan were employed by the company China Railway Group Limited. The remaining authors declare that the research was conducted in the absence of any commercial or financial relationships that could be construed as a potential conflict of interest.

References

  1. Ma, B.; Chu, Y.; Huang, X.; Yang, B. Influence Mechanism of the Interfacial Water Content on Adhesive Behavior in Calcium Silicate Hydrate−Silicon Dioxide Systems: Molecular Dynamics Simulations. Appl. Sci. 2023, 13, 7930. [Google Scholar] [CrossRef]
  2. Beskopylny, A.N.; Stel’makh, S.A.; Shcherban’, E.M.; Mailyan, L.R.; Meskhi, B.; Chernil’nik, A.; El’shaeva, D.; Pogrebnyak, A. Influence of Variotropy on the Change in Concrete Strength under the Impact of Wet–Dry Cycles. Appl. Sci. 2023, 13, 1745. [Google Scholar] [CrossRef]
  3. An, M.; Liu, Y.; Zhang, G.; Wang, Y. Properties of Cement-Based Materials with Low Water—Binder Ratios and Evaluation Mechanism under Further Hydration Effect. Appl. Sci. 2023, 13, 9946. [Google Scholar] [CrossRef]
  4. Yang, G.; Lv, C. Experimental Study on Influence of Water Content on Compressive Strength of Concrete. J. Jiangsu Vocat. Coll. Constr. Technol. 2012, 12, 13–15. (In Chinese) [Google Scholar]
  5. Zhang, W.Y.; Chen, Y.J. Effect of different soaking times on the strength of concrete foundation pile core samples. Mod. Prop. (Up. J.) 2012, 11, 84–86. (In Chinese) [Google Scholar]
  6. Sathiparan, N.; Rumeshkumar, U. Effect of moisture condition on mechanical behavior of low strength brick masonry. J. Build. Eng. 2018, 17, 23–31. [Google Scholar] [CrossRef]
  7. Wang, W.; Lu, C.F.; Yuan, G.L.; Zhang, Y.L. Effects of pore water saturation on the mechanical properties of fly ash concrete. Constr. Build. Mater. 2017, 130, 54–63. [Google Scholar] [CrossRef]
  8. Liu, J.; Du, X.L.; Ma, G.W. Macroscopic effective moduli and tensile strength of saturated concrete. Cem. Concr. Res. 2012, 42, 1590–1600. [Google Scholar]
  9. Kaji, T.; Fujiyama, C. Mechanical Properties of Saturated Concrete Depending on the Strain Rate. Procedia Eng. 2014, 95, 442–453. [Google Scholar] [CrossRef]
  10. Shen, J.; Xu, Q. Effect of moisture content and porosity on compressive strength of concrete during drying at 105 °C. Constr. Build. Mater. 2019, 195, 19–27. [Google Scholar] [CrossRef]
  11. Zhang, Y.L.; Zhu, D.Y.; Yao, H.Y.; Li, Y.C.; Gao, G.F.; Ying, G.Z. Study on dynamic and static compression performance of concrete for dry and saturated state and its constitutive relationship. Build. Struct. 2015, 45, 23–27. (In Chinese) [Google Scholar]
  12. Bai, W.F.; Chen, J.Y.; Fan, S.L. The Statistical Dynamic Damage Constitutive Model of Saturated Concrete under Uniaxial Tension. J. Disaster Prev. Mitig. Eng. 2009, 29, 16–21. (In Chinese) [Google Scholar]
  13. Chen, Y.L.; Shao, W.; Zhou, Y.C. Ontogenetic model of uniaxial compression elastic-plastic damage in water-saturated concrete. Eng. Mech. 2011, 28, 59–63+88. (In Chinese) [Google Scholar]
  14. GB 175-2007; Common Portland Cement. Standard Press of China: Beijing, China, 2007.
  15. GB/T 50081-2019; Standard for Test Methods of Concrete Physical and Mechanical Properties. China Architecture & Building Press: Beijing, China, 2019. (In Chinese)
  16. Yaman, I.O.; Hearn, N.; Aktan, H.M. Active and non-active porosity in concrete Part I: Experimental evidence. Mater. Struct. 2002, 3, 102–109. [Google Scholar] [CrossRef]
  17. Lemaitre, J. Evaluation of Dissipation and Damage in Metals Submitted to Dynamic Loading; US Department of Commerce: Washingtone, DC, USA, 1971; pp. 16–19. [Google Scholar]
  18. Shan, Z. Stochastic Damage Model of Concrete and Its Application. Ph.D. Thesis, Central South University, Changsha, China, 2017. (In Chinese). [Google Scholar]
  19. GB50010-2020; Code for Design of Concrete Structures. China Architecture & Building Press: Beijing, China, 2020. (In Chinese)
  20. Gao, J. Study on Stochastic Damage Constitutional Relationship of Self-Compacting Concrete. Ph.D. Thesis, Central South University, Changsha, China, 2016. (In Chinese). [Google Scholar]
  21. Shao, W. Nonlinear Mechanical Analysis of Fatigue Damage of Concrete and Rock after the Effect of Changing Temperature and Soaking Water. Master’s Thesis, Shanghai University of Technology, Shanghai, China, 2010. (In Chinese). [Google Scholar]
  22. Shan, Z.; Zhiwu, Y. A fiber bundle-plastic chain model for quasi-brittle materials under uniaxial loading. J. Stat. Mech. Theory Exp. 2015, 11, P11010. [Google Scholar] [CrossRef]
Figure 1. Experiments of the mechanical properties of concrete under compression load after different immersion times. (a) Universal test machine. (b) Representative broken specimens after testing.
Applsci 14 00739 g001
Figure 2. Strength degradation ratio response depending on the moisture content.
Applsci 14 00739 g002
Figure 3. Strength degradation ratio response depending on the saturation.
Applsci 14 00739 g003
Figure 4. Experimental results of stress–strain curves for wet concrete under compression after different immersion times. (a) Baked specimens. (b) Specimens that were dried in air. (c) Specimens that were immersed for 6 h. (d) Specimens that were immersed for 12 h. (e) Specimens that were immersed for 24 h.
Applsci 14 00739 g004
Figure 5. Strength degradation ratio response depending on the immersion time [4].
Applsci 14 00739 g005
Figure 6. Strength degradation ratio response depending on the saturation.
Applsci 14 00739 g006
Figure 7. Elastic modulus increase variable response depending on the saturation.
Applsci 14 00739 g007
Figure 8. Heterogeneity of concrete materials (e.g., heterogeneity micro-defects and free water).
Applsci 14 00739 g008
Figure 9. Comparison of the experimental and theoretical curves for the concrete damage variable d under dry conditions. The test value of the concrete damage variable d was obtained using Equation (18b) from the literature [22].
Applsci 14 00739 g009
Figure 10. Probability density of the micro-damage thresholds of concrete under dry conditions.
Applsci 14 00739 g010
Figure 11. Comparison of the experimental and theoretical curves for the concrete damage variable d under 12 h immersion conditions.
Applsci 14 00739 g011
Figure 12. Probability density of the micro-damage thresholds of concrete under 12 h immersion conditions.
Applsci 14 00739 g012
Figure 13. Comparison of the predicted results of the σ-ε response of naturally dried and saturated concrete and the experimental results from the literature [21].
Applsci 14 00739 g013
Figure 14. Comparison of the predicted results of the σ-ε response of dry and saturated concrete and the experimental results from the literature [11].
Applsci 14 00739 g014
Figure 15. Comparison of the predicted results of the stochastic σ-ε response of dry concrete and the experimental results in this work.
Applsci 14 00739 g015
Figure 16. Comparison of the predicted random σ-ε response of wet concrete soaked for 12 h and the experimental results in this work.
Applsci 14 00739 g016
Figure 17. Probability density fitting for thresholds under dry conditions. (a) Lognormal distribution; (b) Gauss distribution.
Applsci 14 00739 g017
Figure 18. Probability density fitting for thresholds under 12 h immersion conditions. (a) Lognormal distribution; (b) Gauss distribution; (c) Weibull distribution.
Applsci 14 00739 g018
Figure 19. Mean σ-ε curves of concrete with different immersion times.
Applsci 14 00739 g019
Figure 20. Variation curves of the mean stress with the normalized strain for different immersion times.
Applsci 14 00739 g020
Figure 21. Variation curves of the normalized mean stress with the normalized strain for different immersion times.
Applsci 14 00739 g021
Table 1. Concrete mixture proportions.
Raw MaterialCementSandAggregateFASLPWater
Weight/kg·m330072011285050153
Table 2. Physical properties of cement.
Specific Surface Area
(m2 kg−1)
Loss on Ignition (%)Compressive Strength on 3 d
and 28 d (MPa)
Flexural Strength on 3 d and
28 d (MPa)
3161.833.3 and 61.95.9 and 8.5
Table 3. Physical properties of pelletized sand.
Apparent Density
(g/cm3)
Moisture
Content (%)
Water Absorption
Rate (%)
Clay Content (%)Mud Content (%)Soundness (%)Chloride
Content (%)
2.640.040.4002.00
Table 4. Specimen details.
Specimen TypeCubic SpecimensPrismatic Specimens
Size/mm150 × 150 × 150100 × 100 × 300100 × 100 × 300100 × 100 × 300100 × 100 × 300100 × 100 × 300
NumberingB-1A-1, A-2F-1E-1C-1D-1
B-2A-3, …, A-8F-2E-2C-2D-2
B-3A-9, A-10F-3E-3C-3D-3
Curing methodStandard curingBy keeping them wet under plastic sheeting for 28 days
Preparation Dried in the air on an indoor ground for 28 daysDried in the air on an indoor ground for 28 days and then baked at 50 ± 2 °C for 48 hDried in the air on an indoor ground for 28 days and then immersed in tap water for 6 hDried in the air on an indoor ground for 28 days and then immersed in tap water for 12 hDried in the air on an indoor ground for 28 days and then immersed in tap water for 24 h
Table 5. Loading rate.
Specimen GroupACDEFB
Load stageBefore peak → After peak
Loading rate300 kN/min → 0.18 mm/min600 kN/min → 0.36 mm/min
Table 6. Experimental results of the saturation, strength, and strength deterioration of wet concrete.
Specimen GroupImmersion Time t (h)Average Mess m (kg)Average Moisture Content kAverage Saturation wAverage Strength fc (MPa)Strength Deterioration Ratio ds
ABaked7.1800.0000.00043.6200.000
BDried in air7.2560.01050.44437.9570.130
CStandard curing///42.588/
D67.2750.01320.55838.1690.125
E127.3330.02140.90133.1290.241
F247.3500.02370.99935.6420.183
Table 7. Suggested parameter values for the damage model of dry concrete under uniaxial compression.
fck (Mpa)20253035404550556065707580
fcm (Mpa)30.336.341.847.953.860.566.272.278.184.691.197.6104.2
Ec (Gpa)26.328.830.932.433.534.535.536.637.137.638.138.639.1
Ac,10.003
4
0.005
4
0.004
9
0.003
1
−0.00
09
−0.00
57
−0.01
08
−0.01
44
−0.02
38
−0.03
56
−0.05
11
−0.07
30
−0.10
94
Ac,21111111111111
xc,01.0611.1201.1701.2111.2531.2851.3021.3181.3371.3491.3541.3491.335
pc2.2182.4912.7583.0153.2973.5603.7763.9884.2194.4064.5494.6194.621
δc0.2060.1890.1720.1640.1560.1560.1490.1450.1410.1410.1410.1410.141
εc,k (10−6)1470156016401720179018501920198020302080213021902240
εcuc,k3.02.62.32.12.01.91.91.81.81.71.71.71.6
Table 8. The parameter values suggested for the coefficient evolution of the standard deviation of stress for dry concrete under compression.
fck (Mpa)20253035404550556065707580
fcm (Mpa)30.336.341.847.953.860.566.272.278.184.691.197.6104.2
δc0.2060.1890.1720.1640.1560.1560.1490.1450.1410.1410.1410.1410.141
Vσc6.266.877.177.848.399.429.8510.4611.0011.9112.8313.7414.71
kδc2.041.871.701.621.541.541.481.441.401.401.401.401.40
εc,k (10−6)1470156016401720179018501920198020302080213021902240
Disclaimer/Publisher’s Note: The statements, opinions and data contained in all publications are solely those of the individual author(s) and contributor(s) and not of MDPI and/or the editor(s). MDPI and/or the editor(s) disclaim responsibility for any injury to people or property resulting from any ideas, methods, instructions or products referred to in the content.

