Abstract
A propagation of ultrawideband electromagnetic pulses (UWB EMPs) through magnetized plasma has been experimentally studied using a “gigantic” coaxial line, which has been developed at IAP RAS for laboratory modeling of ionospheric effects. This coaxial line is 1.4 m in diameter and 10 m in length and is installed inside the chamber of the large-scale Krot plasma device. The line can be filled with rf inductively coupled plasma, magnetized or not. It allows one to explore the propagation of UWB EMPs in plasma along a long path without refraction and divergence and obtain a physical picture of EMP transformation. Under conditions where the duration of the UWB EMP is comparable to the period of electron plasma oscillations (fp−1), the period of cyclotron rotation of electrons (fc−1), or even significantly shorter, a complex of effects of transformation of the waveform and frequency spectrum of the pulse occurs. Without ambient magnetic field, a UWB EMP is distorted due to the effects of the cutoff and frequency dispersion. In dense magnetized plasma, i.e., when fp >> fc, the UWB EMP breaks into two wave packets, the high-frequency one (f > fp) and low-frequency one (f < fc). In rare magnetized plasma (fp << fc), the cyclotron absorption produces a long train of damped oscillations at a frequency close to the cyclotron frequency fc following the UWB EMP.
1. Introduction
The effects arising during the propagation of electromagnetic pulses (EMPs) in plasma media with dispersion and resonance absorption are of importance for fundamental science and various applications. Particularly, the EMPs excited by man-made [1,2] and natural sources, e.g., lightning discharges [3], can be used for diagnostics of the near-Earth plasma. The prospects of developing new transionospheric communication channels are associated with the technology of ultrawideband (UWB) EMPs. In any case, it is necessary to predict distortions in the shape of the signal during propagation in the near-Earth plasma [4,5,6].
The ionospheric plasma in the magnetic field of the Earth is an anisotropic and gyrotropic medium characterized by a whole set of resonance frequencies and cutoff windows of the electromagnetic radiation [7]. An EMP excited by a ground-based, atmospheric, or ionospheric source and propagating in such a medium can experience strong distortions in its shape and spectrum in its ionospheric path. Interpretation of the observations can be complicated significantly by the nonlinear effects stimulated by powerful EMPs, primarily the ionization effects [8,9]. At present, numerical models are actively being developed, which allow predicting the shape of an EMP as the pulse propagates through the atmosphere and ionosphere [10,11,12]. At the same time, a rather promising approach, which is important for both verification of the developed models and physical demonstration of possible effects, is laboratory simulation performed in special laboratory plasma devices and based on the similarity parameters [13].
Currently, the technologies of generation and direct (real-time) oscilloscopic registration of UWB EMPs are available to researchers range in pulse duration from 0.1 ns to 1 ns with an amplitude up to several hundreds of kV [1,14]. However, laboratory simulation of the propagation of EMPs excited by the antennas used in field experiments [15] runs into fundamental and even insurmountable difficulties caused by the refraction and parasitic reflections of the EMPs from the walls of the plasma chambers [16] even in a large column of highly uniform plasma.
On the other hand, it is possible to ensure EMP propagation in plasma along an extended path without refraction losses by using symmetric or coaxial transmission lines installed in the plasma chamber and excited by a pulse generator. This model experiment scenario was first implemented in the late 1970s with compact—about 1 m long—strip lines [17]. However, even in this case estimates and experiments show that the length of the propagation path of nano- and subnanosecond UWB EMPs in plasma should be at least several meters to allow observation of the dispersion and nonlinear effects [16]. Therefore, handling the problems to solve requires large-scale plasma devices anyway. It was only recently possible to create a transmission line that makes it possible to experimentally simulate the propagation of UWB EMPs along a long path in a transparent plasma.
In Russia, the largest device for simulation of physical phenomena in the atmosphere and ionosphere is the Krot device at the Institute of Applied Physics of the Russian Academy of Sciences [18]. Recently, a new scientific instrument (a “gigantic” plasma-filled coaxial line, GCL) has been added to this device. The GCL was described in full detail in [19] and allows one to study the interaction of EMPs with durations from 300 ps with gases and plasmas including magnetized ones. Today, this is the only instrument of its kind that makes it possible to experimentally study linear and nonlinear effects in plasma during the passage of a UWB EMP along a path with a total length of about 10 m. The preliminary experimental results obtained by using the GCL were published in [20]. These results are qualified as linear dispersion distortions of the UWB EMP shape in a line filled with an isotropic (unmagnetized) plasma, which were also studied analytically and by the methods of numerical FDTD simulation [21].
In this paper, we present the first results of studying experimentally the propagation of a subnanosecond UWB EMP in a GCL filled with quasiuniform magnetized plasma in a wide range of electron densities Ne (plasma frequencies, fp). To the best of our knowledge, this experimental configuration was implemented for the first time. Previously, the propagation of relatively long-duration (several hundred ns) EMPs in a magnetized plasma was experimentally studied under conditions where the pulse excited low-frequency whistler waves only with frequencies below the electron cyclotron frequency, f < fc [22]. Here, the EMP duration was chosen to be so short that it allowed us to simulate a wideband response of the magnetized plasma in all physically meaningful frequency (f) ranges, both above fp and below and around fc. Moreover, the absence of refraction divergence and, correspondingly, the quasiunidimensional propagation of the EMP in a magnetized plasma inside the GCL allows one to obtain additional experimental information about the balance of the energy injected into the plasma in the form of an EMP in terms of the functions (or coefficients) of transmission, reflection, and absorption [23]. When complemented with the theory of coaxial waveguides filled with magnetized plasma, which is developed for quasimonochromatic signals [24], this approach can be efficient for interpretation of the results of natural experiments and prediction of linear and nonlinear effects during propagation of EMPs from various sources including pulsed radiators and lightning discharges.
2. Description of the Experiment
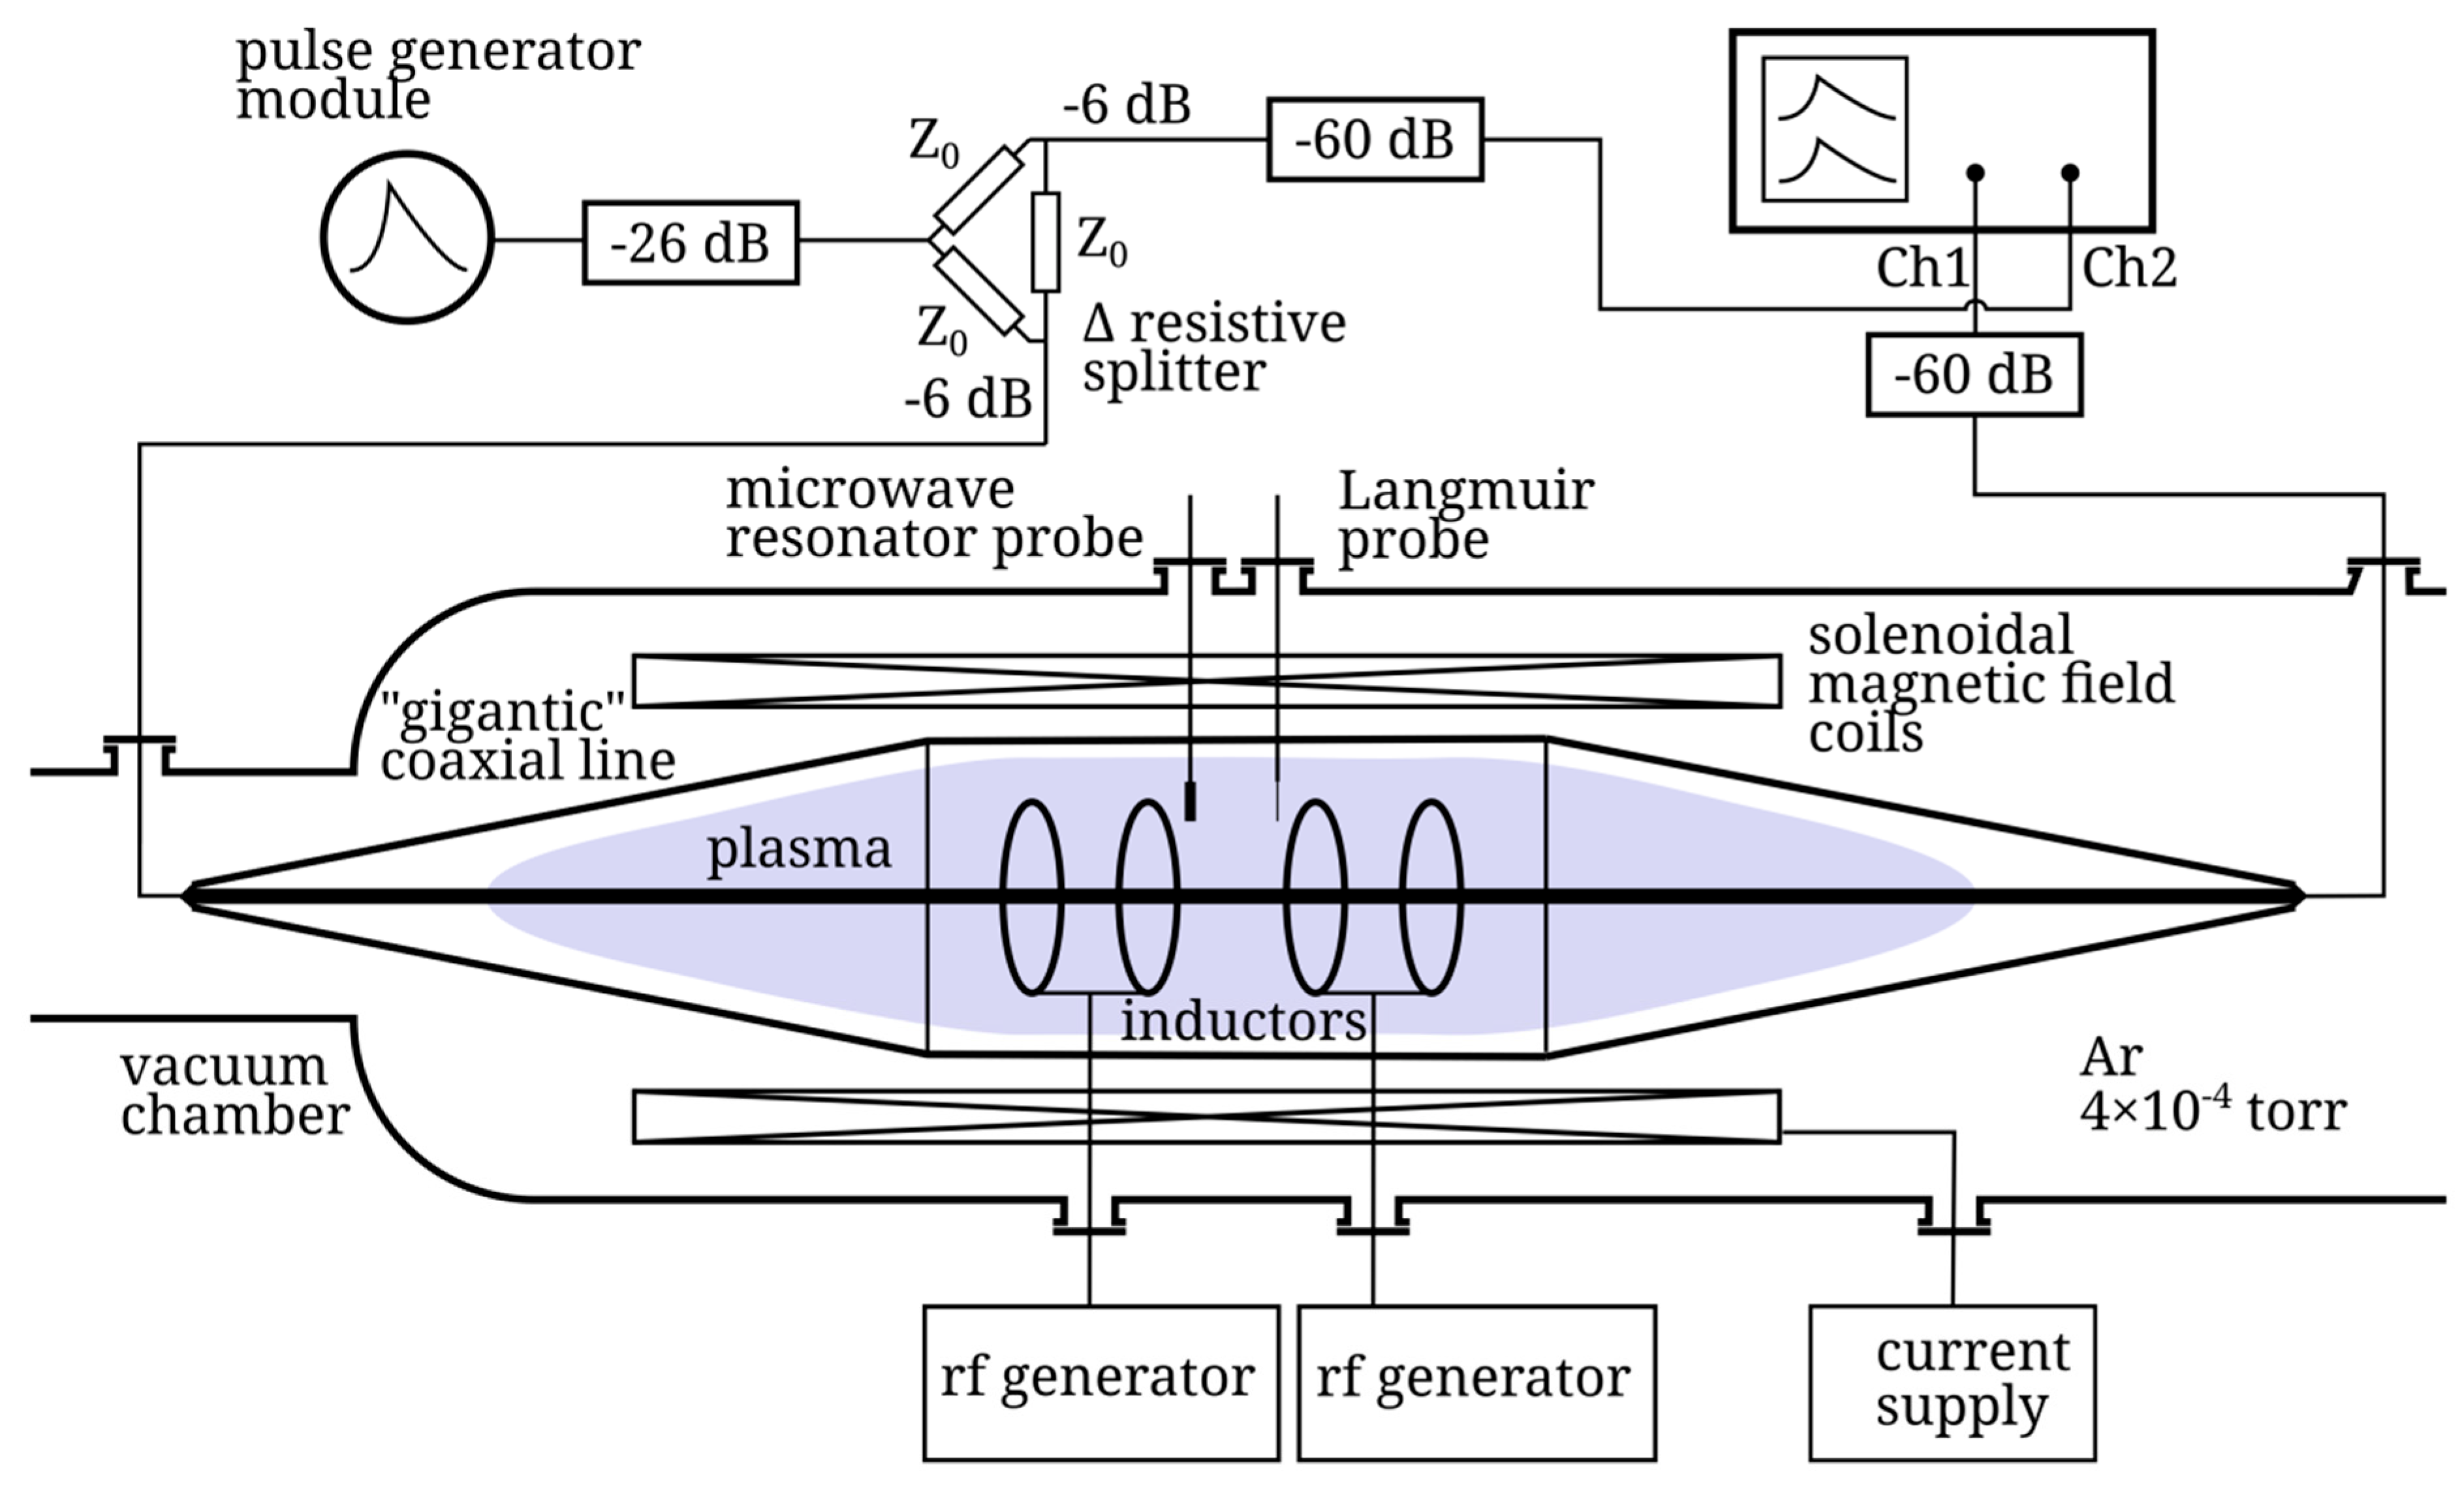
The experiments were performed using the gigantic coaxial line (GCL) [19,20] installed inside the chamber of the large-scale Krot plasma device (Figure 1). This device is used for simulating space plasma and is described in detail in [18]. It is a vacuum chamber with a volume of about 170 cubic meters, in which a large quasiuniform plasma column can be produced using several pulsed radio-frequency (rf) generators. In experiments, various working gases can be used in continuous injection mode; the most commonly used are argon, helium, and air. The plasma is magnetized using a solenoid 3.5 m long and 1.5 m in diameter installed inside the chamber.
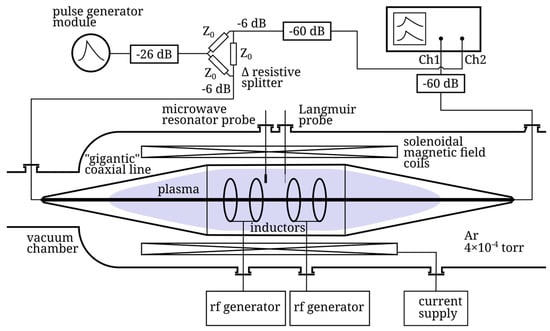
Figure 1.
Schematic diagram of the experimental setup.
The GCL is installed within a solenoid. It consists of three sections, specifically, the 3 m long working segment and two tapering transitions that are 3.5 m long each, which act as wave transformers (see Figure 1). The diameters of the external and internal conductors of the working segment are 140 cm and 8 cm, respectively. The wave impedance of the working segment in vacuum is 170 Ohm, and the input and output impedances are 50 Ohm. The external conductor of the coaxial line is assembled from metal strips about 10 cm wide each. The internal conductor is a solid metal pipe, which is supported in place relative to the external conductor with polyamide spokes and rings.
The line was filled with plasma by means of pulsed rf inductive discharge in argon under the pressure p = 4 × 10⁻⁴ Torr. Argon is used as an accessible and relatively inexpensive noble gas, which makes it possible to obtain slowly decaying plasma with well-reproducible parameters. Four induction coils (or inductors) 90 cm in diameter were installed inside the working segment of the line at a distance about 75 cm from each other, which ensured sufficiently uniform filling of the line with the plasma. The inductors were excited in pairs in parallel by two rf generators. The rf power applied to each couple of inductors was about 100 kW, the frequency was 5 MHz, the duration of the ionizing pulse was 1 ms, and the repetition rate of the ionizing pulses was one every 20 s.
The parallel (axial) magnetic field with strength from zero to several hundreds of Gauss (G) was generated by a pulsed current in solenoid as shown in Figure 1. The ionizing rf pulse was applied to inductors as the current in the solenoid reached its maximum value. The characteristic time of the current (and magnetic field) variation was about 100 ms and significantly exceeded the characteristic times of plasma production and decay. All the results presented in this paper were obtained at the magnetic field strength with the maximum of the solenoid current being B0 max = 90 G (fc max = 252 MHz).
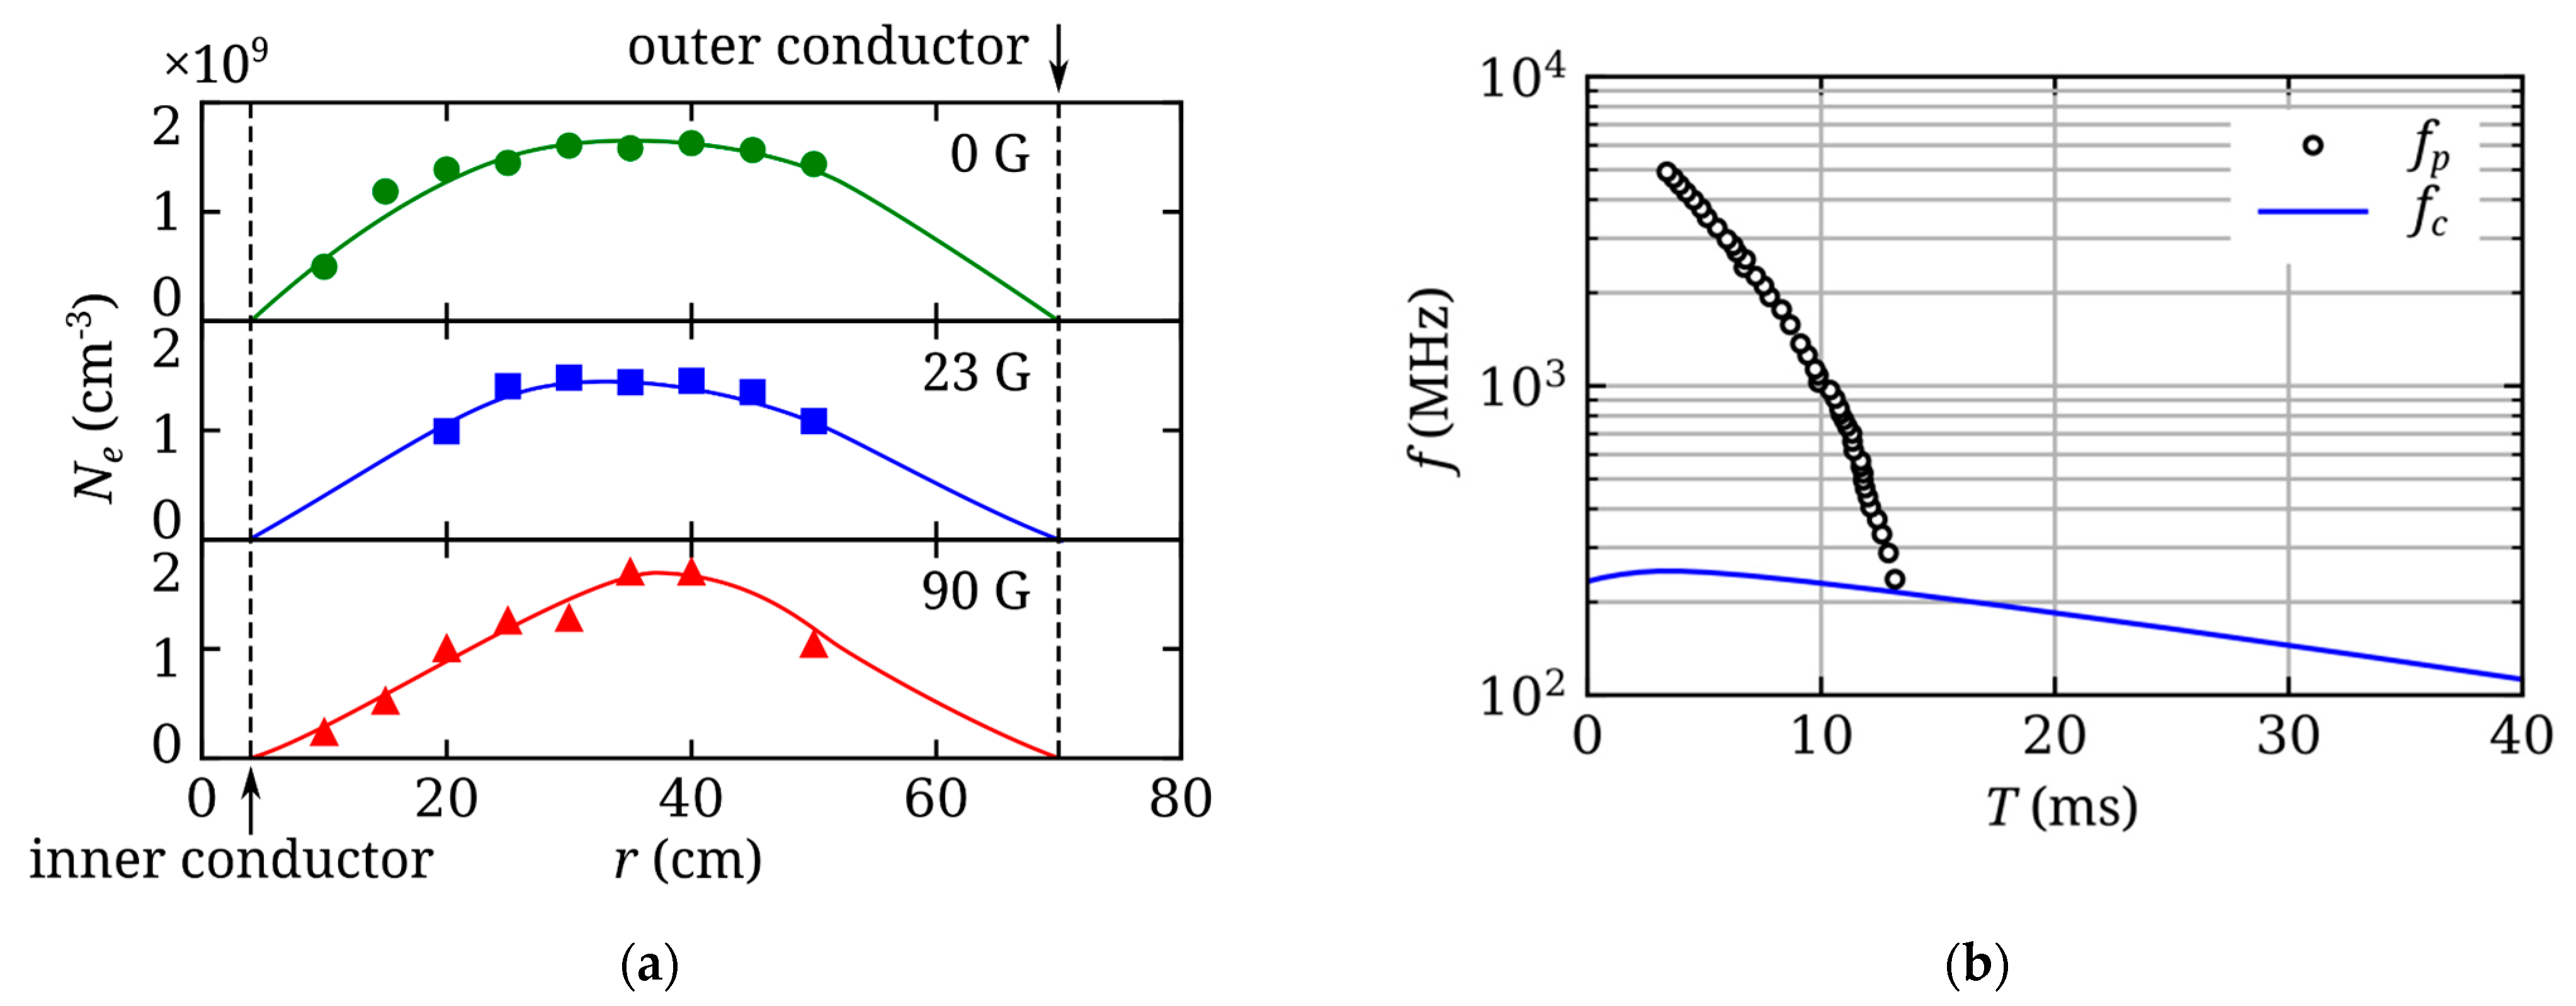
All the measurements were performed after the end of the ionizing pulse in quiescent afterglow plasma. The plasma parameters were measured by means of microwave resonator probes based on sections of the double lines with resonance frequencies of 930 MHz and 2650 MHz [25,26] and a Langmuir probe. The probes were mounted on rods which can be moved in the radial direction freely to obtain the profiles of plasma parameters. Microwave resonator probes were used to measure the plasma density; the Langmuir probe data were mainly used to obtain the electron temperature. The maximum plasma density (Ne~1011 cm−3, fp~2.85 GHz) was reached by the end of the ionizing pulse. Then, the electron density decreases due to the diffusion decay of the plasma with a characteristic time of about 2 ms. The electron temperature at the end of ionizing pulse was several eV and relaxed to Te~0.2–0.3 eV during several hundreds of microseconds. The measurements showed that the decaying plasma density distribution across the GCL was quasiuniform (bell-shaped). The maximum of the density distribution was around r = 35–40 cm, and its width decreased slightly as the magnetic field strength increased from 0 to 90 G (Figure 2a). The dynamics of the decaying plasma density or electron plasma frequency measured at the maximum of the radial distribution and the magnetic field or cyclotron frequency, which was realized in the experiment, are presented in Figure 2b.
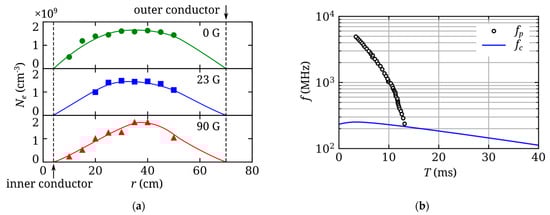
Figure 2.
(a) Radial distributions of the decaying plasma density filling the GCL with or without a magnetic field. (b) Time dependences of the electron plasma frequency and the electron cyclotron frequency in the case of magnetized plasma. The time is reckoned from the end of the ionizing pulse.
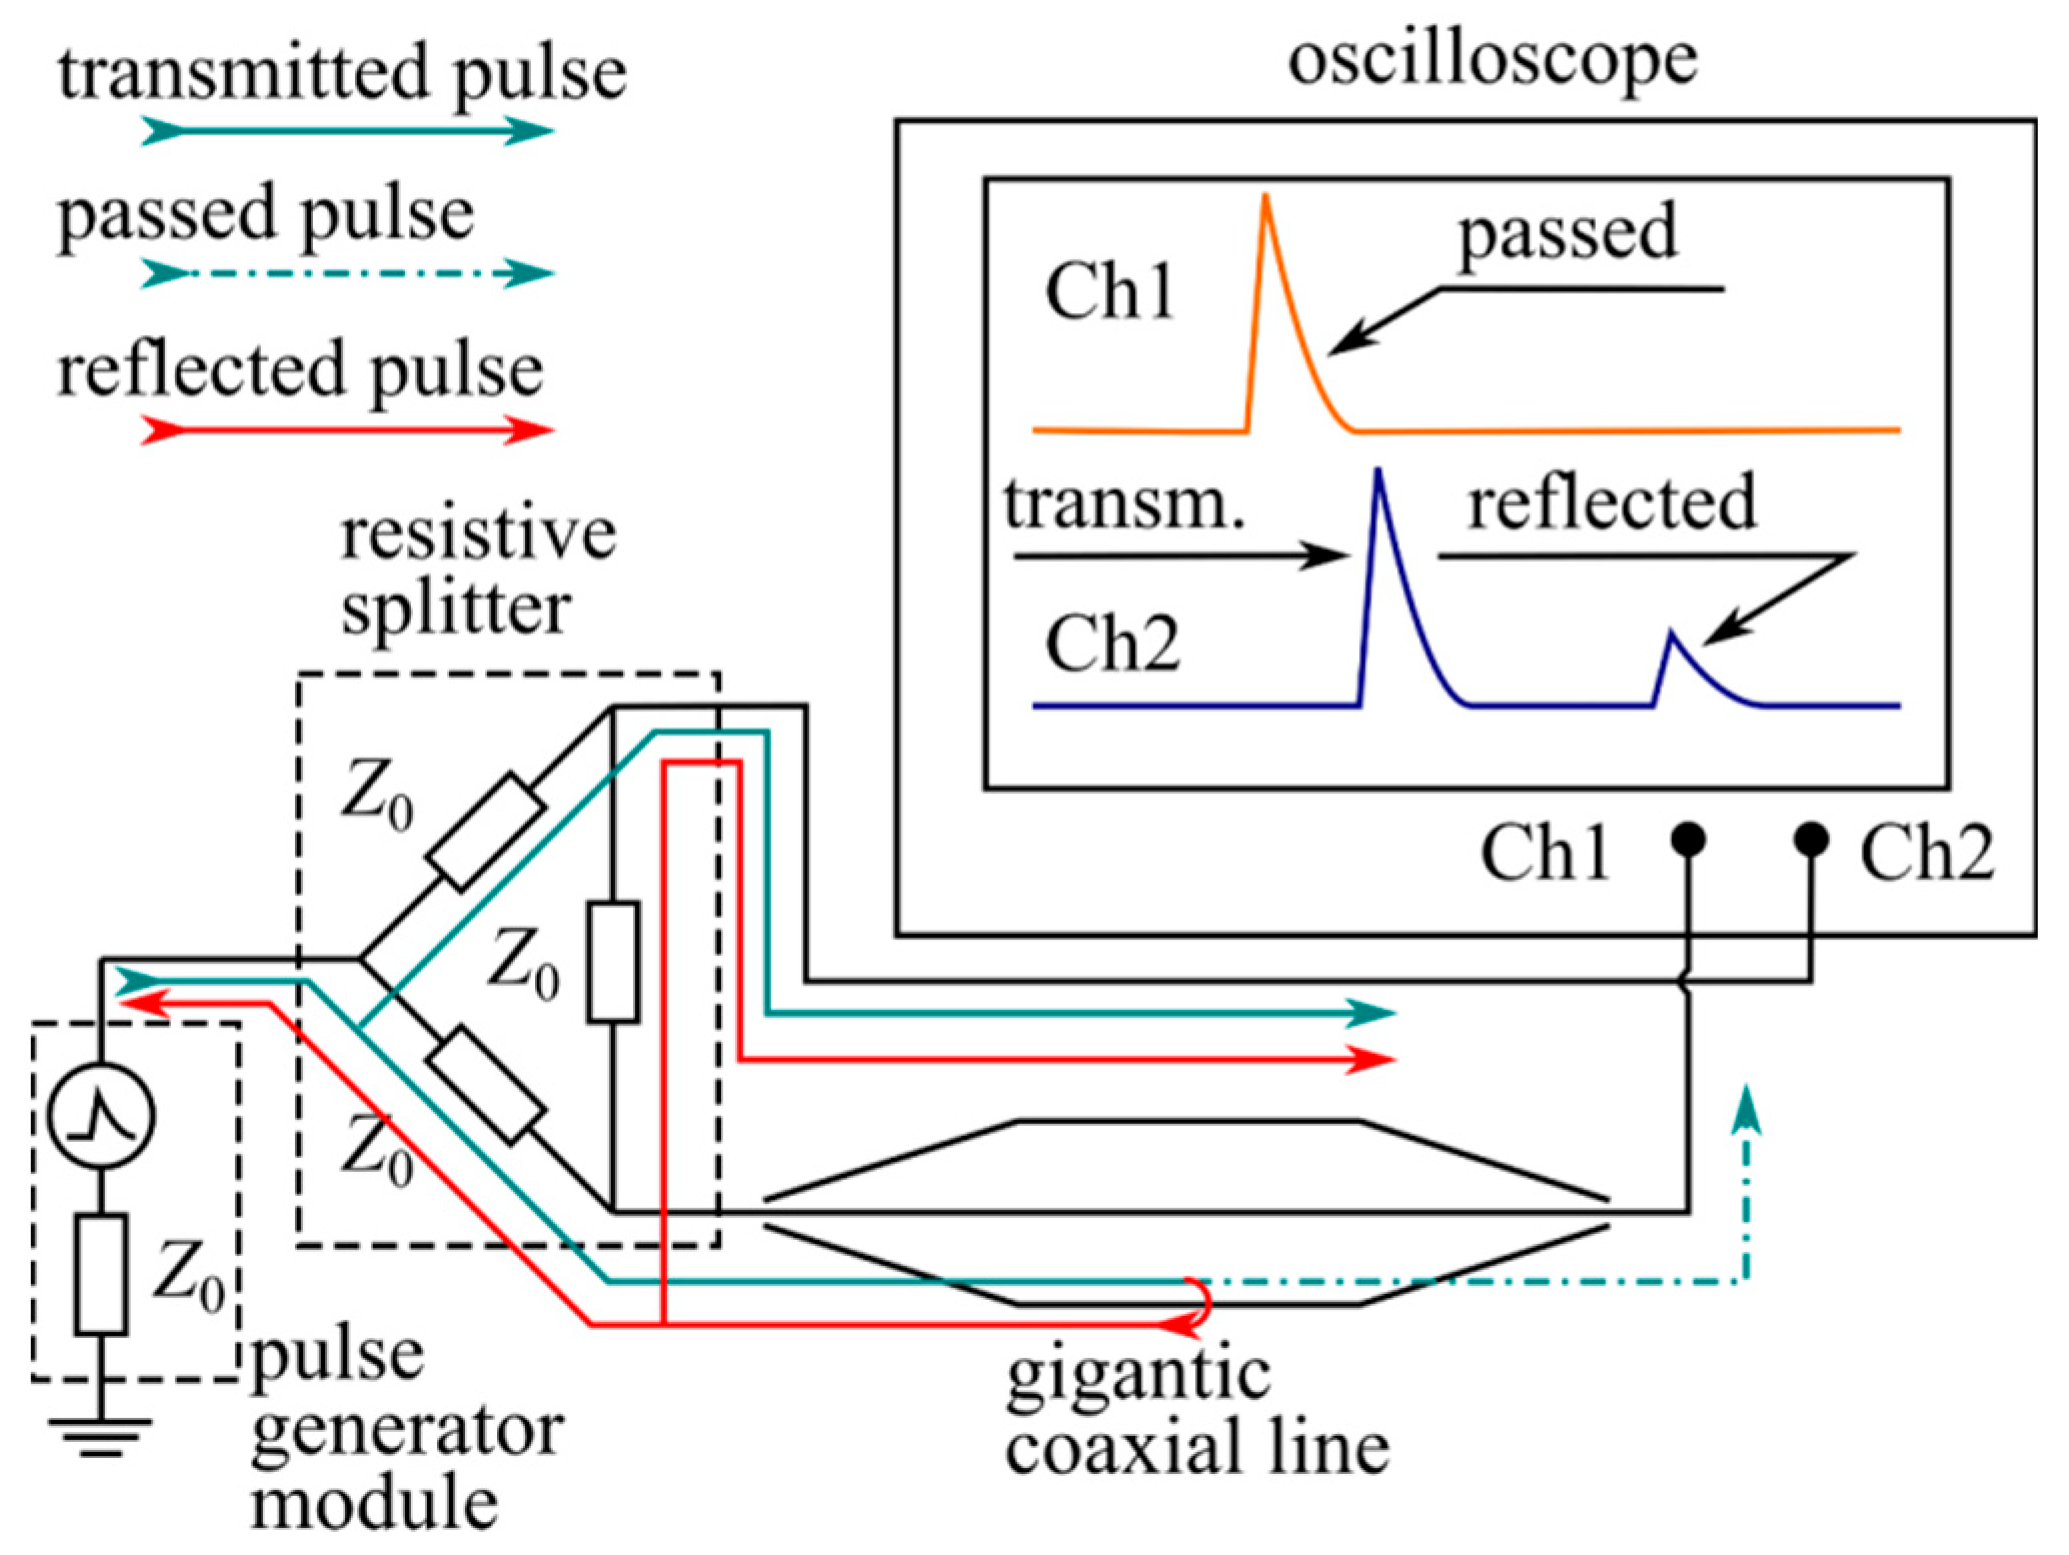
The EMP was excited by the PPM0731 pulse generator module (manufactured by Megaimpulse Ltd., St. Petersburg, Russia), which formed unipolar 6 kV pulses, whose rising time was τf < 200 ps, and the half-height duration was τw~1 ns. The generator was protected against the reflected signal and the interference of the ionizing pulse by means of an attenuator (Figure 1). After the attenuator, the pulse fell on the delta resistive splitter, forming a reference signal, which was fed to the detecting equipment via the attenuator, and a main pulse fed to the GCL input. The amplitude of the pulses in the line was attenuated down to a level of 75 V. The test experiments demonstrated that, at this level, the nonlinear effects in plasma had not started developing yet. The reference signal contained both the incident pulse and GCL-reflected pulse. The incident and reflected pulses were separated in time by ~30 ns, which allowed analyzing them independently. The scheme, which explains the formation of the pulsed signals and delays between them, is shown in Figure 3. On passing through the line, the main pulse was attenuated by means of the attenuator and fed to the input of the Tektronix MDO64 digital oscilloscope with a passband of 8 GHz and a sampling rate of 25 gigasamples/s. The attenuator at the GCL output reduced the pulse amplitude to the level which allowed detecting it with the oscilloscope, on the one hand, and protected the oscilloscope against the interference of the ionizing pulse, on the other.

Figure 3.
Scheme of generation and reception of EMP signals using the resistive splitter (attenuators are not shown).
The EMPs in the experiments were excited in the line as a periodic sequence with a duration of 40 ms and an interval of 100 μs between the pulses. The specific values of the plasma density, at which the data about the shape and spectrum of the ultrawideband pulse (UWB EMP) were obtained, corresponded to different delay times T of EMP transmission relative to the end of the ionizing pulse.
When preparing the experiments, special attention was paid to the effects of parasitic reflection of EMPs from dielectric parts of the GCL structure and rf inductors. It was found that radial dielectric spokes lead to the appearance of reflected signals at a level of several percent of the amplitude of the transmitted signal; these signals arrive with significant (on the order of several ns) delays and do not interfere with measurements. The level of EMP reflection from rf inductors is even lower, possibly due to the small effective area of the wires, and also because the inductor wires are perpendicular to the electric field vector of the EMP propagating in the GCL.
3. Experimental Results
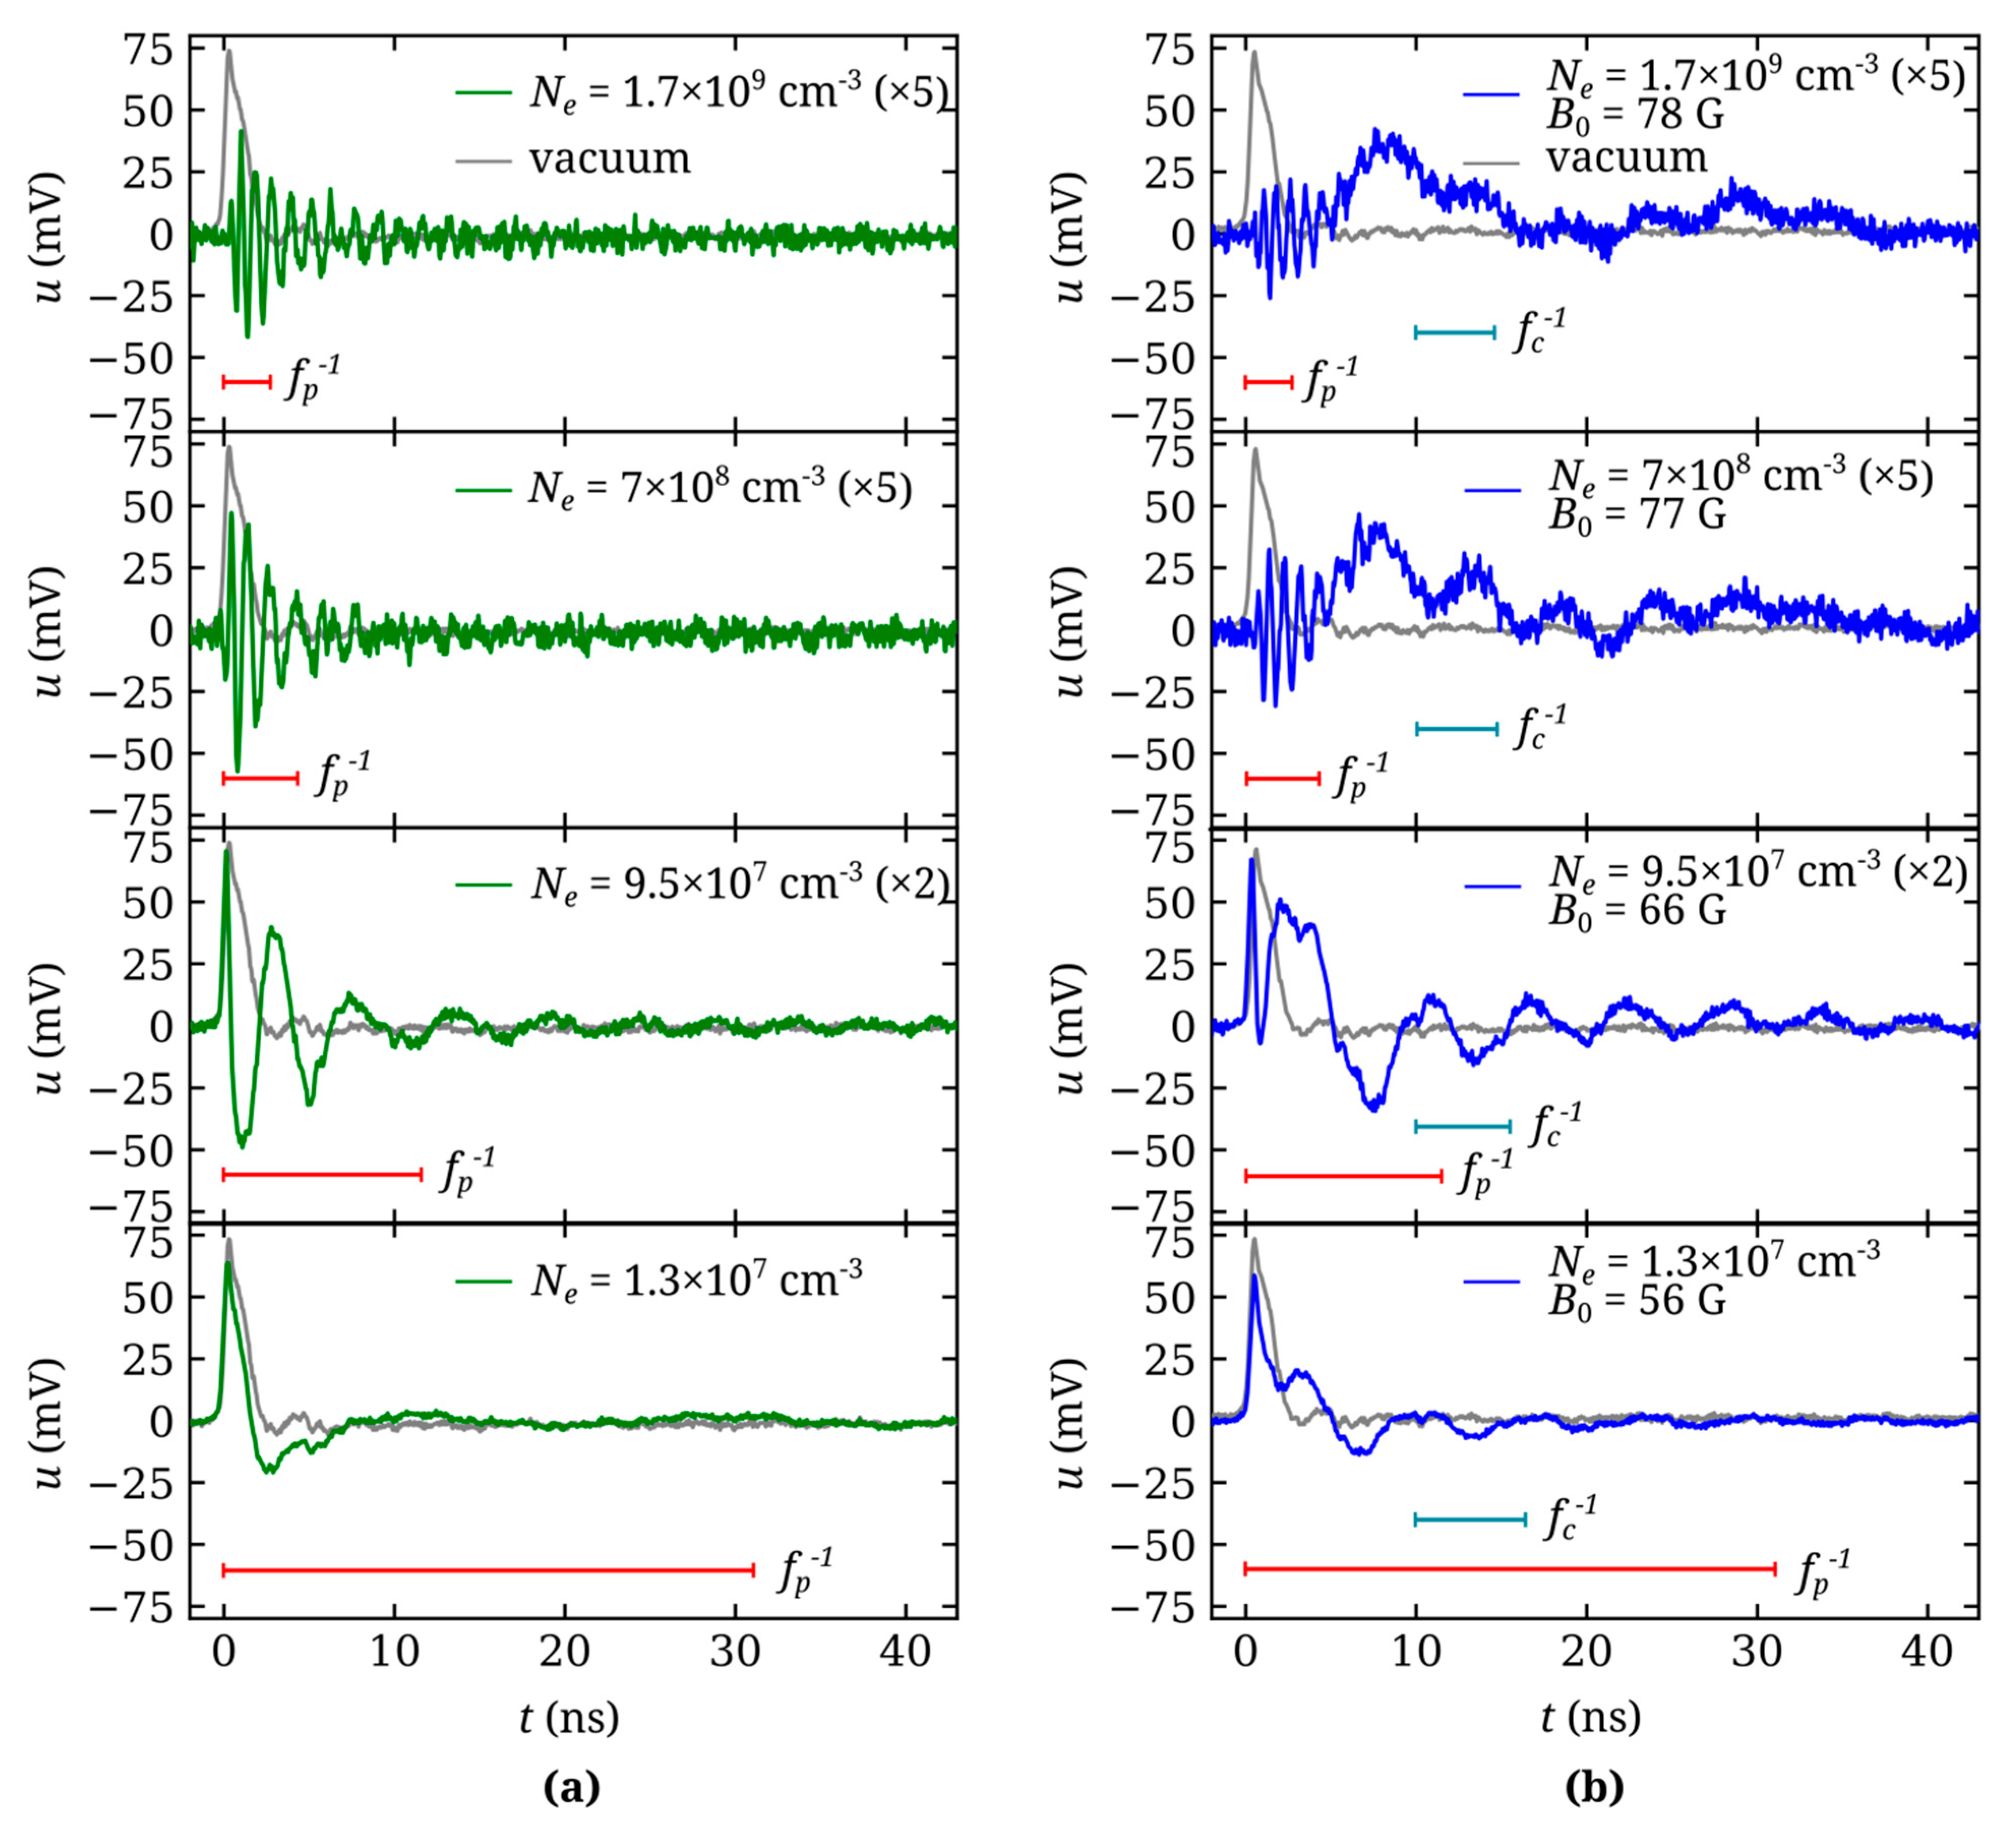
Figure 4a presents the waveforms of an EMP having passed through GCL with isotropic plasma (without the magnetic field) at different values of the electron density Ne. For illustrative purposes, marks corresponding to the period of plasma oscillations fp−1 are made next to the waveforms. Similarly to [20], a transformation of the EMP forms due to the dispersion and cutoff effects are observed. The spectral components having frequencies lower than fp do not pass through the plasma, while for the components with the frequencies exceeding fp, the plasma is transparent. At high Ne, the transformation of an EMP into a train of oscillations with an increasing period is observed positively. The minimum (initial) period is determined by the EMP voltage rising time, while the maximum (final) period tends to reach the period of plasma oscillations fp−1, but always remains somewhat shorter. The higher Ne is, the greater is the group delay of the signal in the plasma. In a rarefied plasma (lower panels), the EMP propagation path is insufficient to let the dispersion effects manifest themselves. The distortion of the waveform is determined by the cutoff effect, and in this specific case, by filtration of the dc component of the voltage pulse in the plasma.
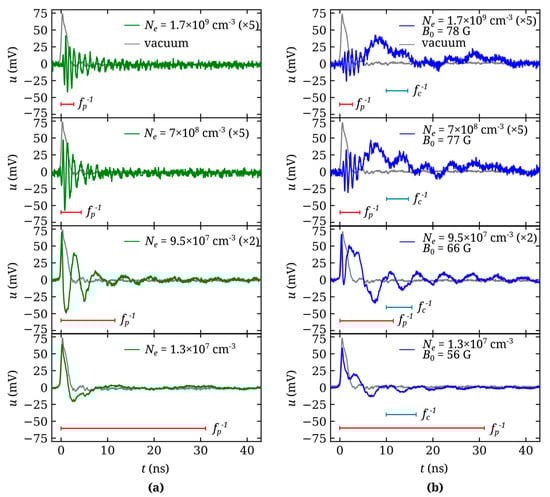
Figure 4.
Waveforms of the EMPs transmitted through the plasma-filled GCL at different Ne values: (a) nonmagnetized plasma, (b) magnetized plasma. The grey color represents EMP waveform transmitted through GCL without plasma. For the sake of convenience, some waveforms are amplified (2× or 5×). The colored intervals represent the time scales of the periods of electron plasma oscillations and electron cyclotron rotation.
The pattern is different in the presence of the magnetic field (see Figure 4b). In this case, the character of the transformation of the EMP waveform depends on the ratio between the electron cyclotron frequency and the plasma frequency.
In the regime of “dense” plasma, under the condition of fp > fc (or fp−1 < fc−1, upper panels), division of the EMP breaks into two wave packets, specifically, into a high-frequency (HF) train propagating at a higher velocity and a low-frequency train propagating at a lower velocity and formed by oscillations with a significantly greater period. In terms of their form and delay times, the HF trains resemble the signals in isotropic plasma at the same density Ne. The LF trains are formed by the oscillations whose frequencies are lower than or near to fp and fc. The duration of the LF trains reaches 40 ns, which is four times as long as the time of passing of the pulse through the working GCL segment in vacuum (without plasma).
In the regime of “rarified” plasma, under the condition of fp < fc (or fp−1 > fc−1, lower panels), the leading edge of the EMP passes through the magnetized plasma almost with no changes. Afterwards, the waveform distorts, and a tail of quasimonochromatic damped oscillations with a frequency close to fc trails behind the pulse.
Fourier analysis helps understanding the nature of EMP transformation in magnetized plasma. The results of processing of the EMP waveforms from Figure 4b by the Fourier transform method in a window with 54 ns duration are shown in Figure 5. The spectrum of the initial EMP excited in the GCL is broad and continuous, and its upper limit is at about 2 GHz. In dense magnetized plasma (see the upper panel), the EMP spectrum consists of two bands, specifically, the low-frequency band at f < fc (in the whistler frequency range) and the high-frequency band at f > fp, which are separated by the plasma evanescence region. As the plasma density Ne decreases, the width of the evanescence region decreases as well. The signal spectrum becomes closer to the spectrum of the initial EMP, but deep lines of absorption at the electron cyclotron resonance f = fc and its second harmonic 2fc appear in it.
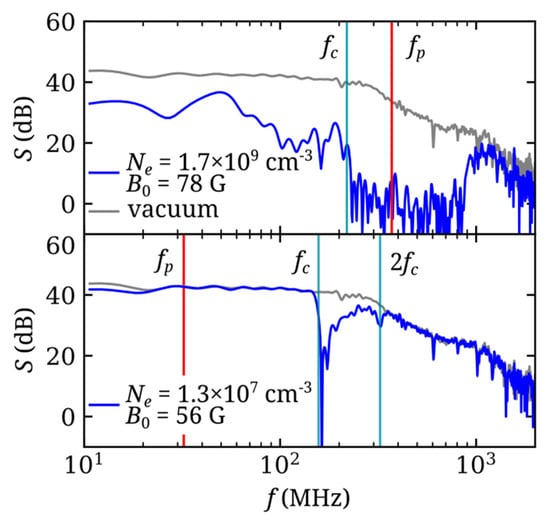
Figure 5.
Spectra of the signals transmitted through the GCL filled with “dense” (top panel) or “rarefied” (bottom panel) magnetized plasma.
The color diagrams presented in Figure 6 serve as an illustration for the variation in the EMP spectrum in the case of EMP propagation in magnetized plasma. Figure 6a uses a color code to show the spectra of an EMP passing through the GCL as a function of time after the end of the ionizing pulse T in the plasma decay process. The diagram is a continuous sequence of EMP spectra (as in Figure 5) obtained with a gradual EMP delay change relative to the end of the ionizing pulse. The frequency scale is plotted along the vertical axis. For the sake of convenience, time dependences of the plasma frequency fp(t), cyclotron resonance frequency fc(t), and its second harmonic fc(t), as well as the upper hybrid resonance frequency fuh(t) = (fp2 + fc2)1/2 [7], are superimposed on the diagrams. The diagram demonstrates the division of the EMP frequency spectrum in plasma into two bands: one, f < fc(t), in the whistler range and the other, f > fp, fuh, in the high-frequency plasma transparency region. At later plasma decay times (T > 20 ms) or at low Ne, the EMP spectrum demonstrates the effects of cyclotron absorption in narrow bands near the first and second harmonics of fc. Cyclotron absorption is clearly seen even at a very low electron density, Ne ~ 105 cm−3, at T = 39 ms (Figure 7).
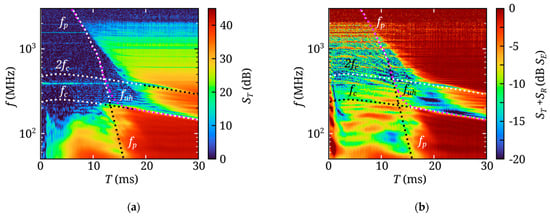
Figure 6.
(a) Spectrum of the UWB EMP transmitted through the plasma-filled GCL as a function of the pulse delay relative to the end of the ionizing pulse. The figure also shows the time dependences of the plasma frequency, upper hybrid frequency, and cyclotron resonance frequencies (first and second harmonics). (b) Sum of the spectra of the transmitted and reflected UWB EMPs as a function of pulse delay relative to the end of the ionizing pulse. The spectrum amplitude is normalized on the spectrum of the signal transmitted through the GCL without plasma.
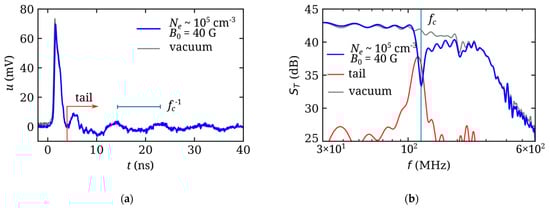
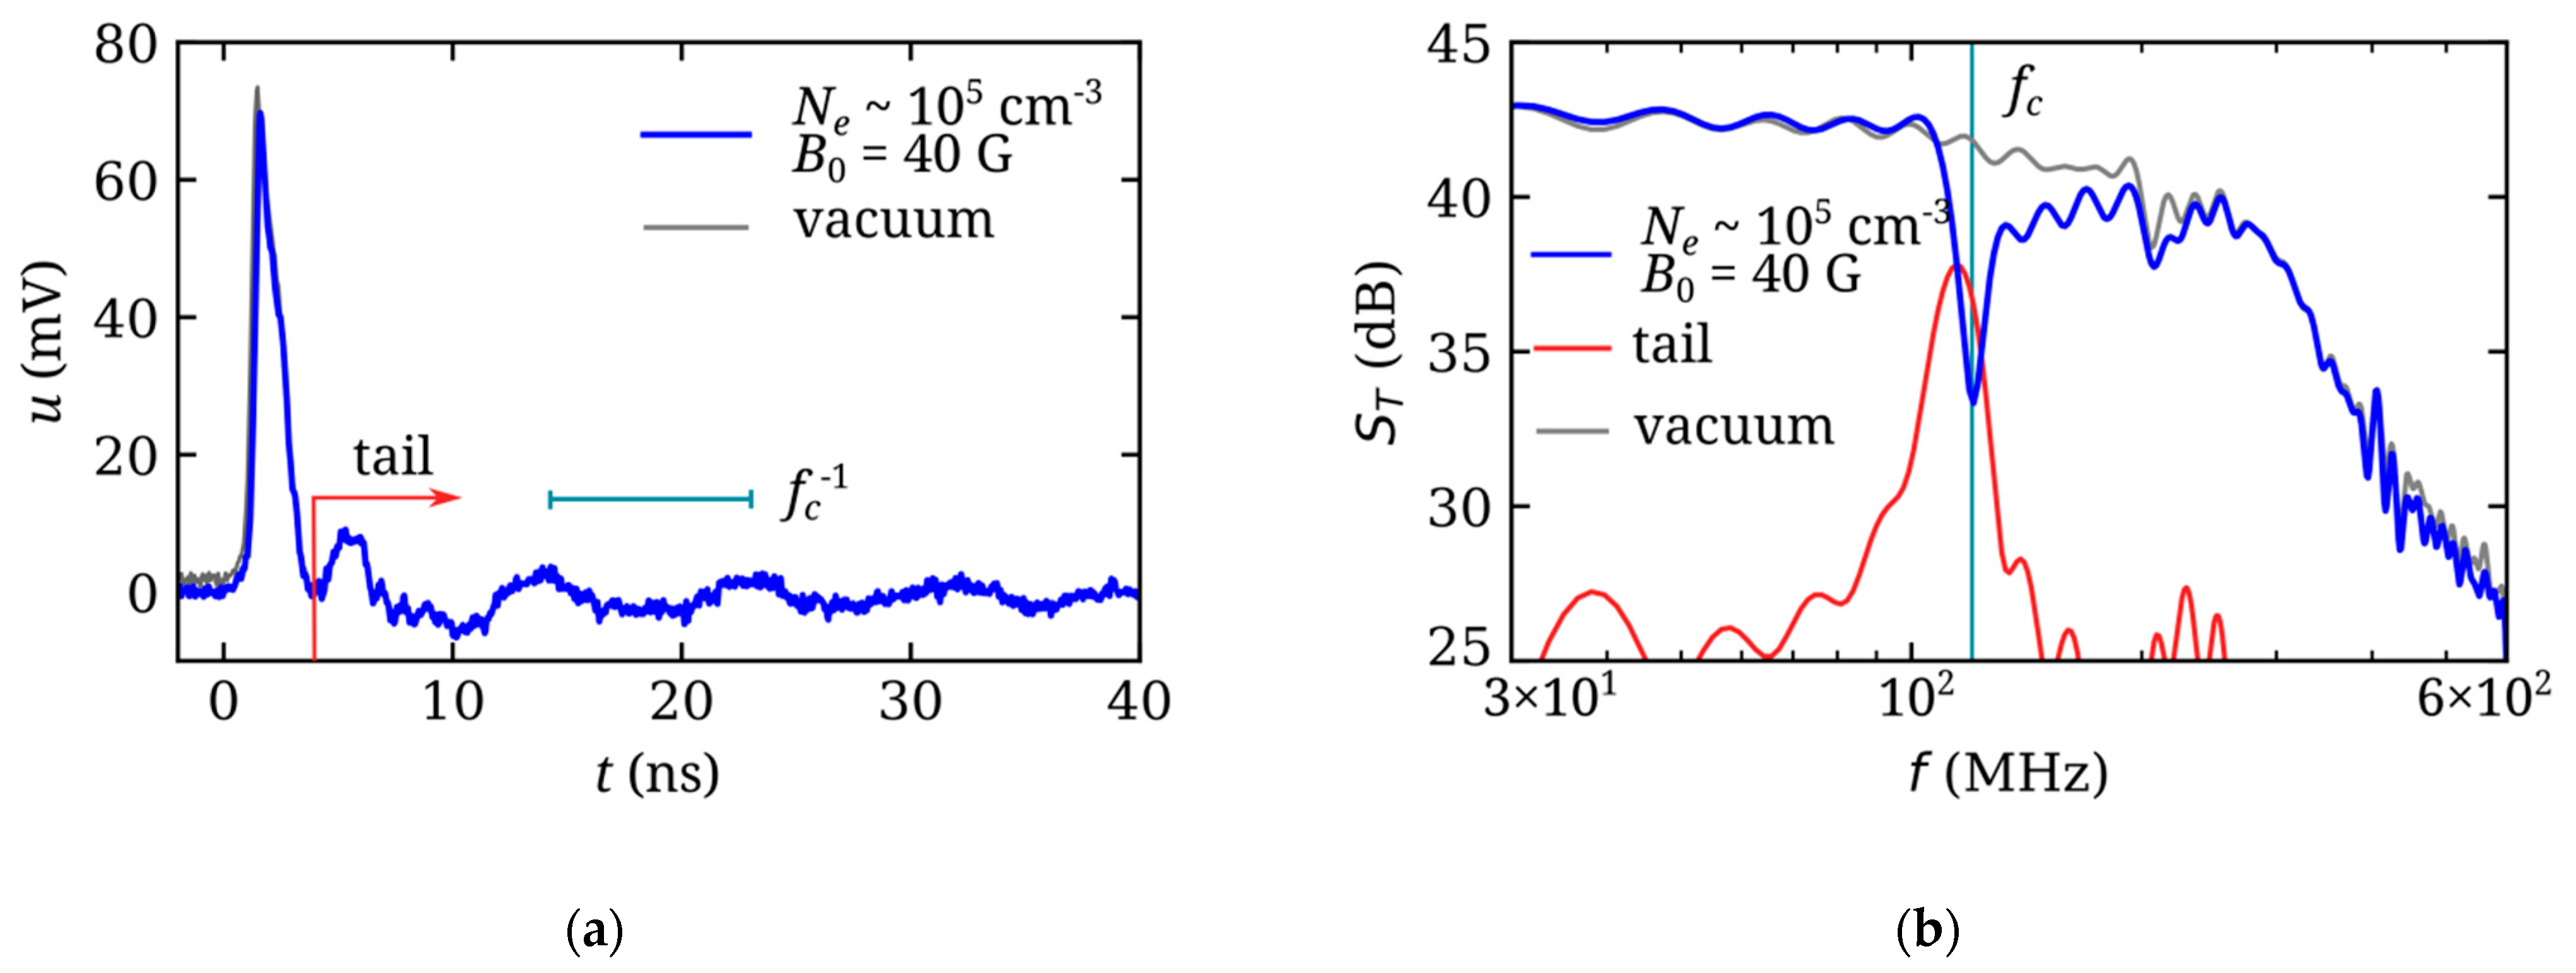
Figure 7.
(a) Form of the pulse transmitted through the GCL filled with rarefied plasma (Ne < 106 cm−3, fp < 10 MHz << fc) as compared with the form of the pulse transmitted through the line without plasma filling. The interval corresponding to the period of the cyclotron rotation of electrons is also shown. (b) Spectra of the pulses shown in Figure (a), as well as the spectrum of the “tail” of the pulse transmitted through the plasma.
Figure 6b shows the sum of the spectral amplitudes of the transmitted (ST, energy units) and reflected (SR, energy units) signals (see Figure 3) versus plasma decay time T. The value ST + SR is normalized to the spectral amplitude of the signal transmitted through the GCL without plasma (SE). This diagram allows one to evaluate the balance of the EMP energy transmitted through, reflected from, and absorbed in the GCL filled with magnetized plasma. Note that the amplitude–frequency characteristics of the signal reflected from the GCL are uneven due to details of its design [19,20]. This diagram shows that, first, the EMP energy is dissipated in plasma at the frequencies close to fc and 2fc, i.e., resonance absorption takes place in rarified plasma. Second, the EMP energy is absorbed in plasma of medium density in a wide frequency range between the lower (f < fc) and upper transparency subbands.
4. Discussion
According to the results of the calculations [4], the character of EMP distortion in plasma is determined by the total electron content (TEC) on the signal propagation path [27,28]:
where L is the total length of the propagation path. Under ionospheric conditions, it is convenient to use the TEC concept, since in most practically significant cases the plasma in the plane of the leading EMP edge can be assumed to be uniform. As a result, the effects of refraction at the transverse density gradients are not very significant, and all distortions of the EMP form along the propagation path are determined by the longitudinal Ne distribution only. In laboratory experiments on irradiating a large column of the laboratory plasma with EMP from a horn antenna, this approach cannot be implemented [16]. The refraction determined by the transverse Ne gradients leads to a significant fraction of the EMP energy leaving the plasma, and it is rereflected from the walls of the metal chamber, which, in turn, causes distortions in the form and spectrum of the pulse, which are not always predictable. The approach used here allows one to prevent these undesirable phenomena. When excited in the fundamental (transverse electromagnetic, TEM) mode, the transmitting line (in particular, coaxial line) has constant impedance characteristics in a wide frequency band, up to the zero frequency (dc). As a result, one can achieve the quasiunidimensional propagation of the EMP, which can be described using the TEC concept, both in the case of isotropic plasma [20,21] and in the presence of an ambient magnetic field.
TEC can be regarded as the scaling parameter when simulating the dispersion EMP distortion in the ionosphere [4]. For the F layer of the dayside ionosphere, TEC ~10–40 TECu = 1013 − 4 × 1013 cm−2 (TECu is the TEC unit, 1 TECu = 1012 cm−2 [28]). In the GCL, the typical values of TEC are ~2 × 10⁻³ – 0.2 TECu = 2 × 10⁸ – 2 × 1011 cm−2. When modeling the EMP propagation in the ionosphere, its propagation along a relatively short (several meters) path in a laboratory chamber with a plasma density Ne increased compared with ionospheric conditions. In this case, where the pulse spectrum is higher than the plasma frequency, i.e., at τp << fp−1, where τp is the pulse duration, a noticeable distortion of the waveform is possible due to the dispersion, if the following condition is fulfilled:
The total EMP energy is retained during propagation in this case. For a pulse with the duration τp~1 ns, criterion (2) yields the estimation TEC > 0.02 TECu = 2 × 1010 cm−2. This value corresponds to the density of isotropic plasma in the GCL Ne~2 × 108 cm−3 along the path of about 2 m long. In a certain sense, one can state that the GCL makes it possible to simulate a segment of the ionospheric UWB EMP propagation path with a length from 0.1 to 10 km, depending on the conditions.
Notwithstanding, the above TEC is an important, but not the only, modeling parameter. Particularly, the theory developed in [4] which leads to simulation criteria like (2) assumes that the pulse duration is significantly less than the period of plasma oscillations fp−1. For longer pulses, when a significant part of the EMP frequency spectrum is on the order of and below the plasma frequency fp, the contribution of cutoff effects to the transformation of the EMP shape increases [16,17]. If collision effects are considered, then pulse duration τp should be compared to the electron collision frequency ν. In other words, if the dimensionless parameters like fpτp or ντp are not small compared to unity in ionospheric plasma, they should be considered as key simulation parameters, and their values must be reproduced in laboratory plasmas.
The presence of the magnetic field makes the pattern of transformation of the EMP form and spectrum much richer. In the experiments on propagation of short pulses in relatively rare plasma and weak magnetic fields (τp << fp−1, fc−1), one should expect such effects as the Faraday rotation of the polarization plane or birefringence (Cotton–Mouton effect), which are manifested with sufficiently long paths. If the plasma is dense and magnetic field is not very weak, or the pulse is not too short, and the resonance frequencies fp, fc fall within the main frequency band of the EMP, the laboratory experiment allows simulating the effects that take place in the case of propagation of EMPs with durations from 100 ns to 10 μs through magnetized ionospheric plasma.
The laboratory experiment makes it possible to obtain an illustrative physical pattern of linear transformation of the form of the EMP propagating in a medium, which is complicated from the viewpoint of dispersion, e.g., magnetized plasma. In particular, an interesting result was obtained with the EMP propagating in low-density plasma in the presence of the cyclotron resonance (see Figure 4b). It has already been noted that the presence of the cyclotron resonance absorption leads to a train of damped oscillations with a frequency close to fc appearing on the “tail” of a short EMP (shorter than the cyclotron rotation period). When analyzing the signal in the time domain, the appearance of this train can be interpreted as follows. The spectrum ŝT of the transmitted signal (here, ŝT is the complex amplitude ) can be represented as the difference of the spectrum of the signal transmitted through the GCL without plasma (ŝ0) and the absorption spectrum (ŝA):
The parameters of the absorption spectrum ŝA (the central frequency f0 and the width δf << f0) are determined by the properties of the absorption line. Applying the linear procedure of the inverse Fourier transform () to equality (3), we obtain the time-domain representation of the signal transmitted through the GCL:
Here, u0(t) is a transmitted signal without plasma which can be measured in experiments directly (see Figure 4). The “virtual” signal uA(t) corresponds to the resonance absorption and has a narrow spectrum with the width δf. Therefore, it should be a quasimonochromatic packet with a duration of at least 1/δf and carrier frequency f0~fce. The initial signal u0(t) has a short duration, τp << 1/δf. Therefore, the resulting signal is a superposition of a short (initial) pulse and the consequent narrowband train with the frequency f0~fce. The fact that the narrowband signal is excited after the initial pulse follows from the principle of causality and is clearly seen in the experiment (see Figure 4). To illustrate this consideration, Figure 7 shows fragments of the waveforms obtained in the experiment in vacuum (without plasma) and with rare magnetized plasma, as well as the spectra of fragments of the waveforms corresponding to the initial EMP and the narrowband train of the damped oscillations.
An alternative physical explanation for the formation of a packet of damped oscillations with a frequency about fc is as follows. A short (τp < fce−1) electromagnetic pulse impacts the plasma electrons and transfers a part of its energy to them. As the EMP passes along the GCL, the electrons begin to simultaneously rotate at the cyclotron frequency fc in each of GCL cross sections. This phased rotation of electrons represents the EMP polarization trace in the plasma, which results in the observed EMP tail. A similar physical picture underlies demonstrations of the cyclotron echo effect, in which a short microwave pulse spins plasma electrons at a cyclotron resonance. In experiment, an increase in the duration of the initial pulse at the electron cyclotron frequency can be observed, see, for example [29].
Finally, the issue of efficiency of transferring the EMP energy to plasma is significant. In particular, it is of interest due to the proposal of heating the ionosphere with periodic sequences of UWB EMPs [5]. First, the performed experiments demonstrated that the EMP energy is transferred to the plasma electrons in accordance with the cyclotron absorption mechanism. Second, the effects of energy absorption under the plasma resonance conditions (f~fp) do not manifest them explicitly in the experiment, since the plasma inside the GCL is distributed nonuniformly, both over the length and radius of the line. At the same time, wideband energy absorption is observed in the experiment in the plasma evanescence region, i.e., between the electron cyclotron frequency fce and the maximum plasma frequency corresponding to the maximum of the radial distribution of the density Ne. This result is of significance for planning of the experiments similar to that proposed in [6], since in the future it will allow synthesizing a pulsed wideband signal whose parameters are optimized from the absorption viewpoint.
5. Conclusions
The paper gives a clear picture of the transformation of the shape and spectrum of UWB EMPs in plasma, magnetized or not, in a wide range of electron densities, for all possible ratios of frequencies of the EMP spectrum, plasma, and electron cyclotron frequencies. On the one hand, the article develops the previously obtained results for isotropic plasma, calculated [4,5,17,21] and experimental [16,17,20], for the case of magnetized plasma. On the other hand, it develops previously obtained results on excitation of the response of a dense magnetized plasma [22] for the case of a shorter pulse that excites not only low-frequency whistler waves but also high-frequency electromagnetic waves. The results obtained in this experimental configuration can be used to verify models of EMP propagation in laboratory and ionospheric plasma, including under conditions of nonlinear interaction and resonant absorption of electromagnetic energy.
The GCL filled with isotropic or magnetized plasma offers an opportunity to study specific features of pulsed electromagnetic processes having characteristic times, which are shorter than or comparable with the periods of plasma resonance oscillations at the electron plasma frequency fp and the electron cyclotron frequency fce. The plasma-filled coaxial line realizes the regime of quasiunidimensional UWB EMP propagation without refraction losses. The direct oscilloscopic detection of pulsed signals makes it possible to describe the characteristics of the EMP in magnetized plasma in terms of the functions of transmission, reflection, and absorption.
A UWB EMP is distorted in isotopic plasma due to the effects of the cutoff and frequency dispersion. In dense magnetized plasma (fp >> fc), the EMP breaks into two wave packets, the high-frequency (f > fp) and low-frequency (f < fc) ones. The character of the distortions of the high-frequency packet is similar to the EMP distortions which arise in the case of propagation in isotropic plasma with the same density. The low-frequency packet lies in the range of whistler waves. The EMP distortion regime observed in rarefied magnetized plasma (fp << fc) is determined by cyclotron absorption. In this regime, the pulse is followed by a long train of damped oscillations at a frequency close to the cyclotron frequency fc.
The objective and the main result of this work are the demonstration of UWB EMP form distortion effects in laboratory magnetized plasma under the conditions of limited simulation of nano- and microsecond EMP propagation in the ionosphere of the Earth. The effects observed should be interpreted quantitatively and qualitatively in future works based on the models developed for the modes of coaxial magnetized plasma waveguides [24] and finite-difference time-domain (FDTD) simulation [21].
Finally, we note that the effects considered in the work can be used to interpret the phenomena that arise during the propagation of UWB EMPs in other media with strong dispersion and resonances, for example, in metamaterials (see [30,31,32]). In particular, by filling transmission lines with metamaterials with specially selected properties, controlled transformation of the shape and spectrum of UWB EMPs for basic studies and various applications is possible.
Author Contributions
Conceptualization, M.G. and I.Z.; methodology, I.Z., S.K. and A.S.; software, I.Z.; validation, M.G.; formal analysis, M.G. and I.Z.; investigation, I.Z, A.K., V.K. and I.P.; resources, A.S.; data curation, I.Z.; writing—original draft preparation, I.Z. and M.G.; writing—review and editing, M.G.; visualization, I.Z.; supervision, M.G.; project administration, M.G.; funding acquisition, M.G. All authors have read and agreed to the published version of the manuscript.
Funding
The study was supported by the Ministry of Science and Higher Education of the Russian Federation, project 075-15-2020-790.
Institutional Review Board Statement
Not applicable.
Informed Consent Statement
Not applicable.
Data Availability Statement
Data is contained within the article.
Acknowledgments
The authors thank N.A. Aidakina for help in preparing the manuscript.
Conflicts of Interest
The authors declare no conflicts of interest.
References
- Efanov, V.; Efanov, M. A new generation of super power picosecond pulsers based on FID technology. In Proceedings of the Abstracts IEEE International Conference on Plasma Science (ICOPS), San Francisco, CA, USA, 16–21 June 2013. [Google Scholar] [CrossRef]
- Bukin, V.V.; Dolmatov, T.V.; Efanov, M.V.; Lebedev, E.F.; Ostashev, V.E.; Ul’yanov, A.V.; Fedorov, V.M.; Shurupov, M.A. A radiophysical method for studying deformation of ultrawideband pulses during propagation in the atmosphere. Tech. Phys. Lett. 2022, 48, 283–286. [Google Scholar] [CrossRef]
- Rowland, H.L.; Fernsler, R.F.; Huba, J.D.; Bernhardt, P.A. Lightning driven EMP in the upper atmosphere. Geophys. Res. Lett. 1995, 22, 361–364. [Google Scholar] [CrossRef]
- Soldatov, A.V.; Terekhin, V.A. Propagation of an ultrawideband electromagnetic signal in ionospheric plasma. Plasma Phys. Rep. 2016, 42, 970–977. [Google Scholar] [CrossRef]
- Soldatov, A.V. Resonance absorption of a train of ultrawideband electromagnetic pulses in the ionosphere. Plasma Phys. Rep. 2018, 44, 828–834. [Google Scholar] [CrossRef]
- Gombosi, T.I.; Baker, D.N.; Balogh, A.; Erickson, P.J.; Huba, J.D.; Lanzerotti, L.J. Anthropogenic space weather. Space Sci. Rev. 2017, 212, 985–1039. [Google Scholar] [CrossRef]
- Stix, T.H. Waves in Plasmas; American Institute of Physics: New York, NY, USA, 1992. [Google Scholar]
- Glukhov, V.S.; Inan, U.S. Particle simulation of the time-dependent interaction with the ionosphere of rapidly varying lightning EMP. Geophys. Res. Lett. 1996, 23, 2193–2196. [Google Scholar] [CrossRef]
- Marshall, R.A. Effect of self-absorption on attenuation of lightning and transmitter signals in the lower ionosphere. J. Geophys. Res. Space Phys. 2014, 119, 4062–4076. [Google Scholar] [CrossRef]
- Golubev, A.I.; Sysoeva, T.G.; Terekhin, V.A.; Tikhonchuk, V.T.; Altgilber, L.L. Kinetic model of the propagation of intense subnanosecond electromagnetic pulse through the lower atmosphere. IEEE Trans. Plasma Sci. 2000, 28, 303–311. [Google Scholar] [CrossRef]
- Pusateri, E.N.; Morris, H.E.; Nelson, E.M.; Ji, W. Determination of equilibrium electron temperature and times using an electron swarm model with BOLSIG+ calculated collision frequencies and rate coefficients. J. Geophys. Res. Atmos. 2015, 120, 7300–7315. [Google Scholar] [CrossRef]
- Pusateri, E.N.; Morris, H.E.; Nelson, E.M.; Ji, W. Comparison of equilibrium ohmic and nonequilibrium swarm models for monitoring conduction electron evolution in high-altitude EMP calculations. J. Geophys. Res. Atmos. 2016, 121, 11884–11889. [Google Scholar] [CrossRef]
- Alfvén, H.; Fälthammar, C.-G. Cosmical Electrodynamics. Fundamental Principles; Claredon Press: Oxford, UK, 1963. [Google Scholar]
- Mesyats, G.A.; Korovin, S.D.; Rostov, V.V.; Shpak, V.G.; Yalandin, M.I. The RADAN series of compact pulsed power generators and their applications. Proc. IEEE 2004, 92, 1166–1179. [Google Scholar] [CrossRef]
- Fedorov, V.M.; Efanov, M.V.; Ostashev, V.Y.; Tarakanov, V.P.; Ul’yanov, A.V. Antenna array with TEM-horn for radiation of high-power ultra short electromagnetic pulses. Electronics 2021, 10, 1011. [Google Scholar] [CrossRef]
- Gushchin, M.E.; Korobkov, S.V.; Strikovskiy, A.V.; Aidakina, N.A.; Zudin, I.Y.; Terekhin, V.A.; Terekhin, A.V.; Soldatov, A.V.; Belov, A.S. Transformation of an ultra-wideband electromagnetic pulse in the process of its propagation through a large laboratory plasma. AIP Adv. 2019, 9, 125051. [Google Scholar] [CrossRef]
- Carlile, R.N.; Cavalli, A.; Cramer, W.L.; Hyde, R.M., Jr.; Seidler, W.A. Absorption of energy from a large amplitude electromagnetic pulse by a collisionless plasma. IEEE Trans. Antennas Propag. 1979, AP-27, 596–603. [Google Scholar] [CrossRef]
- Aidakina, N.A.; Galka, A.G.; Gundorin, V.I.; Gushchin, M.E.; Zudin, I.Y.; Korobkov, S.V.; Kostrov, A.V.; Loskutov, K.N.; Priver, S.E.; Strikovskiy, A.V.; et al. Simulation of physical phenomena in the ionosphere and magnetosphere of the earth on krot plasma device. Some results and prospects. Geomagn. Aeron. 2018, 58, 314–324. [Google Scholar] [CrossRef]
- Gushchin, M.; Palitsin, A.; Strikovskiy, A.; Zudin, I.; Korobkov, S.; Loskutov, K.; Gromov, A.; Goykhman, M.; Rodin, Y.; Korchagin, V.; et al. Gigantic coaxial line for experimental studies of the interaction of nanosecond electromagnetic pulses with an ionized gas medium. Appl. Sci. 2021, 12, 59. [Google Scholar] [CrossRef]
- Goykhman, M.B.; Gromov, A.V.; Gundorin, V.I.; Gushchin, M.E.; Zudin, I.Y.; Kornishin, S.Y.; Korobkov, S.V.; Kotov, A.V.; Kuzin, A.V.; Loskutov, K.N.; et al. Concept and practical implementation of a gigantic plasma-filled coaxial line for simulation of the interaction of electromagnetic pulses with a partially ionized gas medium. Dokl. Phys. 2022, 67, 95–98. [Google Scholar] [CrossRef]
- Es’kin, V.A.; Korobkov, S.V.; Gushchin, M.E.; Kudrin, A.V. Propagation of an ultrawideband electromagnetic pulse along a plasma-filled coaxial line. IEEE Trans. Plasma Sci. 2023, 51, 374–380. [Google Scholar] [CrossRef]
- Stenzel, R.L.; Urrutia, J.M.; Rousculp, C.L. Pulsed currents carried by whistlers. Part I: Excitation by magnetic antennas. Phys. Fluids B Plasma Phys. 1993, 5, 325–338. [Google Scholar] [CrossRef]
- Hayt, W.H. Engineering Electromagnetics, 5th ed.; McGraw-Hill: New York, NY, USA, 1989. [Google Scholar]
- Kartashov, I.N.; Kuzelev, M.V. Quasi-TEM electromagnetic modes of a plasma waveguide with a nonsimply connected cross section in an external magnetic field. Plasma Phys. Rep. 2014, 40, 965–974. [Google Scholar] [CrossRef]
- Stenzel, R.L. Microwave resonator probe for localized density measurements in weakly magnetized plasmas. Rev. Sci. Instrum. 1976, 47, 603–607. [Google Scholar] [CrossRef]
- Galka, A.G.; Yanin, D.V.; Kostrov, A.V.; Priver, S.E.; Malyshev, M.S. Wide-range measurements of plasma density using a hairpin resonance microwave probe. J. Appl. Phys. 2019, 125, 124501. [Google Scholar] [CrossRef]
- Mannucci, A.J.; Wilson, B.D.; Yuan, D.N.; Ho, C.H.; Lindqwister, U.J.; Runge, T.F. A global mapping technique for GPS-derived ionospheric total electron content measurements. Radio Sci. 1998, 33, 565–582. [Google Scholar] [CrossRef]
- Poniatowski, M.; Nykiel, G.; Borries, C.; Szmytkowski, J. Spatio-temporal validation of GNSS-derived global ionosphere maps using 16 years of jason satellites observations. Remote Sens. 2023, 15, 5053. [Google Scholar] [CrossRef]
- Harp, R.S.; Bruce, R.L.; Crawford, F.W. Some studies of electron cyclotron echoes from plasma. J. Appl. Phys. 1967, 38, 3385–3394. [Google Scholar] [CrossRef]
- Xie, P.; Zhang, Z.; Liu, K.; Qian, L.; Dang, F.; Liu, Y.; Fan, R.; Wang, X.; Dou, S. C/SiO2 meta-composite: Overcoming the λ/a relationship limitation in metamaterials. Carbon 2017, 125, 1–8. [Google Scholar] [CrossRef]
- Fan, G.; Wang, Z.; Ren, H.; Liu, Y.; Fan, R. Dielectric dispersion of copper/rutile cermets: Dielectric resonance, relaxation, and plasma oscillation. Scr. Mater. 2021, 190, 1–6. [Google Scholar] [CrossRef]
- Fan, G.; Wang, G.; Sunb, K.; Liua, Y.; Fan, R. Doped ceramics of indium oxides for negative permittivity materials in MHz-kHz frequency regions. J. Mater. Sci. Technol. 2021, 61, 125–131. [Google Scholar] [CrossRef]


Disclaimer/Publisher’s Note: The statements, opinions and data contained in all publications are solely those of the individual author(s) and contributor(s) and not of MDPI and/or the editor(s). MDPI and/or the editor(s) disclaim responsibility for any injury to people or property resulting from any ideas, methods, instructions or products referred to in the content. |
© 2024 by the authors. Licensee MDPI, Basel, Switzerland. This article is an open access article distributed under the terms and conditions of the Creative Commons Attribution (CC BY) license (https://creativecommons.org/licenses/by/4.0/).