1. Introduction
On a global scale, the installed capacity of wind turbines alongside photovoltaic (PV) installations experienced significant growth. This is a clear indication of the increasing importance of renewable energy sources (RESs), with a clear stance that their share in total production in the future should become even larger.
Reducing the share of synchronous generator production in favor of non-synchronous production from RESs leads to a decrease in the overall inertia in the power system, and it is precisely the system’s inertia that is responsible for the stable frequency response (higher system inertia provides less sensitivity to the immediate mismatch between production and consumption). Due to electro-mechanical coupling, the rotating masses of generators provide kinetic energy to the grid (but also draw from it) in case of frequency deviation.
The grid frequency is directly linked to the speed of rotation of the synchronous generator rotor and hence to the balance of active power, varying within acceptable limits, and monitored within the system through the so-called rate of change of frequency (RoCoF). Reduced inertia will increase the RoCoF when the system is exposed to sudden disturbances, such as a decrease or increase in consumption or a decrease or increase in production.
With insufficient inertia, frequency changes can be too rapid, causing uncontrolled failures of consumers, generators, and interconnectors, potentially leading to a partial or complete system breakdown [
1,
2].
In the process of decarbonization of the electric power system (EPS), the widespread adoption of RESs plays a key role. According to the report [
3], in order to achieve the goals set in the Paris Agreement, the global share of electricity produced by wind should be 21% by 2030, and 35% by 2060. The most commonly used wind turbines operate at variable speeds to enhance the efficiency of wind energy conversion. However, this variable speed operation leads to a decoupling between the generator rotation speed and the grid frequency, managed by a converter. The variability of the primary energy source has positioned wind farms to negatively impact the frequency stability of the electric power system [
4]. Due to the increased proportion of RESs, units connected to the grid via power electronic converters will replace many conventional sources that previously used electromechanical conversion with standard synchronous machines directly connected to the power system. As management and protection concepts for traditional power systems are based on the static and dynamic characteristics of synchronous generators, their absence poses a risk of unreliable and unstable system operation [
5].
Numerous approaches for estimating power system inertia can be found in the literature, including model-based and measurement-based methods [
6]. Model-based inertia estimation includes a single synchronous generator (SG) estimation [
7] and regional system inertia estimation [
8]. Ambient data-based inertia estimation [
9] and large disturbance-based estimation methods [
10,
11] belong to measurement-based inertia estimation approaches. However, they rely on accurate models and may struggle with virtual inertia estimation for converter-interfaced generators (CIGs) lacking replicated dynamics or known control schemes.
The review [
12] encapsulates various inertia estimation techniques, highlighting their respective advantages and limitations. These include measurement-based methods, which, while capable of utilizing actual system data, face issues with data reliability due to noise and nonlinear variables. Transient signal-based methods are noted for their applicability in both offline and online settings, yet they suffer from limitations like sample deficiency, cost, and time constraints. The paper also discusses Artificial Neural Network (ANN)-based models, which offer fast computation and robustness against noise but are complex and face challenges in multi-area interconnected systems. Additionally, methods utilizing electromechanical oscillation parameters are considered, which, despite being robust against the location of faults and RES penetration levels, are not suitable for ambient data and face performance issues in the presence of noise and non-stationary oscillations. The review also covers the second derivative of frequency data methods, recognized for their speed and accuracy but requiring a complete dynamical model.
In recent times, the development of Wide Area Monitoring Systems (WAMS) has enabled massive real-time measurements to ensure monitoring and control applications for wide areas [
13]. This paper applies an approach for estimating inertia that utilizes Phasor Measurement Units (PMUs) during large disturbances in the power system.
In a steady state, the frequency across a power system is consistent, but disturbances cause varying frequencies across different parts of the grid for some time. Disturbance effects show up quicker in areas closer to the disturbances [
14,
15]. To accurately assess the system’s average frequency, it is essential to gather frequency measurements from various grid sections, ideally from each generator. The Center of Inertia (CoI) serves as a representation of this average frequency, acting as a hypothetical hub connecting all system generators. While current systems lack measurements from each generator, the introduction of PMUs enables quicker and more precise data collection.
In [
16], available measurements of electrical and mechanical power from generators are employed to derive estimates for the RoCoF and inertia constants within a three-generator test system, utilizing the frequency of the CoI.
The scientific paper [
17] introduces a novel method for estimating the RoCoF in power systems, utilizing Interpolated Discrete Fourier Transform (IDFT) and Kalman filtering. This approach aims to enhance accuracy and reduce latency in RoCoF estimation, outperforming traditional methods. While the method offers advantages such as increased accuracy and reduced estimation latency, potential challenges include its implementation complexity and the need for specific hardware or software capabilities. Its effectiveness may also vary across different power system configurations.
The paper [
18] explores the impact of oscillations on RoCoF curve quality, employing curve fitting and filtering to enhance data reliability. Selecting an optimal analysis range is crucial due to the inertia estimation method’s sensitivity. Despite these challenges, the method demonstrates reduced error rates and improved accuracy when appropriate data ranges and processing techniques are utilized. This scientific paper [
19] categorizes inertia estimation methods into three groups: DFT-based methods, Kalman Filter techniques, and other approaches like the orthogonal phase-locked method. While these methods are recognized for their robustness and accuracy in frequency tracking, they face challenges in real-time applications due to accuracy and computational demands. The paper further identifies key areas for future research, emphasizing the development of AI techniques for improved RoCoF prediction, the refinement of DFT and Kalman Filter methods, and the need for enhanced real-time RoCoF tracking.
In [
20], they present a method for estimating inertia in power systems, utilizing the eigenstructure analysis of linearized dynamic equations to elucidate the relationship between inertia, eigenvalues, and eigenvectors. It incorporates Dynamic Mode Decomposition (DMD) to extract these factors from synchronized measurements, notably from PMU. The methodology challenges include the complexity of its implementation, reliance on accurate PMU data, limited testing in diverse systems, high computational demands, and a possible overdependence on theoretical models. Despite these challenges, the method presents a sophisticated solution for inertia estimation, though it necessitates further refinement and broader real-world testing.
The study [
21] investigates methods for estimating the inertia of power systems, a critical aspect in the era of increasing renewable energy sources. It applies swing equation polynomial approximation and RV methods to evaluate power system inertia. The research includes an analysis of frequency and RoCoF data from power disturbances in Taiwan, utilizing noise filters to enhance data accuracy. While it introduces innovative approaches relevant to modern power systems and has practical applications in improving power system stability and efficiency, it faces challenges in complexity, its reliance on high-quality data, and potential limitations in its scope.
Exploring methods for wind speed forecasting, the article [
22] examines the application of Empirical Mode Decomposition (EMD) along with its refined variations: Ensemble EMD (EEMD), Complete Ensemble EMD (CEEMD), and Completed Ensemble EMD with Adaptive Noise (CEEMDAN). The study found EEMD most effective in preprocessing for wind speed forecasting. The paper presented an innovative approach combining Adaptive Robust Extreme Learning Machine (ARELM) with signal decomposition algorithms like EMD, EEMD, CEEMD, and CEEMDAN, showing improved forecasting accuracy by effectively managing complex data features and outliers. However, the complexity of implementation, limitations under specific conditions, potential for overfitting, and the need for further improvement in loss functions are acknowledged as challenges.
Examining advanced decomposition techniques like EMD, ensemble EMD, and variational mode decomposition (VMD) in the context of wind prediction, one study specifically looks at their utilization within extreme learning machine (ELM)-based models [
23]. These techniques are primarily utilized to remove redundant noise or to amalgamate multiple models for enhanced forecasting accuracy. The use of EMD is central to the approach presented in [
24], offering significant advantages due to its fully data-driven nature, which allows adaptability to different types of signals. This is crucial in handling the non-linear and non-stationary data commonly found in natural phenomena like wind speed. Moreover, EMD’s proficiency in extracting features from complex data is a key factor in improving the accuracy of forecasts. EMD can suffer from mode mixing, where a single intrinsic mode function (IMF) could contain signals of widely different scales. Additionally, the subjective nature of selecting IMFs for further analysis can affect the reproducibility and consistency of the results. Despite these challenges, the study’s proposed method stands out for its adaptability and efficiency in the complex task of wind speed forecasting.
The paper [
25] explores the use of Huang’s Empirical Mode Decomposition for estimating the rate of change of frequency (
df/
dt) and active power imbalance in power systems. The research demonstrates that the EMD approach, along with other methods like the Discrete Wavelet Transform and the Least Squares Method, can accurately estimate CoI RoCoF. It was found that the differences in the estimation of
df/
dt at different buses in the power system are small enough not to limit the choice of measurement buses and signal analysis. This finding suggests the EMD method’s effectiveness for power system analysis, especially in the context of non-linear and non-stationary signal processing. The research emphasizes the capabilities of the approach for supervising contemporary electrical power systems and recommends its application in creating sophisticated protection systems.
Inspired by the robust adaptive EMD, this paper is designed as an approach for estimating power system inertia based on swing equation and signal decomposition algorithms.
Contributions are summarized as follows:
This study introduces an approach for estimating CoI RoCoF in power systems. This innovative approach leverages the EMD technique, enabling a more accurate estimation of frequency change rates, which is crucial for assessing the stability and reliability of power systems.
This study uniquely integrates Multivariate Empirical Mode Decomposition (MEMD) with RoCoF analysis. This combination is particularly effective in handling the dynamic and variable characteristics of power systems influenced by RESs. The application of MEMD/RoCoF in this new context potentially enhances power system stability and management, marking a significant contribution to this field.
This research introduces a refined approach for estimating both the RoCoF and system inertia with enhanced accuracy. This is achieved through a detailed analysis of system frequency response during significant disturbances using the MEMD technique.
This work provides valuable insights into the effects of non-synchronous renewable energy sources on the dynamics of power systems. Understanding these impacts is crucial for the future development and optimization of renewable energy integration in power systems.
The application of MEMD for inertia estimation in power systems represents a novel approach that significantly advances the field beyond the scope of previous research.
2. Inertia of the Electric Power System
Each rotating machine (motor or generator) that is directly connected to the grid provides a certain level of inertia to the system. In this regard, industrial consumers with their induction motors also contribute some inertia to the system. However, the majority comes from synchronous generators within conventional power plants. The inertia of a synchronous generator involves the rotating masses of the drive turbine, shafts, and the generator rotor, where kinetic energy is stored. The parameter used to quantify inertia is called the inertia constant. It is expressed in seconds and represents the time required for the unit to accelerate from rest to a synchronous speed when driven by a constant torque equivalent to the ratio of the rated apparent power and synchronous speed. To assess the inertial response, the inertia constant can also be defined as the time during which the machine can provide active power corresponding to the rated apparent power solely through the stored kinetic energy.
As RESs replace conventional generators, the system’s inertia response diminishes, leading to a faster RoCoF and lower frequency nadirs within a very short timeframe. Lower-inertia systems show significantly lower-frequency nadirs and a higher RoCoF. Such situations can trigger frequency relays and, in the worst-case scenario, cascade failures. The solution for these scenarios involves incorporating virtual inertia into the system [
26].
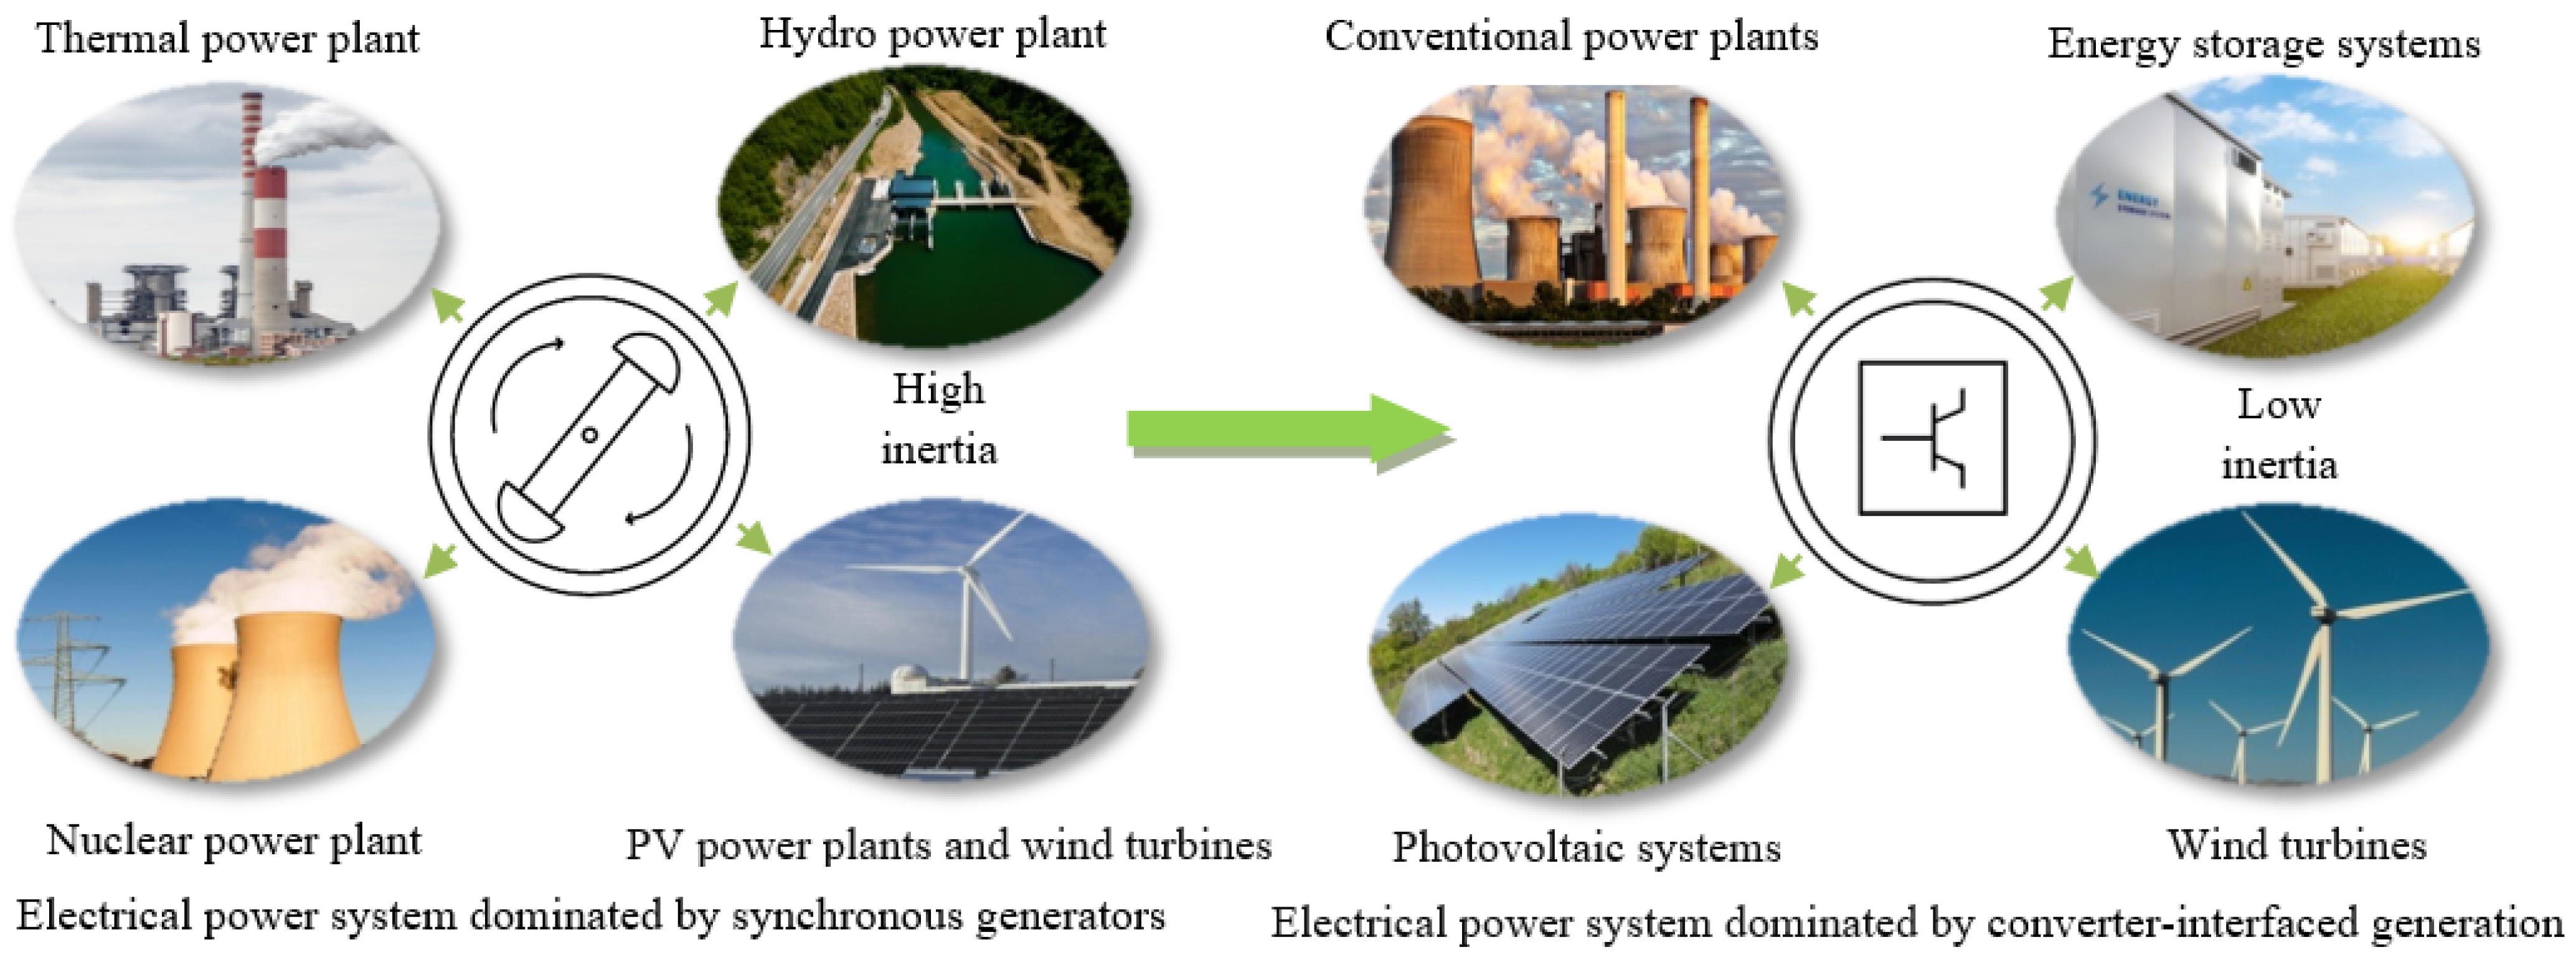
Virtual inertia combines control algorithms, renewable energy sources, energy storage systems (ESS) like batteries, and power electronics to mimic the inertia of traditional synchronous generators. This approach aims to compensate for the decreasing natural inertia in EPS caused by the integration of RESs. This shift is due to the increasing dominance of inverter technology in EPS, replacing conventional synchronous generators.
Figure 1 presents the evolution of modern power systems with dominant inverter technology.
While CIGs typically lack the traditional frequency response processes found in SGs, such as inertia response and speed governor control, implementing virtual inertia through power converter control allows the acquisition of non-rotating inertia. This approach, utilized in CIG units with virtual inertia control, opens the possibility of defining inertia considering CIGs in power systems.
where
- –
Hsys is the equivalent apparent inertia constant of the system [s];
- –
SB,i is the rated apparent power of ith SG [MVA];
- –
SB,j is the rated apparent power of jth CIG [MVA];
- –
HSG,i is the inertia constant of ith SG based on its own rated apparent power [s];
- –
HCIG,i is the virtual inertia of jth CIG based on its own rated apparent power [s];
- –
NSG is the number of SGs in the power system;
- –
NCIG is the number of CIG units in the power system.
The typical values of inertia constant vary based on the types of SGs: around 1.75 to 4.75 s for hydroelectric power plants, 2 to 10 s for thermal power plants, and approximately 4 s for nuclear power plants [
6].
The advent of WAMS enabled the derivation of the CoI frequency, offering a comprehensive view of the system’s frequency response to estimate disturbances resulting from production loss using the generator rotor swing equation [
27]. To apply the generator rotor swing equation to a multi-generator system, and the following specific mathematical manipulations as outlined in references [
28,
29], the following equation for the generator rotor swing can be formulated:
where
D represents the damping of the system.
Equation (2) is commonly known as the center of inertia swing equation per unit. As the focus of the paper lies on the early periods following a major disturbance, where the frequency deviation term is much smaller compared to the second term on the left side of the equation, this part of the equation can be neglected [
30]. Consequently, Equation (2) simplifies to
This equation links the active power deficit with the CoI RoCoF shortly after the onset of a generation unit outage, representing a large disturbance in the system. After the end of the transient process, which lasts about 2–5 s, it can be assumed that there is a unique frequency in the system—CoI frequency, which is a representation of the weighted average of the generator’s frequencies.
3. Materials and Methods
This research assesses the power system’s inertia through the application of MEMD, an element of the Hilbert–Huang Transform (HHT).
3.1. Multivariate Empirical Mode Decomposition (MEMD)
The fundamental approach of EMD involves separating the signal into natural IMFs [
31]. Upon obtaining the IMFs, the application of the HHT makes it possible to determine the amplitude, phase, and frequency of the present signal, enabling a time-frequency analysis of the observed phenomenon. This approach has been successfully utilized in analyzing the dynamic behavior of power systems [
32,
33,
34,
35]. In the end, the EMD process separates the signal into a specific number of IMFs and a residue. The total of all IMFs combined with the residual component enables the restoration of the original signal without any loss of data or alteration. IMFs possess distinct characteristics: a local equilibrium near zero, all peaks (or troughs) being higher (or lower) than zero, and the count of extreme points and zeros being either identical or differing by no more than one. The average of the envelopes formed by local maximums and those formed by local minimums is zero. Every IMF, regardless of being linear or nonlinear, embodies basic oscillations with an equal count of extreme points and crossings of the zero line.
where
xup signifies the upper envelope and
xlow indicates the lower envelope; the disparity between the original signal
x(
t) and the mean value of the signal envelope
m1(
t) results in
h1:
By iterating
k times,
h1k becomes an IMF:
When the specified criteria are fulfilled [
36],
h1k transforms into the initial IMF:
The original signal
x(
t) is reduced by the acquired IMF function, and subsequent IMFs are derived from the residual signals.
The iterative process concludes when one of the conditions is met: either the component
cn or the residue
rn diminishes to a value below a predetermined threshold, or when the residue
rn turns into a monotonic function, making it impossible to extract any further IMF functions. Regardless of whether the original signal has a zero mean value, the final residue may not be zero. In cases where the signal shows a tendency towards growth or decline, this final residue serves as an indicator of the signal’s overall trend. The original signal is obtained by summing all IMF functions and the residue [
36]:
An extended version of standard EMD, known as multivariate EMD (MEMD), is developed for multivariate data. As highlighted by [
37], MEMD exhibits properties such as coherence and a data fusion algorithm. In this approach, data are scrutinized within a p-dimensional domain, estimating the local p-dimensional mean by averaging multiple envelopes.
In the MEMD procedure, the first step is to generate a series of directional vectors,
K, by utilizing a point set on a p-dimensional hypersphere generated with a low-discrepancy Hammersley sequence. The procedure starts by initializing the residue of the p-dimensional signal as
r(
t) =
x(
t) and
i = 1. After that, the set of projections along each vector
K is obtained:
The next step is to identify the local maxima and minima within
by interpolating the local maxima and minima with a cubic spline. Oner then determines the average of the upper and lower envelopes by calculating their mean:
The subsequent phase is to update
r(
t) =
r(
t) −
Emean(
t) and repeat steps until a stopping criterion is met [
36]. The process involves extracting the
ith IMF denoted as
Emean(
t) and subsequently updating residual
r(
t) from the original signal
x(
t) as:
3.2. RoCoF Estimation Using MEMD
The replacement of traditional generation with inverter-based resources is gradually taking place. This makes the lack of rotational inertia common in modern power systems. This results in an increasing RoCoF after contingencies, potentially leading to frequency collapse. Precision in estimating RoCoF is vital for creating sophisticated operations and control methods in modern power systems, as RoCoF is a key indicator of the frequency, safety, and stability of these systems. Various approaches and papers describing RoCoF estimation methods can be found in the literature. In this paper, the MEMD approach is used to estimate RoCoF, the mathematical properties of which are presented in the previous chapter as well as in the references [
25,
37].
Following a disruption in the power system that causes an imbalance between generation and consumption, generators either decelerate or accelerate to adjust to the new situation. Despite individual generators slowing down at different rates (dΔωi/dt), which change throughout the process, the system as a whole slows down at a constant rate (dΔωc/dt). As synchronized forces act, damping the oscillation in the stable response, the frequencies of individual generators approach the frequency of the center of inertia. After a relatively short time (t = t1), of the order of a few seconds, all generators practically adopt the frequency values of the center of inertia, thereby reestablishing a unified frequency within the system. This feature of the power system allows the application of an advanced MEMD approach signal processing technique to be applied and used to assess the trend of system deceleration or acceleration in a newly emerging situation after a disturbance.
In this paper, it is shown through an illustrative example that by using the technique of empirical decomposition of the MEMD signal over frequency signals, it is possible to estimate the value of the rate of change of frequency and thus the value of the rate of change of the center of inertia frequency with high accuracy.
The first step requires access to the frequency signal from WAMS (PMU). Subsequently, the MEMD algorithm segregates these signals into several IMFs and residuals. The residuals, generated through the MEMD method, effectively capture the signal’s trend. It is demonstrated that these residuals closely align with the calculated center of inertia, making them well suited for estimating dfCoI/dt.
The extracted IMF is removed from the original signal
fi(
t), leading to the calculation of the signal residual for subsequent IMF functions:
r1 =
fi(
t) −
c1. The aggregate of all IMFs along with the residual constitutes the initial signal:
where
fi(
t) signifies the generator frequency,
cj(
t) stands for IMFs,
rn(
t) indicates a residual or a low-frequency trend, and n represents the overall count of IMFs.
In this context, research is specifically concentrated on accurately representing ωCoI(t) using rn(t) and examining its suitability for use in the evaluation of the center of inertia estimation.
Utilizing various iterations of EMD per signal, MEMD can produce the average modal function and residue across the complete signal set. This enables the concurrent processing of multiple signals, establishing a unified resolution encompassing all signals and their residual elements.
The simultaneous decomposition of all measured data from PMU happens with MEMD. It identifies scales shared among two or more signals. This unique alignment ability allows in-depth analysis across multiple signals. For each variable, MEMD offers IMFs and residuals separately. The combination of all modes and the leftover residual mirrors the initial signal. Finding local extremities within MEMD employs real-valued signal projections to form a multidimensional envelope. MEMD is an extended form of EMD that breaks down multiple data channels at once to create consistent IMFs.
Following the first stage of locating local extremes, the subsequent step involves matching the original data at those extreme positions to create multidimensional envelopes .
Compute the mean value by averaging across a collection of
k directional vectors:
The last step, besides checking the stopping criteria [
37], is the determination of the residual:
3.3. Inertia Estimation Using RoCoF
In this study, alongside evaluating RoCoF and CoI RoCoF using the MEMD approach, an estimation of the inertia constant of the power system will also be conducted using the mentioned method based on RoCoF estimations.
Let
dfi/
dt represent the locally estimated RoCoF at location (
i). Additionally, it is proposed that
dfi/
dt represents the residual obtained by empirically decomposing the synchronized frequency measurement signals gathered from the various nodes within the system (
i). The residue of the observed decomposed signal accurately describes the change of the center of inertia, making it suitable for estimating the rate of change of frequency of the center of inertia [
25,
38]. Assuming that the locally estimated RoCoF is an adequate approximation of the actual CoI RoCoF, the following can be written:
Given that the CoI RoCoF is directly related to the size of the disturbance, there is a concept to use this relationship to modify the estimation of inertia in response to varying conditions within the system. The MEMD approach is applied to the time series of frequency deviations following disturbances, where the residual indicates the trend of the analyzed signal. This should be effective for evaluating the actual CoI RoCoF (dfCoI/dt). The fluctuation in active power within the power system, such as a reduction or increase in load or generation, is denoted as ∆p. The MEMD estimation results of the frequency deviations represent the average gradient of the frequency on the observed time interval ((((x(i+1) − xi))/∆t), ∆t = 0.01 s). The sampling rate is 100 Hz and Δt represents the time interval between consecutive data points. This approach employs a single window, monitoring the frequency response immediately following a disturbance at t = 0.
Equation (17) derives the average frequency gradient across windows containing
M data samples. Each window spans a duration of (
M − 1)Δ
t. This approach calculates the average RoCoF, facilitating the estimation of the inertia constant:
Based on Equation (16), system inertia can be determined as:
where
f0 denotes base system frequency. Governor control timing significantly relies on the system’s inertia (
H) to manage frequency response before critical levels. High inertia ensures stable systems with low RoCoF; conversely, low inertia systems pose risks due to high RoCoF, leading to rapid frequency spikes triggering protection systems. Given the time-dependent nature of inertia related to intermittent converter-interfaced generation, estimating and monitoring these values is crucial.
4. Results
The applied approach has been validated through simulation on the IEEE 39 bus test system [
39]. Simulations are conducted on the IEEE 39 bus test system modeled in DIG SILENT Power Factory 2021 SP1 software (Gomaringen, Germany). It has been established that the generating buses are equipped with PMUs. In the
Section 4, the first application of the MEMD method for estimating RoCoF will be presented, confirmed through references [
25,
38].
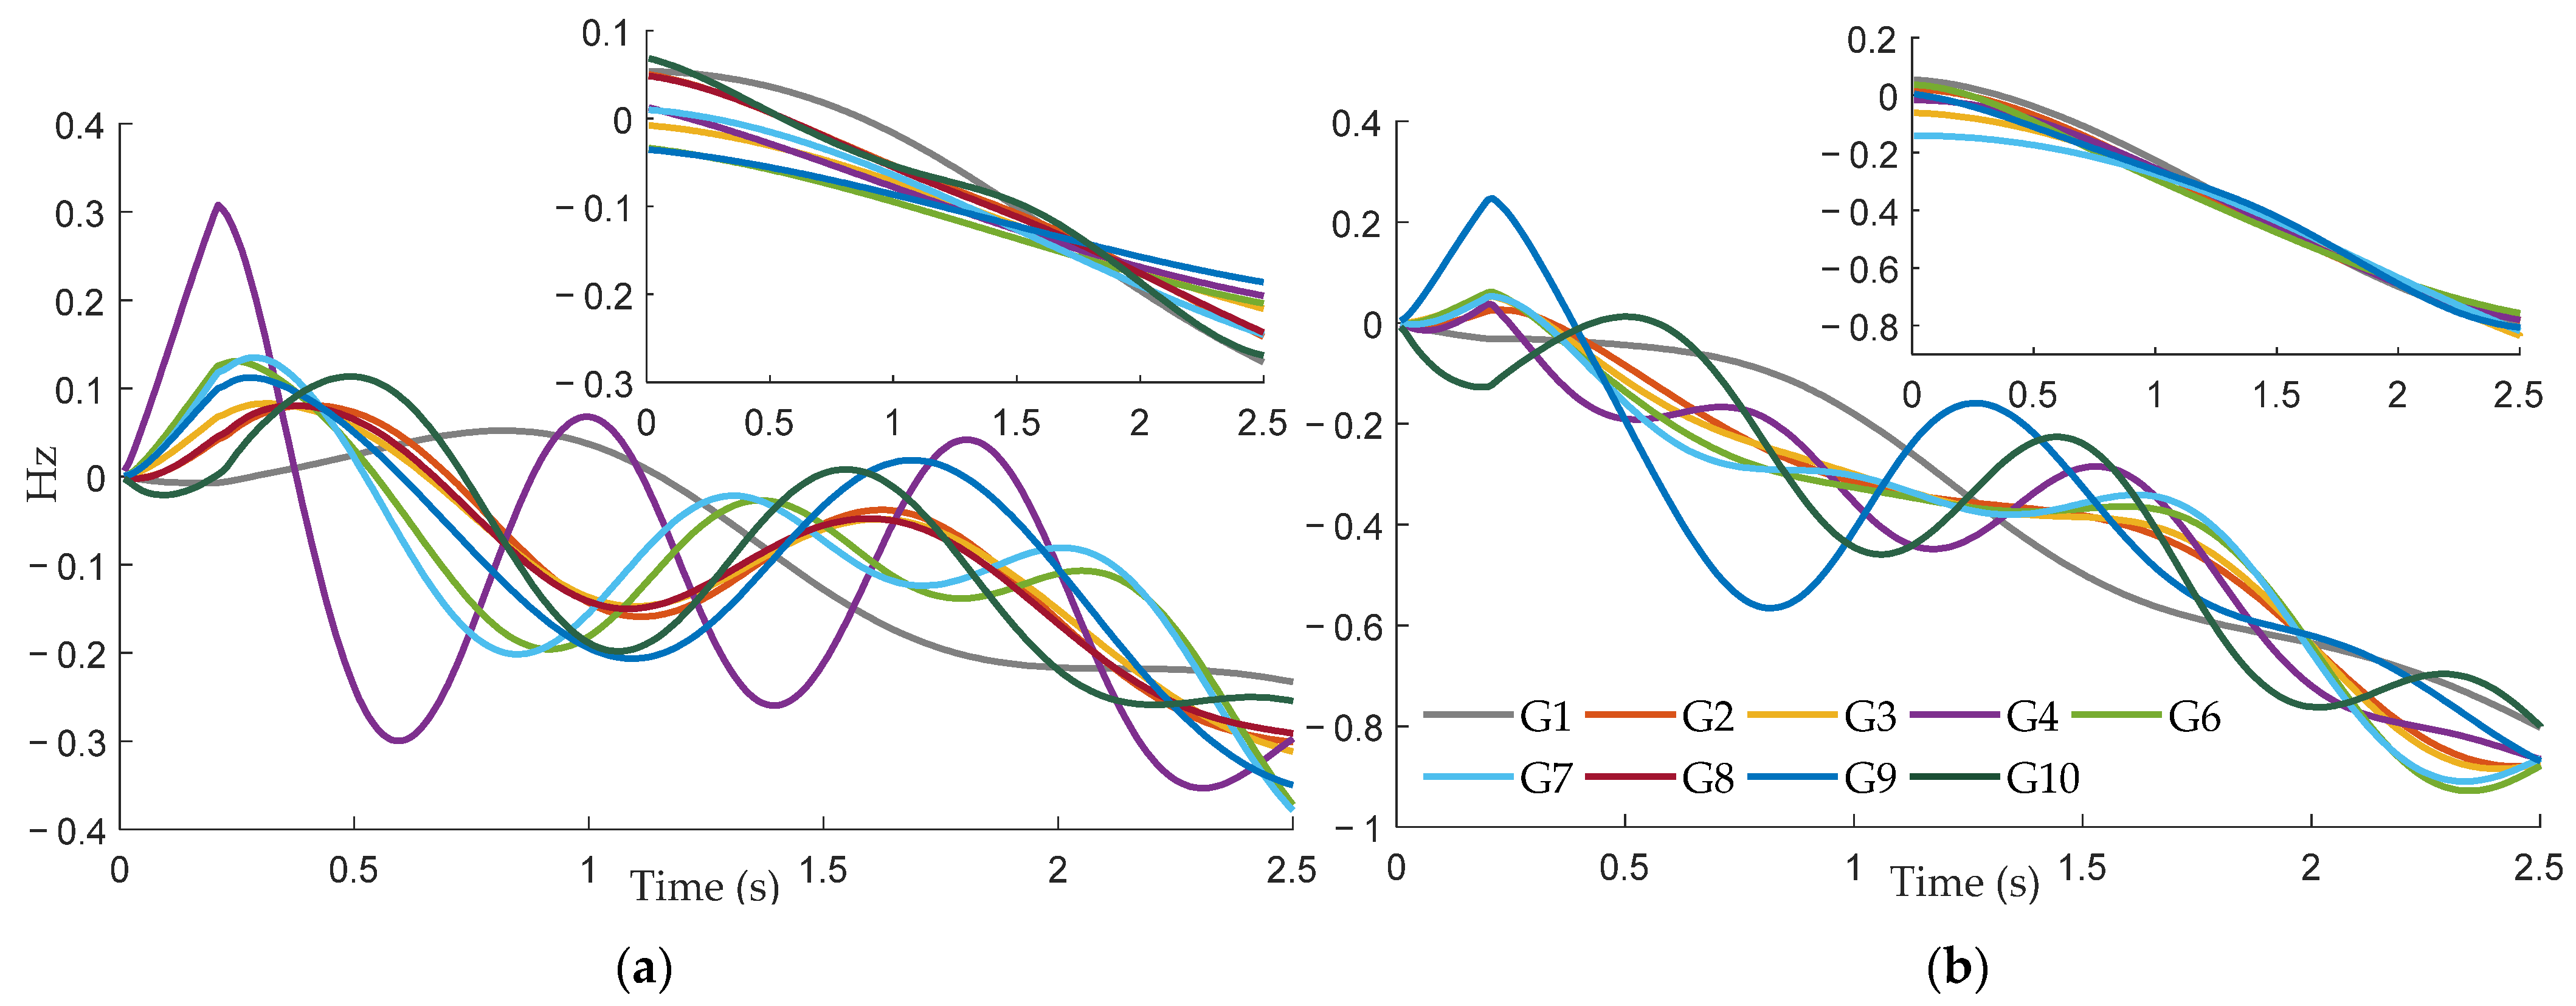
Figure 2 is designed to illustrate the dynamic response of operating generators following a specific disturbance scenario. The scenario entailed a three-phase short circuit occurring at bus 38 at a time instant of 0 s. This fault was subsequently cleared within 0.2 s. Concurrent with the fault clearance at 0.2 s, two generating units, namely generators G9 and G10, experienced an outage. The graph in
Figure 2 specifically focuses on depicting the speed deviation in Hz for the remaining operational generators in the aftermath of this disturbance. The presented speed deviation values are in terms of (Hz), following the imposed disturbance of 0.108 (p.u.). A disturbance in the power system can be caused by various factors, such as sudden changes in load demand, equipment failures, or faults in the transmission or distribution network. These disturbances can lead to imbalances between power production and consumption, resulting in fluctuations in the system frequency. This figure is crucial for understanding the impact of the simulated short circuit and the subsequent generator outages on the stability and performance of the power system.
The signals depicted in
Figure 2 underwent the MEMD algorithm for computing the CoI RoCoF. This research was explicitly focused on representing
ωCoI(
t) as
rn(
t), delineating the residual resulting from signal decomposition using the MEMD methodology.
Figure 3 showcases these residuals, the remains after implementing the MEMD approach on the signals depicted in
Figure 2.
By employing the MEMD algorithm, it is capable of generating an average pattern and average residuals from the collective set of signals. This approach facilitates the simultaneous analysis of multiple signals, thereby yielding a unified solution that encompasses all individual signals and their respective residuals.
This characteristic can be utilized to obtain an averaged residual. In
Figure 3, one can observe the curve depicted in black, representing the average modal function and residue across the complete signal set, which is utilized in this study to obtain CoI RoCoF. The gradient calculation or backward derivative was applied to this time series residual CoI using a calculation period of 0.01 s within an observed time of 2.5 s in PowerFactory ((((
x(i+1) −
xi))/∆
t),∆
t = 0.01 s). To confirm the accuracy of the applied approach for estimating CoI RoCoF, the calculation of the CoI RoCoF involves the known total system inertia and the imbalance of active power in the system following a disturbance, using Equation (18):
The formula for can be restated as follows. The reciprocal of the system’s total apparent power equals the sum of individual machine inertia constants multiplied by their respective rated apparent power . refers to the equivalent system’s apparent power, expressed in [MVA]; H is the system’s inertia constant, measured in [s]; and and are the rated apparent power and the inertia constant of the ith generator. Additionally, there are N generators in the system. Furthermore, 1080 [MW] denotes the generation power deficiency Δp, and f0 represents the nominal frequency in [Hz].
The results for the gradient calculation or backward derivative applied to the time series residuals of frequency deviation from generator terminals and residual CoI are presented in
Table 1. These calculations were performed using a calculation period of 0.01 s within an observed time of 2.5 s. In addition, the DigSILENT PowerFactory provides the rate of change of frequency. It calculates the RoCoF utilizing the backward derivative within the PowerFactory, employing the same calculation period and observed time duration for the assessment.
In addition, the outcomes from the MEMD analysis and the computation of
via DigSILENT were compared with the results generated by Equation (18). In order to statistically process the results, the mean square and mean absolute errors are calculated.
Table 2 shows the results for mean squared error and mean absolute error.
was set to −0.467 (Hz/s).
The error analysis conducted in this paper, encompassing mean square error and mean absolute error, offers fundamental insights into methodological accuracy. Nevertheless, the practical implications of these errors in power system operation and stability warrant further exploration. In practical scenarios, inaccuracies in inertia estimation could significantly impact the system’s frequency response and stability, leading to challenges in frequency control and potentially escalating to broader system instabilities. Future research should focus on detailed simulations and case studies to quantify the impacts of error margins on operational strategies, stability margins, and grid reliability.
Within the scientific research, an analysis is conducted on the percentage error between the calculated values of
using the MEMD method and calculations in the DigSILENT PowerFactory 2021 SP1 software in comparison to the actual computed value of
as expressed in Equation (18):
The result of the estimation error (%) are shown in
Table 3.
To validate the proposed approach for estimating the inertia of the electric power system, two cases were analyzed. The first case pertains to a system with dominant production using synchronous generators. Three experiments were simulated, comprising one medium and two large disturbance scenarios. For the medium scenario, an active power imbalance of 0.05 p.u. was set, while for large disturbances, active power generation-consumption differences of 0.1 (p.u.) and 0.108 (p.u.) were, respectively defined. The second case concerned the estimation of the electric power system’s inertia on a modified IEEE 39 bus test system with a share of electricity production from renewable energy sources (RESs). In addition, disturbances were simulated as in the previous case, but the analyses were conducted with a share of RES generation amounting to 10%, 15%, and 20%, respectively.
The residuals, obtained after applying the MEMD algorithm to PMU measurements of speed deviation at generator terminals following a simulated active power imbalance disturbance of 0.05 (p.u.) and 0.1 (p.u.), respectively, are depicted in
Figure 4.
If the magnitude of the disturbance is accurately known, it becomes possible to estimate the total system inertia. In addition, by applying the MEMD method to the speed deviation signals during disturbances, CoI RoCoF values are determined for all three simulated experiments. Knowing the value of CoI RoCoF and the imposed magnitude of disturbance using Equation (18), the inertia values of the power system were established. The results are presented in
Table 4. The table displays both the actual inertia values obtained by subtracting the share of inertia of the generating units that tripped, causing an imbalance in the active power in the power system. Additionally, the table also presents the error in percentages.
During another disturbance, different wind penetration levels were examined to assess the impact of renewable integration on inertia distribution. The results, depicted in
Figure 5, highlight the outcomes across various wind penetration percentages under a scenario of active power imbalance of 0.05 (p.u.). The CoI location undergoes a significant excursion because of the installation of wind plants. For validating the simulation model, the effects of wind generation on system frequency responses are analyzed by modeling diverse levels of renewable generation penetration. The selected penetration rates include 10%, 15%, and 20%, respectively.
The MEMD approach was employed to analyze the frequency response data depicted in
Figure 5. It identified the average modal function and residue across the entire signal set. The residue predominantly represents the slowing trend of the power system following the imbalance in active power.
The observed trend illustrates a substantial decrease in the system’s frequency response as the penetration rate of renewable generation increased. For instance, at a 10% renewable penetration rate, the RoCoF measured 0.242 Hz/s. This value escalated to 0.235 Hz/s with a 15% penetration scenario and reached 0.258 Hz/s with a 20% share of RESs. A notable increase in RoCoF is evident, particularly at the 20% RES penetration level, compared to scenarios without renewable generation, where the CoI RoCoF value amounted to 0.2 Hz/s.
The nadir frequencies were 58.57 Hz, 58.79 Hz, and 59.06 Hz for 15%, 10%, and 20% renewable penetration, respectively. Furthermore, there was a significant drop of 0.48 Hz observed at nadir frequencies. These outcomes emphasize the necessity for the precise estimation and distribution of inertia, appropriate assessment of inertia requirements, and the implementation of additional strategies to mitigate the issue of declining frequency response, especially in systems with higher RES penetration levels.
Following the previously outlined methodology, considering the active power imbalance per unit (p.u.) and the CoI RoCoF using Equation (18), the inertia values of the power system were estimated depending on the level of RES penetration.
Table 5 outlines the results.
A comparative analysis was conducted with the methodology outlined in the research paper [
40]. This approach is notable for its use of data-driven techniques, the application of system identification for model estimation, and the novel use of frequency gradient mapping for inertia extraction. The methodology emphasizes the importance of accurate inertia estimation in power systems with significant renewable energy penetration. Comparative analysis focuses on the methodologies and outcomes of both approaches. Despite the distinct approaches employed, the results presented in this paper align closely with the findings of the referenced study, especially in the context of inertia estimation in power systems heavily reliant on renewable energy sources. This correlation not only validates the presented approach but also reinforces the reliability of research outcomes. The consistency in results between the two studies indicates that the proposed approach yields satisfactory and comparably accurate outcomes in terms of inertia estimation within power systems. Thus, research contributes a robust and dependable method for inertia estimation in the evolving landscape of power systems, further establishing the potential and applicability of the approach in real-world scenarios. Additionally, the table also presents the error in percentages according to actual values of inertia.
Figure 6 displays comparisons between actual and estimated inertia constant values. The technique successfully estimates the inertia constant for both simulated scenarios, one without RES penetration and the other with RES penetration.
5. Discussion
This study introduced an approach designed for systems with the integration of converter-interfaced generation to calculate the inertia constant, focusing primarily on accounting for the impact of frequency response dispersion. This discussion centers on the working hypotheses:
According to the outcomes of the IEEE 39 bus test system simulation, when the distribution of inertia becomes more uneven, there is a possibility of the RoCoF being excessively restricted within the low-inertia systems.
The proposed method introduced a decomposition technique MEMD for extracting low-frequency components from the signal and signal trends. The MEMD method was applied to time series data of frequency deviation following disturbances. The resulting residual indicates the pattern of the signal under analysis and is expected to be effective in evaluating the RoCoF. The residue primarily signifies the decreasing trend in the power system after an active power imbalance. This is supported by the results obtained for both the mean square error and mean absolute error, with the mean square error calculated at 5.30659 × 10⁻⁵ and the mean absolute error at 0.00538.
The MEMD can generate the average modal function and residue for the entire signal set, facilitating the simultaneous processing of multiple signals and providing a comprehensive resolution covering all signals and their residual components. This simultaneous decomposition of PMU measurement data with MEMD identifies common scales among various signals, enabling thorough analysis across multiple signals. This characteristic is utilized to resort to estimating the CoI RoCoF. The MEMD estimation results of the frequency deviations represent the average gradient of the residual representing the center of inertia frequency on the observed time interval ((((x(i + 1) − xi))/∆t), ∆t = 0.01 s). During the estimation of CoI RoCoF, errors ranging from 0.42% to 1.35% were identified, depending on the imposed imbalance in active power. For an imbalance of 0.108 (p.u.), a percentage error of 0.57% was identified in estimating the CoI RoCoF. Such low values of percentage errors indicate a promising potential for applying the MEMD approach to estimate CoI RoCoF in modern power systems.
When accurately known disturbance magnitudes are present, estimating the total system inertia H becomes feasible. Additionally, when the MEMD method is applied to speed deviation signals during disturbances, CoI RoCoF values are determined for simulated experiments. Knowledge of the CoI RoCoF value and the imposed disturbance magnitude allows the establishment of the power system’s inertia constant. The calculated percentage errors of the estimated inertia constant compared to the actual inertia constant ranged from 0.92% to 3.03%.
To validate the simulation model, the impact of wind generation on system frequency responses was analyzed. This involved modeling various levels of renewable generation penetration, specifically focusing on penetration rates of 10%, 15%, and 20%, respectively. The aim was to understand how different levels of renewable energy integration affect the system’s frequency responses. The frequency response of the system showed a notable decrease as renewable generation penetration increased and there was a significant increase in the RoCoF compared to scenarios without renewables. Additionally, there was a considerable drop in nadir frequency with wind generation increase. In these conditions, the inertia constant of the system was estimated using the MEMD approach, and the percentage errors of the estimation were recorded. The errors ranged from 0.57(%) to 12.6(%). These results emphasize the advantage of using the MEMD approach for precise inertia estimation and allocation. It highlights the importance of assessing inertia requirements accurately and implementing strategies to mitigate the decline in frequency response, particularly in systems with increased levels of renewable energy penetration.
It is crucial to emphasize the significant importance of effectively monitoring, controlling, and managing the power system, particularly in scenarios involving the integration of converter-interfaced generation, especially during large system disturbances. To adequately respond to imposed changes, understanding the system and accurately predicting key parameters such as the inertia constant is essential. Therefore, the prediction process today represents a significant and intricate task, requiring reliable and relevant input data, as well as a thorough analysis and differentiation of the parameters within predictive models that have the most significant impact on the outcome. The future modernization of power systems will rely on predictions of system parameters critical for efficient system operation in conditions dominated by renewable energy generation.
If the approach presented in the paper considered solar or hydro energy, the dynamic inertia estimation of the power system could change. Solar and hydropower sources have different characteristics compared to traditional sources. Solar energy, being intermittent and dependent on weather conditions, could introduce greater variability and uncertainty in the inertia estimation process. Conversely, hydroelectric systems share similarities with traditional power plants in terms of mechanical inertia. Therefore, when integrating solar or hydro resources, adjustments in the modeling approach and stability assessment are crucial. These adjustments must account for the unique operational behaviors and characteristics of solar and hydro energy sources, which significantly differ from conventional generation methods. Future work is essential to underscore the importance of a tailored approach in system modeling and stability evaluation, particularly in the context of the non-dispatchable and intermittent nature of renewable resources. This nuanced understanding is essential for developing effective strategies for grid management and policy implications, especially in relation to inertia and frequency regulation in a renewable-dominant energy landscape.
Adapting and expanding the MEMD/RoCoF methodology for modern power systems involves an approach that acknowledges the unique characteristics of various generation types and the evolving nature of power systems. By integrating more diverse data sources, such as those from renewable energies like solar and wind, and leveraging real-time data analytics, the methodology becomes more robust in handling the variability and intermittency of these sources. Incorporating advanced forecasting techniques enhances the system’s ability to anticipate and respond to disturbances or inertia changes. This approach requires scalability and flexibility to manage complex and large power systems and a collaborative framework among stakeholders for effective data sharing and decision-making. Such an approach ensures that the MEMD/RoCoF methodology remains relevant and effective in the face of the dynamic challenges posed by modern power systems. To adapt and expand the MEMD/RoCoF methodology for diverse power system configurations and challenges, it is necessary to enhance the MEMD model to better handle the variability and intermittency of renewable energy sources like wind and solar. Also, real-time data from various power generation sources can be used to improve the accuracy and responsiveness of the RoCoF calculations. It is essential to ensure that the methodology is scalable to handle large and complex power systems, and flexible enough to adapt to new technologies. By focusing on these areas, the MEMD/RoCoF methodology can be effectively adapted to meet the evolving challenges and configurations of modern power systems. To effectively integrate these methods into the standard operational practices of power system operators, and to adapt existing infrastructure and regulatory environments, it is essential to establish protocols for using MEMD in system operations. These protocols should align with current industry standards and practices. Additionally, it is necessary to adapt existing infrastructure to support the integration of converter-interfaced generation and the application of MEMD, which may involve software and hardware upgrades. Furthermore, initiating pilot projects to test and demonstrate the effectiveness of these methods in real-world scenarios is crucial. Our future research is based on implementing forecasting models that predict potential system disturbances or inertia changes, enabling operators to proactively manage system stability.


 ,
, 


